1. Introduction
Maritime traffic represents a fundamental human activity which entails the presence of approximately 600,000 vessels navigating daily on the world seas and with different purposes related to fishing, travel, tourism, military or mercantile business. Several types of illegal maritime traffic are nowadays considered for dedicated observations. Migrant flow exploitation, unauthorized fishing and environmental pollution are a few examples of the issues that are related to current illegal ships’ traffic. Existing monitoring tools (Automatic Identification System
https://en.wikipedia.org/wiki/Automatic_identification_system) based on the active collaboration from navigating vessels turn out to be intrinsically unreliable since the data can be easily counterfeited by malicious users.
To tackle these issues, imaging data collected by remote sensing systems embedded in air/spaceborne platforms may be profitably employed [
1]. Indeed constellations of imaging satellites currently rotating on earth-centred orbits provide daily images of marine areas with resolutions that are sufficiently large to provide meaningful information about navigating ships. In particular Synthetic Aperture Radar (SAR) sensors return detailed images, in the best case with resolution approximating 1 m.
Indeed at large resolution (e.g., CosmoSky-Med–CSK) the wave perturbations generated by the ship body passage through the water are visible and can be exploited to describe in detail the vessel dynamics. In particular the wake pattern generated by the passage of the ship on the water surface, can be analysed and employed to estimate the heading and the velocity of the moving vessel.
The input data that will be mainly considered in the following, consist of the output data coming from a ship detection module applied to a SAR map. A typical ship detection algorithm for SAR imagery implements an adaptive thresholding strategy based on a Constant False Alarm Rate (CFAR) approach [
2]. Basically a pixel is associated to a vessel if its corresponding intensity exceeds a threshold value, which depends on the local statistical properties of the background clutter. This approach is adaptive since the local statistical parameters are estimated from scratch each time a new candidate vessel is considered. Finally the output of the ship detection stage will be represented by a small patch cut out of the original SAR map, centred on a candidate vessel, supplied with relevant information such as the ship centroid coordinates and a first approximated ship geometry. Ideally this procedure ensures that the small output patch will contain the main body of the ship and, to a certain extent, its surrounding auxiliary features, more or less visible depending on the specific resolution of the sensor.
The next sections concern a detailed explanation of the signal processing procedures implemented to detect ship wakes in SAR maps and extract as much information as possible about the kinematics of the ship. Experimental results obtained by applying the described procedures to real data are presented, followed by a discussion of the potential developments.
2. The Wake System
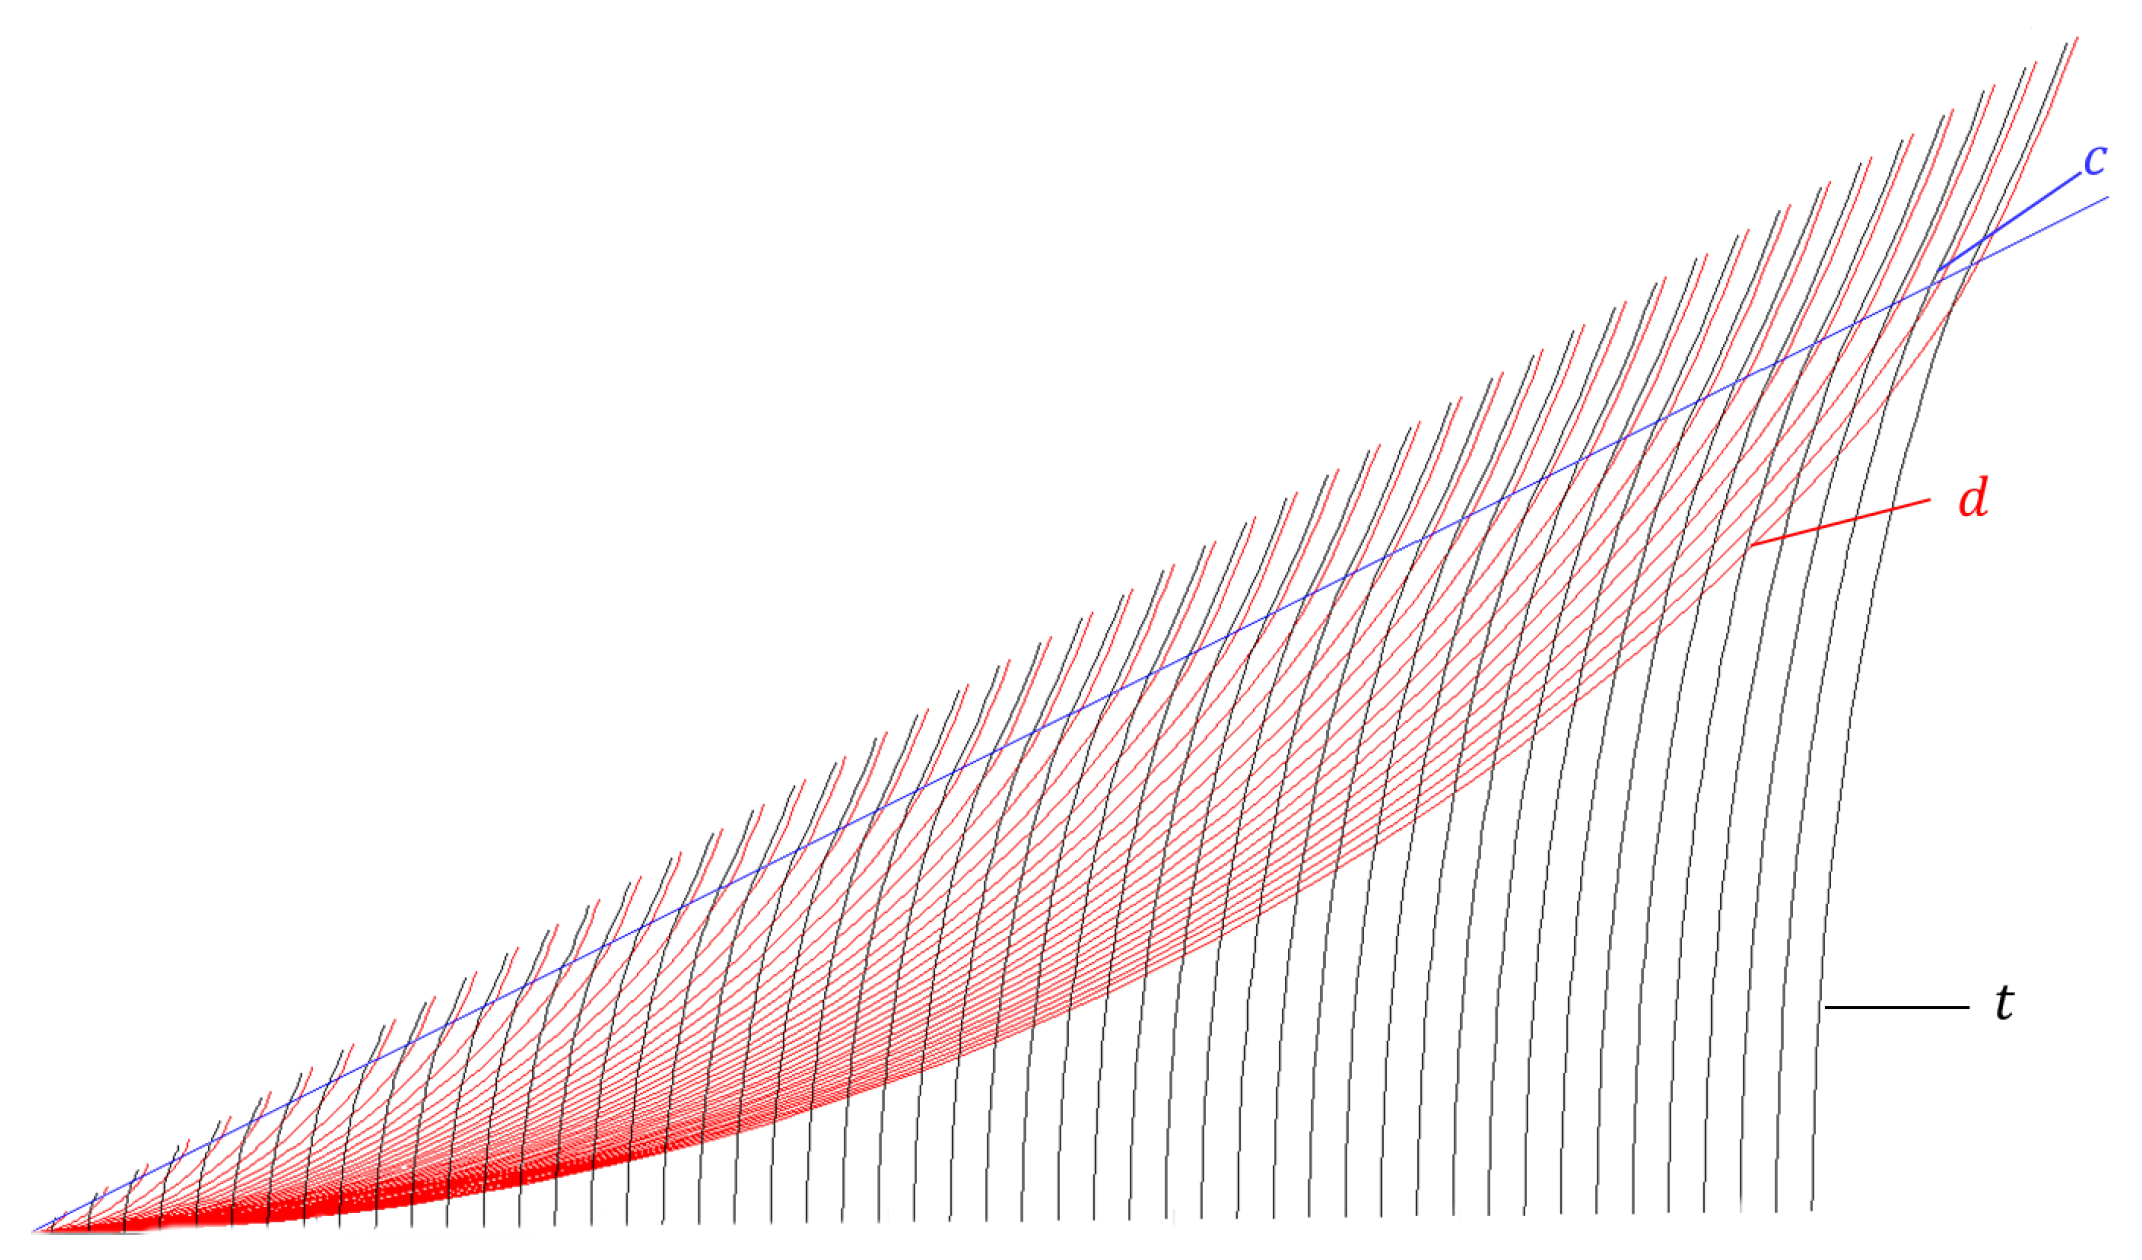
An object moving on the water surface at constant heading and speed, generates a system of waves that is made up of divergent and transverse components (diagram in
Figure 1 shows the crests profiles for a generic wake pattern). Within a certain range of velocities (from a few up to tenths of km/h) and for a variety of vessels’ typologies with different hull dimensions, all the generated wake patterns have identical macroscopic attributes, such as the angular aperture between the different wake components, but differ in terms of the spatial frequencies of the generated oscillations, which depend on the ship velocity.
A wake pattern in a SAR map is usually observed as the composition of three macro-structures that develop along linear directions: (i) a central turbulent strip, usually appearing as two collinear lines, a bright one next to a dark one, behind the vessel, with the same orientation of the vessel’s heading and (ii) two linear bright stripes, located approximately at the wake boundaries, about 19.47 with respect to the central turbulent wake, in the so-called cusp wave regions of the wake.
To the purpose of the work described in this document the analysis of the wake will focus on (i) the detection of the linear envelopes of the wake to estimate the ship heading; (ii) the estimation of the ship velocity by exploiting the causality with the azimuth shift effect occurring in SAR mapping or, as an alternative, the spectral analysis of the cusp waves, whose oscillation properties are also related to the kinematics of the ship.
3. Wake Detection
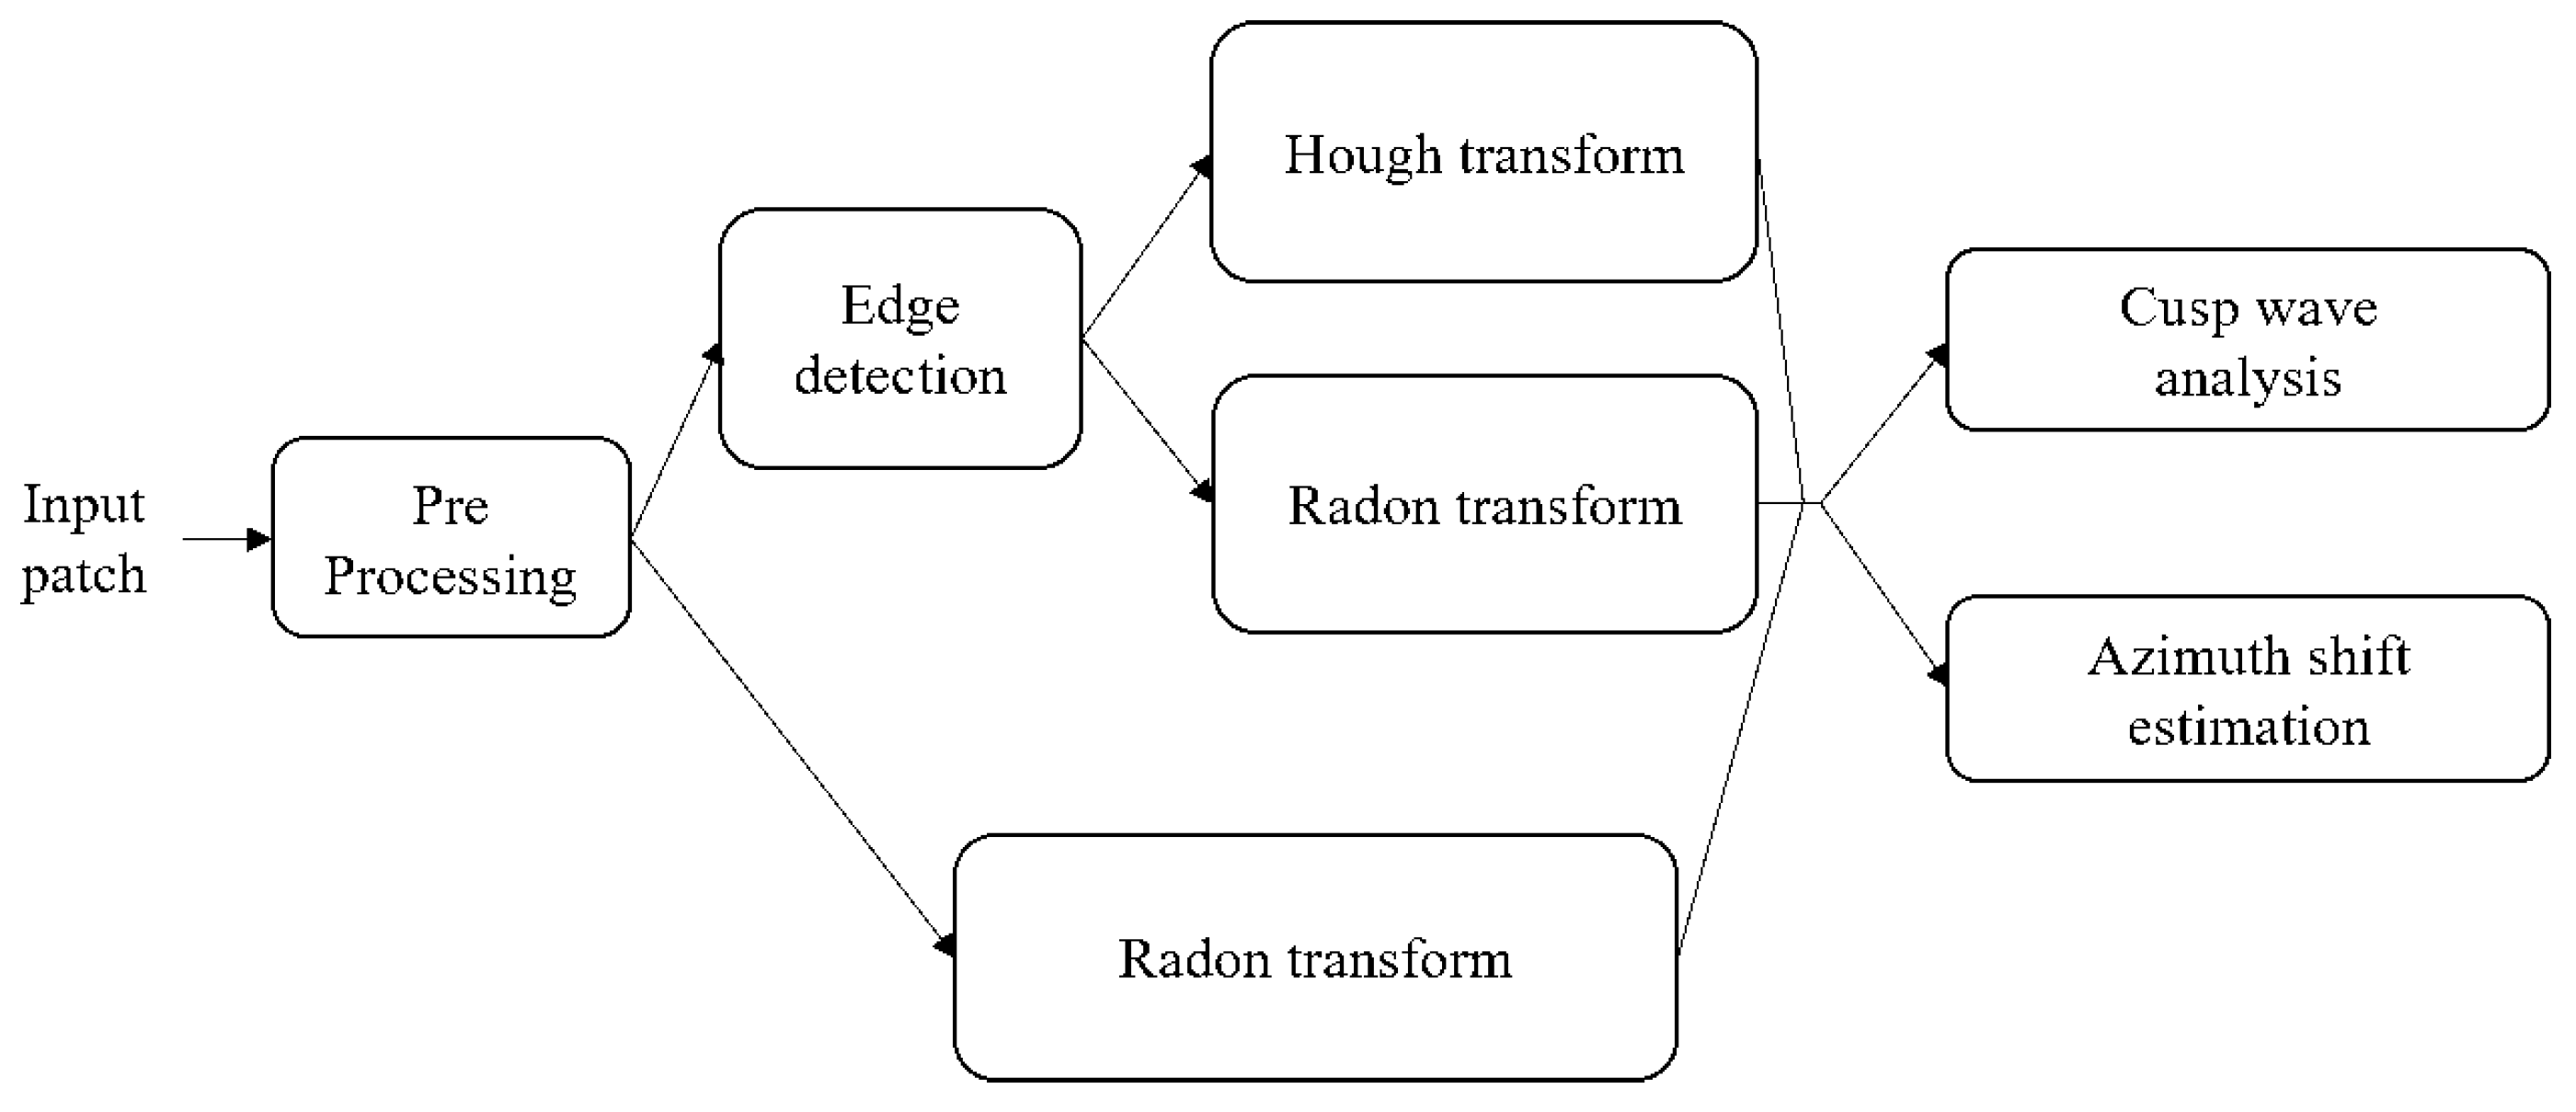
To pursue the aforementioned goals, the strategies discussed in this paper may follow alternative approaches (
Figure 2). The first processing steps concern the detection of the wake pattern, by means of line detection algorithms, while the final stages of the processing pipeline concern the joint analysis of the wake and the ship, in order to estimate the ship velocity. In the following sections the most important steps of the processing chain are discussed.
3.1. Pre-Processing
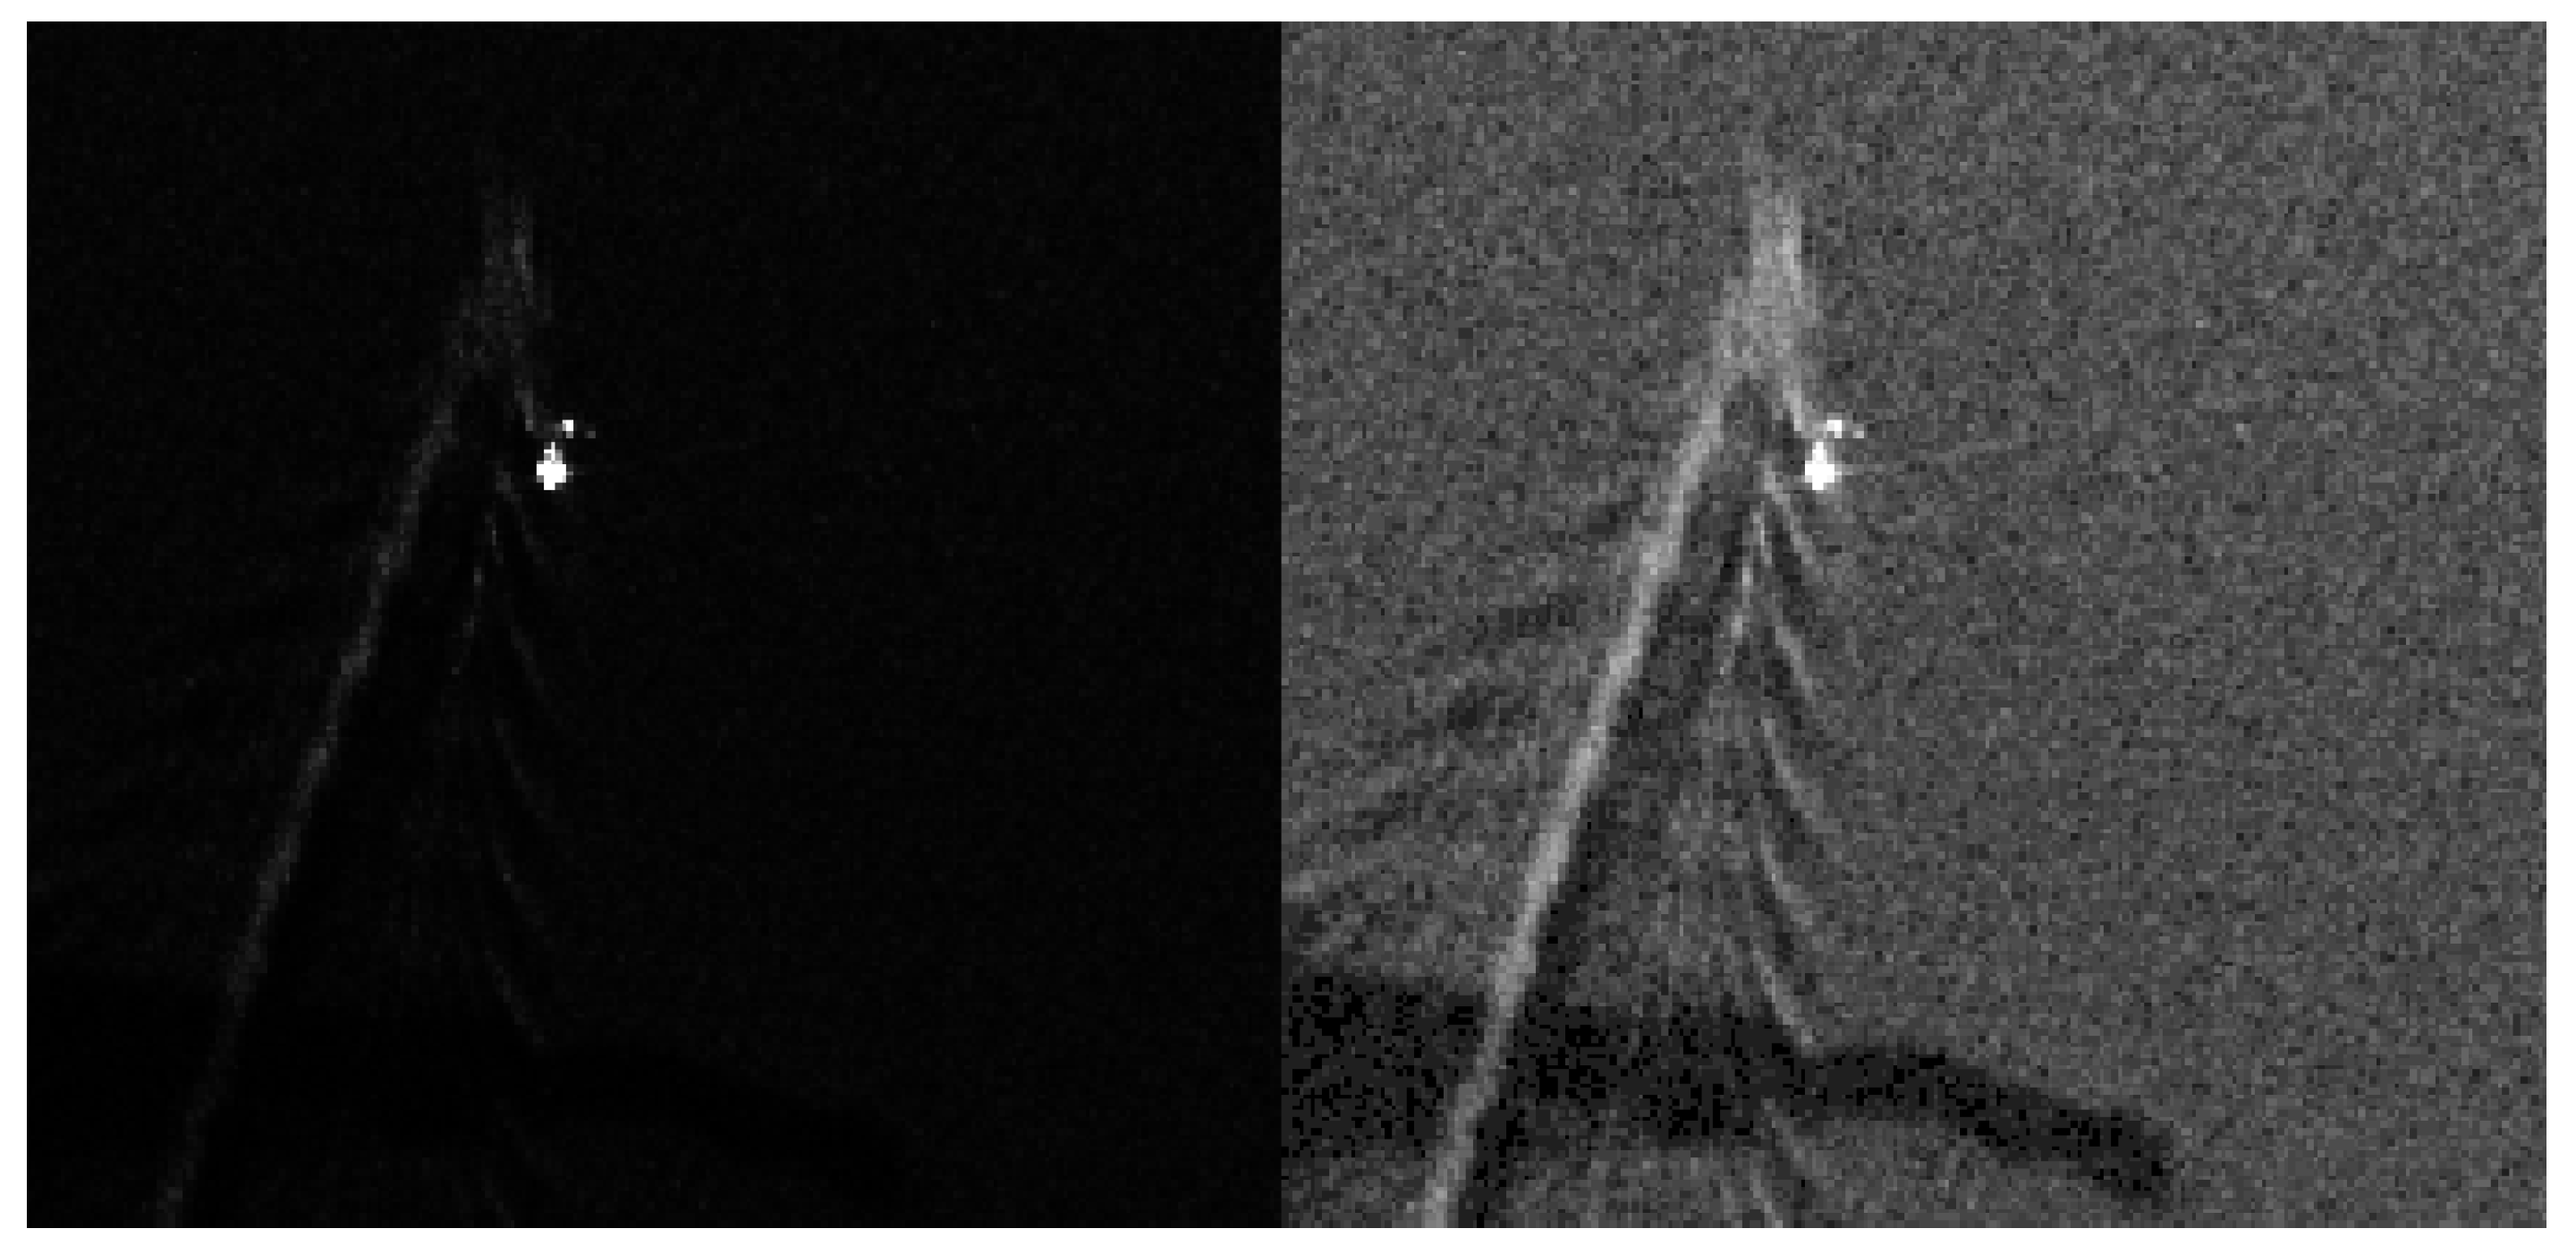
First the raw captured signal can be enhanced by applying basic intensity transformation procedures, such as gamma correction (see [
3]) and speckle noise reduction. If the raw SAR image histogram is compressed within a narrow range of values (as in the case of the CSK maps shown in this paper), this enables to expand the pixels’ intensity range and to reduce the speckle noise intensity in the data (
Figure 3).
After that the image is surveyed to assess the presence of linear subsets of pixels. This is pursued by exploiting line detector procedures, based on an edge linking approach.
3.2. Line Detection by Hough Transform
Line detector algorithms are usually based on the transformation of the signal from a starting spatial coordinates domain to its representation in a curve parameters space. For example the curve detection process can be based on a transformation that maps pixels lying on the sought curve in the original image to curves in the parameter space. In the spatial domain it is naturally expected that points belonging to a generic curve, univocally defined by a set of parameters, will map in the parameter space to curves that cross in the point with coordinates given exactly by the curve parameters.
This is the case of the Hough transform [
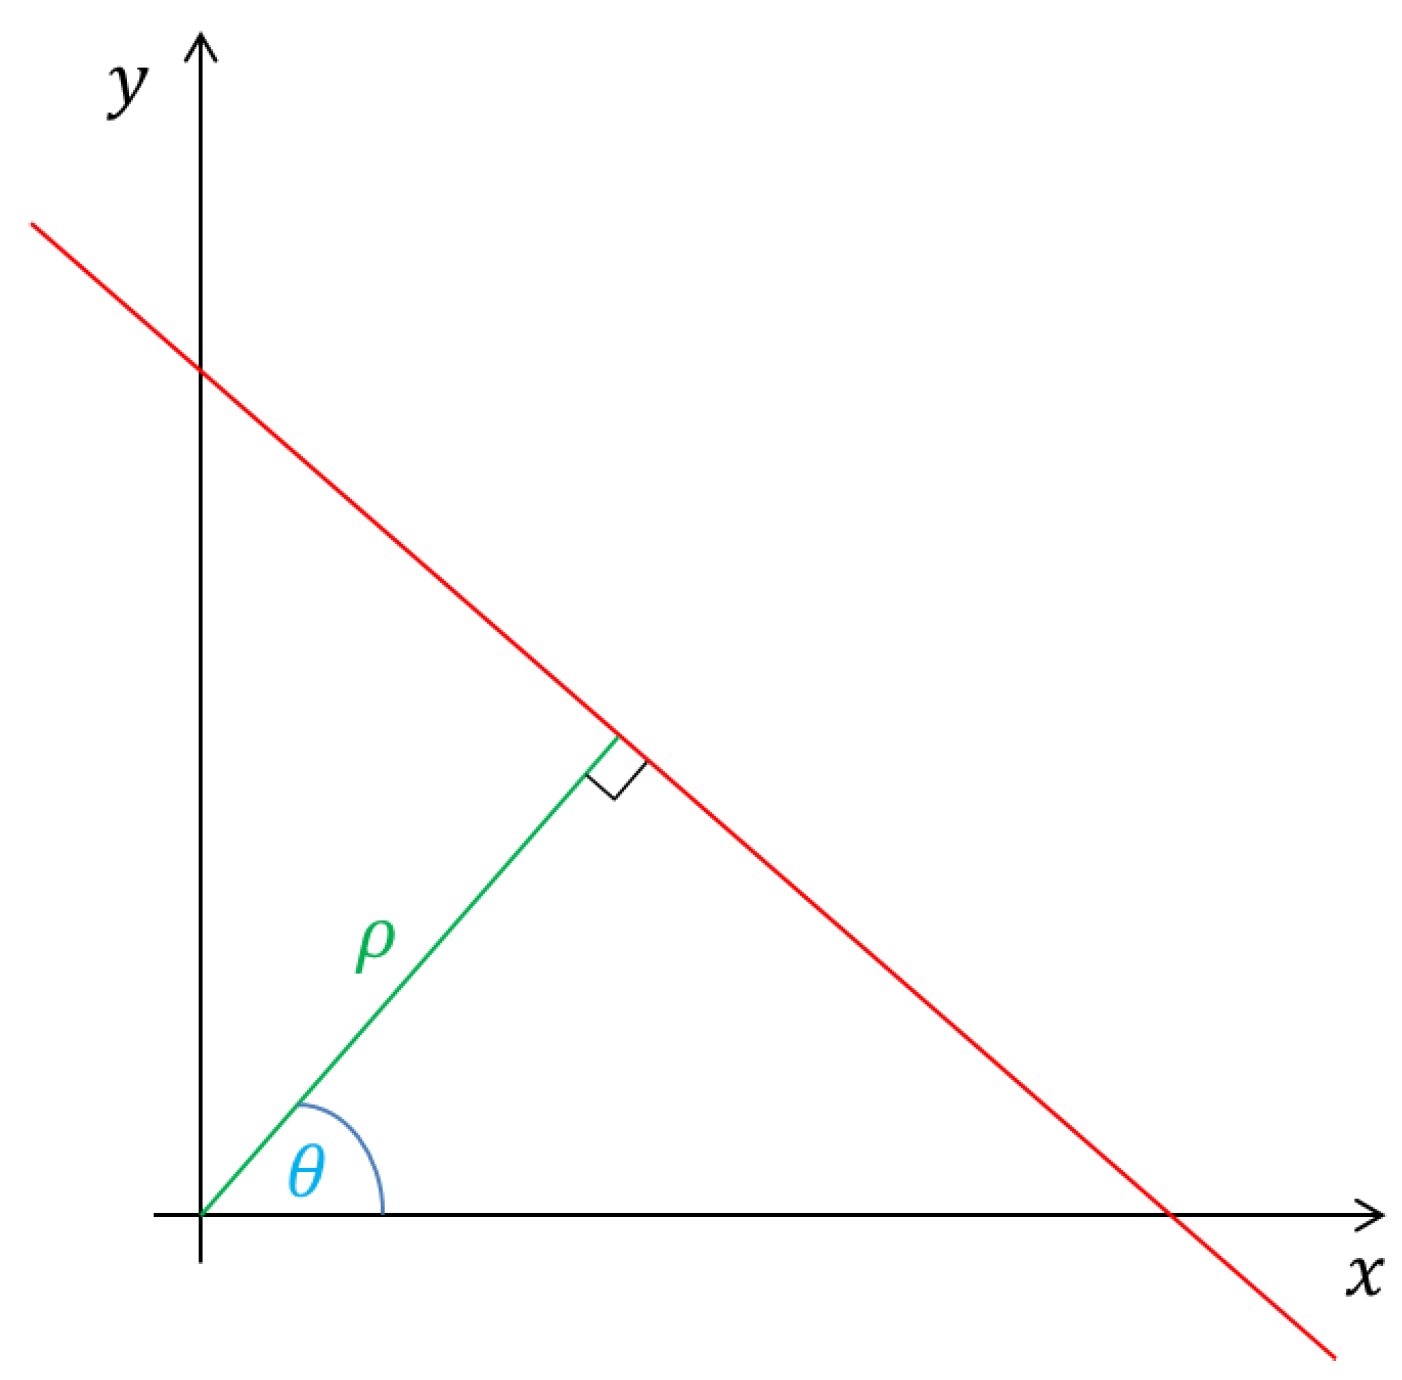
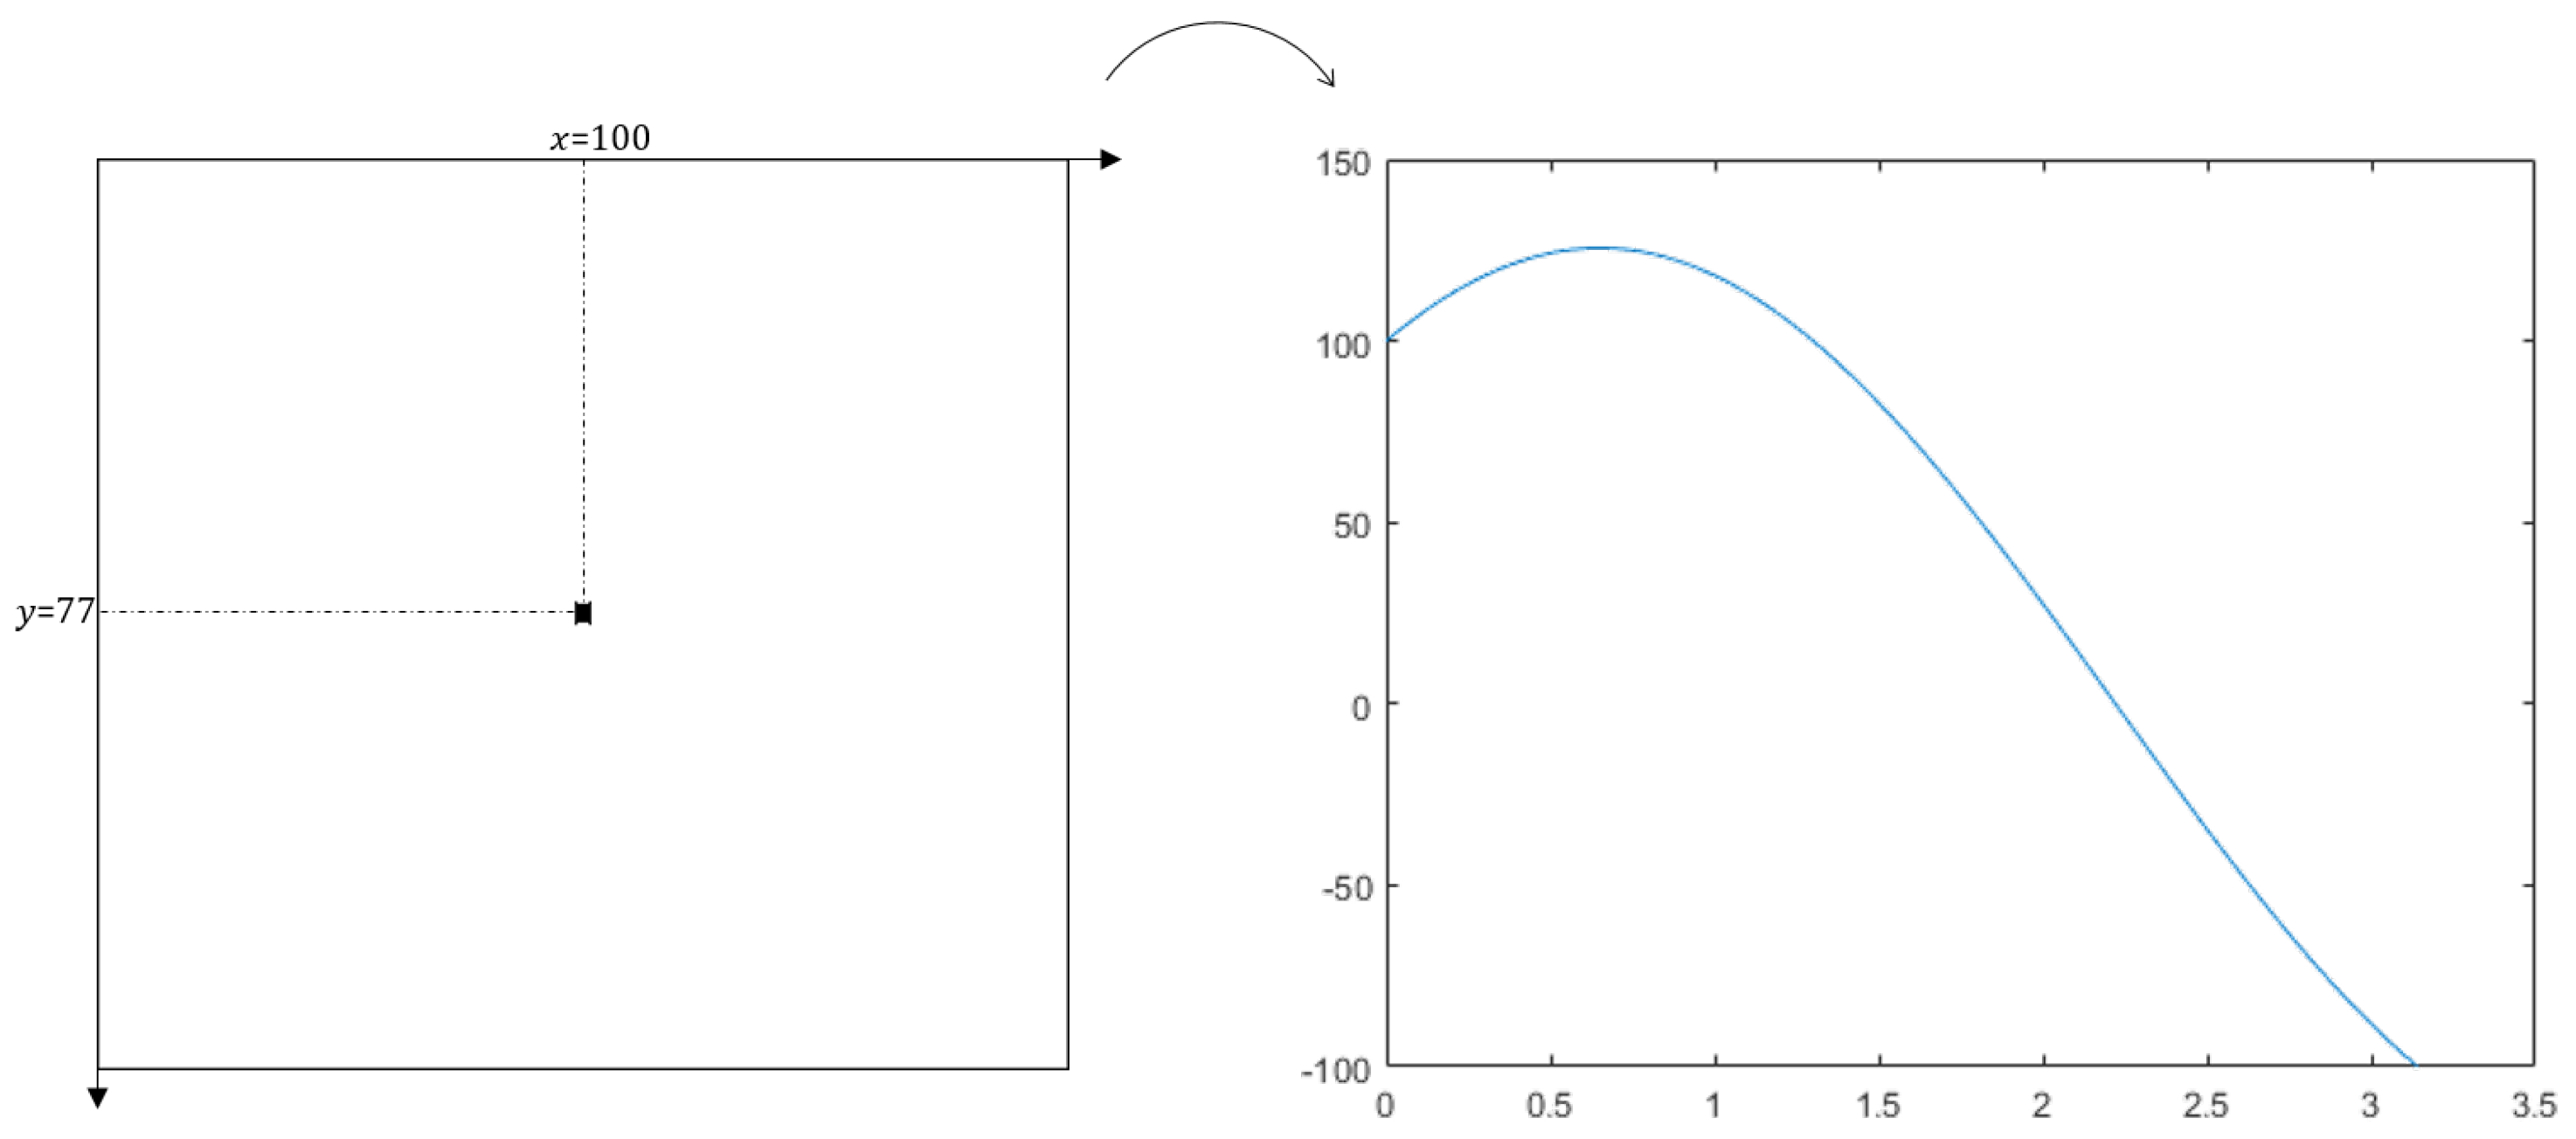
4]. Each pixel located at
on a linear segment in a given binary image (e.g., the output of an edge detector) can be mapped to a sinusoidal curve (
Figure 4) in the parameter space through:
The Hough transform is defined as the number of times the sinusoidal curves cross through a generic point in the parameter space, identified by the polar coordinates
(
Figure 5).
N pixels located on a line in the starting image are mapped to the same amount of sinusoidal curves in the transformed domain. The transformed curves intersect
N times in the same point, piling up to a peak with amplitude value
N. Hence, the detection of a curve is implemented as the maximization of the transformed function. Peaks are expected at those points in the parameter space that are related to curves actually appearing in the starting image.
3.3. Line Detection by Radon Transform
An alternative implementation of a line detector exploits the Radon transform. Given an image and its 2D representation
, the associated Radon transform is defined as
where
have been defined in
Figure 5.
In case the input data is an image representing points located on a linear segment, computing the integral in Equation (
2) returns a peak value in the parameter space, located at coordinates
corresponding to the line parameters. Generally speaking on the Radon transform computation, there is no constraint for what concerns the number of image intensity levels, but focusing on binary images, the Radon based line detector turns out to be equivalent to the Hough based line detector.
4. Velocity Estimation
4.1. Velocity through Azimuth Shift Processing
The representation of moving objects in SAR remote sensing is affected by azimuthal shifting. This consists of a distorted positioning of the moving vessel, which appears spatially disconnected from its wake by a number of pixels proportional to the radial (range direction) component of the velocity. If
R is the range radar-to-the-vessel,
V is the satellite velocity and
is the radial velocity of the vessel, then the cross-range displacement
observed in the SAR map is given by [
5]:
4.2. Velocity through Cusp Wave Processing
If a point disturbance is propagating along a straight line on the water surface, at constant velocity
v, hydrodynamics implies that along the wake component representing the cusp boundary, a plane wave oscillation has to be observed. The wave crests in the cusp wave are located at equidistant points along the directions
19.47
w.r.t. the turbulent direction [
6]:
In particular the difference between consecutive crest ranges represents an estimator of the wavelength value
, and is proportional to the ship’s speed through:
where
g is the gravity field intensity. The former relationship can be inverted to estimate the vessel velocity. Hence the problem of inferring the ship velocity from a SAR map becomes that of estimating the
of the cusp wave through processing its corresponding wake pattern.
5. Experimental Results
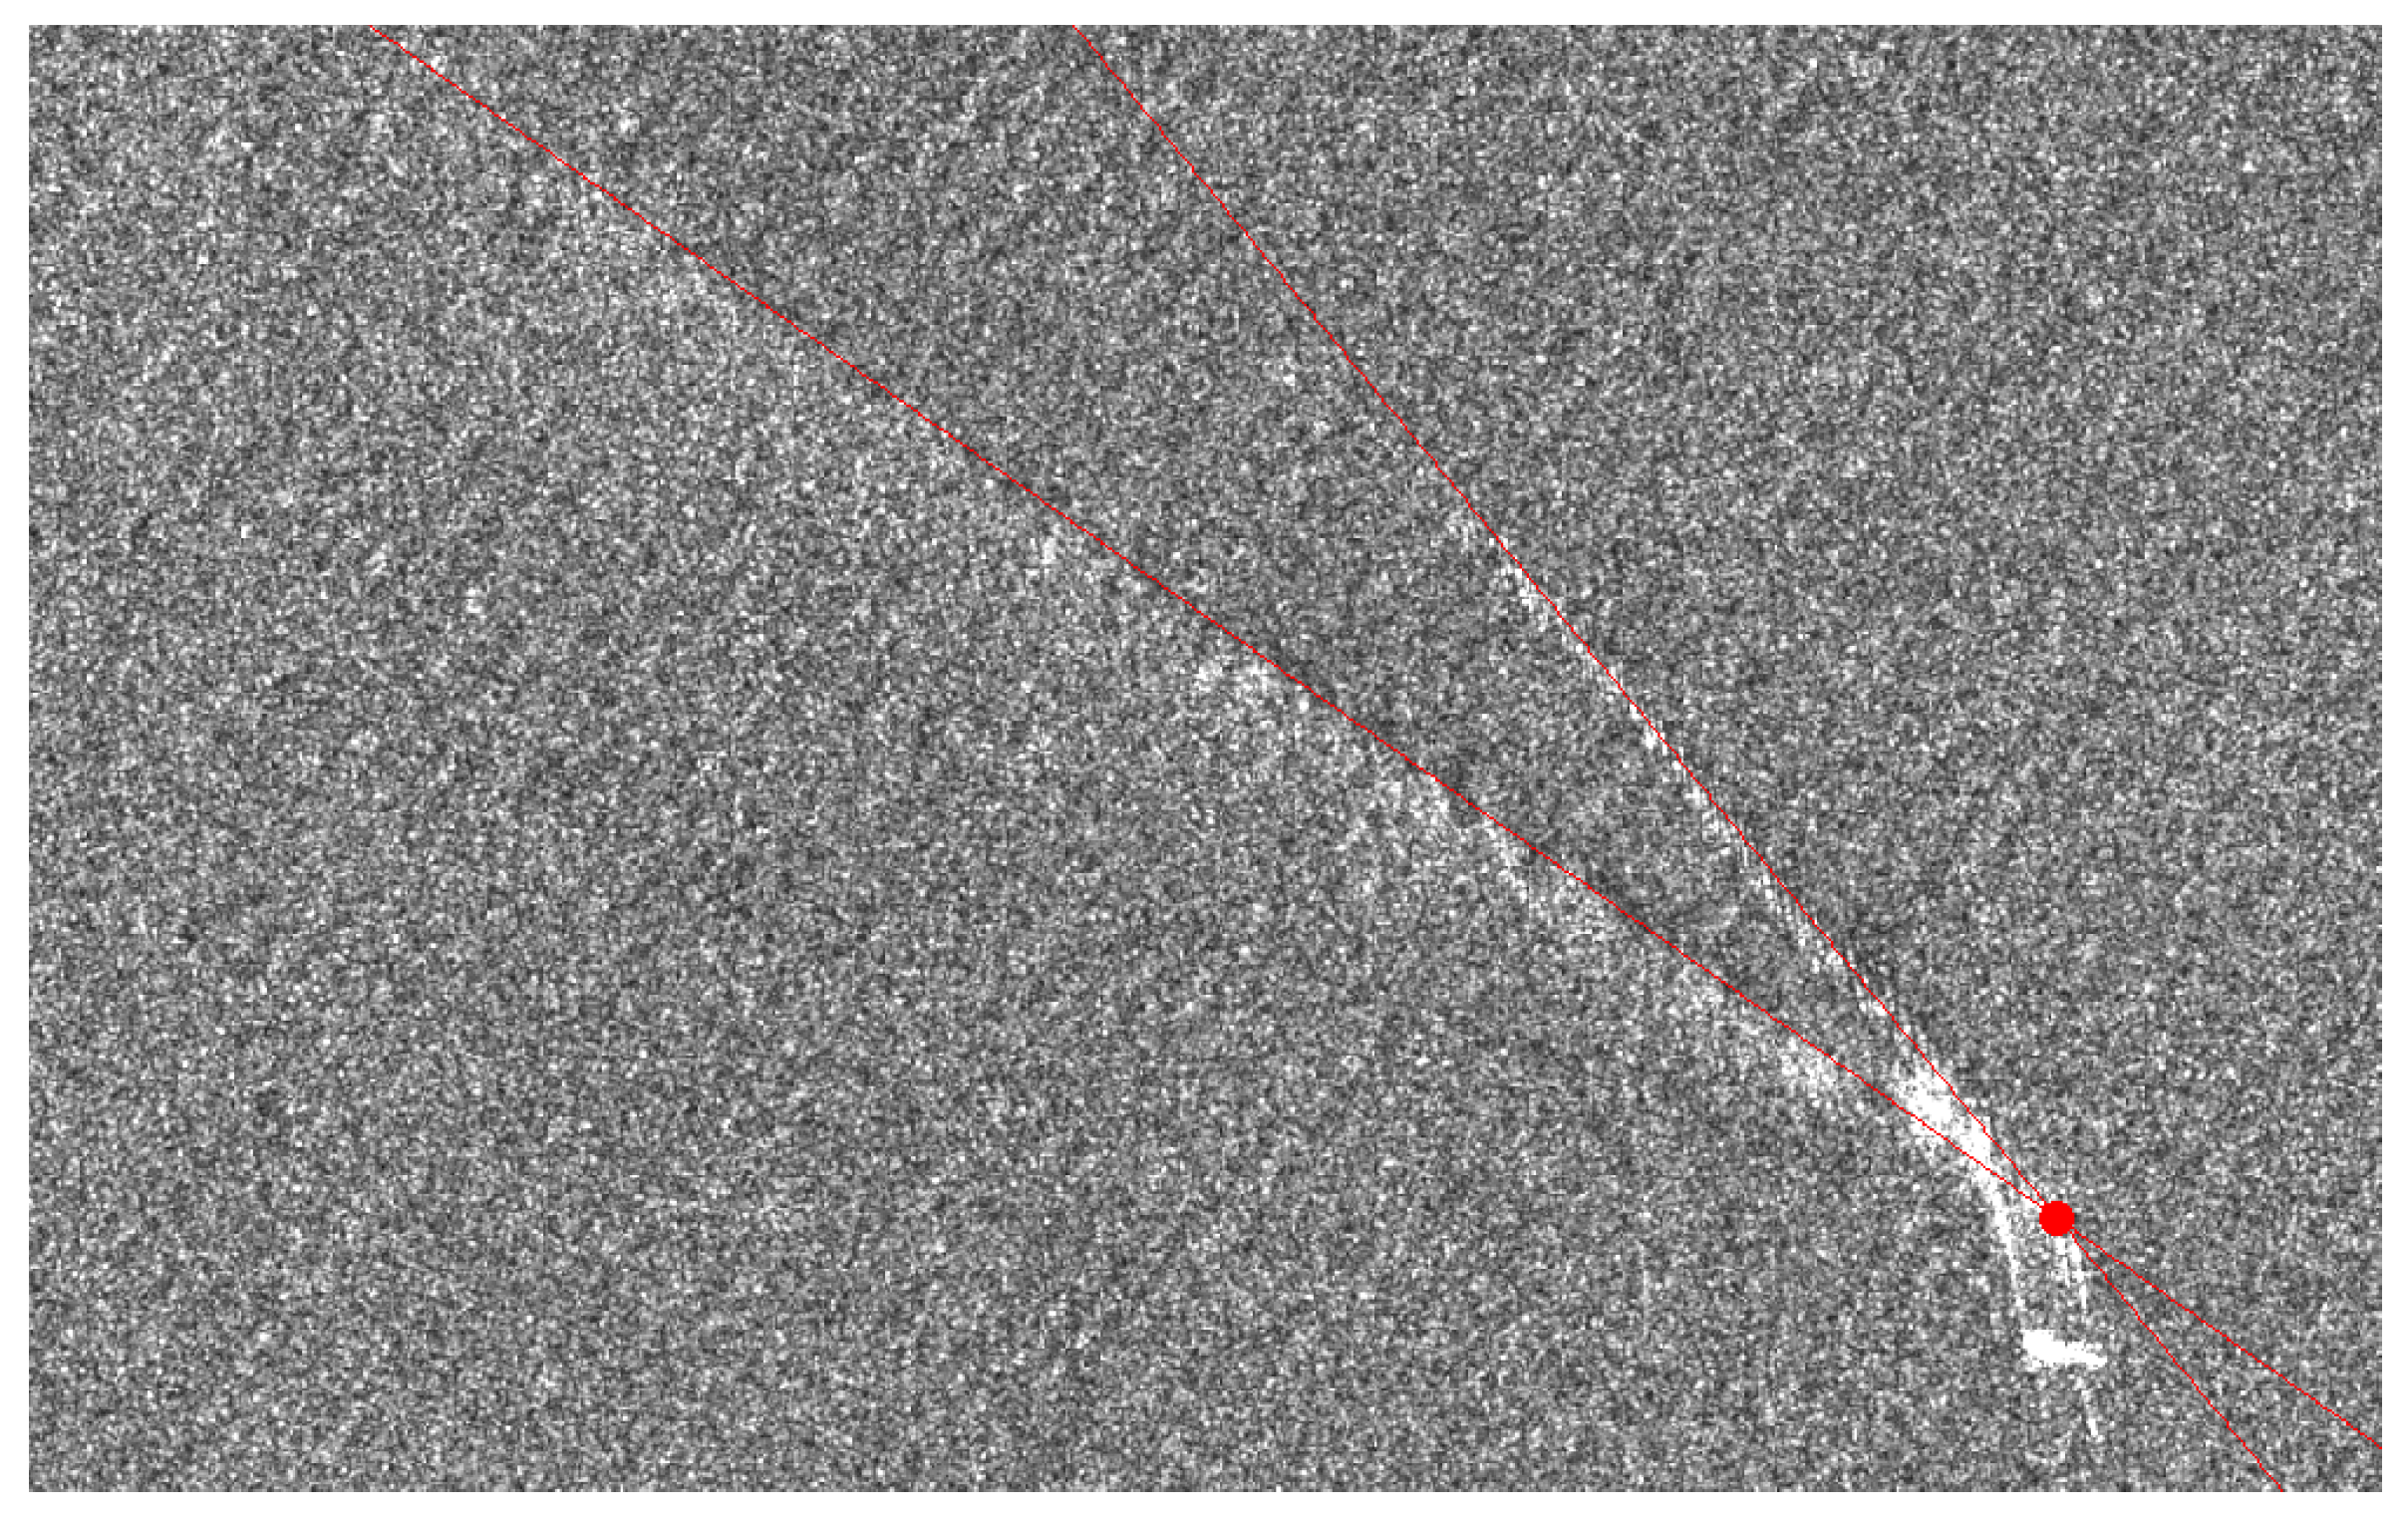
Hough transforming the CSK map in
Figure 6 returns the diagram in
Figure 7. Two dominant peaks are clearly visible, corresponding to the main arms of the wake pattern. The detected linear fragments are exploited to estimate the wake tip (
Figure 6). The heading trajectory of the vessel can be directly determined only if each one of the three observable linear components is detected. In such a case the heading coincides with the bisector of the cusp boundaries. Otherwise the heading is associated with the turbulent component direction, usually the brightest wake component. The distance between the wake tip and the ship centroid is an estimator for the azimuth shift
. Hence, provided that
R and
V are known, the ship’s speed can be computed through Equation (
3).
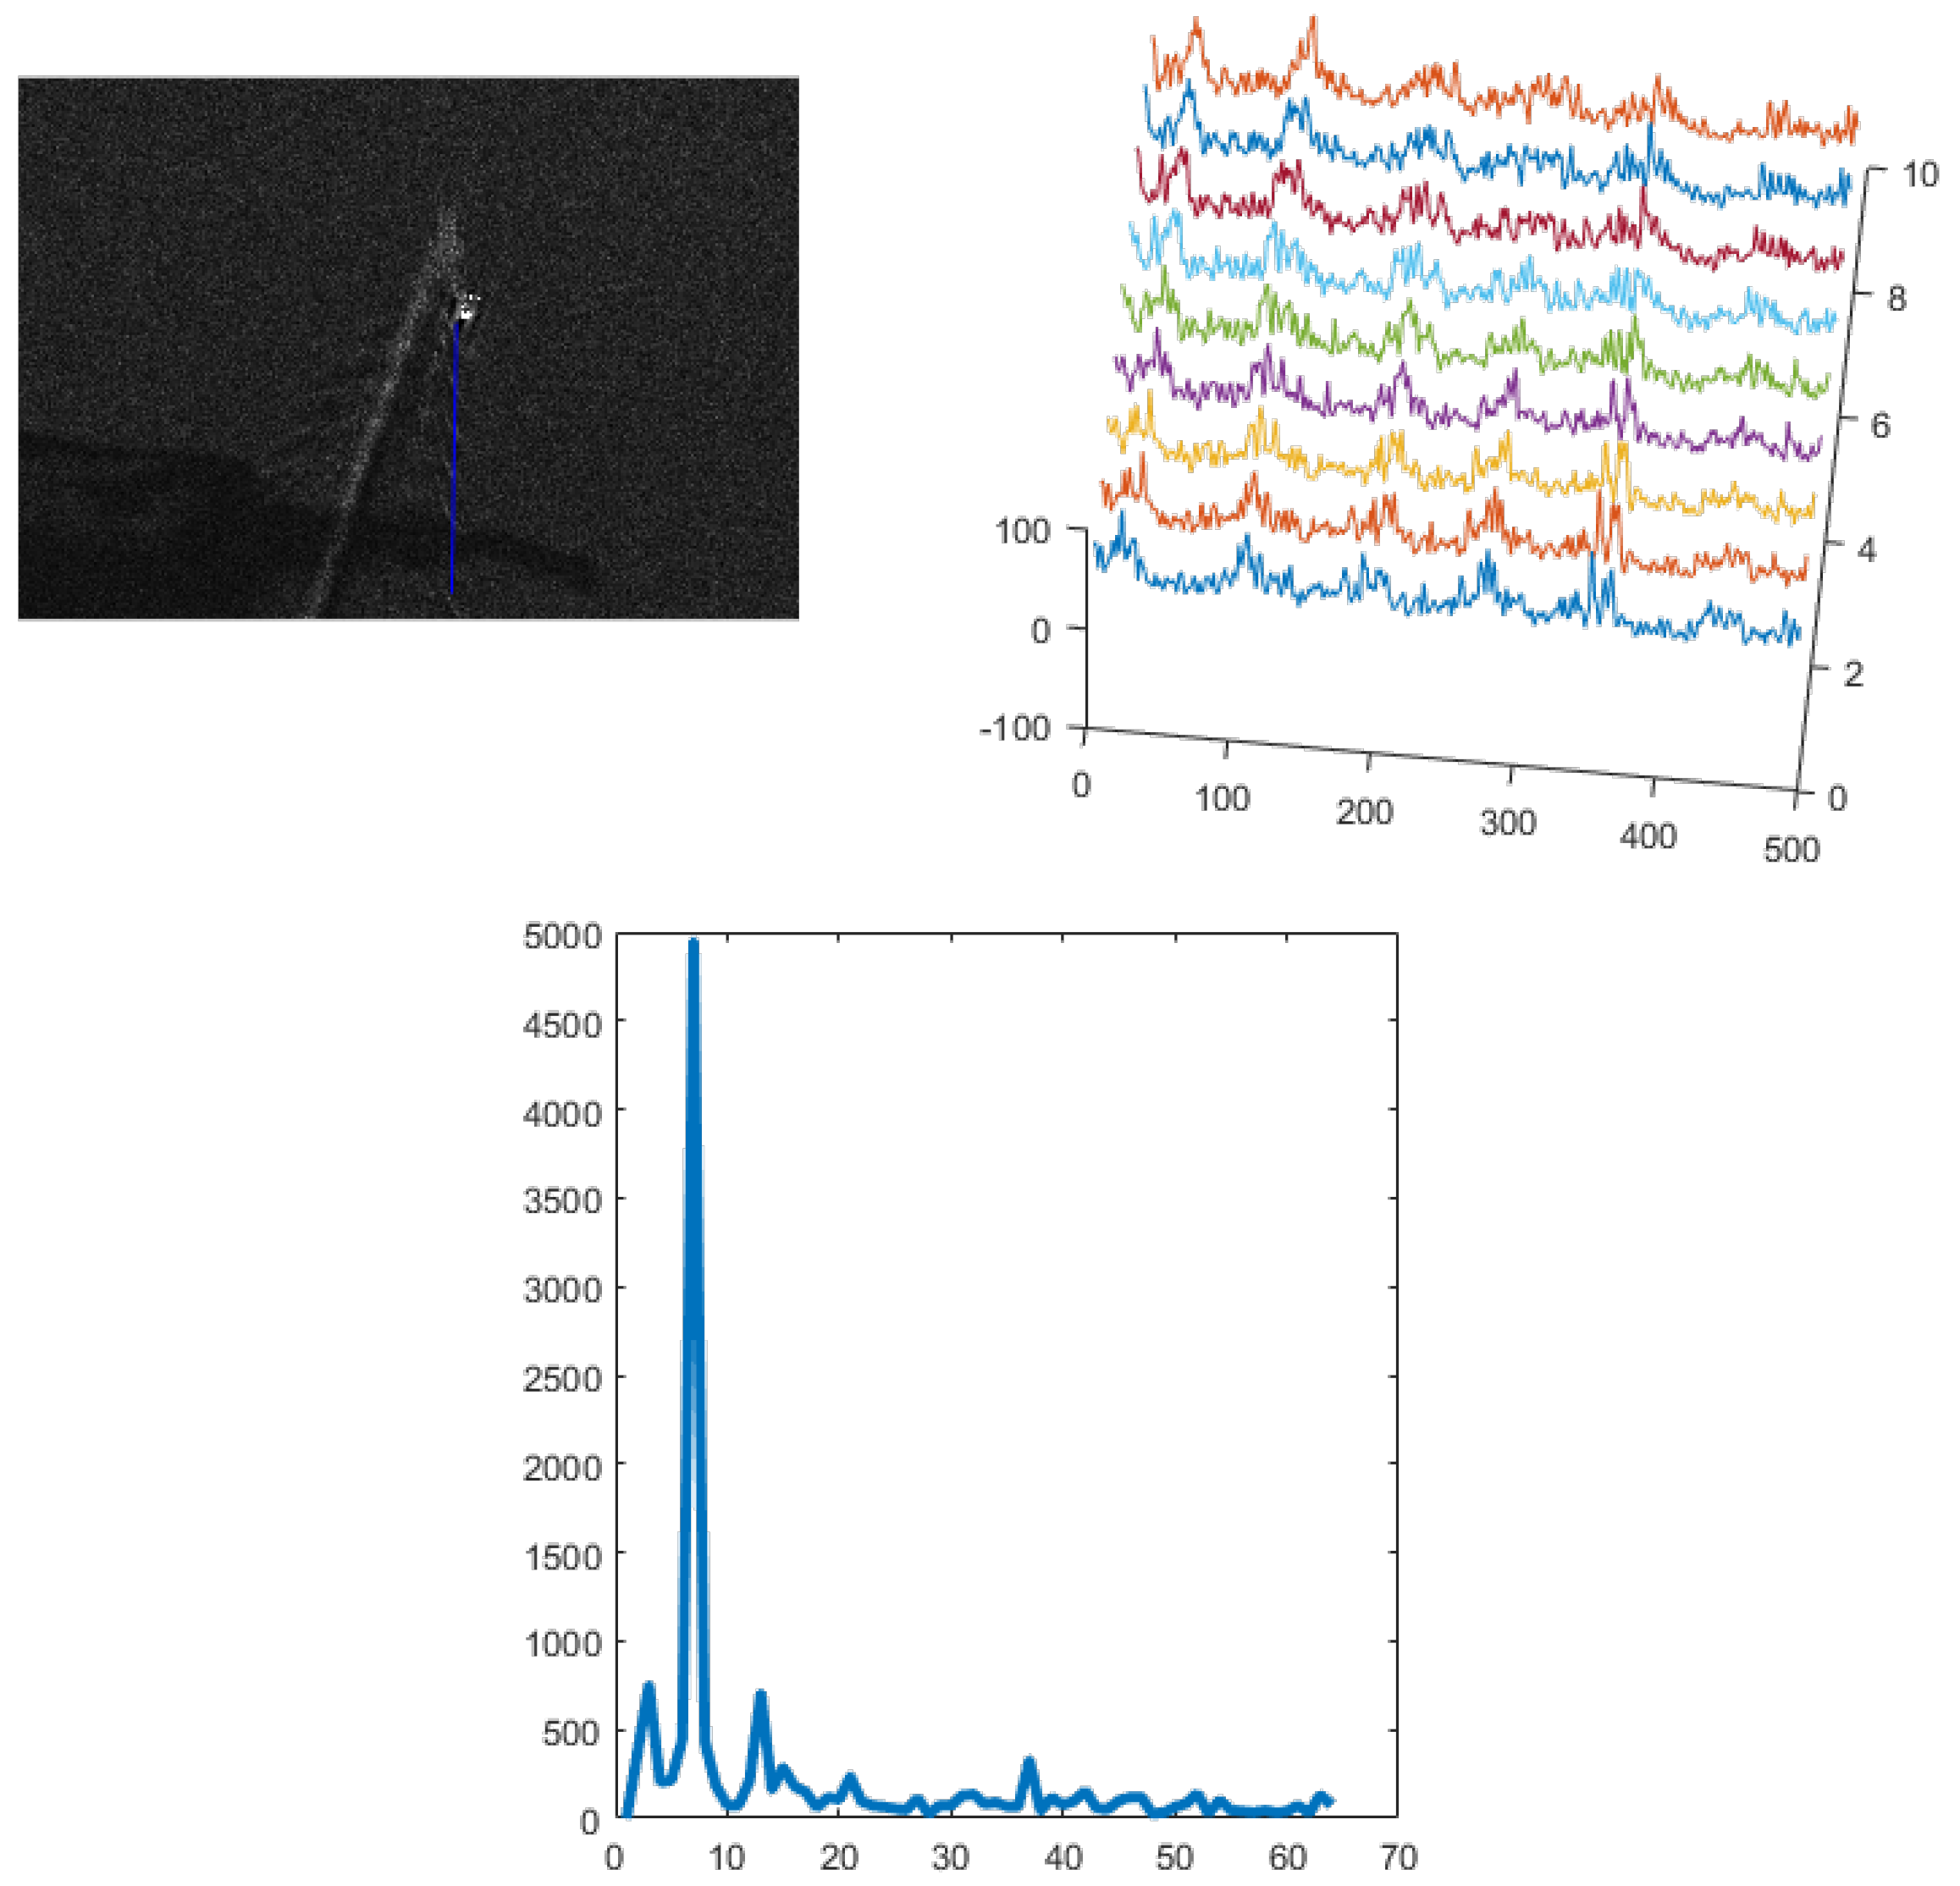
A clear observability of the internal details of the wake generated by a moving vessel is seldom available in SAR data. Most often the main visible components are the macroscopic linear envelopes of the cusp-wave boundaries and the central turbulent perturbation. In this case the only available approach is the one based on the analysis of the azimuth shift. Nevertheless, in case the data is captured with sufficient resolution, processing the signals along the cusp wave profile provides information about the presence of sinusoidal components. To this purpose linear signals are extracted as several parallel slices sampled along the cusp wave (
Figure 8, upper right). Each linear sample is then processed by the periodogram method [
7] to provide an estimate of the power spectral density. Performing this operation for every line yields several estimates of the power spectral density. Hence to increase the signal-to-noise ratio, the final power spectral density has been computed as the average of the set of estimated power spectral densities. The sampled signals and the estimated power spectral density for the wake in
Figure 3, are illustrated in
Figure 8.
6. Conclusions and Future Work
A discussion concerning the processing of SAR imaging data for vessel kinematics quantitative estimation has been presented. Particular focus has been dedicated to the analysis of patch SAR maps returned by ship detection algorithms, with the purpose of quantitatively describe the vessel kinematics. The approach followed in this work entails the implementation of procedures for the detection and the analysis of the wake generated by the passage of a ship, since it is known from hydrodynamics literature that wake patterns exhibit visual attributes directly related to the most relevant vessel kinematics parameters (heading and velocity). In order to detect meaningful linear segments, that may belong to the ship’s wake components in the SAR patch, specific algorithms employing the Hough/Radon transforms have been developed. By exploiting the output results of the linear detection, estimates of the vessel’s heading can be provided. Additional considerations have been provided concerning the analysis of kinematics information intrinsically included in the wake pattern geometry. The representation of a moving vessel through SAR sensing is affected by a coordinate shift between the vessel and the wake tip. Given the dependence of the displacement vector, aligned along the azimuth direction, from the radial velocity of the vessel itself, a method for the estimation of the ship speed has been described. Moreover, the external boundary of the cusp waves, located at an angle of ±19.47 with respect to the heading direction, features a plane wave with periodicity related to the vessel velocity. As an alternative to the azimuth shift method, a ship’s speed estimation technique based on the cusp wave spectral analysis has been discussed and implemented.
Since wake patterns are hardly detectable in SAR maps future developments will be devoted to the refinement of the wake recognition process, based on the exploitation of additional information, such as the fine estimate of the vessel position as well as the constraints of this peculiar hydrodynamics problem, such as the theoretically expected wake angular aperture.

