Supporting Collaborative Preparation of Emergency Plans †


1
Department of Computer Science, Universidad de Chile, Santiago 837-0456, Chile
2
School of Informatics and Telecommunication, Universidad Diego Portales, Santiago 837-0190, Chile
3
Management Control and Information Systems Department, Faculty of Economics and Business,Universidad de Chile, Diagonal Paraguay 257, Santiago 833-0015, Chile
*
Author to whom correspondence should be addressed.
†
Presented at the 12th International Conference on Ubiquitous Computing and Ambient Intelligence (UCAmI 2018), Punta Cana, Dominican Republic, 4–7 December 2018.
Proceedings 2018, 2(19), 1254; https://doi.org/10.3390/proceedings2191254
Published: 26 October 2018
(This article belongs to the Proceedings of UCAmI 2018)
Abstract
:Effective preparedness for reacting in case of a severe emergency requires that many experts with various backgrounds evaluate the possible scenarios and come up with a single, unified plan which considers all opinions. This is a typical collaborative decision-making scenario, characterized by a process cycle involving modelling the process, defining the objectives of the decision outcome, gathering data, generating options and evaluating them according to the defined objectives. This is a decision-making scenario which requires the participation of various experts, who must evaluate and compare many scenarios. Each expert will have a partial knowledge about where people may be at the time of the emergency and how they will react. In emergency scenarios the geographical information often plays a significant importance, since plans need to consider the geography of the terrain from which the population should be evacuated, the safe areas where the population should be taken to, the ways connecting evacuations, and how the rescue teams can reach the places where the emergency occurred. This work presents a tool that can help a group of experts with various types of expertise, generate, visualize and compare the outcomes of various hypotheses. The paper also presents a real case simulation in the event of a tsunami following an earthquake at a site in northern Chile and the possibilities of evacuating people to safer zones.
1. Introduction
Preparing action plans for emergency situations often involves exploring, analyzing and evaluating georeferenced data, which means data where geographic location is of paramount importance. Due to this, Geographical Information Systems (GIS) have been frequently used to support this process. GIS are needed because a preparedness plan regarding the rescue actions and effects caused by an emergency like a large-scale fire, earthquake, tsunami or flood should always consider the characteristics of the corresponding terrain and all possible access and escape ways. These terrain features should allow rescue teams to go to the place to help people and/or bring people to safer places. This analysis should also consider various factors requiring various knowledge domains, such as knowing where medical facilities, schools, safe open areas are located, which are the capacities of transportation in terms of vehicle flux and weight, what are the times required to bring people from a certain place A to a place B, etc. [1]. Given these characteristics, we may describe the process of preparing a plan for rescue actions in the case of certain types of emergencies as a spatial decision making scenario.
Decision Support Systems (DSS) have been defined as interactive computer-based systems that help decision makers in the use of data and models in solving unstructured problems. A simplified model for the decision making (DM) process includes the following stages: (1) identifying the problem, (2) identifying and modeling the objective(s) of the decision, (3) collecting, generating and/or combining data to generate alternative scenarios, (4) evaluating options according to the objectives, (5) choosing an option and conducting a sensitivity analysis. If the decision makers estimate that there is enough information, the process ends with a final decision, otherwise the flow goes back to steps 2 or 3, [2]. Like Artificial Intelligence, the boundaries for defining what falls under DSS seem to be diffuse. However, most authors trying to define it agree that one of the most important characteristics is that human judgment is a key factor in the decision-making process cycle, generating alternatives, re-defining and re-modelling objectives. This is a task involving creativity, which cannot be mechanized. Computers in turn, can provide humans with gathered data, generation of various decision options, and support for evaluating their outcome according to the goals, visualization of these results and communication of the results to others.
Frequently, DSS deal with ill-structured problems; this means the goals might not be totally clear and/or there is insufficient information to solve them in a certain optimal way. Furthermore, in ill-structured problems there are many stakeholders and many decision makers; therefore, the solution tends to be subjective and unique. Also, DSS systems use various models and analysis techniques that are intended for use by non-computer experts. Hence, a DSS must be interactive, flexible and adaptable in order to support various solution approaches. Furthermore, DSSs oriented to spatial problems must take into account that spatial information is inherently fuzzy and uncertain [3], this means that fuzzy analysis techniques are needed.
Another difficulty with GIS-based ill-structured problems is that the data available to the decision makers is frequently unreliable. In particular, data may be incomplete (not covering the whole space) and/or uncertain (there are doubts on the data accuracy and veracity). One example is with the evacuation of people from coastal areas after a strong earthquake; there is the threat of a possible tsunami and decision makers must decide the evacuation procedure. Various options may be available, but the data to make an easy decision may not be at hand: how many people are now in each portion of the territory? Do they currently have operational means of transportation at each location? Do they have basic supplies (water, electricity, gas …) at each location? etc.
We have presented a way to deal with incomplete and uncertain spatial data in a previous work [3]. In a later work [4], we discussed ideas regarding how to include the participation of various experts. This paper deals with a further step in the collaborative decision-making process by refining the way the various experts’ criteria can be combined to present a single unified solution. We also present here an already implemented Collaborative Spatial Decision-Making System which allows the various experts to first individually generate and evaluate possible scenarios according to their knowledge, then discuss and combine their solutions.
2. Background
A problem to study is how to combine the work of various people in a group. There are some simple cases, such as first dividing the planned output into parts assigned to individual members of the group and then assembling the contributions at a meeting or by a single person. Another simple case is to take turns to improve an initial draft.
Baeza-Yates and Pino [5], introduced a case in which those trivial solutions were not applicable. The problem was with collaborative information retrieval: various persons seek information and then each result is combined using a certain strategy to make a final result. Smeaton et al. [6], proposed another solution to the same problem: multiple people share a single user interface and cooperatively formulate queries and evaluate results. Finally, Pickens et al. propose an approach in which an algorithmically mediated collaborative search engine coordinates user activities during the searching session [7], (Figure 1d).
The area of GIS-based decision making is another one requiring convergence research. The typical setting consists of a chauffeured group of decision makers, i.e., only one person manages access to a GIS system perhaps with a joint visualization. This asymmetric setting has been criticized because the stakeholders are not in the same standpoint to contribute to the final decision (e.g., [7]). Even more, for many public/private geographically related problems, several researchers have voiced the need to democratize the decision-making process by involving the general public who are directly affected by the decisions (e.g., [8,9,10]).
GIS-based systems play an important role when developing action plans in case of an emergency [8]. Very often the necessary information is displayed in the form of a suitability map, which is a map where the “appropriateness” of a certain terrain to fulfill certain conditions in a graphical way. For example, the risk of a landslide occurrence can be represented on a map by painting the areas with high risk with red color, medium risk with yellow and low risk with white. In order to build a suitability map it is necessary to assign a certain value to each geographical point, which will determine its color. In the case when the suitability value is determined by the knowledge of experts, the Dempster-Shafer’s Plausibility Theory [11], has proven to be an effective tool, [4,12,13]. It proposes to use sets of hypotheses regarding a variable (e.g., the number of people in X is always between t1 and t2) associated with a probability of being correct. The theory defines three types of values associated with the probability:
- Plausible: is the probability that the random variable takes values within the range of the query.
- Certain: is the probability that the whole range of the distribution of variable (D) is within the range of the query.
- Uncertain: no valuable information can be derived from this data.
Using the Dempster-Shafer Theory, the expert can define a set of hypotheses expressing his knowledge, e.g., if the expert is looking for people one hypothesis can be “people are in shops with a 20% of belief” or “people are in schools or workplaces with a 40% of belief”. We also defined query hypotheses: “people are in shops just like in place X, Y”. In the hypothesis statement the expert can define multiple hypotheses, which are combined using Dempster-Shafer combination rules. Furthermore, the expert can design these complex scenarios without requiring any kind of GIS expertise.
The result of combining the hypotheses with real data and fuzzy techniques for spatial representation gives us a suitability map. A suitability map typically shows the suitability level on each point of the map that satisfies the requirements; in our case, it shows the belief degree of the hypothesis for each evaluated location. This kind of suitability map is what we call a simple scenario.
3. Case Study
Since Chile is a country where earthquakes are very frequent, and an important part of its territory is coastal land, plans for evacuating people in case of tsunamis are very important. In order to develop plans and train the population to evacuate the seaside and seek for safety in higher grounds many factors should be considered, like where people may be at the time of an earthquake and the speed at which a tsunami reaches the coast.
In order to make an effective population evacuation plan, various experts and stakeholders have to collaborate. Each one may have different opinions and hypotheses about which are the best options to elaborate an evacuation plan. In order to exemplify the proposed collaboration method, we will assume there are five experts. Two of them believe that the best evacuation method is for people to go to higher grounds, using any possible routes and means of transport. The remaining three experts have another hypothesis: most people will not be able to reach the higher grounds before the tsunami arrival, so they must seek refuge inside high buildings (vertical evacuation).
In order to evaluate both options, organizations responsible for dealing with emergency situations typically rely only on traditional GIS. These systems provide information about the population living in the area, the number of schools, and other stored information.
In case of a tsunami, the evacuation problem can be classified as an ill-formulated problem, because there is no real information about the number of people who must be evacuated nor how much time there is between the earthquake occurrence and a tsunami reaching the coast. On top of this observation, the population in the area varies according to the day of the week and time and we must assume an earthquake can occur at any time.
Using the Dempster-Shafer Theory, we can build a set of hypotheses that can tell us where people may be located. For example, there is an area of the coastline of Iquique where there is a high belief that people will congregate there in large numbers during day, because this area includes a high concentration of universities, restaurants, shopping centers, a popular beach, etc. This area is also far from higher grounds. For this area, one proposed solution is that of a vertical evacuation, which urges people to enter high buildings. This scenario can be described as an evacuation possibility, meaning that if there is a high building in the vicinity, then people around it should seek refuge in this building. However, an obvious problem will occur if there are too many people and not enough high buildings.
In order to cope with incomplete information and multiple scenarios, we propose to use a Dempster-Shafer based Collaborative Geographical Information System (CGIS). Using the CGIS, the above-mentioned five experts could make their own hypotheses evaluation. However, as a result of this process they will have different suitability maps. For example, the first two experts can differ on where they believe people may be at different hours of the day. The other three experts may also differ on how tall the buildings must be or what kind of construction can resist a tsunami.
After each expert builds his own simple scenario there will be five suitability maps. The next natural step will group the suitability maps according to both evacuation scenarios. However, this strategy will not solve the collaboration problem. Another case can be that each suitability map is based on similar hypotheses, for example, that during the day people are in commercial areas, schools, universities, libraries, banks, bus stations, etc. However, one expert may believe that there will be more people at commercial areas, and others may say that there will be more people located in residential areas.
In order to solve the problem, we propose to combine the various suitability maps generated by each expert in a hierarchical order, by combining the different hypotheses according to certain operators, as it has been suggested in [14]. Of course, which suitability maps should be combined using which operation would need to be collaboratively decided by all experts. In each combination step the resulting suitability map should be the outcome of the discussion of each scenario possibility including the experts’ hypotheses known information about the area, and relevant factors on which to focus. Suitability maps are combined as a result of argumentation and discussion (Figure 2).
4. Combination Methods
We have proposed using the following operators for combining scenarios independently generated by various experts [8].
SUM operator adds the belief values of each scenario for each evaluated location. This operator can be useful when three independent, but related scenarios must be merged. SUBSTRACT operator subtracts the belief values of two or more scenarios at each evaluated location. This operator can be useful when it is necessary to evaluate the differences between one scenario and others. AVERAGE operator is the simple average over the belief degrees of each location in each scenario.
OWA operator is the weighted average given an order, [15,16]. There are two basic types of OWA. When using OWA-DESC operator, both values and weights are ordered in descending order. This combination can emphasize the biggest belief values of each scenario, avoiding that a certain important fact known by one of the experts could be ignored because of the simple average of numbers. When using the OWA-ASC operator, values are ordered in an ascending sequence and the weights are also ordered in an ascending sequence. This combination emphasizes the belief when the values are constantly high in all scenarios.
For this work we also include two other OWA operators, which are implemented in the application developed:
The weighted OWA (WOWA) operator integrates the weighted average and the OWA operator in the same formulation. Thus, it can represent the importance of the variables and the attitudinal character of the decision maker in the same formulation, under or overestimating the initial data. Several approaches are available in the literature including the WOWA operator [17], the importance OWA [18], the hybrid average [19], and the OWA weighted average (OWAWA), [20]. The main advantage is that it can provide a more complete representation of the information taking into account any scenario that may occur between the minimum and the maximum.
The induced OWA (IOWA) operator [21], is an aggregation operator that follows the methodology of the OWA operator. However, instead of reordering in increasing or decreasing order, it uses order inducing variables to determine the ordering process of the aggregation. This issue is important because many times the numerical values do no indicate the ordering of the information. For example, when analyzing the temperature of the human body in Celsius degrees, the optimal integer value is 37. Next, it is 36, 38, and so on. Thus, there is no strict increasing or decreasing order and an additional set of order inducing variables are needed to establish the reordering process of the information. The induced OWA operator can be further extended with generalized and quasi-arithmetic means [22], and with the weighted average, [20]. The IOWA operator is defined as follows. The IOWA operator can be used to specify the scenario evaluation order. For example, if we want to order scenarios by their “source quality”, it is possible to define an order using the u values in IOWA pairs. However, the order cannot be arranged by an optimal value because we are working with belief degrees.
5. Collaborative Scenario Discussion Tool
For the previously described scenario, we developed a collaborative application which allows various users (experts involved in the emergency preparedness) to generate suitability maps based on their hypotheses, share them with other experts, discuss and combine them using the previously described operators. The application was developed based on a previous tool built for supporting decision making in general [23]. A discussion starts with an initial suitability map, and a scenario description. This description should include the following data:
- Title: The object of matter
- Decision objective: The discussion objective
- Context: Important consideration of the problem context and spatial context.
- Time issues: Scenario time dependency.
- Analyzed model: Fuzzy spatial model to be used.
- Scenario alternatives: Known possible solutions to be evaluated.
- An initial hypothesis must be provided.
Figure 3 shows the initial view of the tool displaying the provided information. With the initial hypothesis a first suitability map is displayed. The tool provides a discussion area besides the general information and the suitability map.
In Figure 3, an argumentation made by another expert is shown. Using a simple voting system, the rest of the experts can evaluate this proposal. The argumentation can be complemented by attaching a suitability map visually supporting the argument. Each support suitability map can be created from scratch (specifying a new hypotheses set) or by applying operators to existing ones. The existing suitability maps can be own ones or provided by another expert. Figure 4 shows the creation of a new contribution to the debate. This version of the tool allows attaching up to 3 suitability maps for supporting the argumentation.
The combination of suitability maps can be done at any time. This implies that in this tool the hierarchical combination order is not strict and incremental approaches are also supported. However, the conceptual implications of combining a suitability map with those resulting from their “children” are not clear. In order to combine two or more suitability maps the expert must select them and apply a combination operator in order to generate a new suitability map (Figure 5).
6. Example Simulation
In order to exemplify the analytical potential of the proposed platform, we are going to simulate a solution scenario to the evacuation problem in case of a tsunami in the city of Iquique. We will assume the first decision maker will be an ONEMI official. ONEMI is the Chilean national entity in charge of preparing actions plans for emergencies scenarios. Other experts may be from police, firefighters, health authorities, local government, etc. Based on the available information, ONEMI proposes evacuating to higher grounds, and they have provided digital maps of the inundation areas, evacuation roads, and safe places (Figure 6a,b).
In a large earthquake scenario, several experts propose a vertical evacuation to the top of the buildings (at least 30 m high), because a tsunami can enter a city in less than 30 min (some experts claim 15 min). Using our platform, it is possible to build three different suitability maps for three different scenarios.
- Scenario 1: Near safe places, Figure 6a.
- Scenario 2: Near high buildings, Figure 6b.
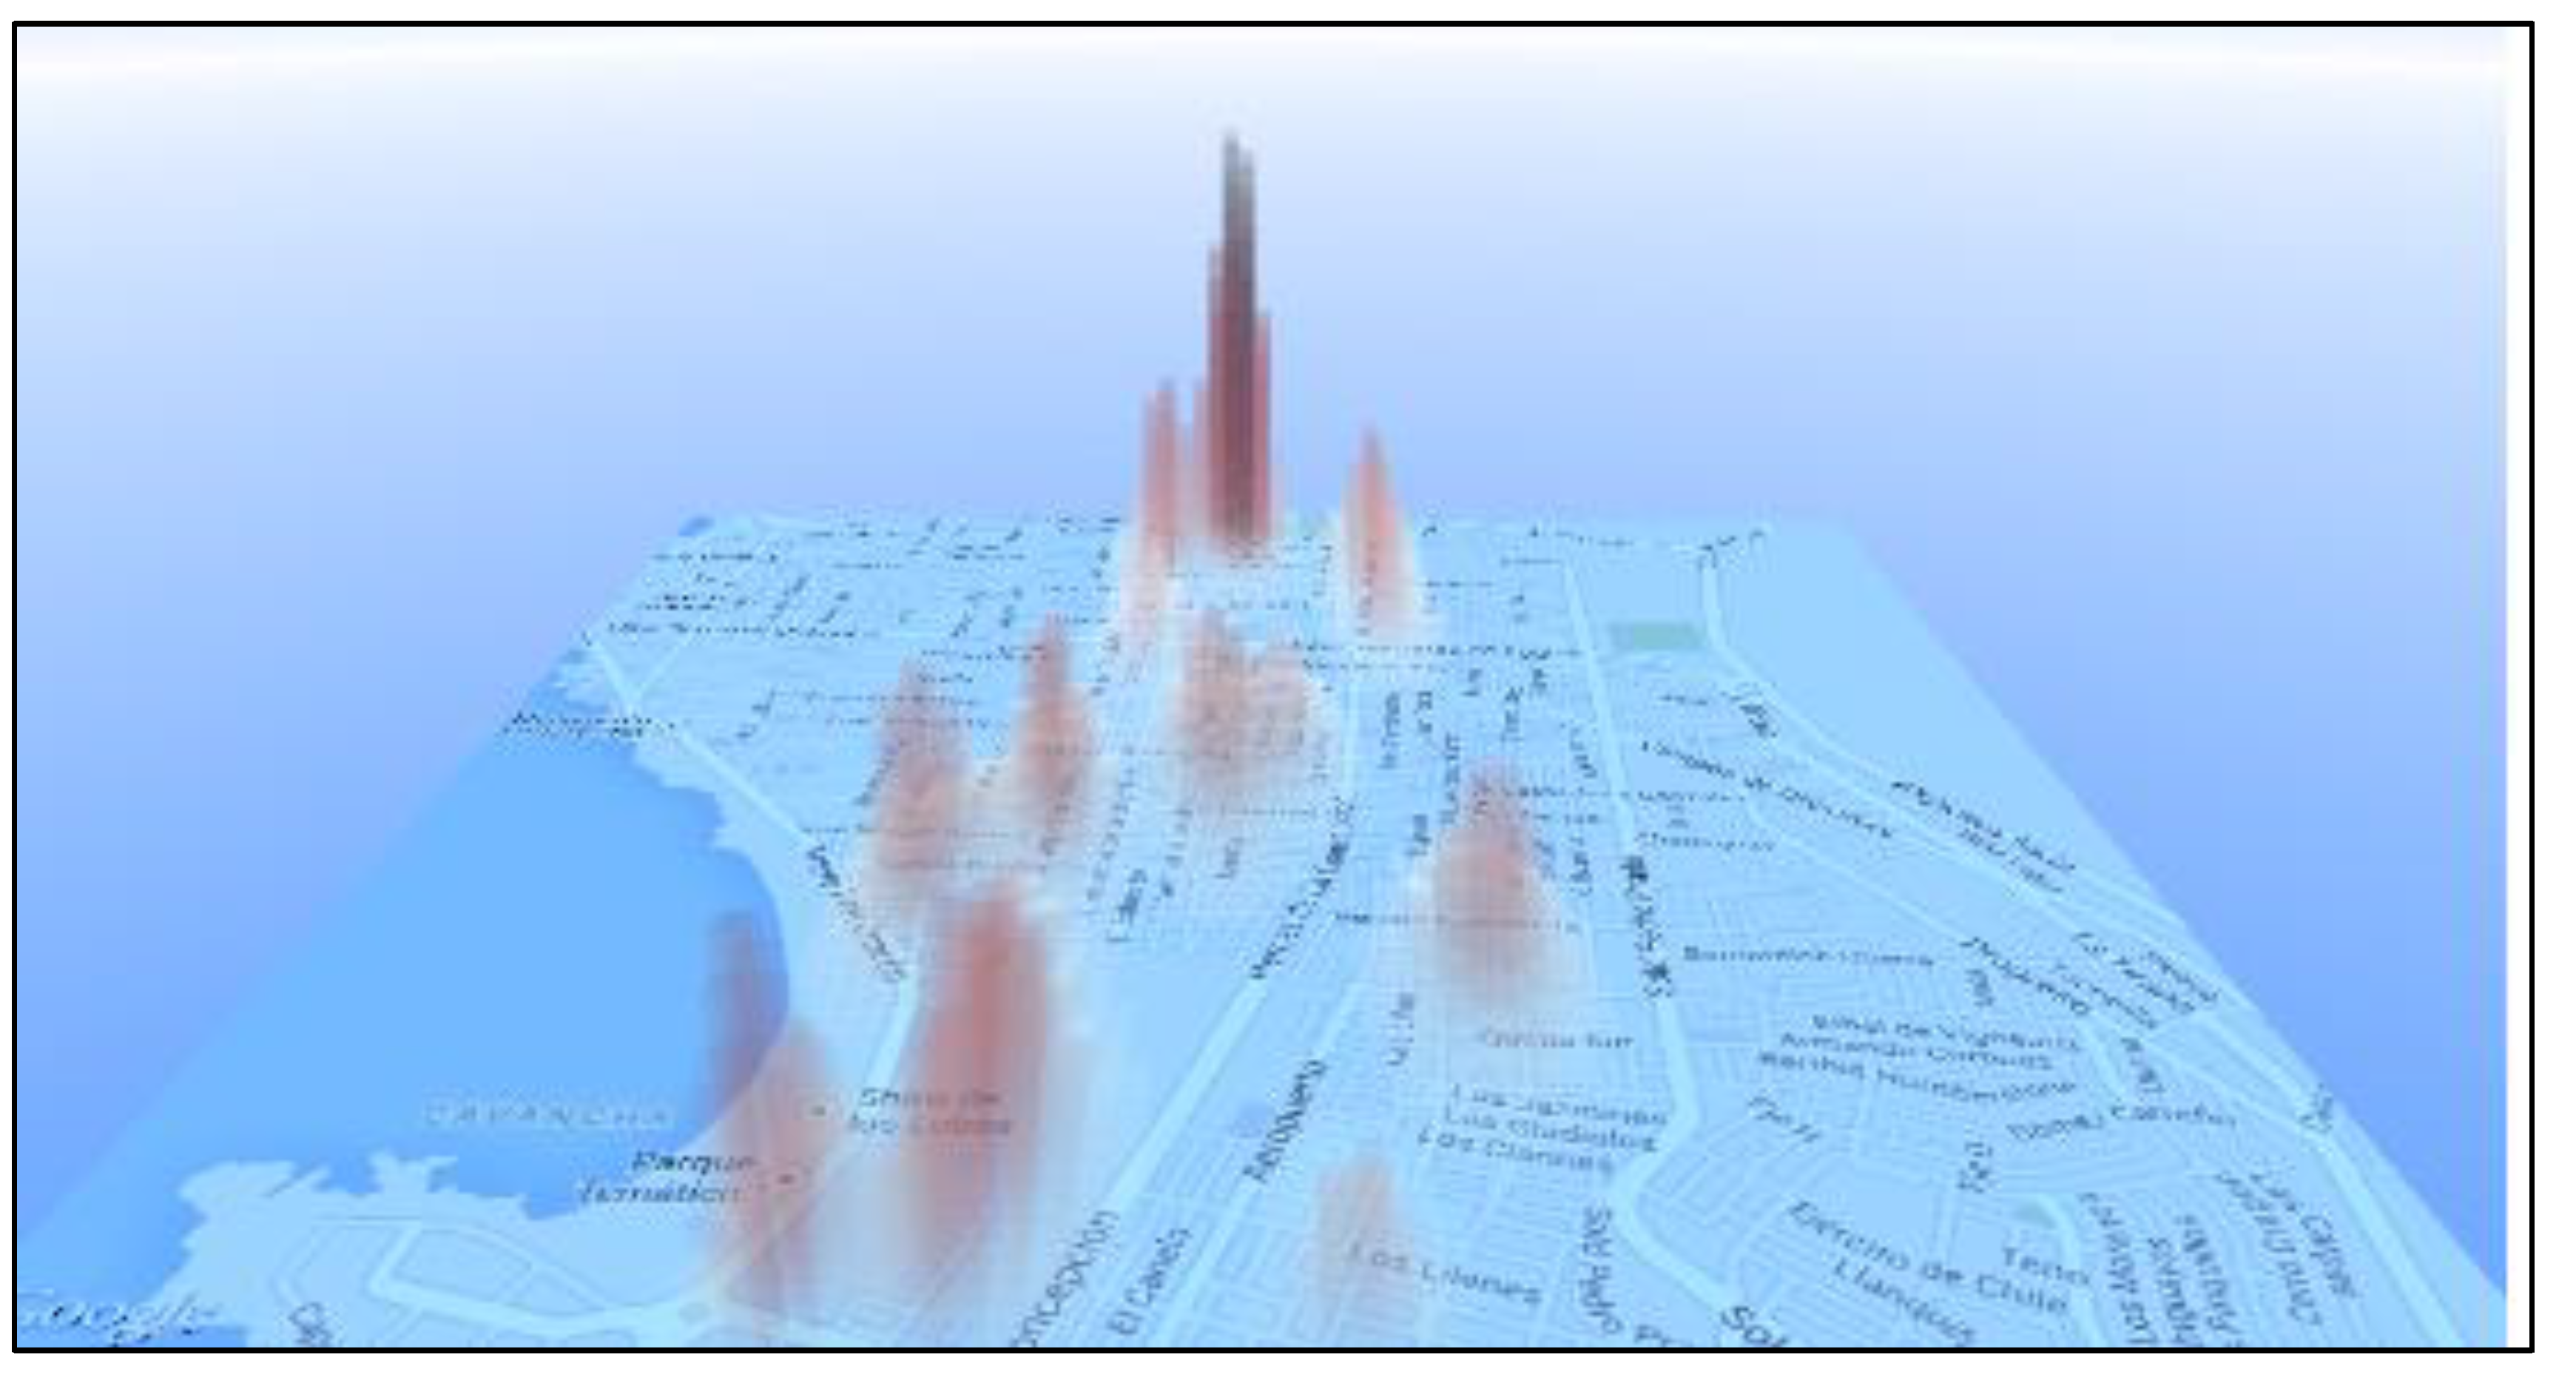
- Scenario 3: Where people can be at the time of the tsunami, Figure 7a,b.
Scenario 3 can have two different versions: Day and Night. The night version can be easily calculated by using the residential information of the city. However, in order to test our platform, we are going to simulate using the day version, which is built based on a set of hypotheses (Figure 7a).
By visually comparing the three scenarios we can easily spot differences. Furthermore, these differences do not show a positive situation. They clearly show that some areas lack access to evacuation options. However, the scale of the belief in scenario 3, shown in Figure 7a, is hiding the belief values in commercial areas (to the north of the beach, Figure 7b).
Some of the areas with higher belief values lack evacuation options, even evacuation roads. Finally, in order to compute which areas, have more belief of “not being safe for the people”, we are going to apply a subtract operator in this order:
- Unsafe1 = Scenario 3–Scenario 1.
- Unsafe2 = Unsafe1–Scenario 2.
7. Conclusions
This paper presents a work consisting of the theoretical foundations and a tool developed on them in order to support the preparedness stage (planning sub-stage) for an emergency situation, [24]. The work uses as an example the situation of a tsunami in a coastal city, however, preparing actions for other emergency situations could be also addressed using the results of this work.
By developing the methods and application we could check that the Dempster-Shafer’s theory of plausibility is appropriate for analyzing emergency scenarios, since it allows to apply hypotheses and use uncertain data over geo-referenced information in order to draw conclusions about the necessary action that could be taken in case of a certain type of emergency. It also allows cooperative work because there is the possibility to aggregate the contributions of various experts, giving the possibility of discussing about the plausibility of the hypotheses stated by each expert participating in the preparedness team.
The next step in this ongoing research work is to evaluate this approach with real experts, asking them how they perceive the value of this tool for performing their work.
Acknowledgments
This research was partially funded by support from the Chilean Government through Comisión Nacional de Investigación Científica y Tecnológica–CONICYT and the Fondo Nacional de Desarrollo Científico y Tecnológico–Fondecyt Regular project number 1161200.
Conflicts of Interest
The authors declare no conflict of interest.
References
- Monares, A.; Ochoa, S.F.; Pino, J.A.; Herskovic, V.; Neyem, A. MobileMap: A Collaborative Application to Support Emergency Situations in Urban Areas. In Proceedings of the 13th International Conference on Computer Supported Cooperative Work in Design, Santiago, Chile, 22–24 April 2009; pp. 432–437. [Google Scholar]
- Antunes, P.; Sapateiro, C.; Zurita, G.; Baloian, N. Integrating Spatial Data and Decision Models in an E-Planning Tool; International Conference on Collaboration and Technology; Springer: Berlin, Germany, 2010; pp. 97–112. [Google Scholar]
- Morris, A.; Jankowski, P. Combining fuzzy sets and databases in multiple criteria spatial decision making. In Flexible Query Answering Systems; Springer: Berlin, Germany, 2001; pp. 103–116. [Google Scholar]
- Frez, J.; Baloian, N.; Pino, J.A.; Zurita, G. Cooperative Work for Spatial Decision Making: An Emergencies Management Case; CYTED-RITOS International Workshop on Groupware; Springer: Berlin, Germany, 2014; pp. 113–120. [Google Scholar]
- Baeza-Yates, R.; Pino, J.A. A first step to formally evaluate collaborative work. In Proceedings of the International ACM SIGGROUP Conference on Supporting Group Work: The Integration Challenge, Phoenix, AZ, USA, 16–19 November 1997; pp. 56–60. [Google Scholar]
- Smeaton, A.F.; Lee, H.; Foley, C.; McGivney, S.; Gurrin, C. Físchlár-DiamondTouch: Collaborative video searching on a table. In Proceedings of the International Society for Optics and Photonics Multimedia Content Analysis, Management, and Retrieval, San Jose, CA, USA, 17 January 2006; p. 607308. [Google Scholar]
- Pickens, J.; Golovchinsky, G.; Shah, C.; Qvarfordt, P.; Back, M. Algorithmic mediation for collaborative exploratory search. In Proceedings of the 31st Annual International ACM SIGIR Conference on Research and Development in Information Retrieval, Singapore, 20–24 July 2008; pp. 315–322. [Google Scholar]
- Jankowski, P.; Nyerges, T. GIS-supported collaborative decision making: Results of an experiment. Ann. Assoc. Ame. Geogr. 2001, 91, 48–70. [Google Scholar] [CrossRef]
- Dragićević, S.; Balram, S. A Web GIS collaborative framework to structure and manage distributed planning processes. J. Geogr. Syst. 2004, 6, 133–153. [Google Scholar] [CrossRef]
- Malczewski, J. GIS-based multicriteria decision analysis: A survey of the literature. Int. J. Geogr. Inf. Sci. 2006, 20, 703–726. [Google Scholar] [CrossRef]
- Shafer, G. A Mathematical Theory of Evidence; Princeton University Press: Princeton, NJ, USA, 1976; Volume 42. [Google Scholar]
- Baloian, N.; Frez, J.; Pino, J.A.; Zurita, G. Efficient Planning of Urban Public Transportation Networks. In Proceedings of the International Conference on Ubiquitous Computing and Ambient Intelligence, Puerto Varas, Chile, 1–4 December 2015; pp. 439–448. [Google Scholar]
- Frez, J.; Baloian, N.; Zurita, G. Getting serious about integrating decision support mechanisms into Geographic Information Systems. In Proceedings of the Computer Science and Information Technologies (CSIT), Yerevan, Armenia, 23–27 September 2013; pp. 1–11. [Google Scholar]
- Merigó, J.M.; Casanovas, M. Induced aggregation operators in decision making with the Dempster-Shafer belief structure. Int. J. Intell. Syst. 2009, 24, 934–954. [Google Scholar] [CrossRef]
- Yager, R.R. On ordered weighted averaging aggregation operators in multicriteria decisionmaking. IEEE Trans. Syst. Man Cybern. 1988, 18, 183–190. [Google Scholar] [CrossRef]
- Yager, R.R.; Kacprzyk, J.; Beliakov, G. Recent Developments in the Ordered Weighted Averaging Operators: Theory and Practice; Springer: Berlin, Germany, 2011; Volume 265. [Google Scholar]
- Torra, V. The weighted OWA operator. Int. J. Intell. Syst. 1997, 12, 153–166. [Google Scholar] [CrossRef]
- Yager, R.R. Including importances in OWA aggregations using fuzzy systems modeling. IEEE Trans. Fuzzy Syst. 1998, 6, 286–294. [Google Scholar] [CrossRef]
- Xu, Z.; Da, Q.-L. An overview of operators for aggregating information. Int. J. Intell. Syst. 2003, 18, 953–969. [Google Scholar] [CrossRef]
- Merigó, J.M. A unified model between the weighted average and the induced OWA operator. Expert Syst. Appl. 2011, 38, 11560–11572. [Google Scholar] [CrossRef]
- Yager, R.R.; Filev, D.P. Induced ordered weighted averaging operators. IEEE Trans. Syst. Man Cybern. Part B 1999, 29, 141–150. [Google Scholar] [CrossRef] [PubMed]
- Merigó, J.M.; Gil-Lafuente, A.M. The induced generalized OWA operator. Inf. Sci. 2009, 179, 729–741. [Google Scholar] [CrossRef]
- Baloian, N.; Frez, J.; Pino, J.A.; Zurita, G. Supporting Collaborative Decision Making in Geo-Collaboration Scenarios; CYTED-RITOS International Workshop on Groupware; Springer: Berlin, Germany, 2015; pp. 66–73. [Google Scholar]
- Haddow, G.; Bullock, J.; Coppola, D.P. Introduction to Emergency Management; Butterworth-Heinemann: Oxford, UK, 2017. [Google Scholar]
Figure 1.
Strategies for Collaborative Search (according to [7]). In (a) an algorithm automatically combines results obtained individually by two or more users. In (b) multiple users interact with the same interface thus producing one result. In (c) multiple users interact with multiple interfaces but results are combined (e.g., summed). In (d) the collaboration happens inside the search engine.
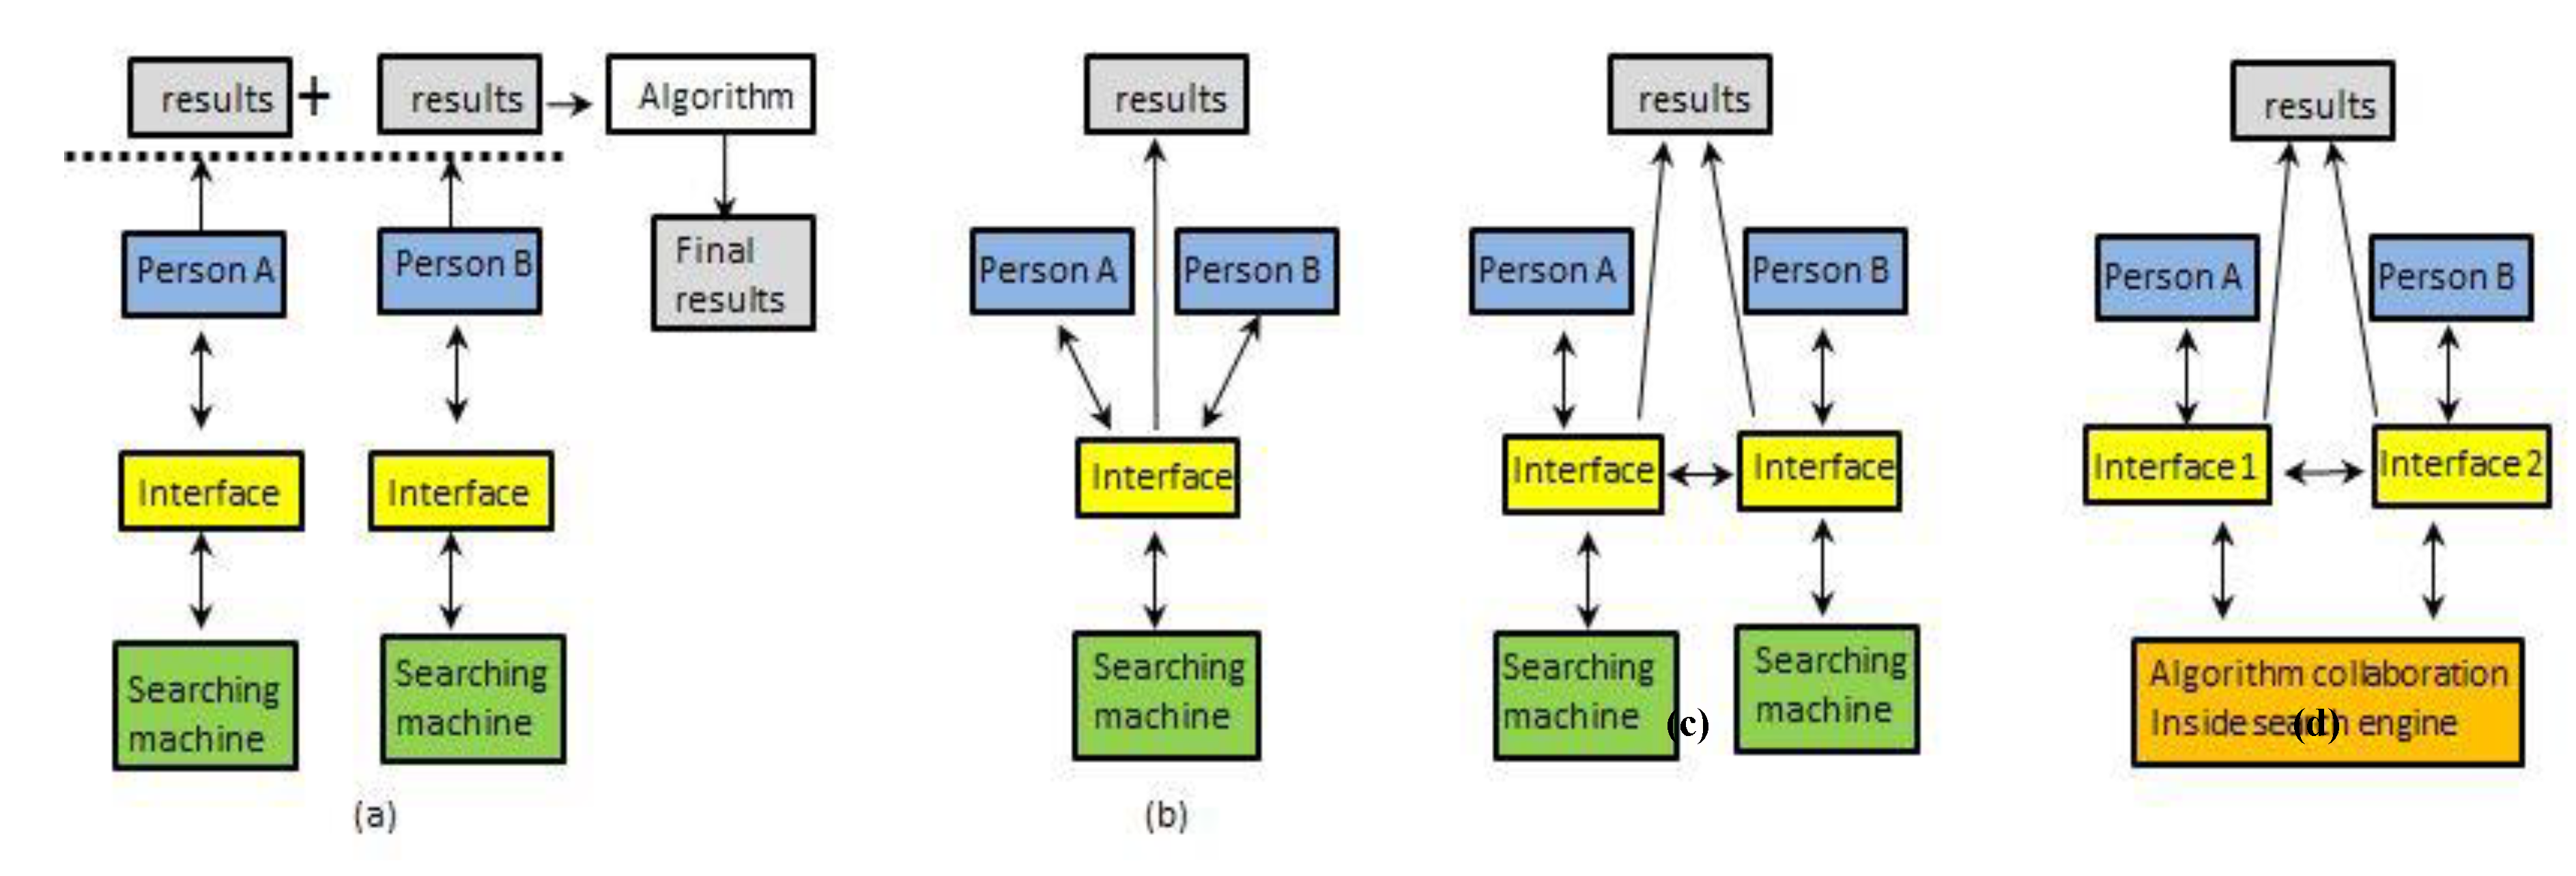
Figure 2.
Hierarchical combination process.
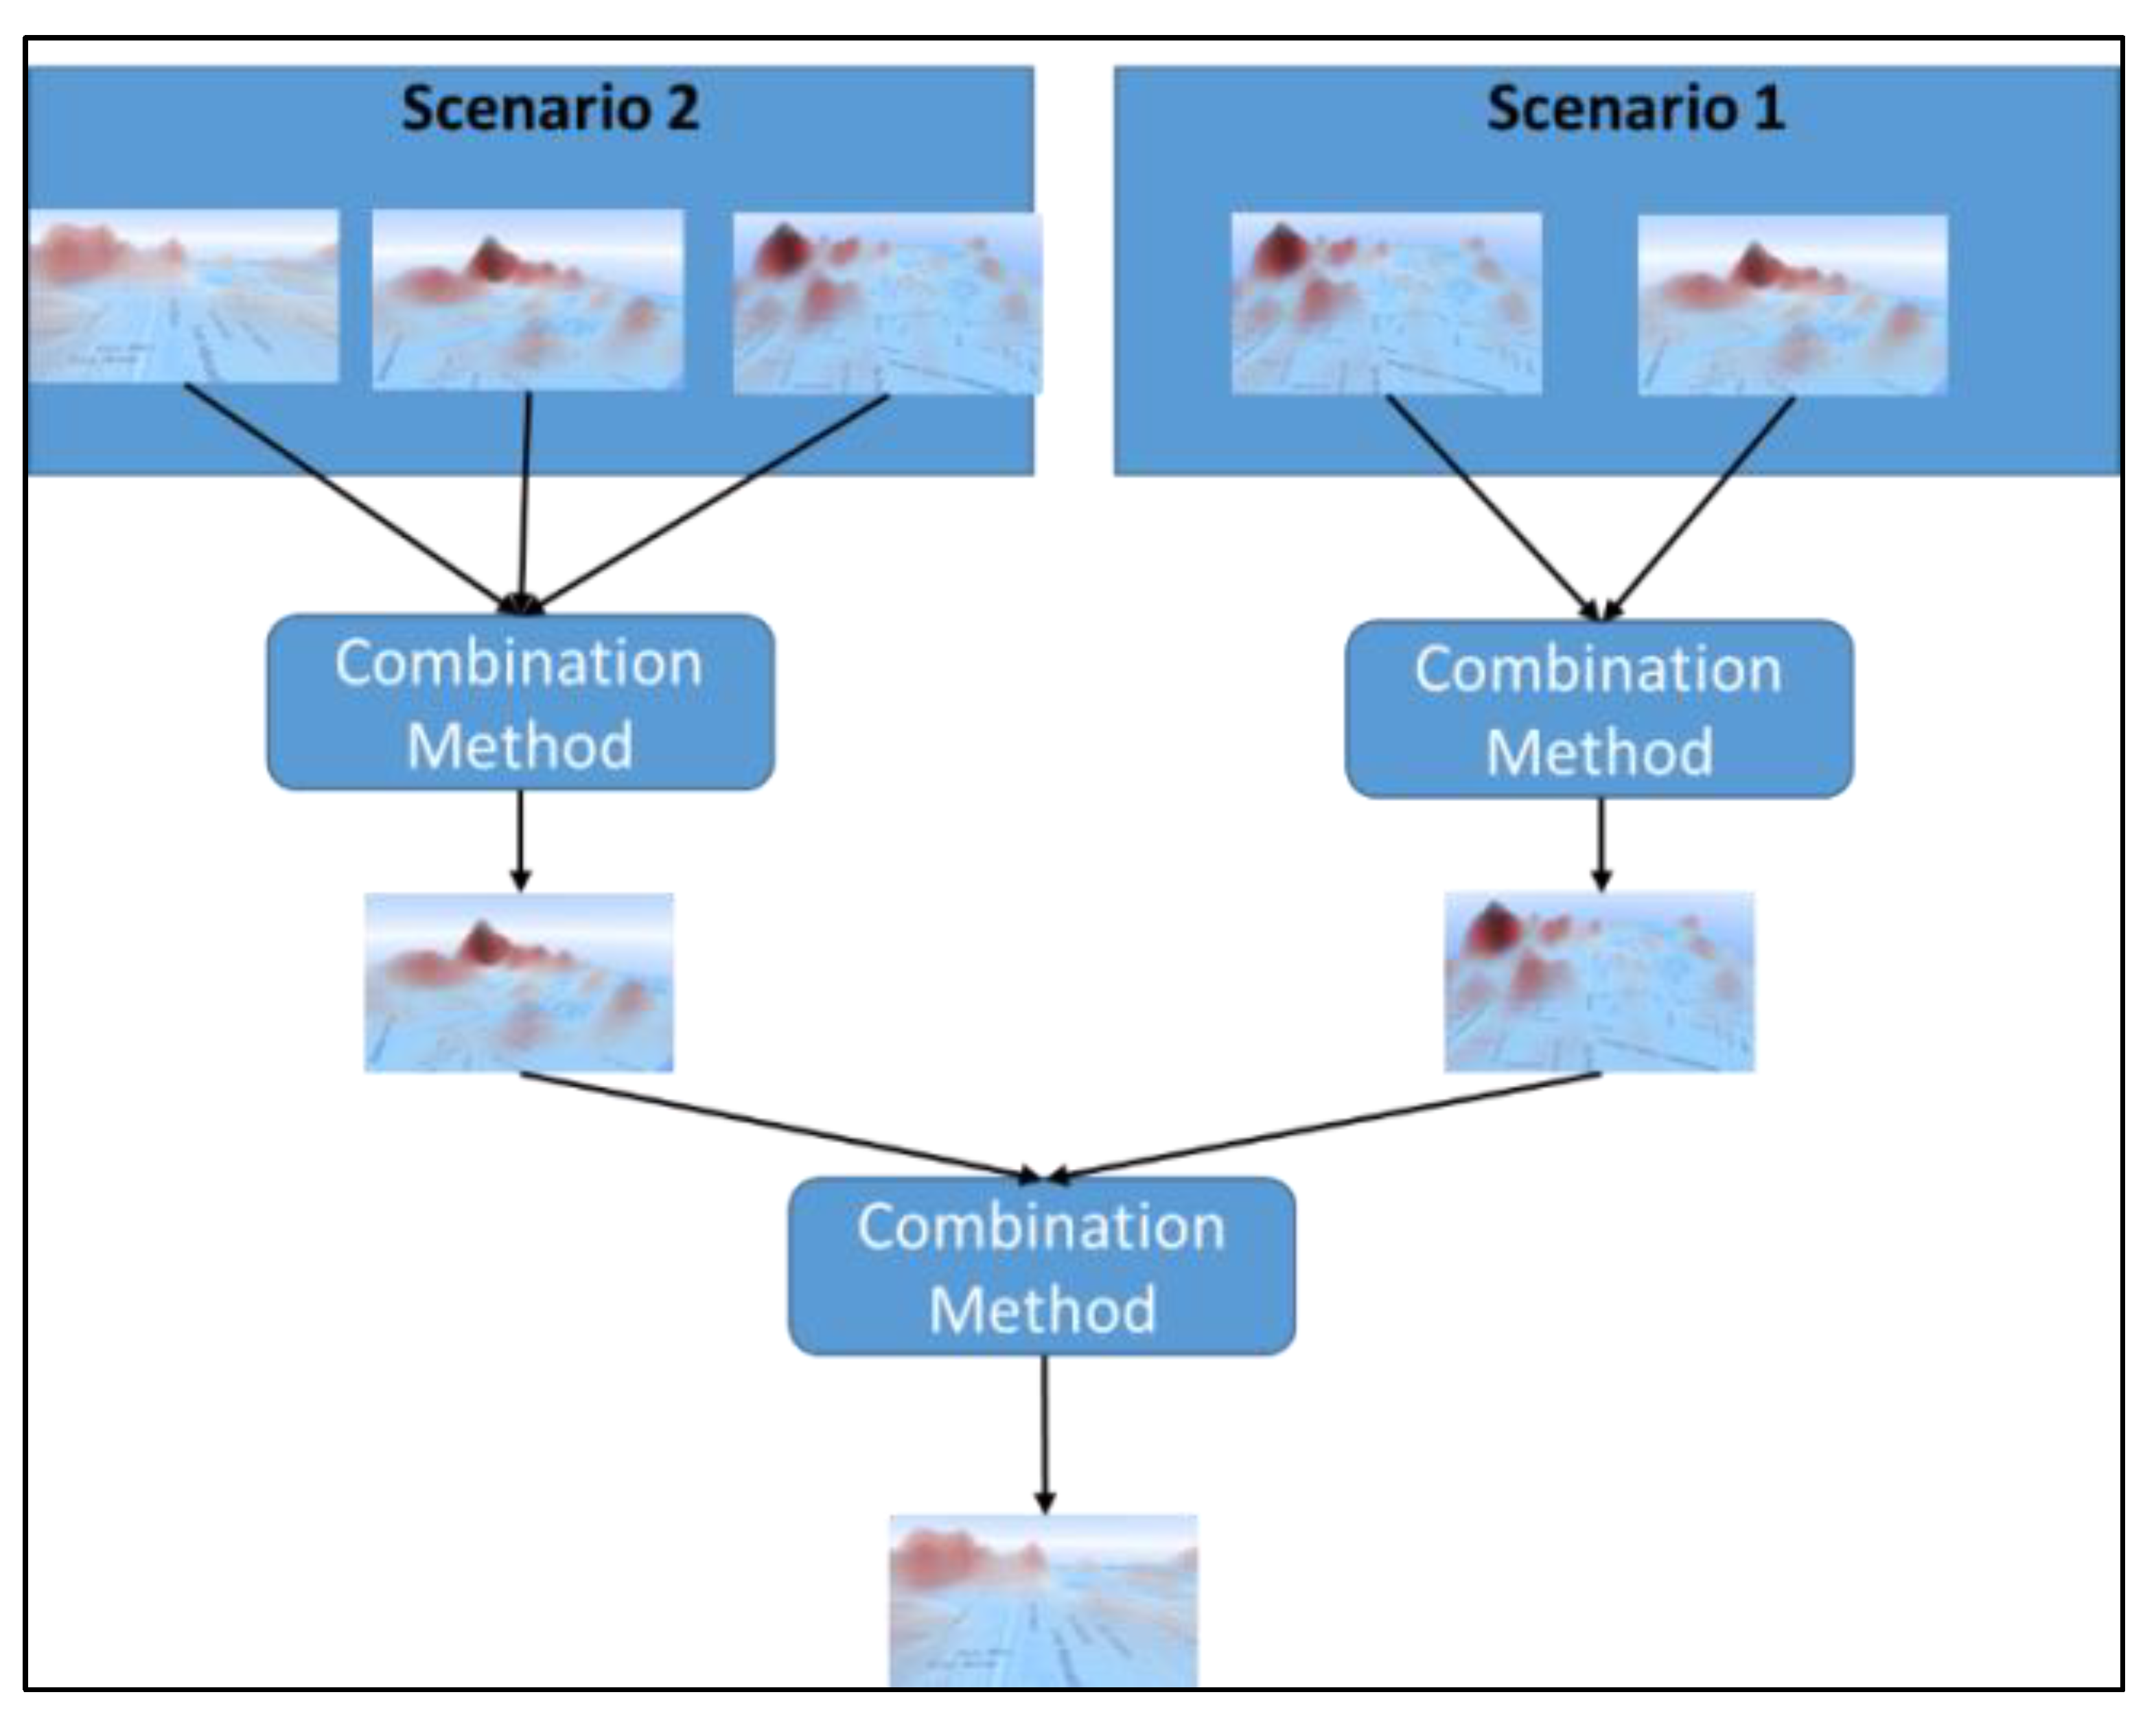
Figure 3.
Left: Scenario description and suitability map. Right: Collaborative discussion area.
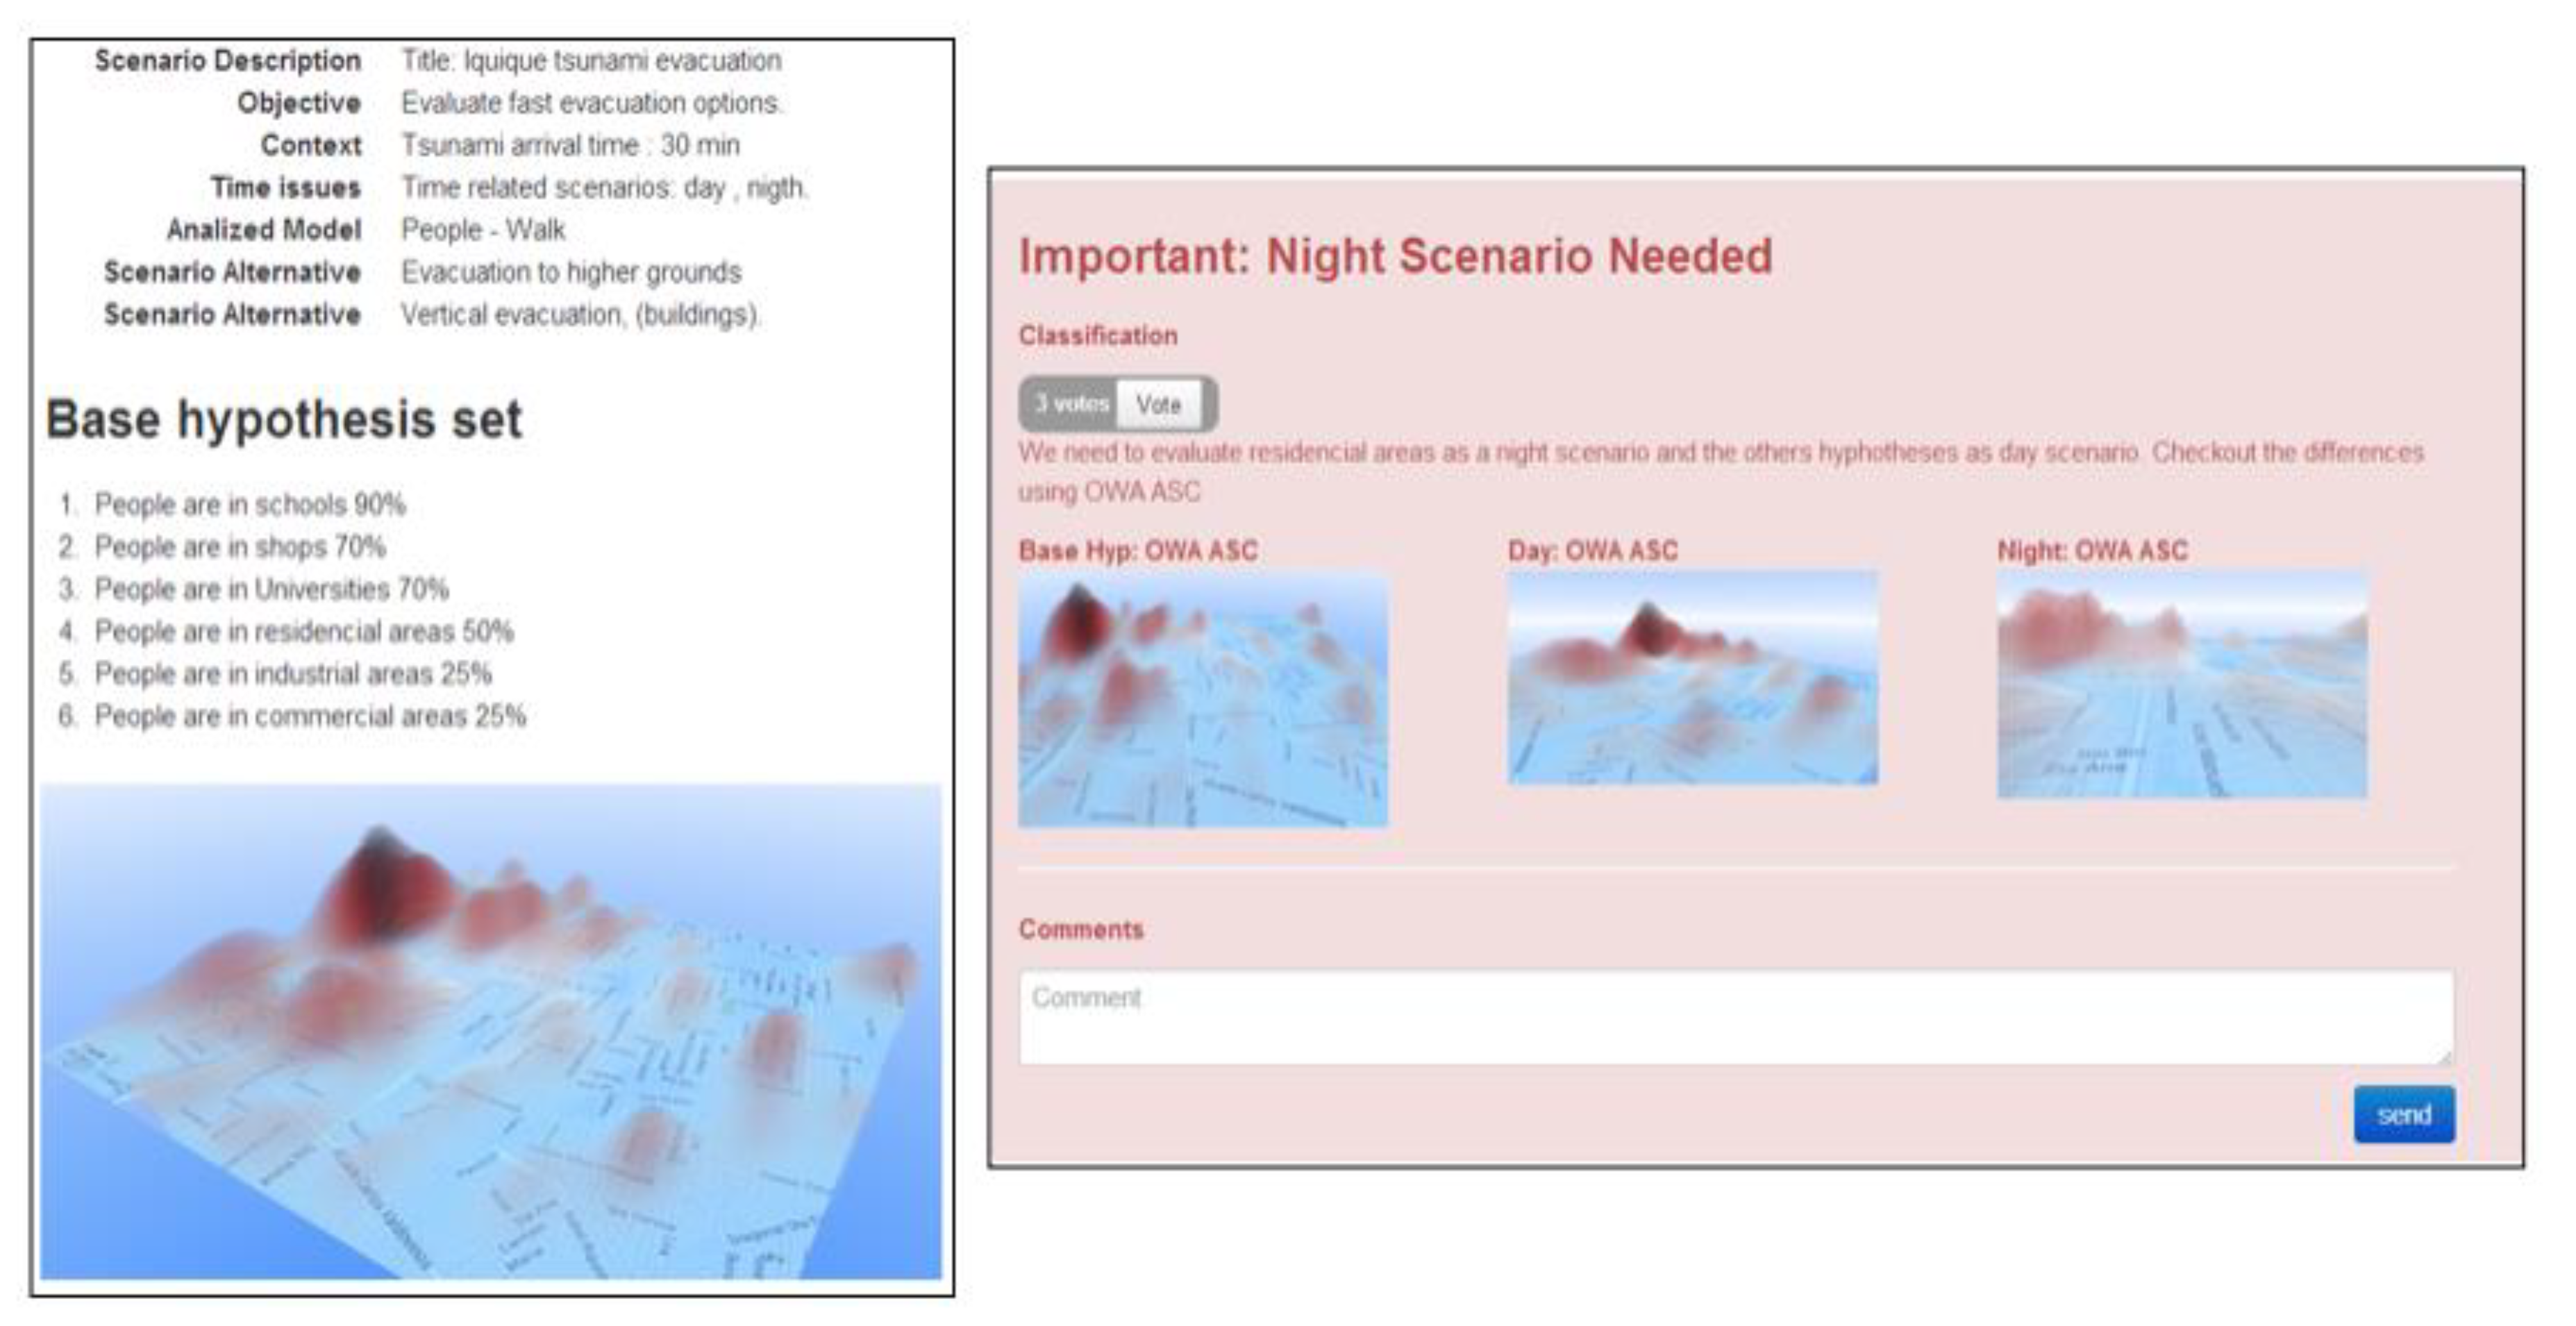
Figure 4.
Left: Creating a new contribution to the debate. The argument text is introduced into the text area on the left. On the right, the available maps are displayed, which can be dragged and dropped on the areas under the text.
Figure 4.
Left: Creating a new contribution to the debate. The argument text is introduced into the text area on the left. On the right, the available maps are displayed, which can be dragged and dropped on the areas under the text.
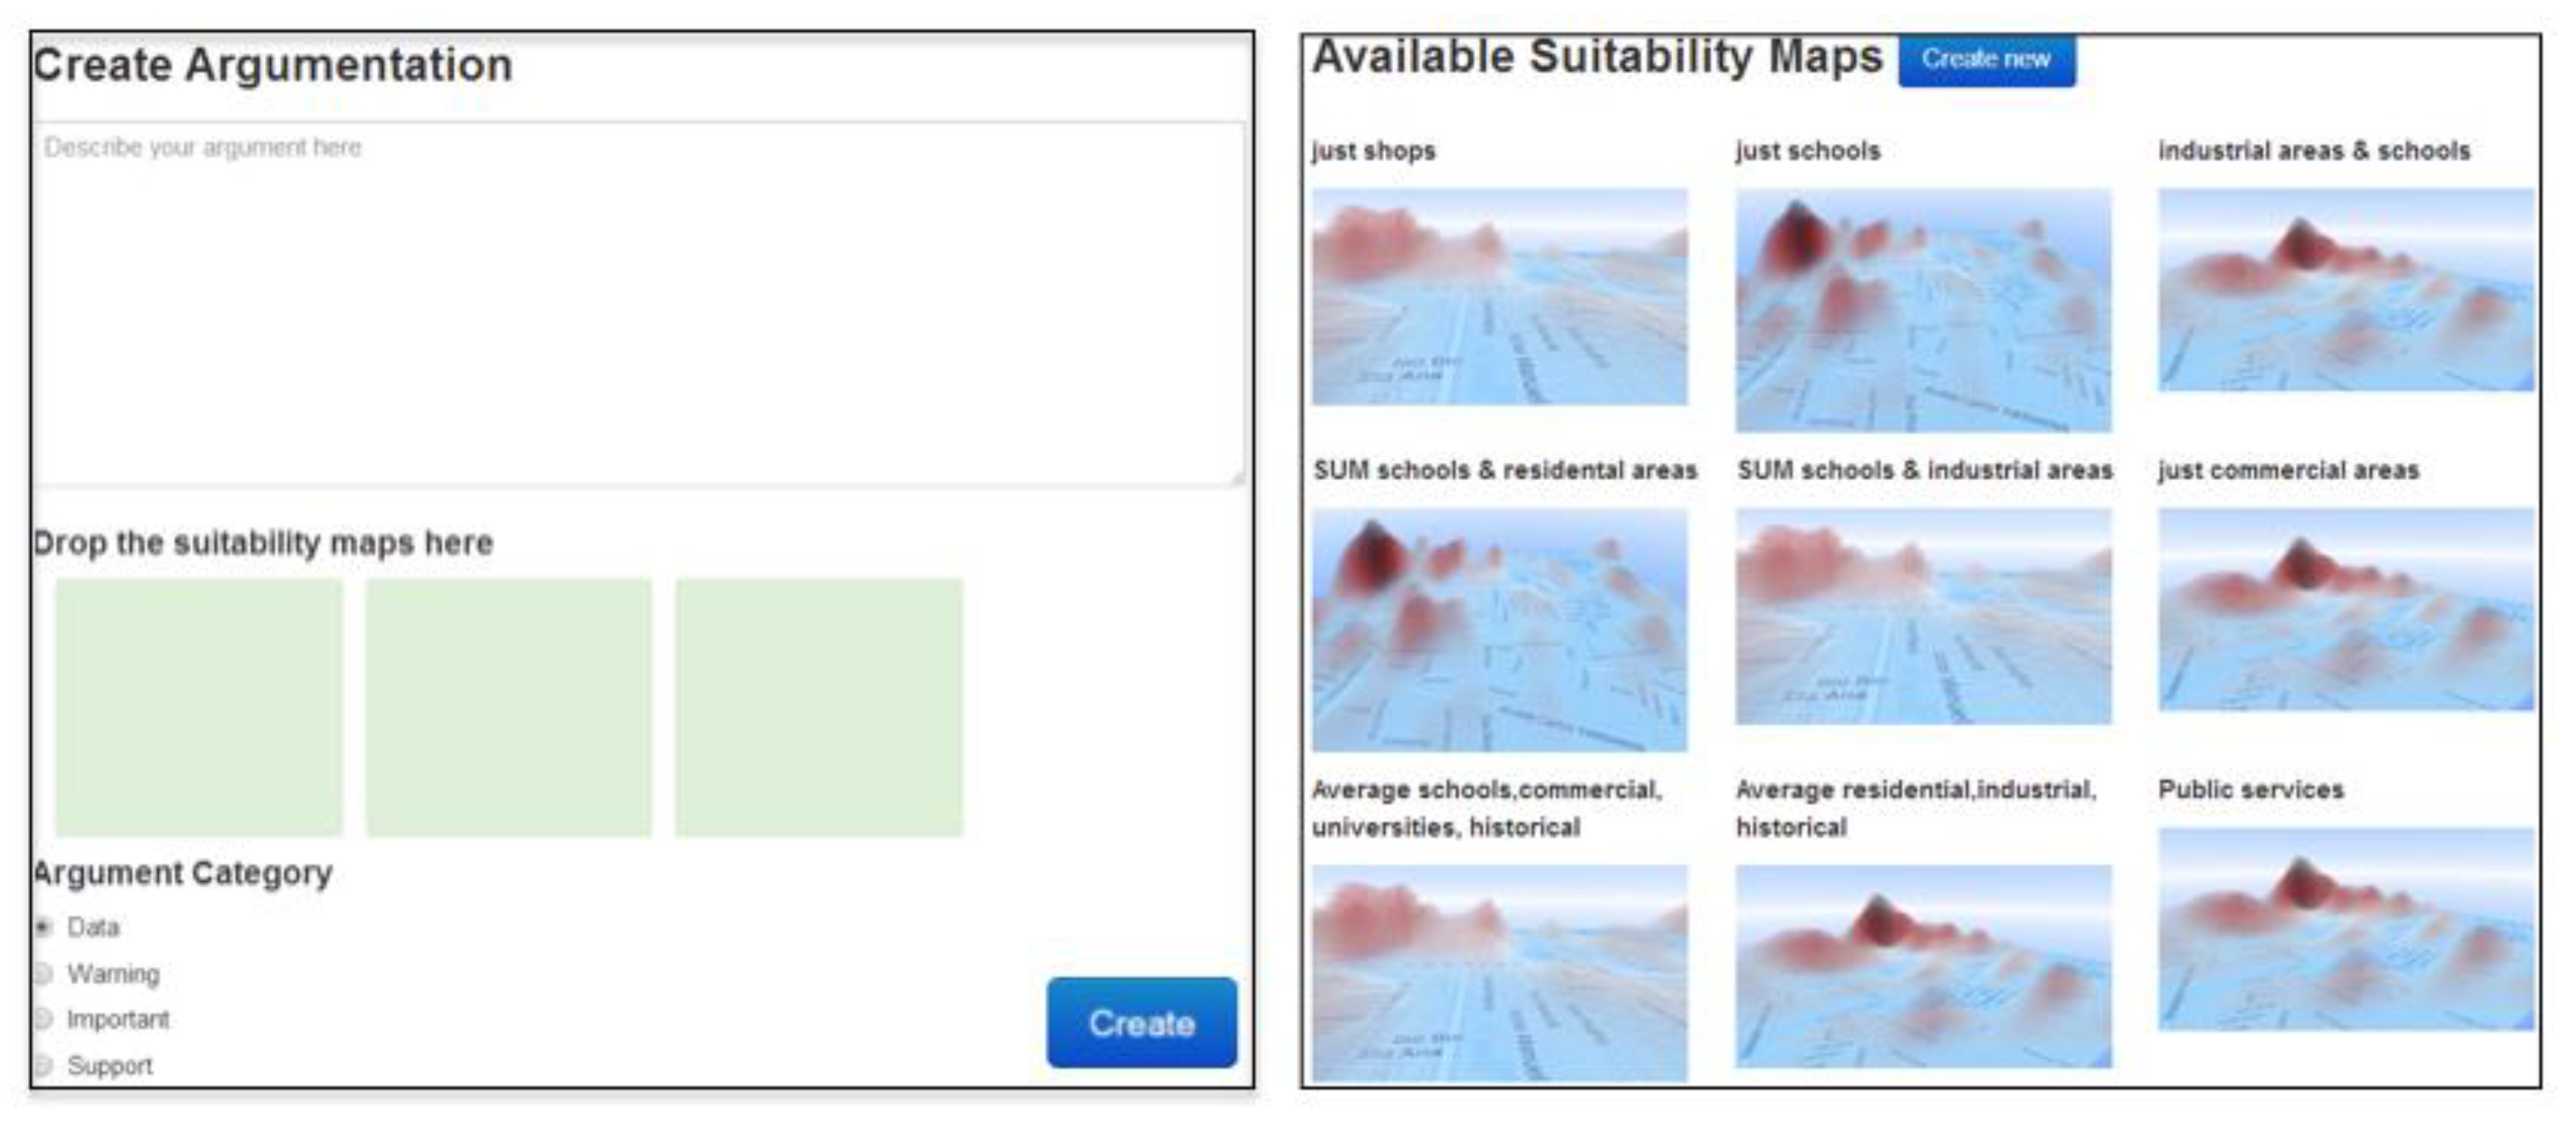
Figure 5.
Creating a new suitability map by applying operators to existing ones. The user selects which maps to combine and then presses the button labeled with the desired operation.
Figure 5.
Creating a new suitability map by applying operators to existing ones. The user selects which maps to combine and then presses the button labeled with the desired operation.

Figure 6.
(a) Inundation areas, evacuation roads, and safe places at Iquique. (b) Inundation areas, evacuation roads, and safe places at Iquique.
Figure 6.
(a) Inundation areas, evacuation roads, and safe places at Iquique. (b) Inundation areas, evacuation roads, and safe places at Iquique.
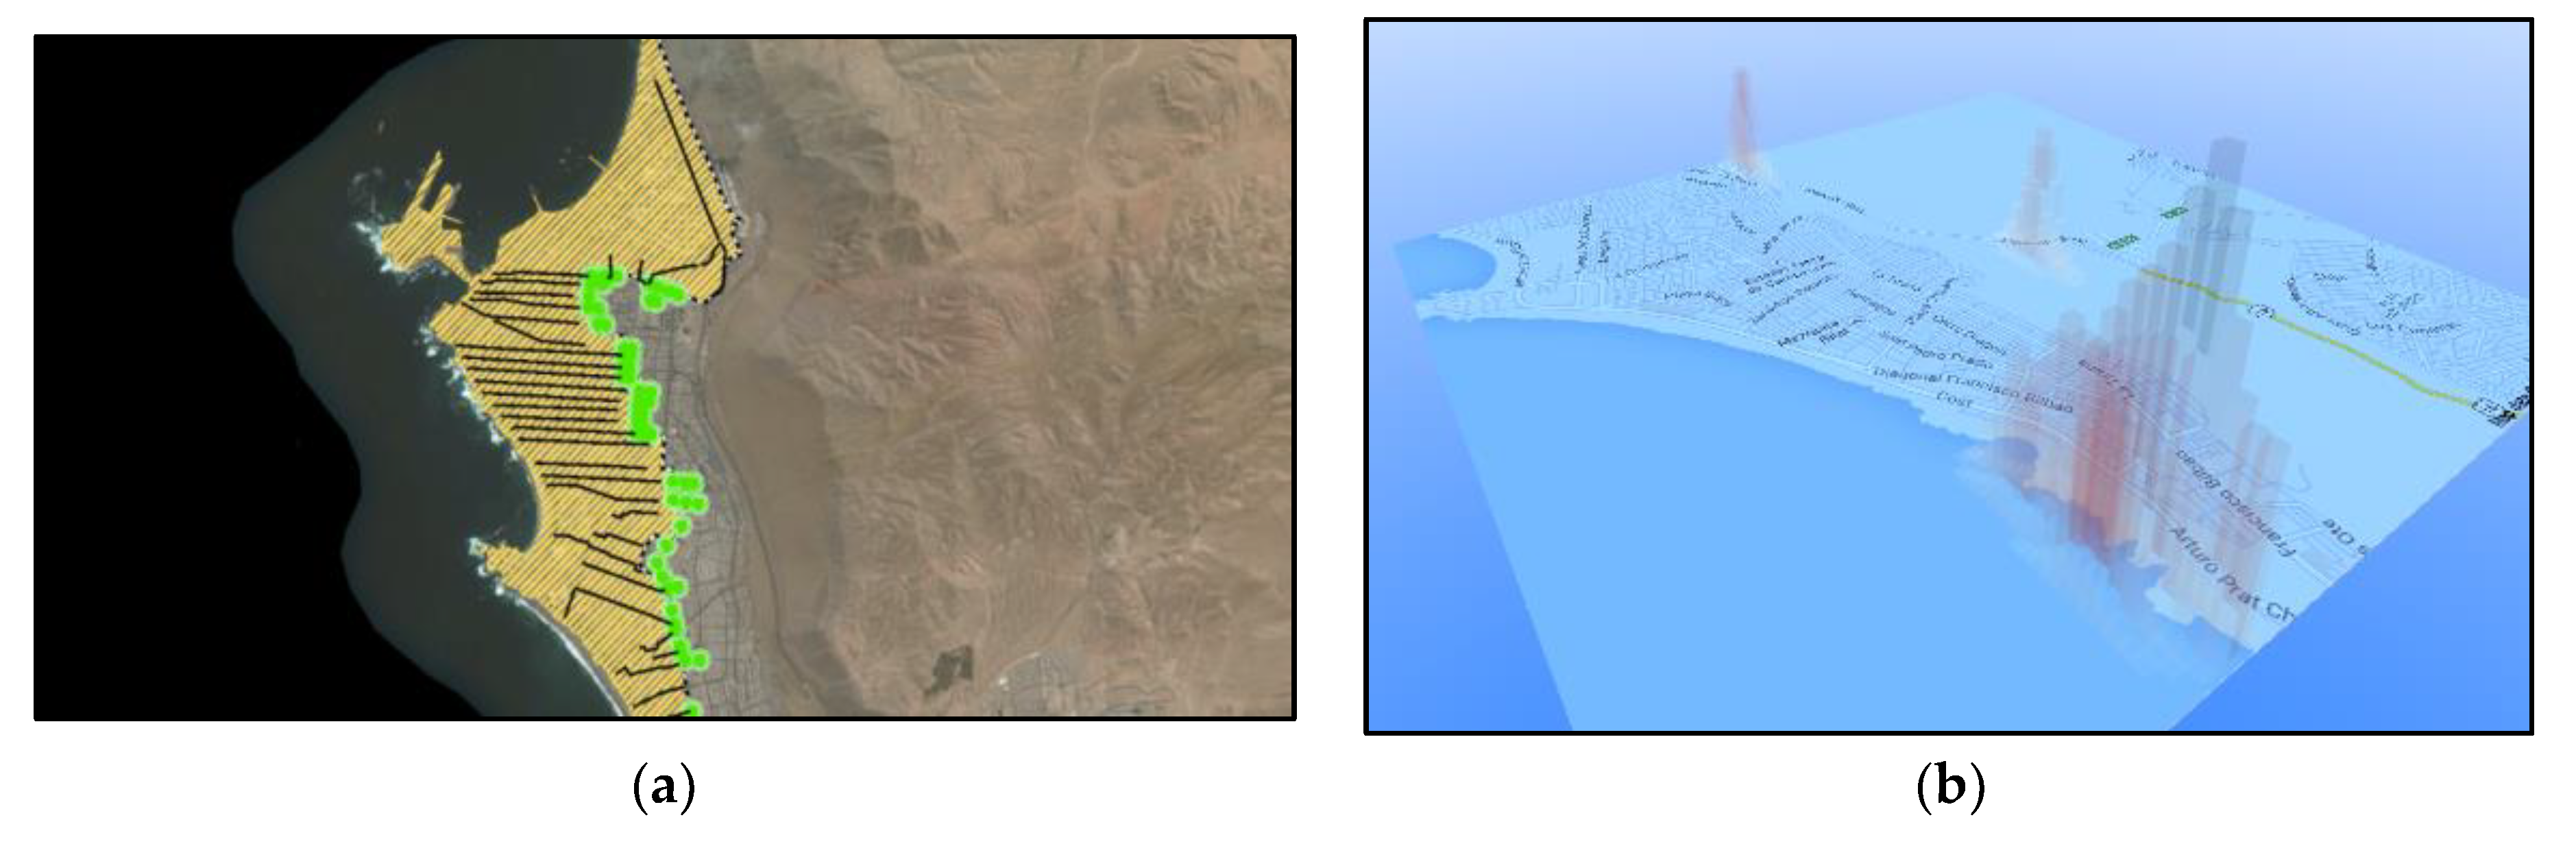
Figure 7.
(a) Scenario 3: Beach area. (b) Scenario 3: Commercial areas.

Figure 8.
People in unsafe areas.
Publisher’s Note: MDPI stays neutral with regard to jurisdictional claims in published maps and institutional affiliations. |
© 2018 by the authors. Licensee MDPI, Basel, Switzerland. This article is an open access article distributed under the terms and conditions of the Creative Commons Attribution (CC BY) license (https://creativecommons.org/licenses/by/4.0/).
Share and Cite
MDPI and ACS Style
Baloian, N.; Frez, J.; Pino, J.A.; Zurita, G. Supporting Collaborative Preparation of Emergency Plans. Proceedings 2018, 2, 1254. https://doi.org/10.3390/proceedings2191254
AMA Style
Baloian N, Frez J, Pino JA, Zurita G. Supporting Collaborative Preparation of Emergency Plans. Proceedings. 2018; 2(19):1254. https://doi.org/10.3390/proceedings2191254
Chicago/Turabian StyleBaloian, Nelson, Jonathan Frez, José A. Pino, and Gustavo Zurita. 2018. "Supporting Collaborative Preparation of Emergency Plans" Proceedings 2, no. 19: 1254. https://doi.org/10.3390/proceedings2191254