A Cyclist Traffic Simulation and Analysis Tool †
by
Leo Ordinez
*, 
Mauricio Savarro
,
Octavio Ascagorta
,
Rodrigo René Cura
,
Carlos Buckle
,
Damián Barry
and
Romina Stickar
Laboratorio de Investigación en Informática (LINVI), Universidad Nacional de la Patagonia San Juan Bosco, Puerto Madryn U9120, Argentina
*
Author to whom correspondence should be addressed.
†
Presented at the 12th International Conference on Ubiquitous Computing and Ambient Intelligence (UCAmI 2018), Punta Cana, Dominican Republic, 4–7 December 2018.
Proceedings 2018, 2(19), 1220; https://doi.org/10.3390/proceedings2191220
Published: 2 November 2018
(This article belongs to the Proceedings of UCAmI 2018)
Abstract
:The movement in favor of the use of bicycles as an alternative to mobility has been booming in the last two decades. This has been inserted within the policy of revaluation of the urban environment and improvement of the quality of life in the city. In this work we expose: an analytical model of cyclist transit, the design of a cycling simulator and a path analysis and visualization tool. The objective of this simulator is to determine the appropriate streets to install bikeways in the city of Puerto Madryn. The results of this work can be extrapolated to other intermediate cities, which present low density and high population growth, with a size of less than 150,000 inhabitants.
1. Introduction
The movement in favor of the use of the bicycle as an alternative to mobility, has been booming in the last two decades to be inserted within the policy of revaluation of the urban environment and improvement of the quality of life in the city [1]. However, this valuation has been greatly strengthened in large cities, such as European capitals and the United States. Although the movement data are relatively simple at the individual level, it implies a substantial complexity at a collective level. The current challenge involves not only detecting and extracting geometric patterns in the movement data, but understanding the interactions that cause these patterns [2]. In this regard, most of the studies on urban cyclist mobility are oriented to large cities and whose infrastructure is already established. On the contrary, the objective of this work is to address those intermediate cities, which present an accelerated growth, low population density, sustained territorial expansion and low infrastructure development (roads, streets and neighborhoods).
The situation outlined above is reinforced with a current feature in the growth of Argentine cities. The development model of these cities is characterized by low density urban expansion. This is combined with policies of densification of central areas, which produce growth towards the peripheral areas [3]. In turn, this produces an increase in trips to central and consolidated areas.
Moreover, from a gender perspective, in cities, women show a different pattern of travel than men. This pattern is characterized by more daily displacements, but covering shorter distances [4].
Several studies have sketched a classification of urban cyclist [5,6]. This characterizations can be used by planners when selecting the types of new infrastructure and by policy makers who are trying to develop policies to encourage cycling in a region. The aim is to provide guidelines for cyclist segmentation and how these may be used to explore planning strategies more likely to be effective for each cyclist typology, considering the maturity level of the cycling environment. Although these aspects were not directly taken into account in our work, the flexibility of the proposal allows to make experiments with the different schemes, considering time slots, seasons and frequency of travels.
In this work we expose: an analytical model of cyclist transit, the design of a cycling simulator and a path analysis and visualization tool. The objective of this simulator is to determine the appropriate streets to install bikeways in the city of Puerto Madryn. The results of this work can be extrapolated to other intermediate cities, which present low density and high population growth, with a size of less than 150,000 inhabitants. The software application developed can be accessed in [7].
The rest of work is organized as follows: in Section 2 related works are revised; in Section 3 the analytical model, on which the simulation and analysis tools are based, is presented; the simulation characteristics are detailed in Section 4; in Section 5 the different kinds of analysis over the generated data are presented; in Section 6 experimental results are discussed; and finally in Section 7 conclusions are drawn.
2. Related Works
In [8,9] the conceptual basis and a first implementation prototype of the present article were respectively exposed. In [8] the preliminary definitions of the model were introduced. This is, concepts like trips, journeys and centralities were presented and discussed. In [9] a prototype of trips generation and journey analyzer was sketched. The main functionalities were organized and the data model described. The work presented in this paper is more mature than the former ones, although keeping the same conceptual basis. Here, the model is refined to frame it into graph theory, including concepts such as city, cyclist mobility and a more precise computational implementation. In addition, this paper is focused on the generation and analysis of realistic data, this involves deepen in the algorithms, materials and methods used, along with the experimental results not obtained earlier.
Following a series of developments and software application that share some similarities with or present improvements to the one presented here are reviewed.
In [10] an extension on the well-known Simulation of Urban MObility (SUMO) system is presented to include cyclist traffic. In particular a modification of the internal engine to serve the purpose of realistic infrastructure modeling is emphasized. The authors claimed that such modifications should not be too complicated to implement in netconvert and demonstrated the significance of having an accurate model for the delay time of vehicles.
In [11] the authors introduce a new model to TranModeler that enables cyclists to wholly abandon the single-file car-following behavior that is assumed of cars, trucks, and buses. They demonstrate some of the statistics that can be used to quantify the value of bicycle infrastructure projects.
Another commercial product like TransModeler is the one from PTV Group [12], PTV Vissim, which assists cities and traffic planners perform all of their daily tasks: from the assessment of current demand to the simulation and evaluation of future plans and their effects on infrastructure.
An interesting work that will be tried to be follow in the future is presented in [13]. There, the authors incorporate attributes of the physical world that are of particular importance for cyclists and the decisions cyclists take. In cities like Puerto Madryn, where the infrastructure is developing at the speed the city is growing, this aspect is of considerable interest.
Also related to the behavior of cyclist, the Msc. Thesis [14] seeks to make an autonomous agent that simulates human behaviors for cyclists in a 3D simulator. As a result the author was able to simulate three different cyclist types. Additionally oriented to modeling behavior of cyclist is the work of Mereu [15]. The author observe and analyze the left turn behavior of cyclists at different types of signalized intersections in the City of Toronto with the intent of recommending what facilities are most effective. In [16] the authors present a detailed study that explores and models cyclist behavior with real naturalistic data instead of only experimental data. A main contribution of the paper is the acceleration model proposed for representing the longitudinal movement of cyclist both in men and women. In [17] the authors build a bicycle simulator and study the interaction between cyclists and other roadway users.
3. System Model
3.1. City Representation Model
It is assumed that the city is represented by a mesh of points p, where each point is an intersection of two streets (corner). Those crossroads of more than two streets, are represented considering the combinations in the form of pairs (pairwise). The union between two consecutive points is called block. Thus, it follows that , which implies indicating that the blocks have direction of traffic.
From the above, it comes that a first mapping of models has to be done. This is, going from the physical representation of the city to one of a grid, keeping streets intersected by others streets transversally. This representation reinforces the weight of streets in the model, which is very useful for people (see Figure 1a). However, a first level of abstraction would be to focus on the intersections of the streets and normalizing the dimensions of blocks (see Figure 1b). This model gives a greater relevance to intersections (i.e., corners).
In order to express the amount of people that go from one point of the city to another, the former representations are not suitable. Even more, a level of granularity like the one proposed in Figure 1b (i.e., streets) would not be appropriate. To cope with this situation, a higher level of abstraction is necessary. In this regard, a representation based on neighborhoods or zones is preferable. Generally, when analyzing mobility patterns an Origin-Destination matrix is built. This is a matrix that displays the number of trips going from each origin to each destination. Figure 1c shows an Origin-Destination matrix in the form of a graph. The thicker the arcs the higher the amount of trips between the two nodes.
An advantage of the Origin-Destination matrix is the concise way of representing the amount of trips from a place to another. However, it cannot express the path of the trip. In fact, only departure and arrivals are considered. Thus, a microsimulation model is needed in situations, like the one tackled in this paper, where the traversed streets are important.
3.2. Cyclist Mobility Model
For the case of cyclist mobility, it is assumed that a cyclist performs ntrips, with . At the same time, each trip is normalized, to adapt it to the representation of points and blocks in the mesh of the city (i.e., the shortest trip that a cyclist can perform is of one block, which is represented by two consecutive points). The normalized trip is denoted by . In this same line, the set of trips (From this point forward, the following convention for sets is assumed: ∑ represents a temporally ordered set (sequence); and ∏ represents a set that does not necessarily respect an order.) that a cyclist performs throughout his life, is expressed as
In the same way, the universal set of trips of all cyclists (N) is built
On the other hand, it is assumed that each trip consists of wsections, which are ordered sets of blocks, where is the k-th section of the j-th trip of the i-th cyclist. In this way, each path can be expressed as
Thus, each section is an ordered set of consecutive blocks , being x the amount of blocks
From Equation (3), it follows that each section has a direction of traffic. In addition, note that in one extreme a section would have the length of a block (i.e., in a stairs-like trip) and in the other it would have the size of the trip (i.e., in a straight line trip).
The journey entity, represented by , is constructed from intersections of the sections that compose the normalized trips of cyclists. This is,
From the journey definition it follows that these are the intersections of two or more sections (i.e., the blocks shared by both). The journeys could have a direction of traffic, however for the purposes of this work this characteristic is not considered.
The characteristics of the journeys will be used as the basis for the elaboration of the algorithms of search and analysis of the trips. This will allow the determination of the most suitable places to install cycle lanes. The characteristics can be defined as:
- Length: The length of a journey is defined as .
- Frequency: The frequency of a journey , denoted , is defined as the amount of times that the journey has been made and is independent of whether it was done by one or several cyclists. This is,
- Density: The density of a journey , denoted , is defined as the amount of distinct cyclists that made that journey. This is,
Centralities are places in a city that a great number of people come to. In this work, the following classification is established: Commercial, Cultural, Public building, University education, Education, Public space, Pharmacy, Financial Non-governmental organization (NGO), Health, Security, Social and Transport.
In order to determine the importance of the different centralities in a city, the following model is proposed:
Let be a centrality and its type, the Importance of centrality is defined as . In order to determine the importance of a centrality three different quantity factors are considered:
- , which is the amount of centralities of the same type as in the zone Z.
- , which is the amount of centralities of the same type as in the zones next to the zone of .
- , which is the amount of centralities of the same type as in the whole city.
With the previous parameters, three alternative ways of expressing the importance of a centrality were formulated.
These three formulas were tested against 550 centralities found in the city of Puerto Madryn, giving the results shown in Figure 2.
In order to choose a formula, a statistical analysis was performed over them. The descriptive statistics and Pearson correlation factors are shown in Table 1. From the studies, the following aspects are highlighted. Formula (5) gives a maximum and third quartile values too low, while a rather strong direct correlation with . On the contrary, Formula (7) gives a maximum value that exceeds 1. In addition, this formula gave a slightly strong direct correlation with . Since the sought formula must be limited to 1 and be very dependent on the amount of equal kind of centralities in the same zone without ignoring the influence of neighbors zone and the whole city itself, Formula (6) was chosen.
4. Simulation Parameters
The simulator was designed to take the advantages of the different models previously mentioned and to mitigate the cons of them. It can perform microsimulation of cyclists’ trips, along with Origin-Destination matrix analysis. As it was mentioned earlier, the simulator’s fundamental data structures are graphs. Briefly, its main characteristics are:
- Allowing the simulation of a large number of routes at a time.
- Generation of realistic routes, that is, not perform unnecessary turns or excessively long roads.
- Allowing the selection of origin and destination neighborhoods for the simulation. Within these neighborhoods, allowing the selection of the following modes:
- -
- Random points within the neighborhood.
- -
- Random centralities within the neighborhood.
- -
- Centralities selected by importance within the neighborhood.
- Allowing the saving of the selected data to run an experiment again.
- Simulation of trips between all the neighborhoods of the city in a synthetic way.
The simulator has two main kinds of trips generation implemented. The first one takes two neighborhoods of the city, manually selected, and generates trips between them. This solution proposes, starting from a neighborhood of origin and one of destination, calculate the shortest path between two nodes (corners) within them. The nodes are selected based on the chosen simulation mode: random corners or corners close to centralities, whether these are determined by importance or randomly. The second one automatically generates trips between every two zones of the city, based on a predefined Origin-Destination matrix.
4.1. Parametrization
To execute a simulation, the following parameters must be selected:
- Origin Zone: Neighborhood where the trip begins.
- Destination Zone: Neighborhood where the trip ends.
- Destination Zone Mode and Origin Zone Mode: The simulation mode from each zone:
- Random point: A random corner is selected within the zone.
- Random centrality: The corner closest to a random centrality within the zone is selected.
- Weighted centrality: The corner closest to a weightingly selected centrality is chosen. (Centrality weighting is explained in the following subsection.)
- Number of Trips: It is the number of different trips that want to be simulated between both zones. For each trip, two randomly selected origin and destination points within each zone are chosen.
- Time Slot: It is the time slot between which the trip is made. The exact time will be selected randomly within this time slot. The options are: 6 a.m.–9 a.m., 9 a.m.–1 p.m., 1 p.m.–4 p.m., 4 p.m.–9 p.m., 9 p.m.–6 a.m.
- Daily Frequency: It is the maximum daily frequency in which the trip is made. A random value is selected between 1 and the maximum selected (up to 4), indicating the number of times per day a user makes the trip.
- Density: It is the number of different users that make the same trip. A random value between 1 and the maximum is selected (up to 20).
- Weekly Frequency: These are the days of the week in which the trip takes place.
- Start date and End date: These are the dates that identify the start and end period of the simulation. The trips are created accordingly to the selected days.
Centrality Weighting
Once the formula of Equation (6) was chosen, an algorithm (see Algorithm 1) to select a random centrality based on its importance (weight) in the city of Puerto Madryn is developed.
| Algorithm 1: Randomly selecting a weighted centrality. |
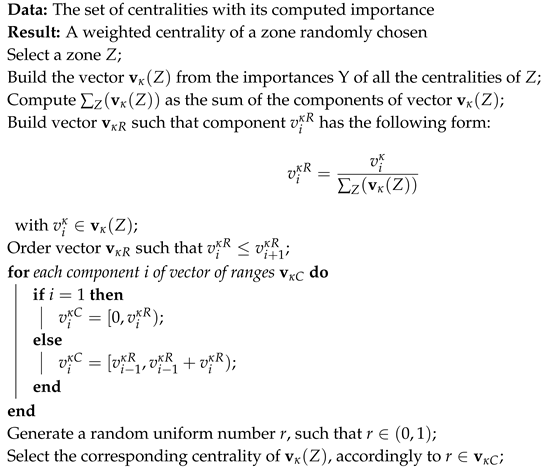 |
Example 1.
Suppose a zone Z chosen.
Step 2:
Step 3:
Step 4:
Step 5:
Step 6:
Step 13:
Step 14:The chosen centrality is the one corresponding with , that is of
4.2. Simulation Outputs
The experiments performed with the simulator generate two important artifacts. The first is a Datalog, which stores all the parameters selected in the experiment and the seed used to randomize in the cases that are needed. In this way, there is the option to rerun a simulation to repeat the experiment. The second is a statistical report of the simulation, in the form of a PDF file. This document, designed for a later analysis of the experiment, keeps the following data:
- Total number of simulated routes.
- Mean and variance of the frequency.
- Maximum and minimum frequency values
- Mean and variance of density.
- Maximum and minimum density values.
- Total number of cyclists used for the simulation.
4.3. Full Simulation
In order to build a full simulation between all the neighborhoods of Puerto Madryn, a model based on multiple sources of information was developed. There are three main sources of information, with their characteristics:
- (A)
- Surveys conducted to cyclists of Puerto Madryn in 2017.
- Does not cover all neighborhoods or the population of the city.
- Provide source-destination data.
- The number of surveys reaches a barely minimum number of samples required for the survey to have statistical validity [18].
- (B)
- Population data of Puerto Madryn neighborhoods according to the 2010 census [19]
- The information is rather outdated.
- (C)
- Data collected through the mobile application PMYLap [20], which is a complementary project to the one presented in this article.
Based on the above, and in order to establish the criteria for the generation of synthetic trips, the Algorithm 2 is proposed.
| Algorithm 2: Full Origin-Destination Matrix Generation. |
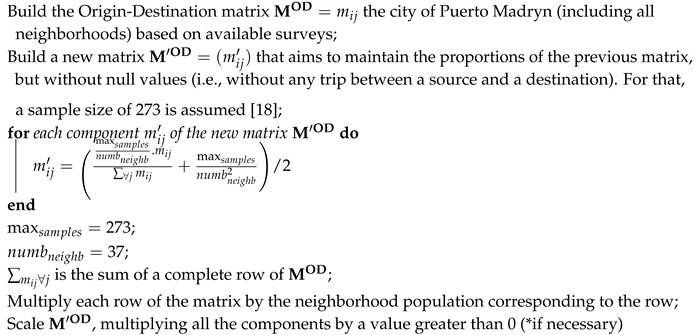 |
The result of Algorithm 2 is shown in Figure 1c.
5. Simulation Analysis
From the previous section, two main experiments can be performed with the simulator. In the first place, the generation of random trips between individual zones. And in the second, a full generation of trips considering all the neighborhoods of the city against each other.
5.1. Journey Analysis
The calculation of journeys is one of the most important features of the application and the main contribution of value to the user. Its use is decisive in order to make a final decision regarding where to locate the bicycle lanes in the city.
A journey is the intersection of two or more routes. Therefore, for the calculation of all journeys, it is necessary to find a way to identify all the intersections of the trips. In addition, the journeys have a series of associated data (frequency, density, etc.), which help to find the most traveled paths in the city. Consequently, its calculation must be made contemplating both the intersections of the trips and the data associated with them.
To obtain all the possible journeys, the following solution was proposed. First, all the streets of the city were divided into blocks. Then, those subdivided streets were intersected with all the trips of the system. In this way, the number of times each block of a street is traveled by a cyclist can be counted. Additionally, their extra data can be taken into account.
This intersection gives information about the number of trips that cross each block of the city. To weight them, the frequency values and density were used, as described in the Section 3.2. Note that, after this process, the length of each obtained journey is equal to 1 (i.e., ). At this point, there are only journeys of one block in length, all valued according to their frequency and density. To calculate the weight (importance) of each path, what is stated in [8] is used.
Finally, with the weighted journeys, OpenLayers functionalities were used to display them on a map. In order for visualization to directly help decision-making, a function was implemented in which the weight of each journey affects its opacity. In this way, the most important journeys stand out over the less important ones.
The opacity of each path is calculated from its weight with the following formula:
with,
- weight: Current journey weight
- opac_importance: a value between 0.01 and 0.1 that deepen the difference between the largest and smallest weights. The closer this value of 0.1, the more difference there will be between small and large weight values. Thus, making the low weight journeys almost imperceptible and highlighting those of high weight. This range of values was obtained experimentally.
- max_weight: Highest weight among all calculated trips.
Journey Analysis Parametrization
When calculating the journeys, it was decided to allow the manipulation of a series of parameters that will allow the analyst to tune up different aspects of the analysis.
- Zone: It allows the selection of a zone and only calculate the journeys generated by trips that cross it. It is possible not to select any area and calculate the journeys over the entire city.
- Weighting: It allows the visualization of only those journeys that have a weight between the requested range.
- Minimum Length: It allows to calculate the journeys taking into account only the trips with a distance traveled greater than the selected one.
- Time Slot: It allows to calculate the journeys taking into account only the trips taken during the selected time slot.
- Frequency and density values: They allow the analyst to distribute the density and frequency values according to his own criteria. Between both values it must add 1.
- Opacity Level: Once the journeys have been calculated, this option allows to repaint them with a new value in the opacity level. The higher this value, the greater the difference between the most important journeys and the lesser ones.
6. Experimental Results and Discussion
This section details the experiments carried out using the main functionalities of the system. In particular, tests are exposed and an analysis of them is described. This analysis of the results was developed based on the data produced by the simulator, that is, they are synthetic data.
6.1. Specific Trips Generation
First, as can be seen in Figure 3a, the trips were generated between the referenced zones (origin and destination). The trips are seen in light blue between the zones. Having indicated the type of destination as Random Centrality, the generated trips ended in a centrality. This can be verified in Figure 3b. The number of generated trips can also be observed in Figure 3c.
The data that was generated in this simulation was recorded in the application database. It is important to mention that it is not possible to predict the exact number of trips that will be generated, since the parameter Density expresses the maximum and functionally, within the system, is random. In this case, the amount of trips generated was 55.
6.2. Journey Analysis Experiment
The objective of this experiment is to determine journeys from the trips present in the system. Likewise, it seeks to show the calculated journeys and demonstrate the usefulness of the filters implemented. For this experiment, 730 trips were randomly generated between different neighborhoods in the city.
In a first experiment, no parameters were specified to filter, only the journeys were calculated based on all the trips and the data associated with them. The default values of the journey analyzer were used (i.e., no filtering and default values for the weight of frequency and density values).
In this case, since there is no type of filtering, you can see a rather large number of journeys with different weight. In Figure 4 it can be seen that the paths are distributed by different zones. Through the levels of opacity, it can be deduced that there are many routes that cross the downtown area.
With the same set of trips, a second experiment was conducted. For this test the data of the parameters were the ones showed in Figure 5a.
In Figure 5b you can see that the journeys are a little more concentrated, this is because a particular zone was selected. It should be noted that the selection of an zone does not refer to the routes that are within the area, but to all the journeys that are made up of routes that pass through that area.
Remark 1.
As can be seen in Figure 4 and Figure 5b some journeys within a same street have a different opacity, showing an apparent dotted line (i.e., like a discontinued path along a street). This is because the trips considered may not follow the street continuously but turn in a corner to follow another street. Thus, the intersection of trips shows darker the sections of the streets that this two or more trips actually coincide.
6.3. Full Case Experiment
To carry out this experiment, synthetic trips were generated based on the Origin-Destination matrix of Figure 1c. For space reasons, this matrix is not shown in this work, but represents a Cartesian product of travels between all the neighborhoods of the city of Puerto Madryn. The original matrix has 574,462 trips in total, with 43 and 12,255 being its minimum and maximum values, respectively.
As explained in Section 4.3, the matrix has complete but skewed information. This is because the main input that was taken into account were surveys of cyclists. This information is of high empirical value and adequately reflects reality. However, the number of surveys conducted was not enough nor covered all the neighborhoods of the city. Even so, taking into account this situation, we have a first approximation to the reality of cyclist transit in the city.
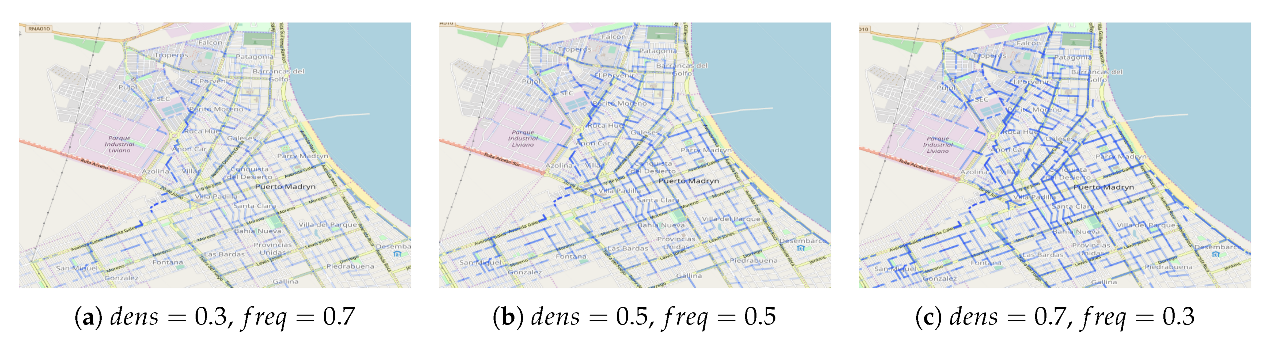
The actual amount of trips generated was 669,328 this is because some random parameters, such as density, increased the minimum number required. In Figure 6 the resulting journeys with different opacity levels based on frequency and density are shown. Based on the O-D matrix and the obtained journeys, from a local perspective, it can be sure that those obtained journeys are valid.
Note that the ability of the journey analyzer of allowing the dynamic variation of the importance given to frequency or density within the weighting formula becomes very important at this point. With it, a decision maker would have the capacity to experiment based on alternatives that policy makers evaluate.
6.4. Discussion
All the filtering parameters for the calculation of journeys are internally related to the characteristics of the trips, that is, to the data that determine the parameters of the trips simulator. For this reason, if obtaining paths is to be performed based on the data generated by the simulator, it is important that this is as close as possible to reality to get results that actually reflect reality.
The difference in opacity in the color represents different cyclist transit levels. In other words, the darker journeys will be potential candidates for the installation of bicycle lanes. Here the ability to adjust the level of opacity becomes important, to highlight the differences between more and less important journeys.
7. Conclusions
The movement towards the encouragement of cyclist mobility has gained weight within last decades specially in central capitals and big cities around the world. Several studies have deepen different aspects of cyclist mobility, from macroscopic simulation to the behavior of cyclist or a classification of them based on their riding speed.
In this paper, a model for the generation of cyclist trips in a city and their analysis through journey determination was proposed. The model showed to be parameterizable and flexible to cope with different kinds of experiments, like weather-based travels, working travels or leisure ones. The generation of synthetic trips was proposed for two main experiments. In the first place, to generate specific trips from a zone to another. And on the second, to obtain the Cartesian Product of trips for all the zones in a city. Several features have been deeply discussed regarding the second alternative, which involves a transformation from a map view of a city to a graph. This eased the manipulation of the Origin-Destination matrix to adjust it to include neighborhoods without traffic information.
Once the trips where generated, an analysis can be performed over them. The core of this functionality is the determination of journey, which are intersections of trips. This simple model allows to visualize in a map those journeys by adjusting the opacity based on the cardinality of the intersections. Since the objective of this work is to build a tool that aids decision makers and planners of a city to determine where to install bicycle lanes. In particular, the case study proposed was the city of Puerto Madryn, in Argentina. However, this work can be extrapolated to address those intermediate cities, which present an accelerated growth, low population density, sustained territorial expansion and low infrastructure development (roads, streets and neighborhoods).
As future works we will try to include another aspects in the simulator like characteristics of the terrain, weather and gender of the cyclist. In addition, an optimization of the database queries will be explored as a main limitation of performance. A final aspect to be considered in the future is related to using the system for other purposes related to urban planning, like planning of paving and/or lighting works, health/recreation circuits, service areas, among others.
References
- Soledad, M.; Paz, D.; Vázquez, D. La bicicleta en la movilidad cotidiana: Experiencias de mujeres que habitan la Ciudad de México. Rev. Transp. Territ. 2017, 16, 112–126. [Google Scholar]
- Orellana, D.; Hermida, C.; Osorio, P. Comprendiendo los patrones de movilidad de ciclistas y peatones. Una síntesis de literatura. Rev. Transp. Territ. 2017, 16, 167–183. [Google Scholar]
- Aón, L.C.; Giglio, M.L. Patrones modales de movilidad y desarrollo urbano no planificado en la ciudad de La Plata. Rev. Transp. Territ. 2017, 17, 117–144. [Google Scholar]
- Díaz, R.; Rojas, F. Mujeres y Ciclismo Urbano: Promoviendo PolíTicas Inclusivas de Movilidad en América Latina; Technical Report; Banco Inter-Americano de Desarrollo: Washington, DC, USA, 2017. [Google Scholar]
- Damant-Sirois, G.; Grimsrud, M.; El-Geneidy, A.M. What’s your type: A multidimensional cyclist typology. Transportation 2014, 41, 1153–1169. [Google Scholar] [CrossRef]
- Félix, R.; Moura, F.; Clifton, K.J. Typologies of Urban Cyclists. Transp. Res. Rec. J. Transp. Res. Board 2017, 2662, 125–133. [Google Scholar] [CrossRef]
- LINVI. Cycleyzer. 2018. Available online: http://ciclovias-if012.ddns.net:32000/ (accessed on 18 September 2018).
- Ordinez, L.; Barry, D.; Torrico, A.; Mallon, E.; Devia, J.L.; Abella, L.; Alamo, N. Modelo de Análisis para el Dominio de Tránsito Ciclista. Available online: http://sedici.unlp.edu.ar/handle/10915/63863 (accessed on 18 September 2018).
- Ordinez, L.; Barry, D.; Torrico, A.; Mallon, E.; Devia, J.L.; Abella, L.; Alamo, N. A Bike Traffic Analyzer for the Determination of Cycle Lanes. In Proceedings of the Conferencia Internacional de la Sociedad Chilena de Ciencia de la Computación (SCCC 2017), Arica, Chile, 16–20 October 2017. [Google Scholar]
- Blokpoel, R.; Joueiai, M.; Blokpoel, R.; Joueiai, M. Bicycle Modelling in SUMO for Accurate Traffic Simulation. Available online: http://www.xcycle-h2020.eu/Resources/Files/Bicycle_SUMO.pdf (accessed on 18 September 2018).
- David Gerstle, D.M.; Yang, Q. Microsimulation of Bicycles for Planning and Design. Technical Report, Caliper Corporation. 2013. Available online: https://www.caliper.com/Library/micro-simulation-of-bicycles-for-planning-and-design.htm (accessed on 18 September 2018).
- Biking & Walking. Available online: https://www.ptvgroup.com/en-us/solutions/topics/biking-walking/ (accessed on 18 September 2018).
- Ziemke, D.; Metzler, S.; Nagel, K. Modeling bicycle traffic in an agent-based transport simulation. Procedia Comput. Sci. 2017, 109, 923–928. [Google Scholar] [CrossRef]
- Abrahamsen, R.N. Simulating Cyclists in a Simulator with the Use of Behaviour Trees. Master’s Thesis, Norwegian University of Science and Technology, Trondheim, Norway, 2016. [Google Scholar]
- Mereu, A. Analyzing the Behavior of Cyclists at Intersections to Improve Behavior Variability within Micro-Simulation Traffic Models. Master’s Thesis, University of Waterloo, Waterloo, ON, Canada, 2015. [Google Scholar]
- Ma, X.; Luo, D. Modeling cyclist acceleration process for bicycle traffic simulation using naturalistic data. Transp. Res. Part F Psychol. Behav. 2016, 40, 130–144. [Google Scholar] [CrossRef]
- Kwigizile, V.; Oh, J.S.; Ikonomov, P.; Hasan, R.; Villalobos, C.G.; Kurdi, A.H.; Shaw, A. Real Time Bicycle Simulation Study of Bicyclists’ Behaviors and Their Implication on Safety; Technical Report; Western Michigan University: Kalamazoo, MI, USA, 2017. [Google Scholar]
- Perfil Ciclista 2017. 2018. Available online: http://transporteativo.org.br/ta/?page_id=9762 (accessed on 18 September 2018).
- Argentina, I. Unidades Geoestadísticas. 2018. Available online: https://www.indec.gov.ar/codgeo.asp (accessed on 18 September 2018).
- Aguirre, A.; Ordinez, L. PMYLap. 2018. Available online: https://play.google.com/store/apps/details?id=com.linvi.ariel.pmylap (accessed on 18 September 2018).
Figure 1.
Mappings of models of a city.
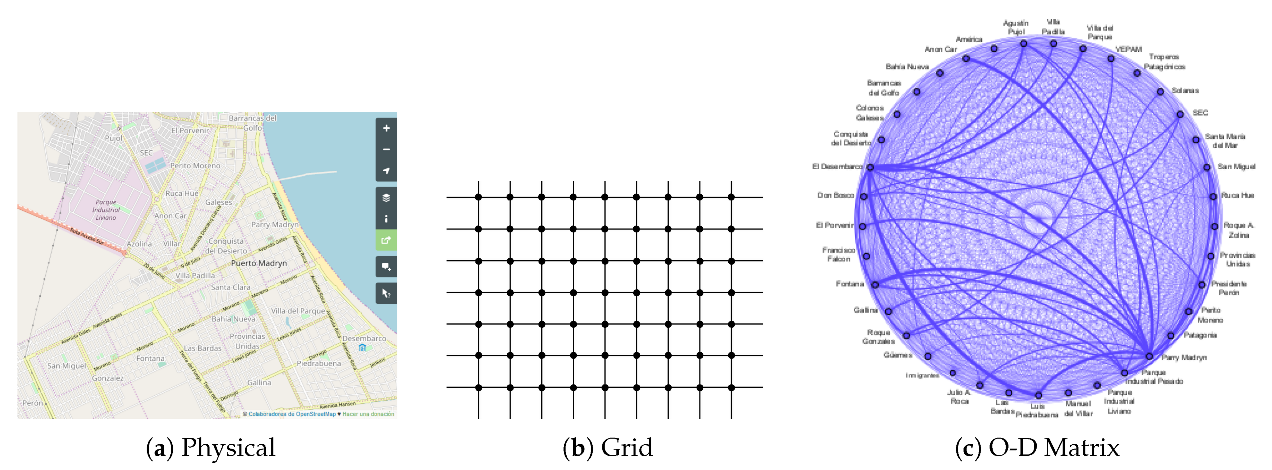
Figure 2.
Values of importances for the given formulas. ▪: Formula (5)—⧫: Formula (6)— ▾: Formula (7).
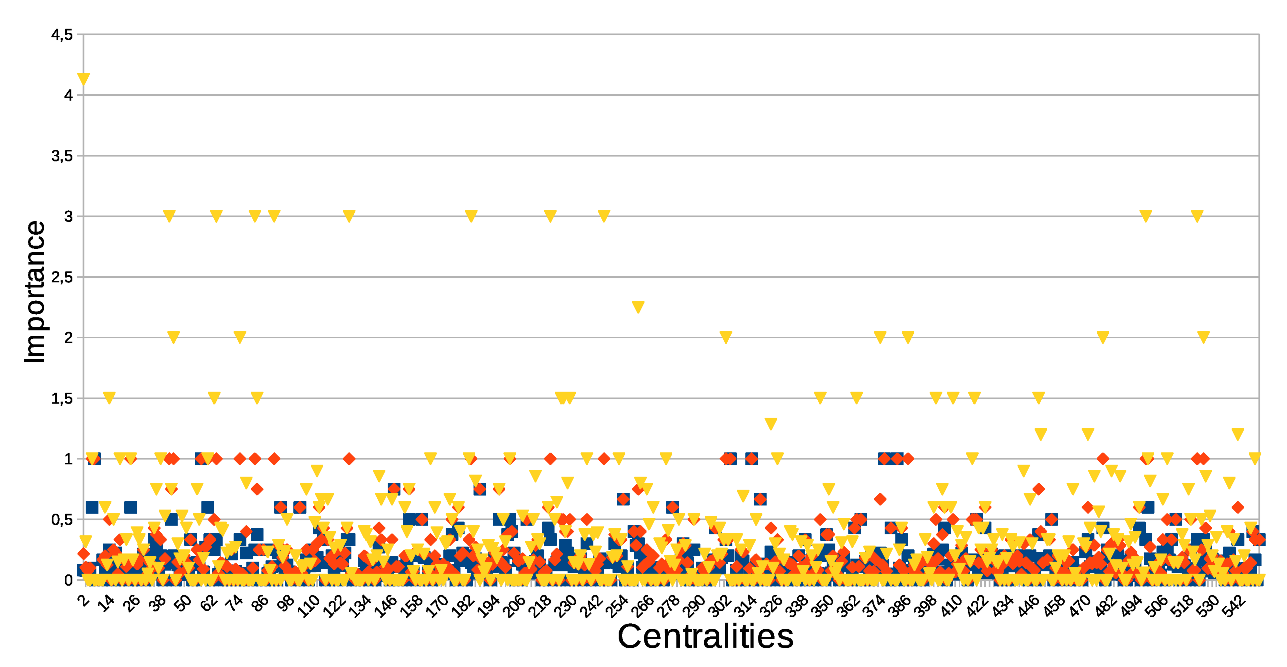
Figure 3.
Visualization of generated trips. (a) Origin-Destination Zones; (b) Destination Centralities; (c) Origin of Trips.
Figure 3.
Visualization of generated trips. (a) Origin-Destination Zones; (b) Destination Centralities; (c) Origin of Trips.
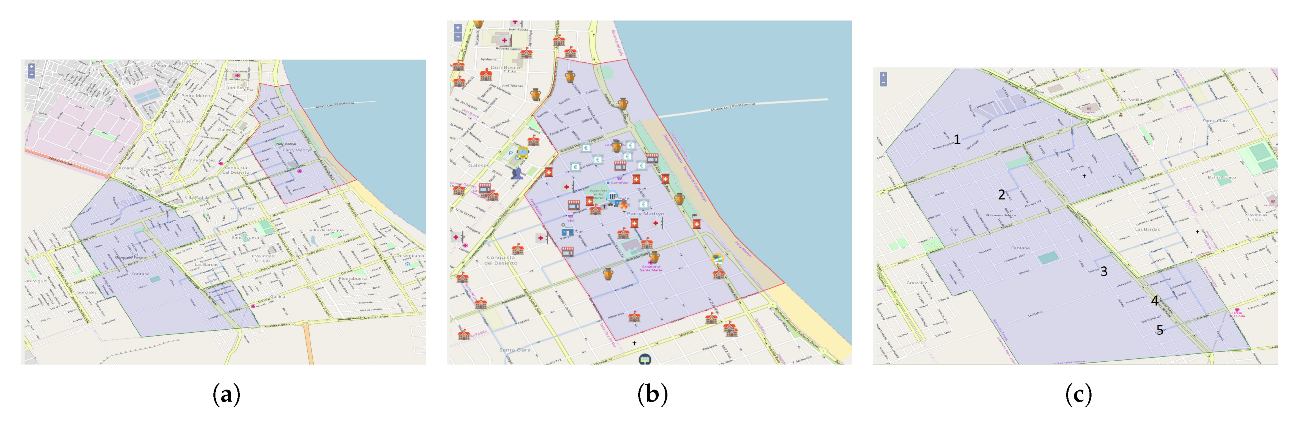
Figure 4.
Journeys obtained with default values.
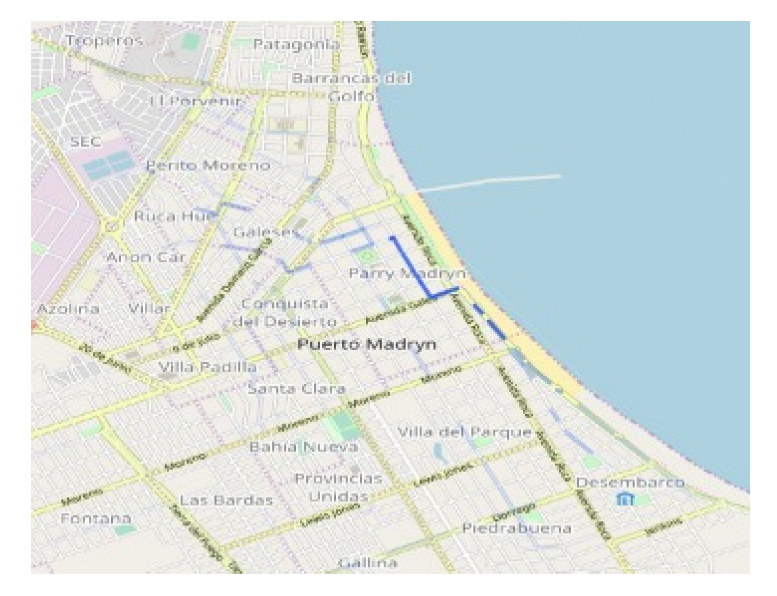
Figure 5.
Experiment setup and results.
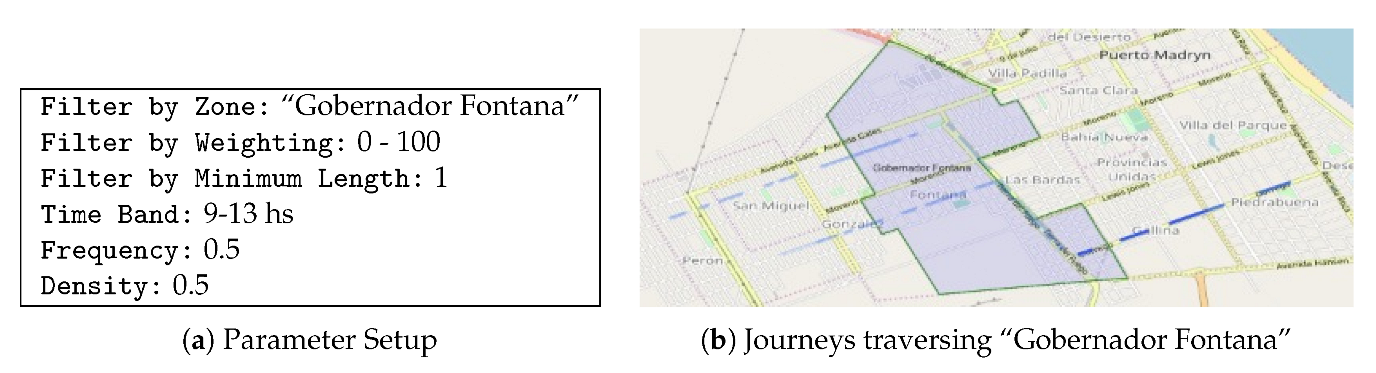
Figure 6.
Full journey generation for different opacity levels.

| a Descriptive statistics | |||
|---|---|---|---|
| Descriptors | Formula (5) | Formula (6) | Formula (7) |
| Mean | 0.08160 | 0.17652 | 0.27475 |
| Std err | 0.00431 | 0.00932 | 0.02122 |
| Median | 0.05263 | 0.125 | 0.1 |
| Std dev | 0.10123 | 0.21871 | 0.49768 |
| Asymmetry | 1.57334 | 2.26073 | 3.71781 |
| Interval | 0.6 | 1 | 4.13043 |
| Maximum | 0.6 | 1 | 4.13043 |
| Sum | 44.88419 | 97.090 | 151.11496 |
| b Pearson correlation coefficient | |||
| Correlations | |||
| (1) | 0.60599 | 0.23677 | −0.156959 |
| (2) | 0.51936 | 0.03498 | −0.406773 |
| (3) | 0.39417 | 0.51343 | −0.14812 |
Table 2.
Parameter setup.
| Origin Zone: Gobernador Fontana |
| Origin Zone Mode: Random point |
| Destination Zone: Parry Madryn |
| Destination Zone Mode: Random centrality |
| Number of Trips: 5 |
| Time Slot: 9 a.m.–1 p.m. |
| Daily Frequency: 4 |
| Density: 5 |
| Weekly Frequency: M–T–W–TH–F |
| Start date: 28 May 2018 |
Publisher’s Note: MDPI stays neutral with regard to jurisdictional claims in published maps and institutional affiliations. |
© 2018 by the authors. Licensee MDPI, Basel, Switzerland. This article is an open access article distributed under the terms and conditions of the Creative Commons Attribution (CC BY) license (https://creativecommons.org/licenses/by/4.0/).
Share and Cite
MDPI and ACS Style
Ordinez, L.; Savarro, M.; Ascagorta, O.; Cura, R.R.; Buckle, C.; Barry , D.; Stickar, R. A Cyclist Traffic Simulation and Analysis Tool. Proceedings 2018, 2, 1220. https://doi.org/10.3390/proceedings2191220
AMA Style
Ordinez L, Savarro M, Ascagorta O, Cura RR, Buckle C, Barry D, Stickar R. A Cyclist Traffic Simulation and Analysis Tool. Proceedings. 2018; 2(19):1220. https://doi.org/10.3390/proceedings2191220
Chicago/Turabian StyleOrdinez, Leo, Mauricio Savarro, Octavio Ascagorta, Rodrigo René Cura, Carlos Buckle, Damián Barry , and Romina Stickar. 2018. "A Cyclist Traffic Simulation and Analysis Tool" Proceedings 2, no. 19: 1220. https://doi.org/10.3390/proceedings2191220