Using Graphs of Queues and Genetic Algorithms to Fast Approximate Crowd Simulations †


Department Software Engineering and Artificial Intelligence, Complutense University of Madrid, 28040 Madrid, Spain
*
Author to whom correspondence should be addressed.
†
Presented at the 12th International Conference on Ubiquitous Computing and Ambient Intelligence (UCAmI 2018), Punta Cana, Dominican Republic, 4–7 December 2018.
Proceedings 2018, 2(19), 1216; https://doi.org/10.3390/proceedings2191216
Published: 25 October 2018
(This article belongs to the Proceedings of UCAmI 2018)
Abstract
:The use of Crowd Simulation for re-enacting different real life scenarios has been studied in the literature. In this field of research, the interplay between ambient assisted living solutions and the behavior of pedestrians in large installations is highly relevant. However, when designing these simulations, the necessary simplifications may result in different ranges of accuracy. The more realistic the simulation task is, the more complex and computational expensive it becomes. We present an approach towards a reasonable trade-off: given a complex and computational expensive crowd simulation, how to produce fast crowd simulations whose results approximate the results of the detailed and more realistic model. These faster simulations can be used to forecast the outcome of several scenarios, enabling the use of simulations in decision-making methods. This work contributes with a simplified faster simulation model that uses a graph of queues for modeling an environment where a set of agents will navigate. This model is configured using Genetic Algorithms (GA) applied to data obtained from complex 3D crowd simulations. This is illustrated with a proof-of-concept scenario where a 3D simulation of one floor of a faculty building, with its corresponding students, is re-enacted in the network of queues version. The success criteria are achieving a similar total number of people in particular floor areas along the simulation in both the simplified simulation and the original one. The experiments confirm that this approach approximates the number of people in each area with a sufficient degree of fidelity with respect to the results that are obtained by a more complex 3D simulator.
1. Introduction
Crowd simulation is a challenging application area for agent-based modeling and simulation [1,2]. There exists an active field of research on this topic thanks to its usefulness in several applications such as evacuations planning, designing and planning of pedestrian areas, indoor buildings, subway, sport-stadiums, among others. Several agent-based tools for this kind of simulation, both commercial and research based, address the problem, such as: Vadere http://www.vadere.org/, Pedestrian Dynamics https://www.incontrolsim.com/product/pedestrian-dynamics/, PEDSIM http://pedsim.silmaril.org/, or Legion http://www.legion.com/. These systems try to represent with high fidelity and realism the behavior of the individuals in a crowd simulation, usually including a 3D graphic representation of the individuals, complex animations, calculation of shorter paths and interpolated movements. These simulators usually require the definition of 3D models that represent the environment or the physical area to simulate, the pedestrians avatars and obstacles, to cite some. Although useful for uses such as modeling the interplay between pedestrians and ambient assistive solutions [3], building these assets is expensive both in resources, time, and computational power.
Some works propose mathematical techniques to solve crowd movement problems [4], as a faster approximation method to simulate crowds behavior [5,6]. In these systems, the environment is modeled as a network of walkway sections, where the nodes represent rooms and the links represent doors. Each pedestrian is treated as a separate agent. In others approaches [7] the agents are modeled as unique flow objects where the time to traverse each link is dependent on the overall density of pedestrians present at the link. The problem of these methods is their trade-off with other features, such as accuracy in the movement of characters, so as to have a faster output. Nevertheless, there are situations where it is better to sacrifice the accuracy of these systems in order to obtain a faster simulation (for instance, a reinforcement learning system for simulating pedestrian navigation [8]) or for running them in not very powerful computing devices (for instance, a smart-phone without Internet access inside a building does not have communications during an evacuation).
The fact that some simulations are expensive does not mean that such simulations are useless or expendable. Sometimes complexity is really needed, but in other cases efficiency and a high performance is preferred, so it is interesting to have an alternative to be able to maintain both kinds of simulations (high accuracy and fast simulations). Then the research question is how to combine both and keep them consistent during the development or in production.
This work contributes to this issue with a method to derive a fast crowd simulation from a more complex and slow crowd simulation. If the faster simulation produces valuable results for some variable or parameter of interest, such results need to be consistent with those returned by the more complex simulation along the duration of the original simulation.
This paper shows how this can be done using as the selected parameter the occupation of spaces within the floor of a university building. As a first step, the paper will focus on final values of this parameter to investigate if the approach is correct. In this way, future work can focus on intermediate states, which are more challenging. The faster solution is based on a network of queues model, and the derivation method is based on genetic algorithms (GA), which produces particular configurations for the queues network. The GA is applied over a set of samples that were obtained from a more complex crowd simulation to determine the runtime parameters for the queue based simulation.
This queue-graph approach is similar to the one presented in [5,6]. The queuing network is named graph of queues and contains two types of elements: nodes and edges. The nodes of the graph represent the different walkable spaces (not necessarily rooms) in which the physical space to simulate has been divided. These nodes contain a queue of pedestrians with a fixed size. And the edges of the graph represent the interconnections between two nodes and restrict the flow of pedestrians that can pass through them per unit of time.
The problem of these methods is the high number of the system parameters that have to be set to configure the system, and to assure that they have a good degree of similarity with the environment to simulate. For example, setting the maximum queue size of each node, or the pedestrian flow in each area, becomes unmanageable when the number of areas is high.
This is solved here by using genetic algorithms (GA) [9]. The GA use as input the number of pedestrians allocated in different pre-determined areas, which are represented by nodes in the graph. This traffic information is obtained from a more complex simulation. The GA uses this information to find a configuration of the parameters of the model that gets a count similar to the system we want to approximate.
The remainder of this paper is organized as follows. Section 2 reviews related work. Then, Section 3 presents our approach to build faster simulators and how to configure them by using a genetic algorithm. Section 4 shows the results of the experimentation. Finally, Section 5, presents some conclusions and future lines of work.
2. Related Work
In the last decade, most works on crowd modeling follow an agent-based approach where the agents move through a two or three-dimensional map.
Some works are focused on simple models. For instance, in [10], the authors use a 2D map that it is divided into small squares that represent places in the environment that can be free or occupied by an obstacle or by an agent. This approach is a good solution to reduce the computational cost and the developing time when the world modeled is small. Nevertheless, it requires having an expensive cell structure used to calculate the path-finding comparing with other models such as navmesh [11]. Another problem with this representation model is the lack of accuracy that it is produced in the frontiers that delimited the walkable and no-walkable areas and the obstacles [12] but, in certain environments, the model may be sufficiently precise.
This approach is less computationally expensive than other approaches such as the one used by Narain et al. [13], where the realism prevails using techniques more computationally demanding. The work cited want to manage thousands of pedestrian in 3D, with animations as opposed to the previous one who intended to get a less detailed simulation. They aim of this work is to replicate some behaviors that appear when the density of the individuals is very large, like the pilgrimage to Mecca or the evacuation of a sport stadium. This kind of situations are close to those that our work intends to consider. In the experiments, we compare ourselves with an indoors simulator called Massis [14], with similar realistic simulations. Another example of this most realistic approach is Clearpath [15] where the authors use the power of parallel computing and a custom collision avoidance algorithm that simulates the behavior of thousands of agents in complex 3D environments in real-time.
These so strongly disparate approaches show us that different levels of realism and accuracy are needed, depending on the environment to be simulated and the information that we want to obtain from the simulation. Despite this, even the simplest 2D models are computationally demanding thanks to the cost of the path-finding algorithms. For that reason, other computationally lighter models are also used. One of the most used is Queue theory [16].
Queue theory is a mathematical model of waiting lines. It can be applied to a multitude of the human process. For instance in [17] authors describes a model of queue theory for modeling the pedestrian traffic flow. They call it M/G/c/c queue model. Their queue model shows adequately the congestion that occurs in public buildings when pedestrians arrival to the building follows a Poisson distribution. Xu et al. [18] use a queuing network to model the pedestrian flow in a subway station. The proposed model has the limitation that it is not bidirectional. In the bidirectional sections, the system uses two independent links, for that reason the traffic in one direction not hinder to another. In addition, the authors assume that passenger arrival and departure at the platform follows another Poisson probability distribution. In our approach, we do not assume any specific statistical distribution function because it depends on the context to be simulated. Our simulation models the pedestrian arrival by using simple agents that move from one point to another. In each simulation, the arrival frequency will be different and it is part of the simulation. Each agent has a previously defined behaviour which is simplified by a list of way-points. This approach is more costly but also more real and independent of the environment to be simulated. Moreover, our model allows bidirectional communication between the different nodes.
To conclude, in our approach we use genetic algorithms to adjust the queue model to the simulation context. Some uses of genetic algorithms [19] in crowd simulations have been documented in the literature, but not specifically in the optimization of a queue system. In our approach, the genetic algorithm obtains a configuration of parameters of the queue model. That it is a different approach to the typical ones that can be found in the literature where is usually used in the optimization of the trajectory or to achieve a more realistic behavior of the agents. To cite some examples of these we can see the work of Wolinski et al. in [20] where the authors describe an optimization framework that uses GA in combination with greedy algorithms to create the pedestrian trajectories. In this work, the authors compare the optimization of two methods of collision avoidance: RVO2 [21] and social forces. Another approach to use GA in crowd simulation is shown in [22], where different methods of partitioning the space are compared.
3. Model for Crowd Simulation
The purpose of this work is to obtain a simplified model that subsumes the main aspects of a more complex pedestrian simulation while returning similar results in significantly less time. In this section, we describe the graph model that we propose and the genetic algorithm used to configure and optimize it.
3.1. Graph of Queues
In this work, the physical environment is modeled using an undirected graph where the nodes of the graph are the spaces where the pedestrians can transit and the edges of the graph are doors or other structures that communicate the spaces among them. We assume, for simplicity, that these structures (edges) can be traversed by a pedestrian in zero units of time. Each node internally is modeled with a queue of a specific size.
The time that pedestrians spend walking between two points is modeled with a variable in each node that establishes the time that an individual takes to go through the node at the average speed of an adult (about 1.2 m/s [23,24]).
In this model, the pedestrians are queued when they arrive to a node. Furthermore, each edge in the graph can extract an amount of pedestrians buffered in the node each time step. Each agent representing a pedestrian has a path to follow, and selects the edge to leave the node following this path. A pedestrian can leave its current node when it stays enough time. We consider that this is enough time when the waiting time was sufficient for an agent to traverse the space in the original simulation.
This time is calculated using the average time to traverse the node, which is stored in each node, and the speed of the pedestrian (usually the average speed). In the experiments, we assume that all the pedestrians walk at the average speed for simplicity.
The number of pedestrians that can departure from a node is determined by the number of individuals that can move simultaneously through the edges that connect the node with its neighbors within the simulated time interval. These edges are derived from the physical corridors that connect areas. For example, if there were twenty simulated pedestrians waiting to get outside a node, and if the edges that communicated this node with others could accommodate 10 of them each cycle, it would take two cycles to evacuate the waiting pedestrians.
According to these abstractions, we define a graph of queues framework, as Figure 1 shows. The framework is represented by the structure , as an undirected graph structure composed of a set of nodes that represent the different subdivisions of the simulation physical space; the set of edges that represent the interconnection between two nodes; and a movement function (M) that determines when a pedestrian can move across nodes.
Each node contains a queue of pedestrians where pedestrians can be removed (they leave the node) or added (they arrive to the node). Given a pedestrian, its movement across nodes is determined by the connecting edges (E) and a movement function (M). The set of edges E represents the interconnection between two nodes such that:
The division is determined manually by the designer of the simulation. This subdivision must be done taking into account the physical configuration of the building. Each node has a pair of values that represents the maximum queue size and the average time to traverse the node :
Each edge has a parameter that represents the number of pedestrians that can move between both nodes involved in the edge (in the Equation (3) these are and ):
One pedestrian can be defined as a sequence of consecutive movements . It is necessary to account its current queue (the node it is currently occupying) and its waiting time in the current queue (w).
Each cycle moves a pedestrian from the current node to the next through an edge when the pedestrian has waited for a certain time and the following condition is satisfied:
where is the current size of the queue in the node , is the capacity of the edge and is the number of pedestrians that have transited by the edge and in this time interval. In other words, a movement between two nodes , is possible if there exist an edge that interconnects both nodes and the waiting time of the pedestrian in the source node is greater than the time to traverse the source node, and the number of pedestrians enqueued in the destination node is less than its maximum capacity, and, finally, this edge is not fully occupied by other pedestrians.
The queue-based simulation will be defined over G as a cycle where:
- 1.
- For each pedestrian, determine if it can move from one node to the other.
- 2.
- If a pedestrian cannot move to the next node according to M, it waits in the current node until it can do it, increasing its current waiting time w by some .
- 3.
- If a pedestrian can move, then add the pedestrian to the queue of the next node in the pedestrian travel sequence and remove it from the previous node.
3.2. Configuration and Optimization of the Model
The configuration of this model requires defining the topology of the graph, the size of each node (max queue size), the average time to traverse each node, and the size of each connection (the number of pedestrians that can transit for each edge in each simulation’s step time). This configuration is a tedious problem that involves measurements of the free space of each node, the average time to traverse them, and the flow density in the interconnections. Moreover, the hand-made optimization of this model probably requires a process of trial and error to correctly set the parameters.
For that reason, we use a genetic algorithm to obtain the configuration of all the parameters of the model, namely: the size of the queues, the time to traverse the nodes, and the number of pedestrians that can cross an inter-node connection. Each particular configuration of these variables will become an individual of the population.
The algorithm needs a reference criterion that guides the search and that determines whether the obtained configurations are correct. This reference criterion should be easy to calculate and obtain in order to consider a large population of individuals.
In this case, we propose to count the number of persons leaving each node in the queue simulation at different instants of time. This information can be easily obtained from a real scenario (there are automatic methods but also it can be collected manually by counting people) and specially for the initial complex simulations we wanted to address. With this information, we can compare the results obtained by the simulator we want to approximate with the results obtained by our model. But also it will easily obtain this information in a real environment, if that is the current application scenario.
As a first step towards a more complete solution, this space occupation measurement is computed at the end of the simulation. Intermediate states are not checked, yet. We will address this information as the reference traversal dataset.
Therefore, the purpose of the genetic algorithm is to find an individual that represents the best configuration of the queues graph model to obtain the closest values to the final total people account per designated section. The error will be computed with respect to the known values of the reference traversal dataset. This dataset store the number of pedestrians counted with each node in the simulation.
The genetic algorithm will follow the following steps: Reproduction, crossover, mutation and replacement. In the reproduction phase, the algorithm selects the individuals that make up the next generation. This selection is made based on how good they are solving the problem (in this case, reproducing the reference traversal dataset). There are different types of selection in the literature. We have implemented three of them: tournament, hierarchical and roulette [25]. With the selected individuals the algorithm crossovers them with a certain probability. The crossover mechanism is similar to the genetic crossover among chromosomes and there exists a plethora of methods. We implemented three of them: uniform, point, or multi-point crossover [25]. Next, the algorithm, with a certain probability, modifies randomly the individual in the mutation phase. Finally, the new individuals are evaluated using a fitness function that quantifies how good the individual is to solve the problem. The new population replaces the previous and the algorithm repeats the process as many times as the number of generations has been configured.
In our approach, each individual of the GA has already been introduced as a specific configuration of the queues graph model. The genotype (the value of the individual) encodes each parameter of the system as an integer number. The average time to cross a node must be a discrete magnitude to be represented by an integer number. A unit can, for example, represent one second or half a second, depending on the accuracy that we want to obtain.
In order to keep the consistency among the different types of parameters, an individual is coded using three arrays of parameters: The size of the queues of each node, the time to traverse each node, and the size of each link. The number of edges and nodes can be different, for that reason the genetic operators are applied to each genotype separately.
Figure 2 shows an example of coding a simulation graph into an individual in the genetic algorithm.
Also the implementation allows elitism and dynamic diversity control using as metric the entropy of the population [26]. Using the diversity parameter of the GA, we manage to adjust the probability of the mutation and the size of the tournament. Whether this selected method is used depends on the diversity value. If the diversity value is near to 1 the mutation probability will be low and the tournament size will be high, maintaining a greater selective pressure. This combination favors the convergence towards the nearest local minimum. On the contrary, whether the diversity is low, the mutation probability will be high and the tournament size will be smaller, reducing selective pressure, allowing to increase the diversity, and increasing the exploration of the new local minimums.
All the operators have to preserve the integrity of the individuals. The operators always must generate valid solutions within the value ranges of the three parameter types. Their ranges are shown in the Table 1:
The fitness function in the GA is the execution of the queues graph simulator that is configured with the different individuals of the population. When the simulation is finished, the graph simulator returns the number of counted pedestrians in each node during the simulation time. This result is compared with the results that were obtained by a the 3D multi-agent simulation system MASSIS (a multi-agent simulator of pedestrian crowds) [14], the reference traversal dataset.
The number of pedestrians per second that are present in an area is obtained automatically in the simulation by inspecting it in run time. However, it is not distinguished whether, within two time intervals, the same person has been counted twice. This information is used in the fitness function to compare the result between the queue graph simulation and the original simulation in MASSIS. The similarity measure used was one minus the relative average error in each node.
where is shown in the Equation (6) and calculates the absolute error in a node divided by the people counted by the MASSIS simulation. In this equation, we denote as the number of people counted by the MASSIS simulation in the node and as the number of people counted by the graph simulator.
The fitness function discards the nodes that have counted 0 individuals because they would artificially increase the similarity by having an error of 0 and therefore a similarity of 1 always, which would increase the average.
Section 4 describes some of the experiments that have been performed taking into account the solution proposed to the problem in this section with different simulation scenarios and different GA configurations. In addition, the different results that are obtained for different scenarios are discussed.
4. Experimentation
We have performed a set of experiments with the goal of testing whether the queue graph simulator configured with GA can get a final people account per section that is similar to the one obtained with a more complex 3D simulation. If the premise is correct, this system could be used as reliable fast approximation of a more complex simulator in certain environments where using a most complex simulator is not applicable or too costly. The introduction (Section 1) has presented some of these scenarios where it is interesting to consider the use of the fast simulator, e.g., in a wearable or smart device with a significant lower computation capability, or in machine learning scenarios.
As a proof of concept, a run of the queue graph simulator, as introduced in Section 3.1, was fast enough to apply GA optimization and produce the results presented in this section. In these experiments, we used the graph of queues as a part of the fitness calculation of population with hundreds of individuals that represented valid configurations of the simulator and the evaluation of each generation only took a few seconds running on a laptop, whereas the original 3D simulator took several minutes. The modeled scenario was the floor areas represented by the Figure 3 whose actual 3D representation, segmented by area, is shown in Figure 4.
To evaluate the results, we used a reference traversal dataset that counted the persons occupying a section, as it was mentioned in Section 3. We compared the number of people that were counted in MASSIS and the queues graph approximation configured with GA. Both simulators measured their environment with the same time interval, which was defined as 1 s for these experiments. The number of agents that represented a pedestrian in both simulators was the same and followed the same routes. The simulation length was also the same in both systems but in MASSIS it was executed in real-time, while our approximation was run as fast as the computer could.
The environment that has been chosen to perform the experimentation is a 3D model of the building of the Faculty of Computer Science of the Universidad Complutense of Madrid. Using this model, we defined a simplified graph that is shown in Figure 4. This subdivision in areas became nodes in the queue graph (see Figure 3) with the sole criteria of creating nodes as squares when possible so that the average traverse time (parameter used in the queue simulator) was a realist approximation. In order to simplify the experiment, all the agents (i.e., people that were simulated) moved with the same speed.
The simplified graph has 28 nodes that represent the different places of a floor of the building, and the interconnections between them. Some places represent rooms or corridors but others are subdivided to get a better representation of the environment. Some interconnections are doors but other interconnections do not have associated structures.
In the experiments, we have simulated different scenarios using this environment with different amounts of people through different routes that produced different people accounting in the nodes. The configuration of the nodes and the places was the same in all the scenarios that have been simulated.
The simulated scenarios in the experiment were:
- Scenario 1: The students could enter to the Faculty by two gates, the main gate and the back gate. Students entering through the main gate went to the classrooms 1 to 3. Students entering through the back door went to the classrooms 3 and 4. The number of students simulated was 150, with 30 for each classroom.
- Scenario 2: Students evacuated the classrooms on an emergency situation. Each class left the building by the nearest gate. The number of students simulated was 150, with 30 for each classroom.
- Scenario 3: This simulation showed some typical behaviors that occur in a university. A group of people entered the Faculty building while other group of students left. Other group left the cafeteria and went to their classrooms, some students changed the classroom and, finally, a group of people waited for an event in the Hall of events. The number of people simulated was 210.
- Scenario 4: Entry of the morning shift and departure of the afternoon shift. The number of students simulated was 240.
Each scenario was run in the original 3D simulator to obtain the corresponding reference traversal datasets.
Table 2 shows the results obtained for each scenario at the end of the simulation. The last column, sim, shows the similarity obtained with respect the reference traversal dataset. The rest of the table shows the configuration of the GA that has been applied to get the result, where P is the population size, Gen is the number of generations used, Sel is the selection method used, Cross is the crossover method used, Mr is the mutation rate (that we remember is dynamic depending on the diversity and it varies between the range shown in the table as explained in Section 3), Cr is the crossover probability and El is the degree of elitism. The selection method used were: tournaments (TU in the table); and the crossover methods used where uniform crossover (UN in the table).
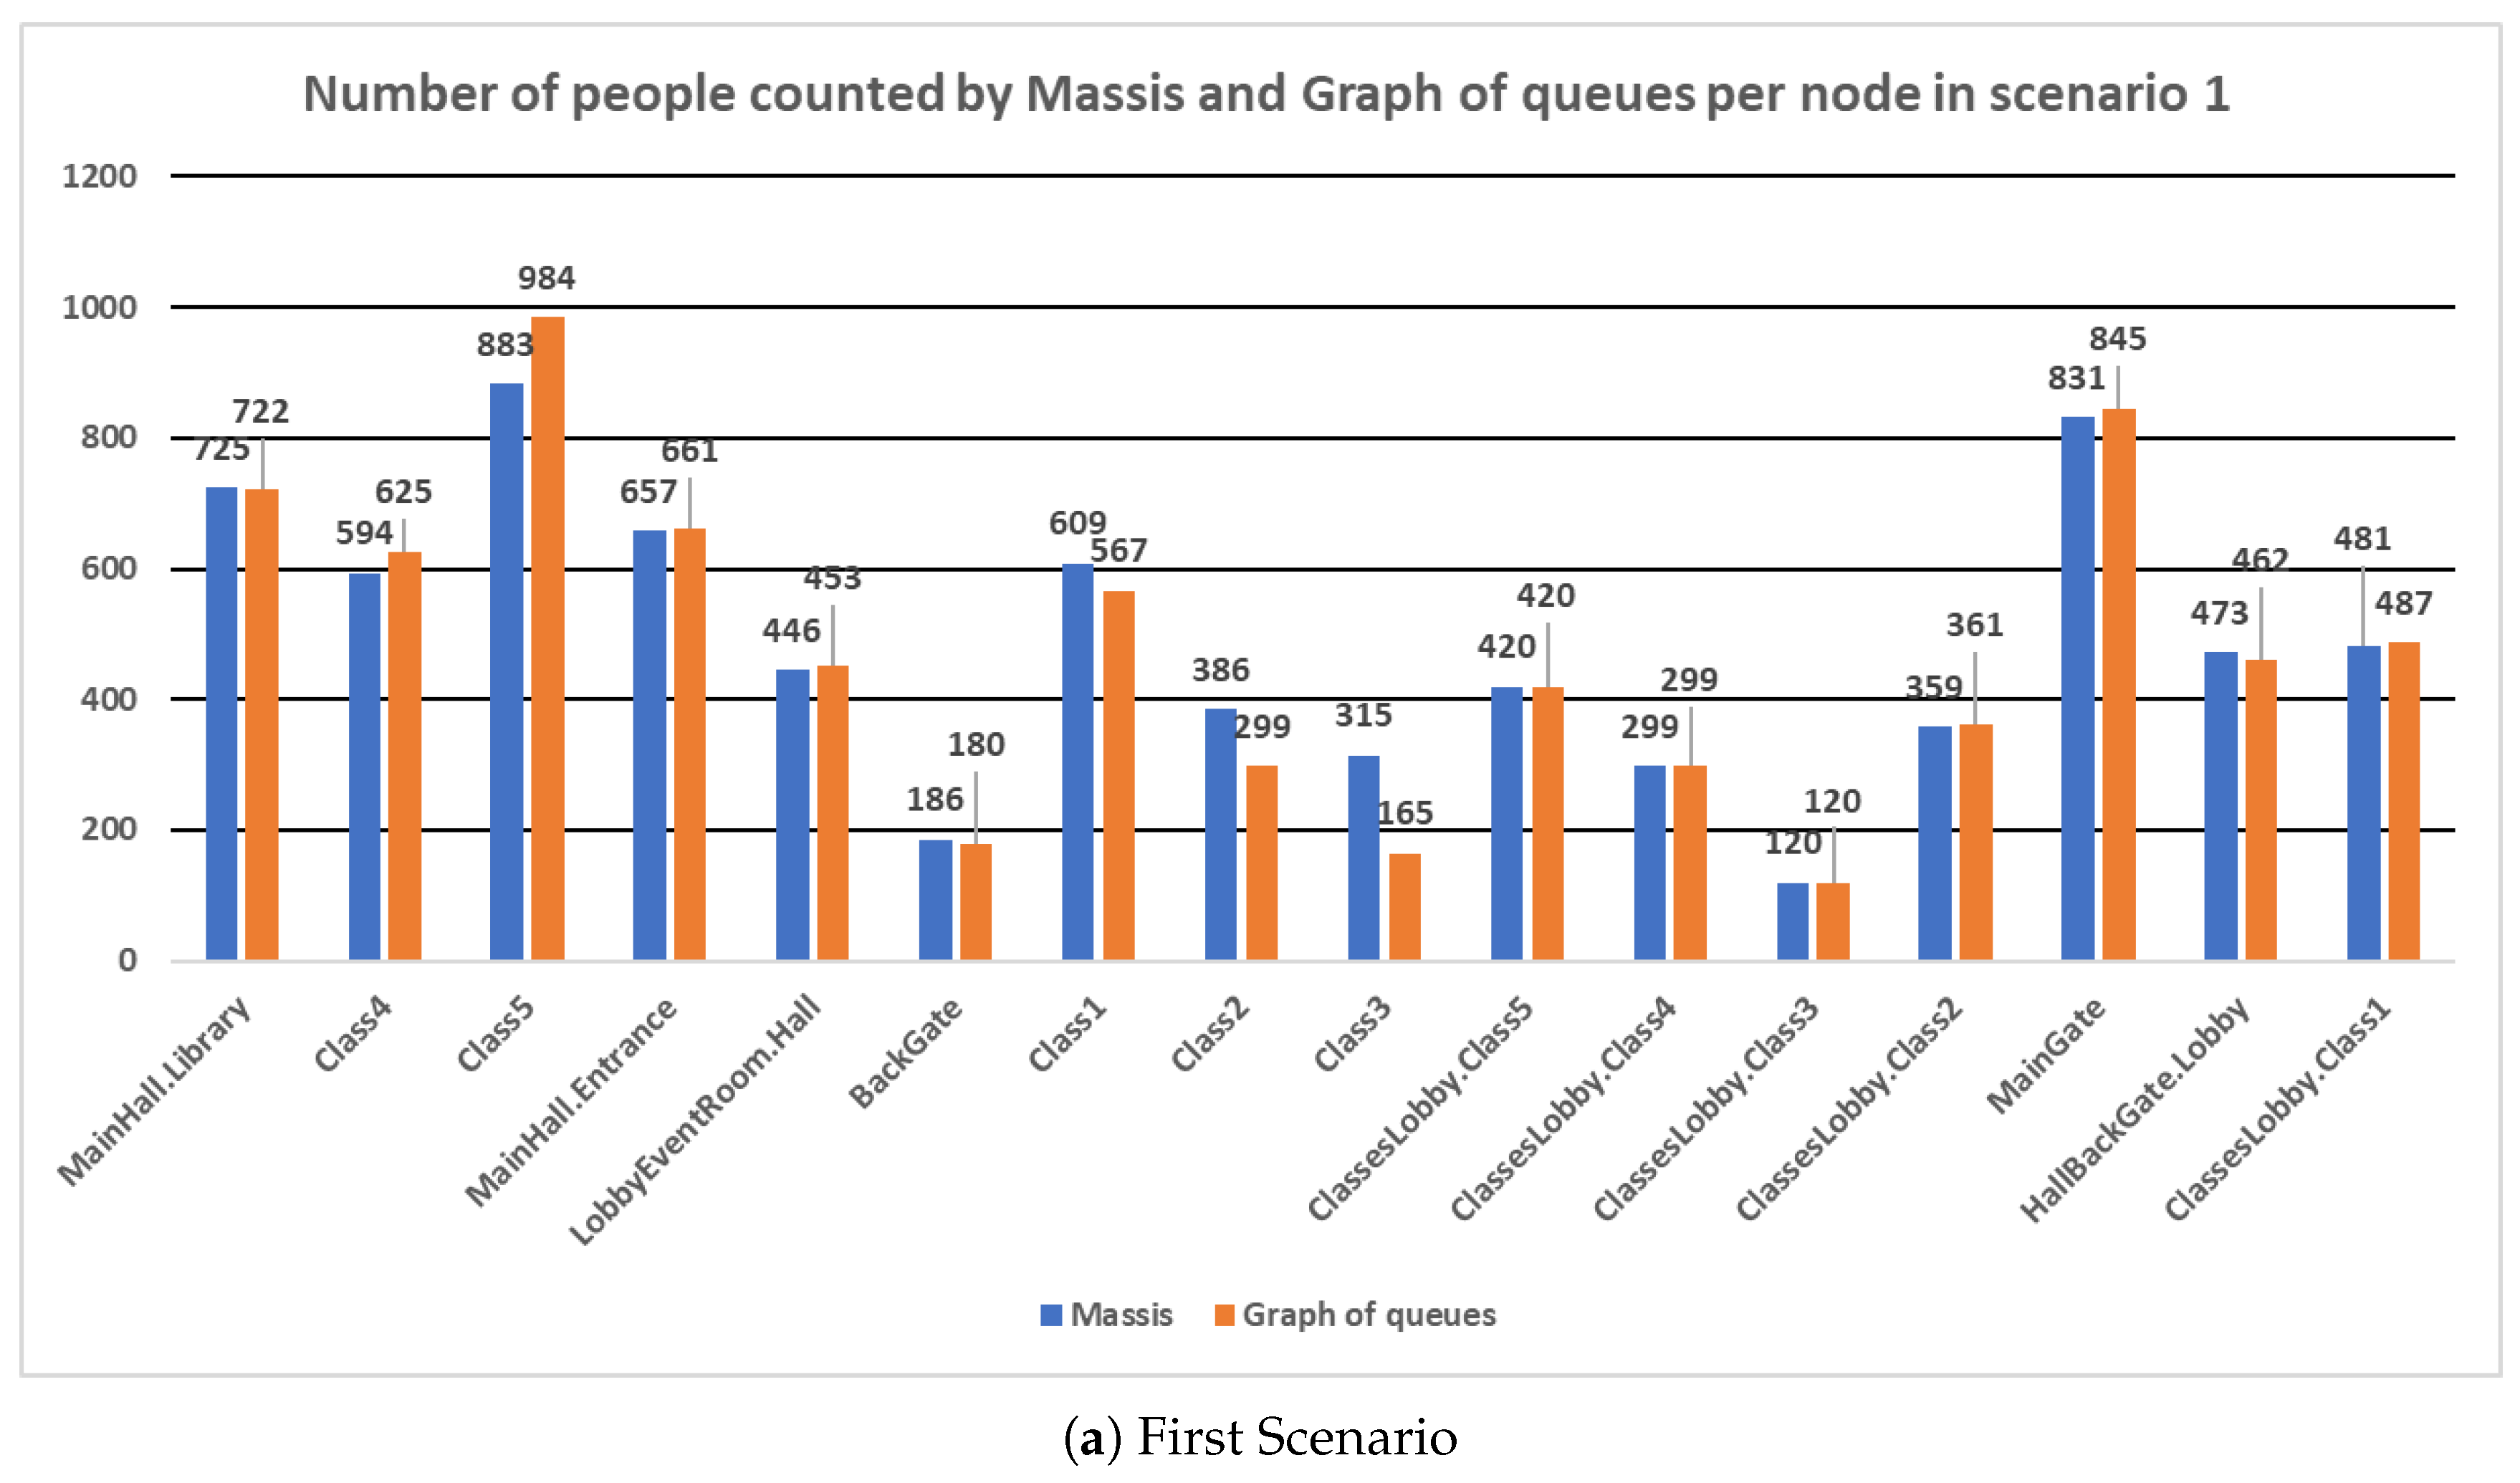
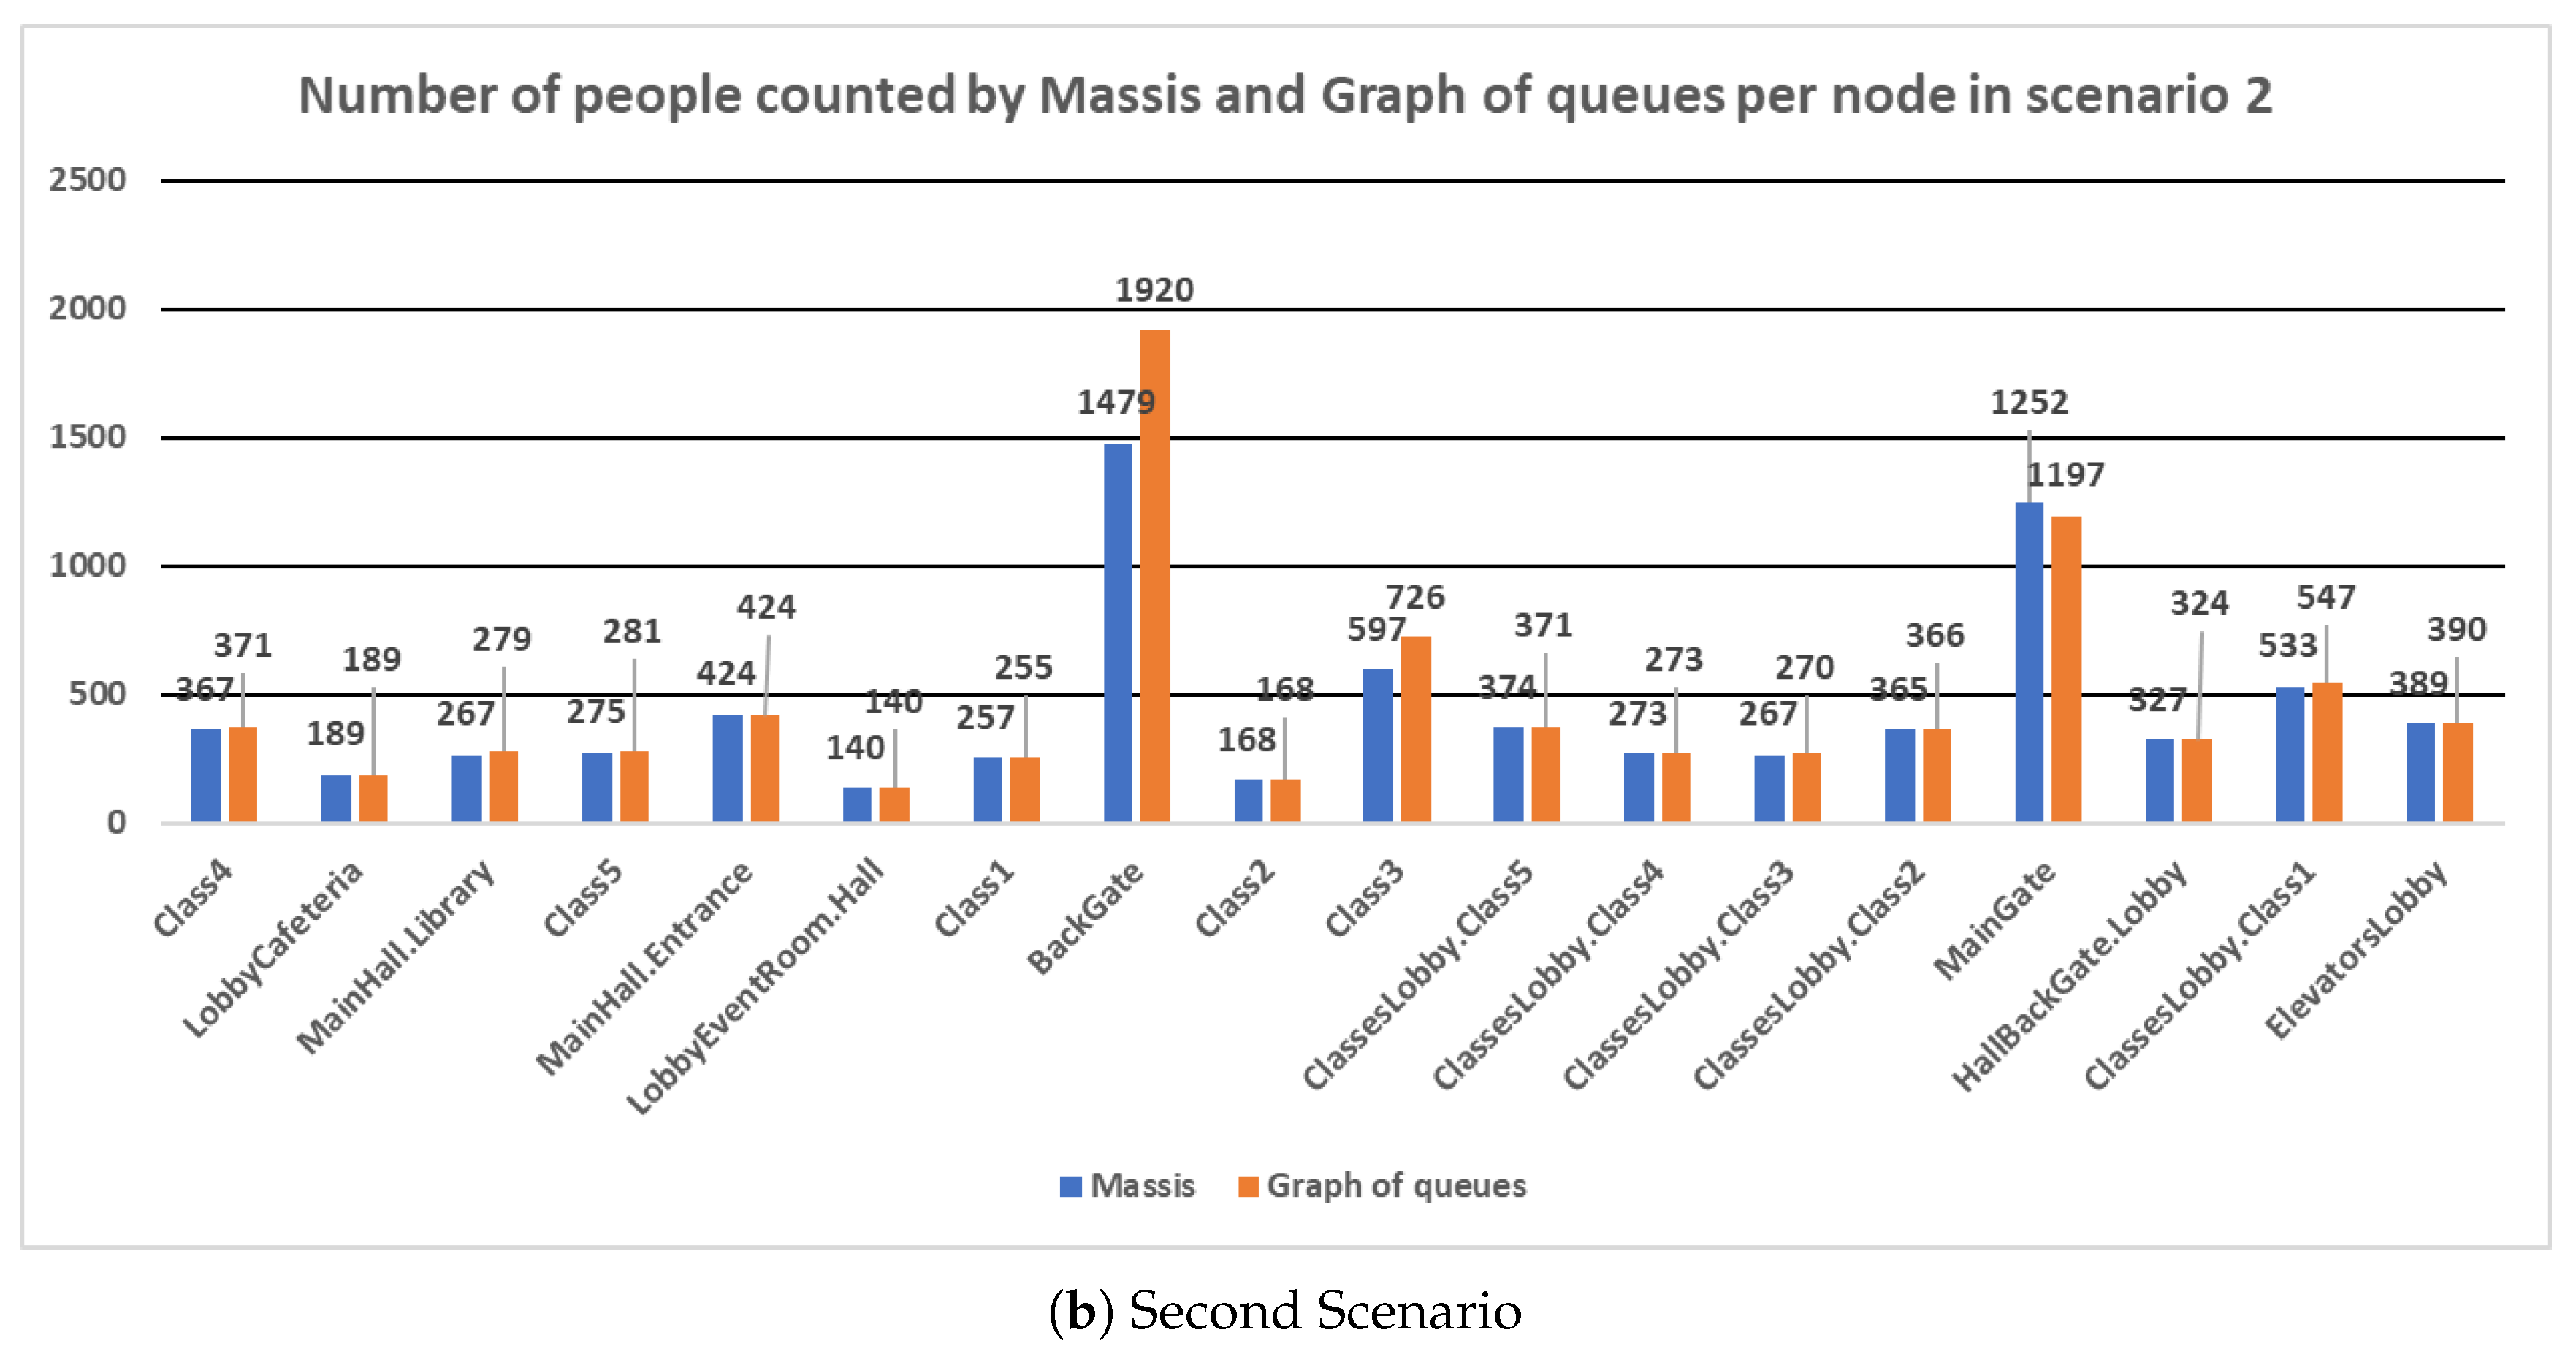
We performed different executions with different configurations of the GA, but the better results were obtained with the tournaments selection and the uniform crossover. For space reasons, only the results for the first and second scenarios and shown in Figure 5.
As Table 2 shows, the similarity between both simulators is very high for all scenarios that have been tested, especially in the first and second scenarios, which get a similarity degree close to 95%. Figure 5a,b show the results obtained by both simulators and indicate that in most nodes the result is very close between them.
The bigger deviations have been obtained in the nodes MainGate and BackGate. They refer to the primary and back door that are used to enter the Faculty. In both simulations, most of the students started from both nodes, so the differences in these nodes represent likely the result of some bottlenecks that have delayed the entrance of students at the university in the graph of queues to a greater extent than in the MASSIS simulation. In the rest of the nodes, the number of counted people is remarkably similar.
In the third and fourth scenarios, the accuracy is lower than in others but it is also high (close to 90%). Simulation for scenario 3 shows that the bigger deviation was produced in the nodes ElevatorsLobby and the first part of the entrance hall. The simulation four presents minor deviations with the rest of the scenarios.
As the results show, the system can approximate the results obtained by MASSIS whether we optimize the graph with GA with the same scenario in both simulators. This result is promising and it can apply in known scenarios, but we want to identify the ability of the model to generalize the results in more than one scenario. With this premise, we have realized two additional experiments.
First, we have modified the fitness function of the GA to simulate several scenarios at the same time. The total fitness of the individual represents the average of the accuracy taken for each scenario. This function aims to find a graph configuration that allows approximating all these scenarios with a right accuracy. The experiment obtained a accuracy average of 79.81%, executing the GA during 1500 iterations with a population of 1000 individuals and similar configuration from the previous experiments in the rest of parameters. The accuracy achieved is lower than the previous experiments because, in those experiments, the simulator is over-fitting to maximize the results in the scenario used in the fitness function. With this new fitness function, the GA tried to find a generic configuration that fits all these scenarios at the same time.
The second experiment aimed to configure the queue graph with a set of scenarios and later on using the same queue graph to approximate other different non-trained scenario to validate its performance. Using the take-one-out approach, one scenario was used to validate while the others were used to train. Table 3 shows the results of this experiment with different scenarios used in the fitness function in the validation scenario. As it can be seen, the similarity obtained in the third and fourth scenarios is acceptable, with around 70% of accuracy. However, in the first and second scenarios is very poor. That is because the third and fourth scenarios are more similar to each other than the other two. The first and second scenarios are entirely different from the rest and the model is not right configured for them when they are not present. This experiment shows that the capacity of the model to generalize is not too good as it tends to over-fit.
Therefore, if we want to configure a graph that can approximate several types of scenarios (different from the usages in the configuration process) we must select carefully the set of scenarios used in the configuration. These scenarios must be representative of the possible scenarios to simulate. Otherwise, the simulator may not predict these scenarios correctly. That result is probably caused by two circumstances. On the one hand, the limitations of the graph of queues used; on the other hand the over-fitting produced by the GA that the graph to maximize the results in the scenarios used to setup the fitness function.
This result does not invalidate the approach, but suggests that a more complex method is needed. We expect that a way to overcome this is the classification of the current situation in a number of known and trained scenarios whose accuracy is satisfactory. In this way, the right queue graph configuration could be selected and the results correctly predicted.
5. Conclusions and Future Work
This paper has presented a fast and easy-to-configure method to approximate complex pedestrian crowd simulators using a graph of queues that is capable to approximate them with a high degree of similarity.
As the experiments have demonstrated, this approach can approximate more quickly a variable whose final value is obtained after a complex simulation, which makes this system an ideal method to use as an alternative in a multitude of environments where execution time (and low computing resources) is crucial. The graph of queues simulator is auto-configured using a GA that optimizes the similarity in terms of the number of people that is present in certain areas of the simulated building.
The interest of the queues of networks is that we could obtain intermediate results for the variable we were observing. In the experiments, we focused on its final value to validate the approach, but we intend to run additional experiments and adjustments to estimate the variations of the variable along the simulation and how consistent it is with respect to those values observed in the original simulation.
Currently, the main issue is that it tends to over-fit trained scenarios leading to unsatisfactory results in others. A more generic approach to the problem is one of the aims to work in the future.
As an additional line of research, we want to use this estimator of crowd simulations into a machine learning system. Also, for creating cheap simulations in smart-devices that can simulate in few seconds which will be the result of an evacuation of a public building at the exact moment of an event occurring, without the need of using cloud-based alternatives as in some emergence situations there may be not good Internet connectivity.
Acknowledgments
We acknowledge support from the project “Collaborative Development of Ambient Assisted Living Solutions (ColoSAAL)” (TIN2014-57028-R) funded by Spanish Ministry for Economy and Competitiveness; and MOSI-AGIL-CM (S2013/ICE-3019) co-funded by the Region of Madrid Government, EU Structural Funds FSE, and FEDER.
References
- Helbing, D.; Molnar, P. Social force model for pedestrian dynamics. Phys. Rev. E 1995, 51, 4282. [Google Scholar] [CrossRef] [PubMed]
- Ulicny, B.; Thalmann, D. Towards Interactive Real-Time Crowd Behavior Simulation. In Computer Graphics Forum; Wiley Online Library; Blackwell Publishing, Inc.: Oxford, UK, 2002; Volume 21, pp. 767–775. [Google Scholar]
- Gomez-Sanz, J.J.; Pax, R.; Arroyo, M.; Cardenas Bonett, M. Requirement Engineering Activities in Smart Environments for Large Facilities. Comput. Sci. Inf. Syst. 2017, 14, 239–255. [Google Scholar] [CrossRef]
- Bolch, G.; Greiner, S.; de Meer, H.; Trivedi, K.S. Queueing Networks and Markov Chains: Modeling and Performance Evaluation With Computer Science Applications; John Wiley & Sons: Hoboken, NJ, USA, 2006. [Google Scholar]
- Løvås, G.G. Modeling and simulation of pedestrian traffic flow. Transp. Res. B Methodol. 1994, 28, 429–443. [Google Scholar] [CrossRef]
- Yanagisawa, D.; Suma, Y.; Tanaka, Y.; Tomoeda, A.; Ohtsuka, K.; Nishinari, K. Methods for Improving Efficiency of Queuing Systems. In Pedestrian and Evacuation Dynamics; Peacock, R.D., Kuligowski, E.D., Averill, J.D., Eds.; Springer US: Boston, MA, USA, 2011; pp. 297–306. [Google Scholar]
- Daamen, W. SimPed: A pedestrian simulation tool for large pedestrian areas. In Proceedings of the Conference Proceedings EuroSIW, Malmo, Sweden, 23–25 June 2002; pp. 24–26. [Google Scholar]
- Martinez-Gil, F.; Lozano, M.; Fernández, F. Multi-agent reinforcement learning for simulating pedestrian navigation. In International Workshop on Adaptive and Learning Agents; Springer: Berlin, Germany, 2011; pp. 54–69. [Google Scholar]
- Mitchell, M. An Introduction to Genetic Algorithms; MIT Press: Cambridge, MA, USA, 1998. [Google Scholar]
- Kobayashi, H.; Ishimoto, Y.; Fujioka, M.; Ishibashi, K. A multi-agent evacuation simulator to design safe cities for high quality of life with computer clustering. In Proceedings of the 2007 SICE Annual Conference, Kagawa, Japan, 17–20 September 2007; pp. 3043–3046. [Google Scholar]
- Cui, X.; Shi, H. An overview of pathfinding in navigation mesh. IJCSNS 2012, 12, 48–51. [Google Scholar]
- Sturtevant, N.R. Choosing a search space representation. Game AI Pro Collect. Wisdom Game AI Prof. 2013, 1, 253–258. [Google Scholar]
- Narain, R.; Golas, A.; Curtis, S.; Lin, M.C. Aggregate dynamics for dense crowd simulation. In Proceedings of the ACM Transactions on Graphics (TOG), Yokohama, Japan, August 2009; Volume 28, p. 122. [Google Scholar]
- Pax, R.; Pavón, J. Agent architecture for crowd simulation in indoor environments. J. Ambient Intell. Hum. Comput. 2017, 8, 205–212. [Google Scholar] [CrossRef]
- Guy, S.J.; Chhugani, J.; Kim, C.; Satish, N.; Lin, M.; Manocha, D.; Dubey, P. Clearpath: Highly parallel collision avoidance for multi-agent simulation. In Proceedings of the 2009 ACM SIGGRAPH/Eurographics Symposium on Computer Animation, Los Angeles, CA, USA, 7–9 August 2009; pp. 177–187. [Google Scholar]
- Erlang, A.K. The theory of probabilities and telephone conversations. Nyt. Tidsskr. Mat. Ser. B 1909, 20, 33–39. [Google Scholar]
- Cheah, J.Y.; Smith, J.M. Generalized M/G/C/C state dependent queueing models and pedestrian traffic flows. Queueing Syst. 1994, 15, 365–386. [Google Scholar] [CrossRef]
- Xu, X.Y.; Liu, J.; Li, H.Y.; Hu, J.Q. Analysis of subway station capacity with the use of queueing theory. Transp. Res. C Emerg. Technol. 2014, 38, 28–43. [Google Scholar] [CrossRef]
- Goldberg, D.E. Genetic Algorithms; Pearson Education India; Volume 1, 1 December 2008. [Google Scholar]
- Wolinski, D.; Guy, S.J.; Olivier, A.H.; Lin, M.; Manocha, D.; Pettré, J. Parameter estimation and comparative evaluation of crowd simulations. Comput. Graph. Forum 2014, 33, 303–312. [Google Scholar] [CrossRef]
- van den Berg, J.; Guy, S.J.; Snape, J.; Lin, M.C.; Manocha, D. Rvo2 Library: Reciprocal Collision Avoidance for Real-Time Multi-Agent Simulation. 2016. Available online: http://gamma.cs.unc.edu/RVO2/ (accessed on 1 October 2018).
- Vigueras, G.; Lozano, M.; Orduña, J.M.; Grimaldo, F. A comparative study of partitioning methods for crowd simulations. Appl. Soft Comput. 2010, 10, 225–235. [Google Scholar] [CrossRef]
- Knoblauch, R.; Pietrucha, M.; Nitzburg, M. Field Studies of Pedestrian Walking Speed and Start-Up Time. Transp. Res. Rec. 1996, 1538, 27–38. [Google Scholar] [CrossRef]
- Purser, J.L.; Weinberger, M.; Cohen, H.J.; Pieper, C.F.; Morey, M.C.; Li, T.; Williams, G.R.; Lapuerta, P. Walking speed predicts health status and hospital costs for frail elderly male veterans. J. Rehabil. Res. Dev. 2005, 42, 535. [Google Scholar] [CrossRef] [PubMed]
- Bäck, T.; Fogel, D.B.; Michalewicz, Z. Evolutionary Computation 1: Basic Algorithms and Operators; CRC Press: Boca Raton, FL, USA, 2000; Volume 1. [Google Scholar]
- Chang, P.C.; Huang, W.H.; Ting, C.J. Dynamic diversity control in genetic algorithm for mining unsearched solution space in TSP problems. Expert Syst. Appl. 2010, 37, 1863–1878. [Google Scholar] [CrossRef]
Figure 1.
Example of a graph of queues.
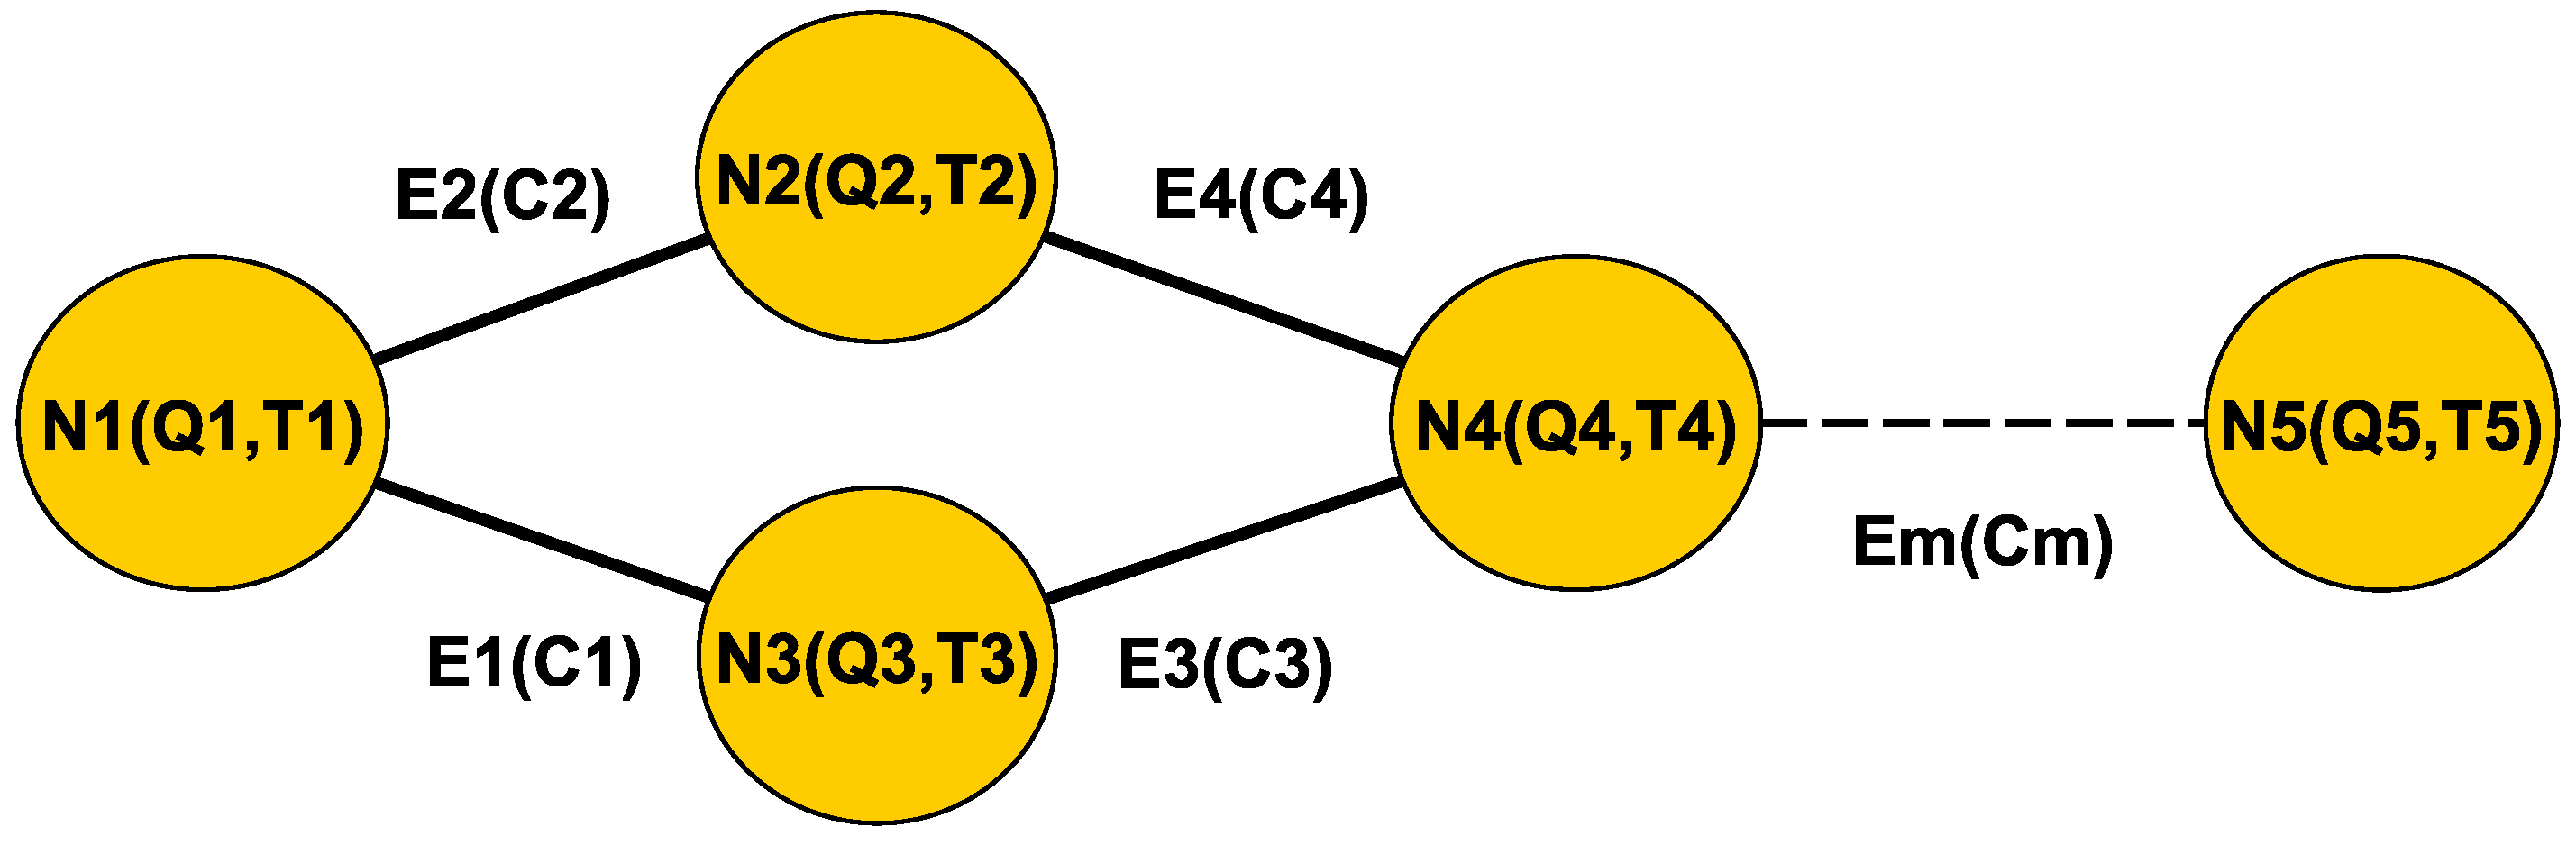
Figure 2.
Example of coding a simulation graph as an individual of the genetic algorithm.
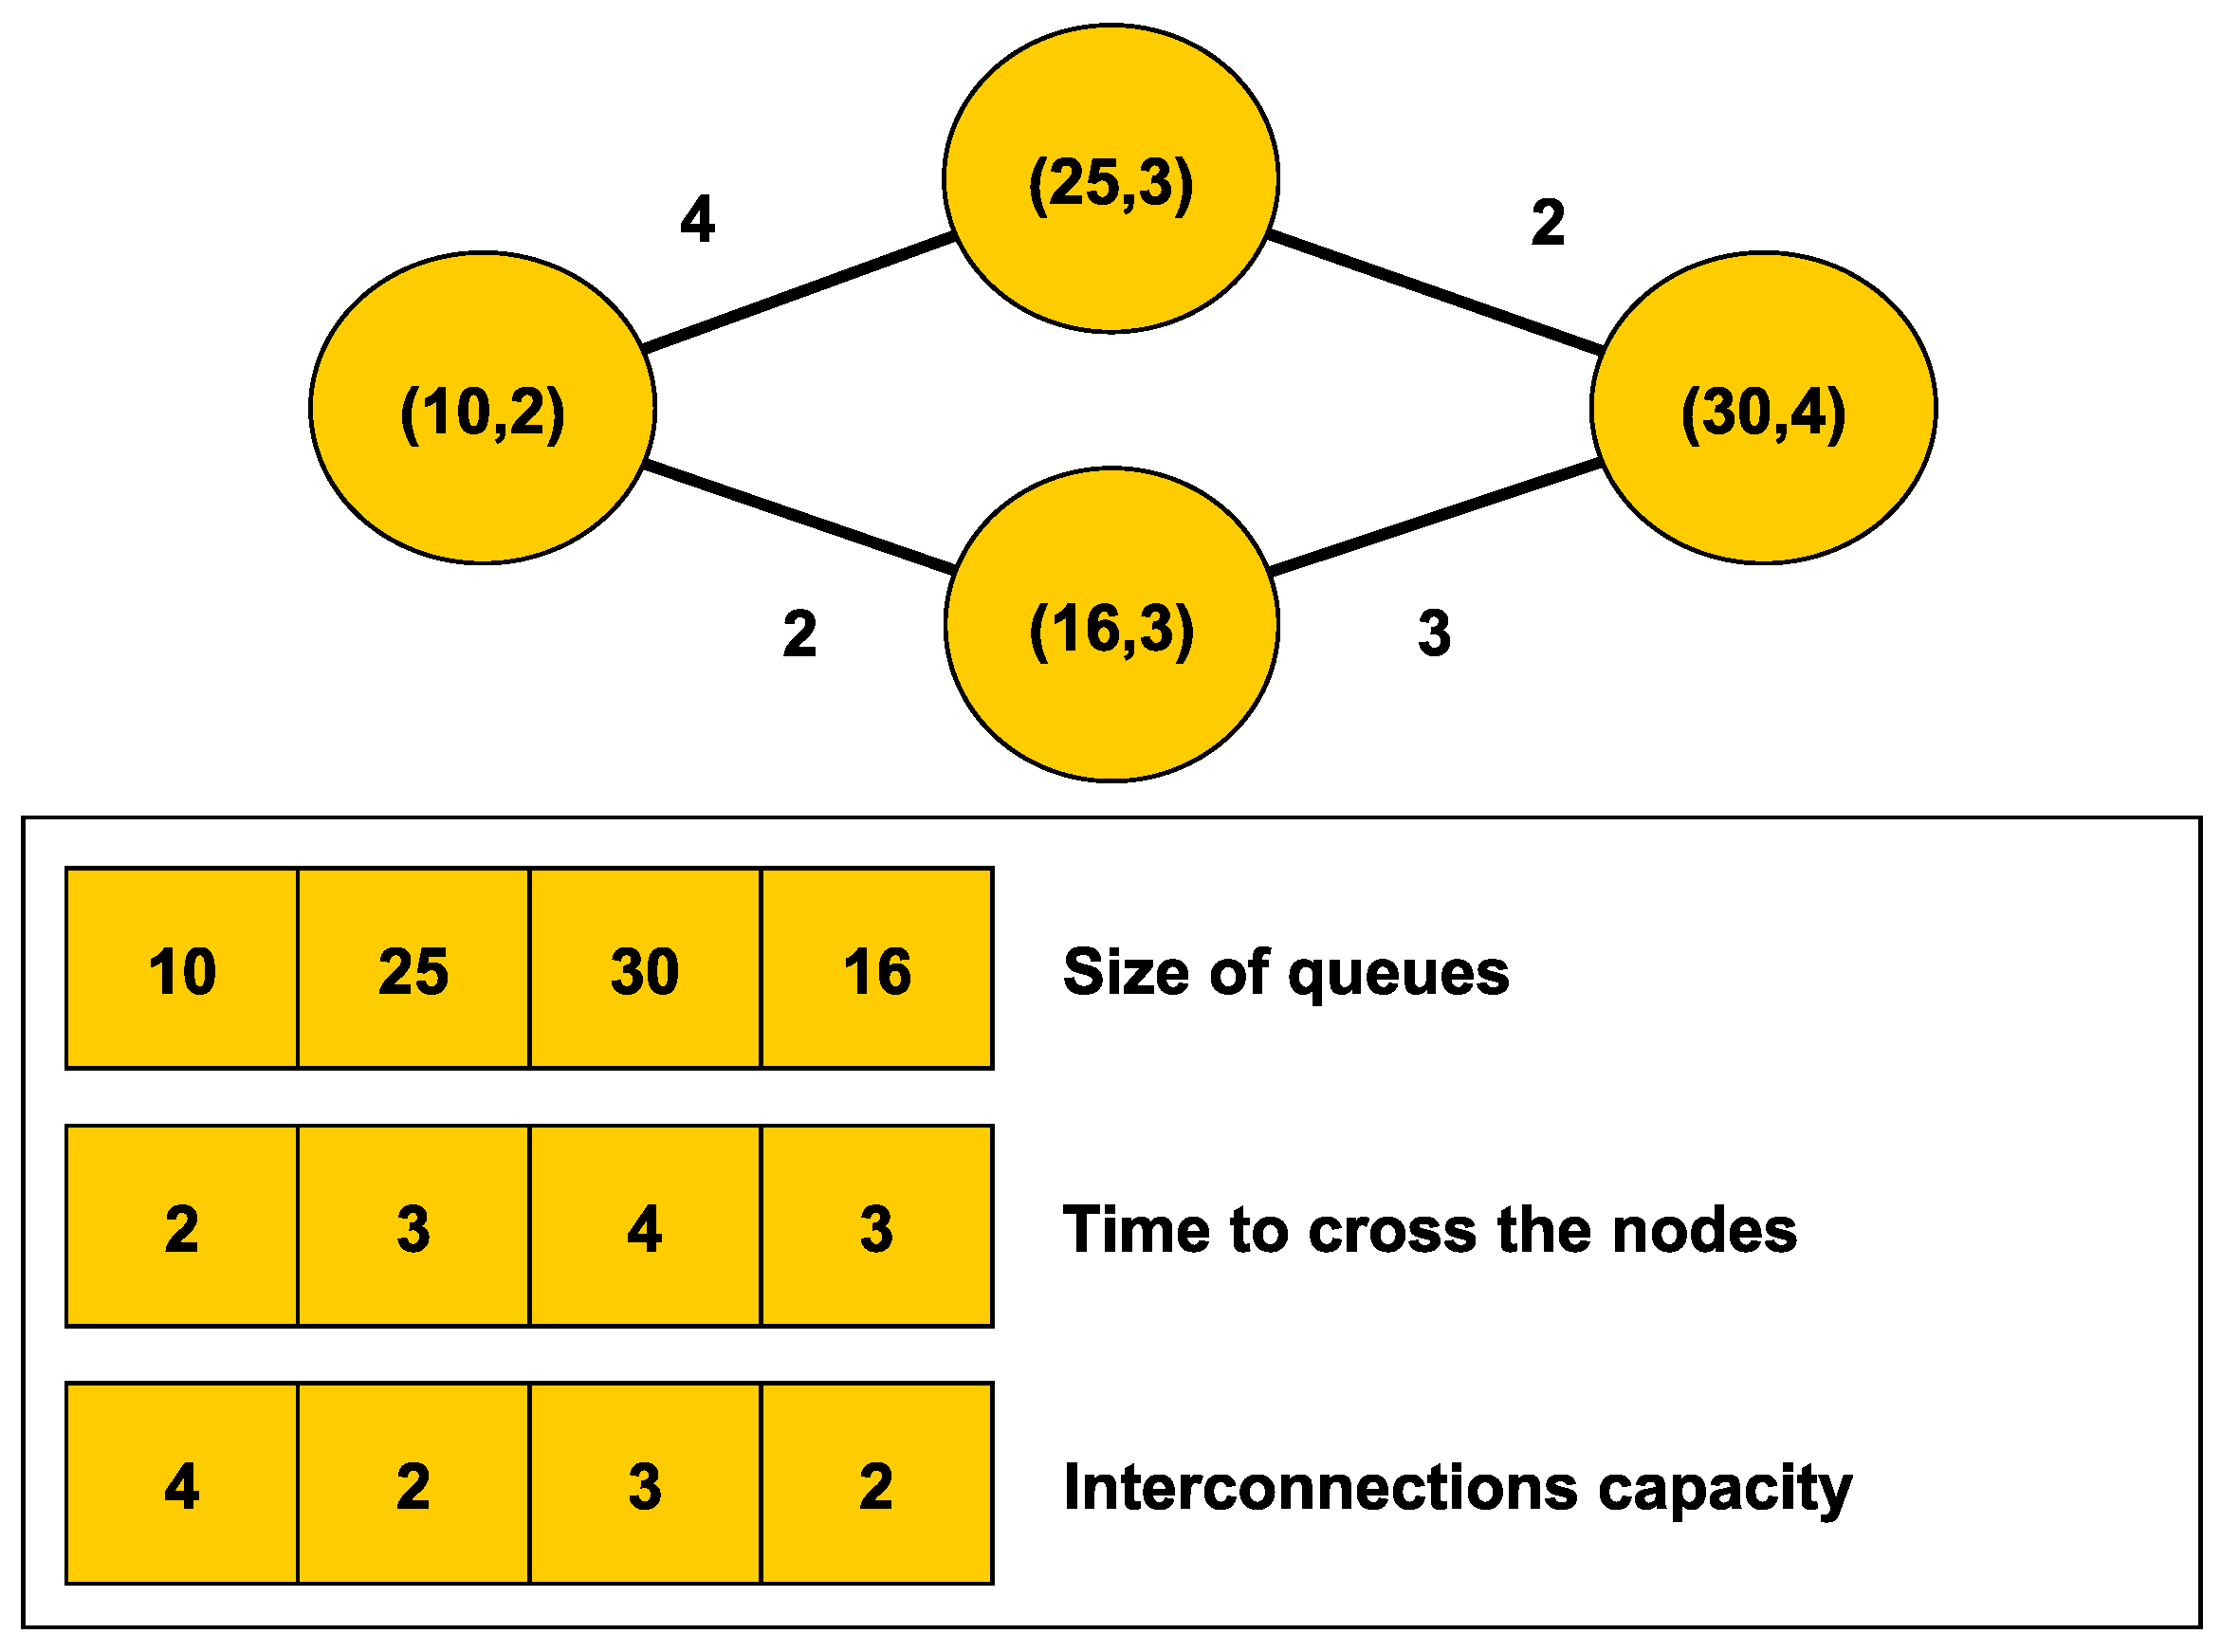
Figure 3.
The graph model of the faculty.
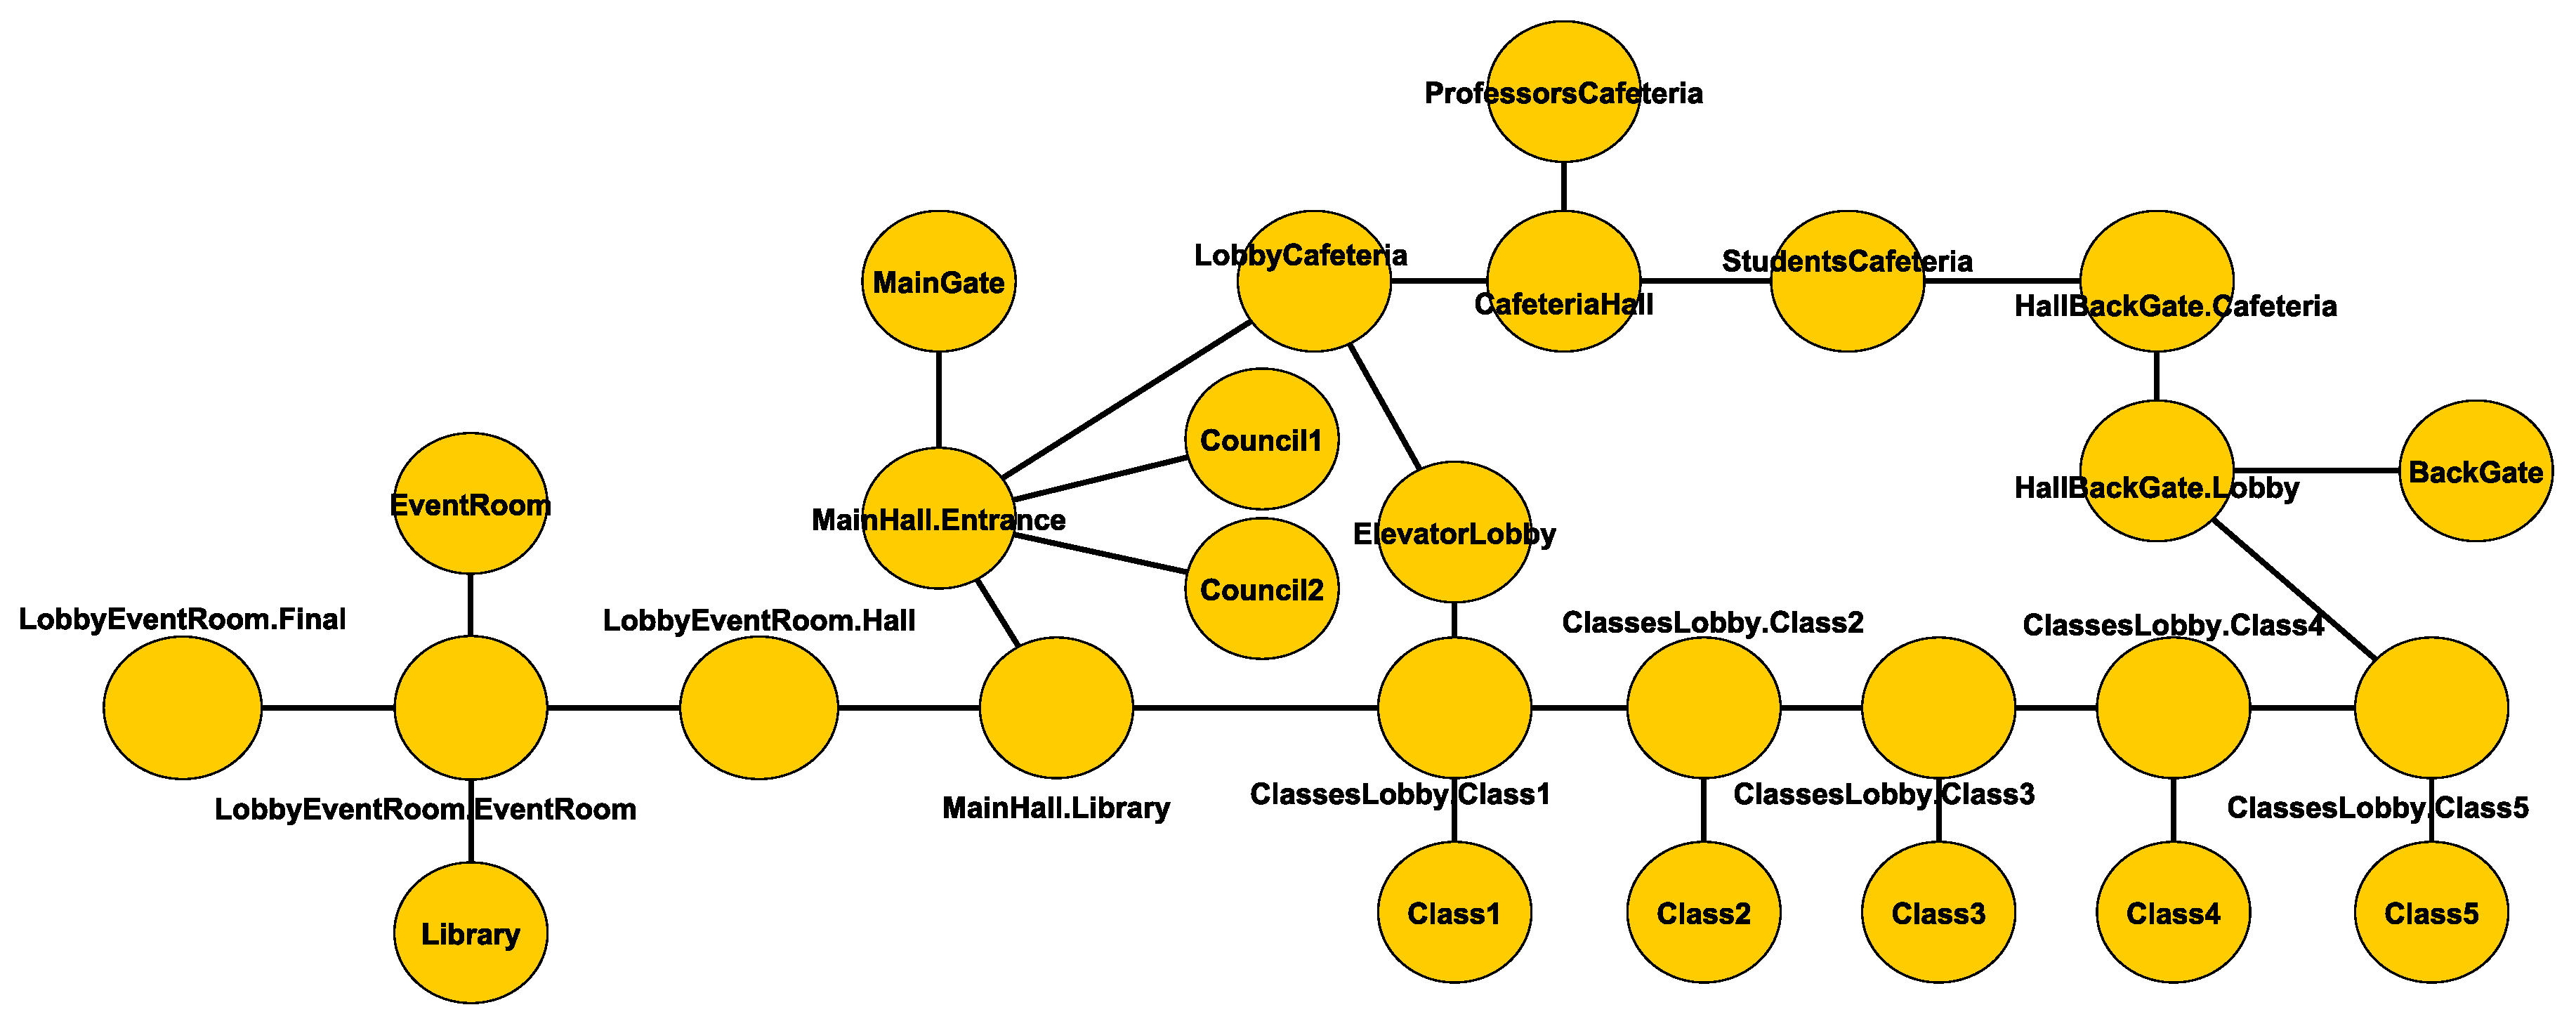
Figure 4.
The division of the environment in Regions. (Capture obtained from the MASSIS simulator. Leyend layer added afterwards).
Figure 4.
The division of the environment in Regions. (Capture obtained from the MASSIS simulator. Leyend layer added afterwards).
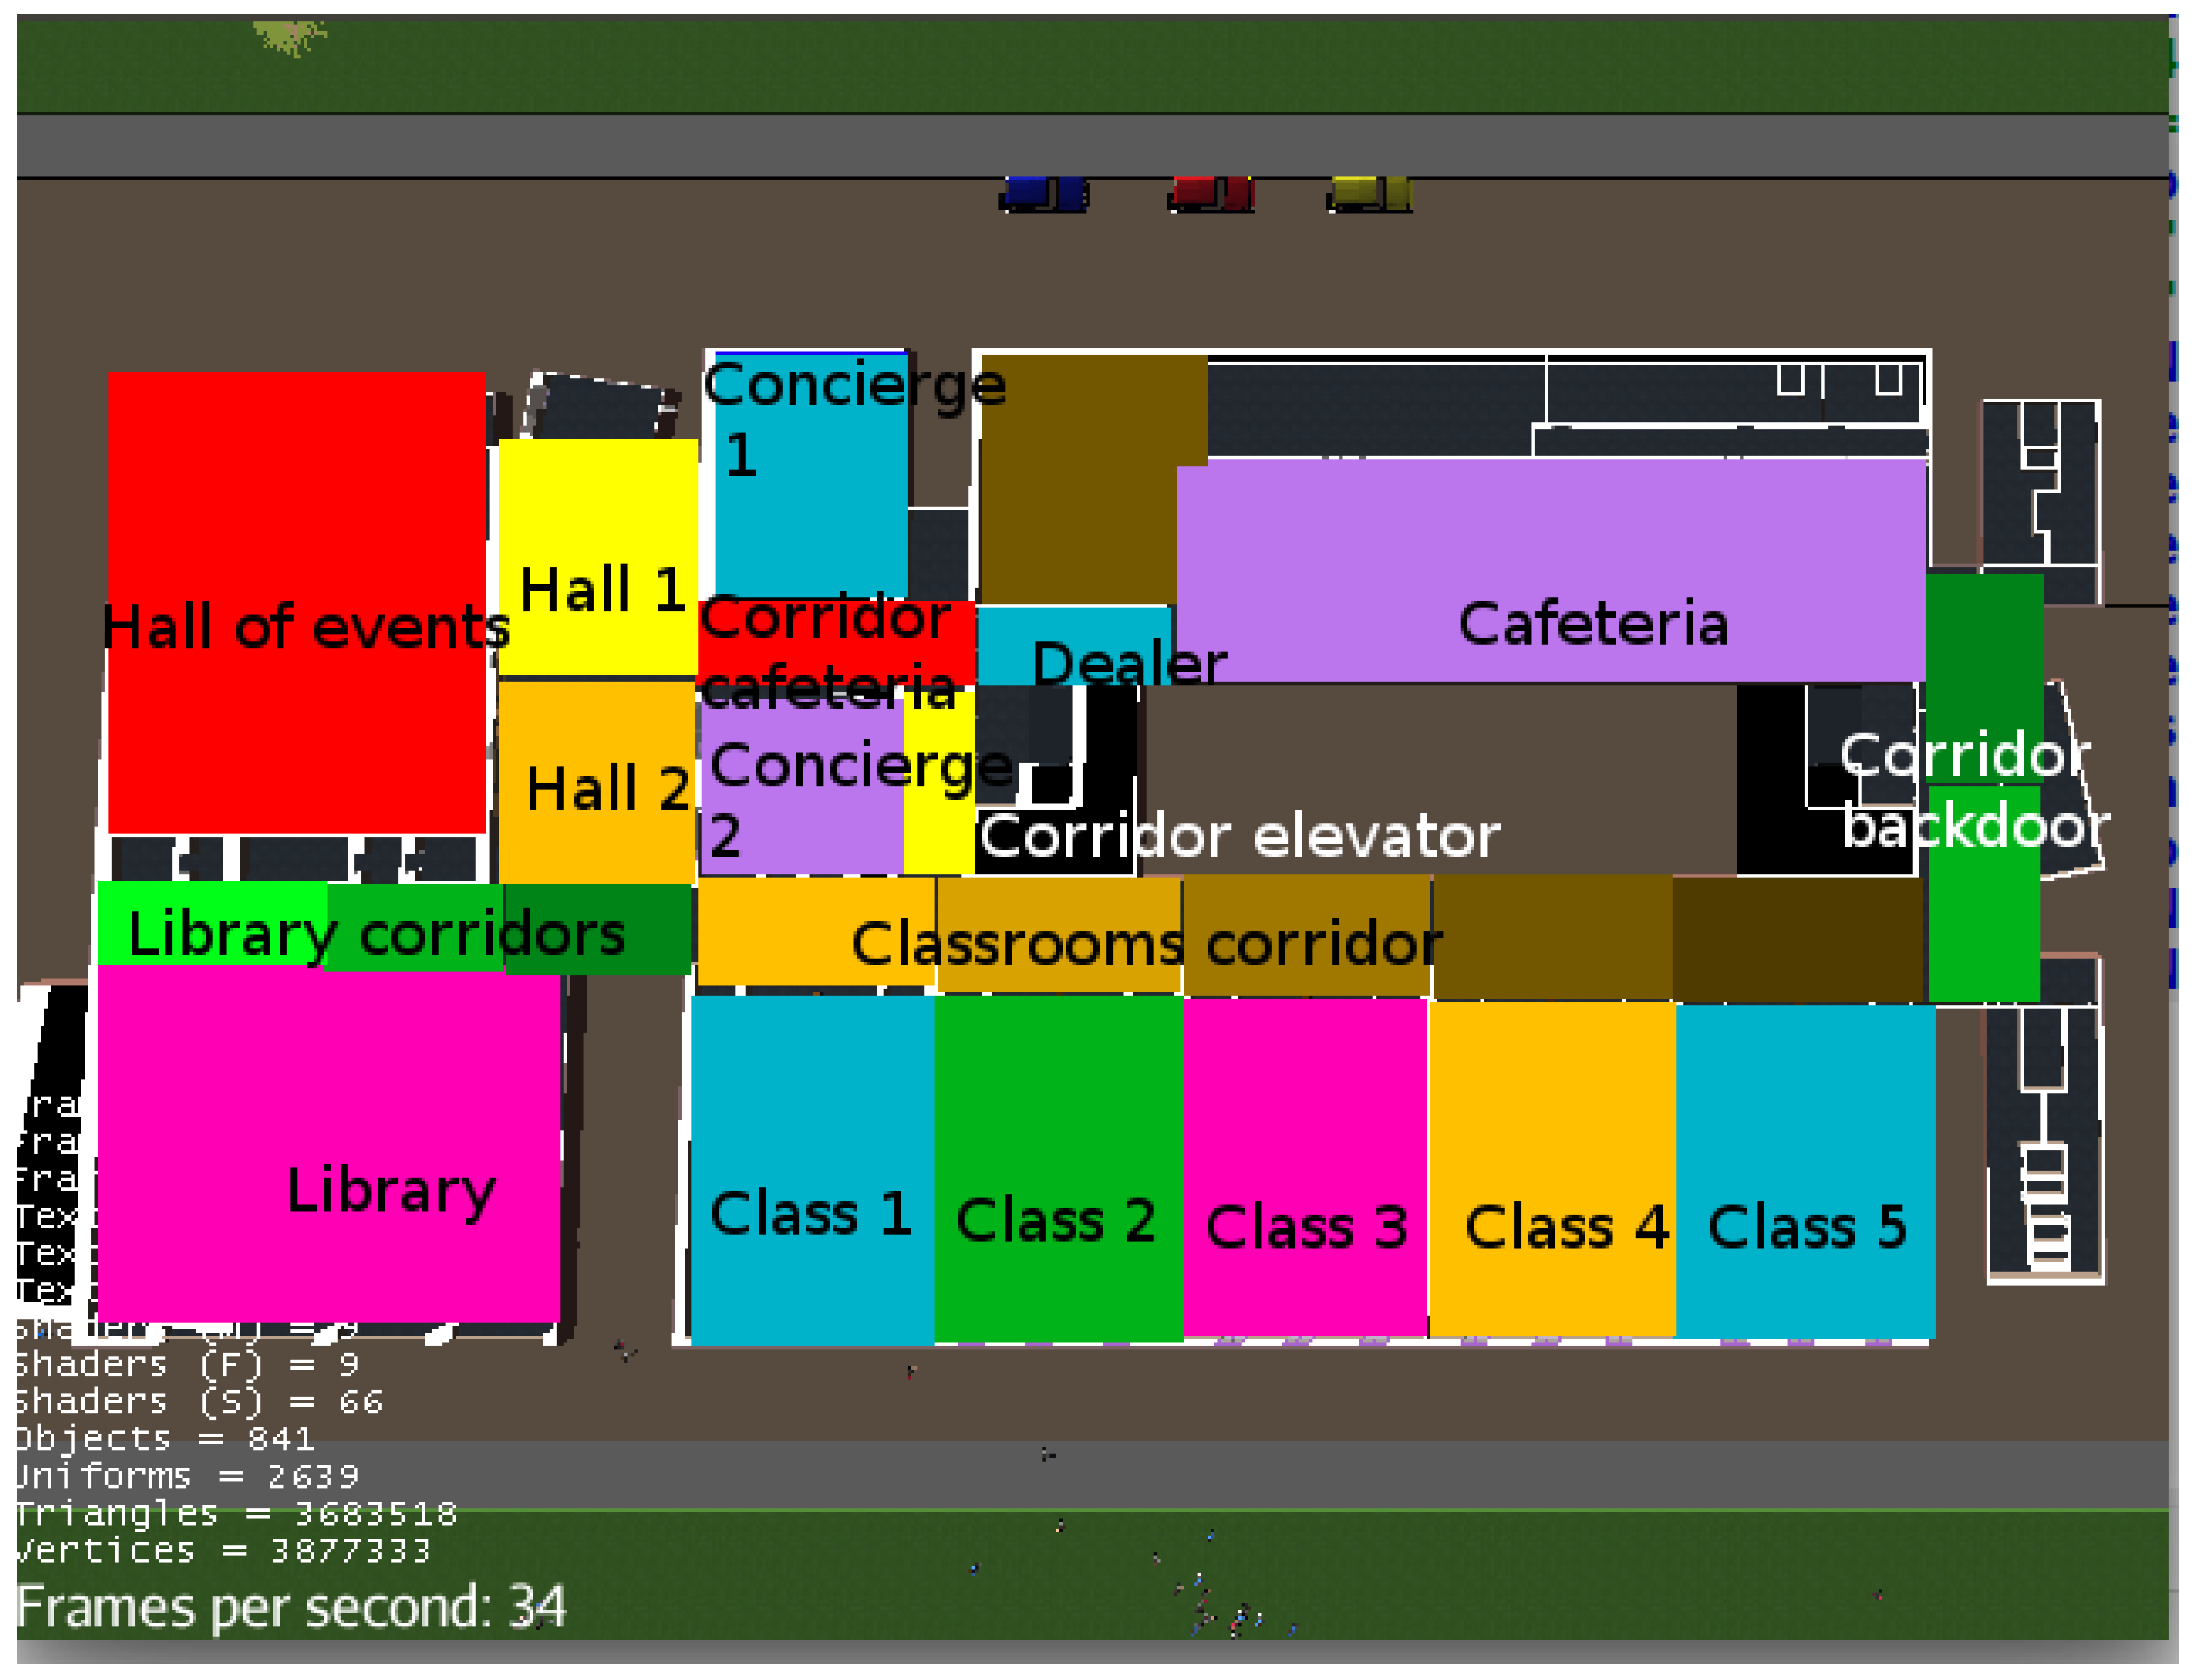
Figure 5.
Experiments results comparing MASSIS and graph of queues per node in the first and second scenarios.
Figure 5.
Experiments results comparing MASSIS and graph of queues per node in the first and second scenarios.

Table 1.
The range of value of three types of parameters codified in the genetic individual.
| Type of Parameter | Range of Value | |
|---|---|---|
| Min | Max | |
| Max Queue size | 5 | 600 |
| Time to traverse a node | 0 | 40 |
| Link size | 2 | 20 |
Table 2.
Table that summarizes the results obtained by the best individual obtained after the application of the GA in the different scenarios.
Table 2.
Table that summarizes the results obtained by the best individual obtained after the application of the GA in the different scenarios.
| Scen. | GA Setup | |||||||
|---|---|---|---|---|---|---|---|---|
| P | Gen | Sel | Cross | Cr | Mr | El | Similarity | |
| 1 | 1500 | 2000 | TU | UN | 50% | 10–90% | 2 | 0.9341 |
| 2 | 1500 | 2000 | TU | UN | 50% | 10–90% | 2 | 0.9609 |
| 3 | 1500 | 2000 | TU | UN | 50% | 10–90% | 2 | 0.8974 |
| 3 | 1500 | 2000 | TU | UN | 50% | 10–90% | 2 | 0.9096 |
Table 3.
The summary table with the scenarios used to configuring the simulator and the scenario used to validate it.
Table 3.
The summary table with the scenarios used to configuring the simulator and the scenario used to validate it.
| Scenarios Used to Train | |||||
|---|---|---|---|---|---|
| Scenario 1 | Scenario 2 | Scenario 3 | Scenario 4 | Valid. Scenario | Valid. Similarity |
| - | X | X | X | 1 | 0.1381 |
| X | - | X | X | 2 | 0.1608 |
| X | X | - | X | 3 | 0.7197 |
| X | X | X | - | 4 | 0.7139 |
Publisher’s Note: MDPI stays neutral with regard to jurisdictional claims in published maps and institutional affiliations. |
© 2018 by the authors. Licensee MDPI, Basel, Switzerland. This article is an open access article distributed under the terms and conditions of the Creative Commons Attribution (CC BY) license (https://creativecommons.org/licenses/by/4.0/).
Share and Cite
MDPI and ACS Style
Sagredo-Olivenza, I.; Cárdenas-Bonett, M.; Gómez-Sanz, J.J.; Pavón, J. Using Graphs of Queues and Genetic Algorithms to Fast Approximate Crowd Simulations. Proceedings 2018, 2, 1216. https://doi.org/10.3390/proceedings2191216
AMA Style
Sagredo-Olivenza I, Cárdenas-Bonett M, Gómez-Sanz JJ, Pavón J. Using Graphs of Queues and Genetic Algorithms to Fast Approximate Crowd Simulations. Proceedings. 2018; 2(19):1216. https://doi.org/10.3390/proceedings2191216
Chicago/Turabian StyleSagredo-Olivenza, Ismael, Marlon Cárdenas-Bonett, Jorge J. Gómez-Sanz, and Juan Pavón. 2018. "Using Graphs of Queues and Genetic Algorithms to Fast Approximate Crowd Simulations" Proceedings 2, no. 19: 1216. https://doi.org/10.3390/proceedings2191216