Extended Abstract

Numerical Simulation of the Dynamics of Listeria Monocytogenes Biofilms †

by
Eva Balsa-Canto
1,
Alejandro López-Núñez
2,* and
Carlos Vázquez
2
1
Process Engineering Group, IIM-CSIC, Spanish Council for Scientific Research, Eduardo Cabello 6, 36208 Vigo, Spain
2
Department of Mathematics, University of A Coruña, Campus Elviña s/n, 15071 A Coruña, Spain
*
Author to whom correspondence should be addressed.
Presented at the XoveTIC Congress, A Coruña, Spain, 27–28 September 2018.
Proceedings 2018, 2(18), 1182; https://doi.org/10.3390/proceedings2181182
Published: 18 September 2018
(This article belongs to the Proceedings of XoveTIC Congress 2018)

Abstract

:
A biofilm is a layer of microorganisms attached to a surface and protected by a matrix of exopolysaccharides. Biofilm structures difficult the removal of microorganisms, thus the study of the type of structures formed throughout a biofilm life cycle is key to design elimination techniques. Also, the study of the inner mechanisms of a biofilm system is of the utmost importance in order to prevent harmful biofilms formation and enhance the properties of beneficial biofilms. This study must be achieved through the combination of mathematical modelling and experimental studies. Our work focuses on the study of biofilms formed by Listeria monocytogenes, a pathogen bacteria, specially relevant in food industry. Listeria is highly resistant to biocides and appears in common food surfaces even after decontamination processes. Their biofilms can develop quite different structures, from flat biofilms to clustered or honeycomb structures. In the present work, we develop 1D and 2D models that simulate the dynamics of biofilms formed by different strains of L. monocytogenes. All this models are solved with efficient numerical methods and robust numerical techniques, such as the Level Set method. The numerical re sults are compared with the experimental measurements obtained in the Instituto de Investigaciones Marinas, CSIC (Vigo, Spain), and the Micalis Institute, INRA (Massy, France).

Published: 18 September 2018

1. Introduction

Listeria monocytogenes is a pathogenic bacteria responsible for outbreaks of listeriosis. The main mode of transmission of this pathogen to humans is the consumption of contaminated food through contact with unhygienic work surfaces and facilities where L. monocytogenes can form biofilms [1].
Biofilms structure determines the main physiological processes related to persistence and resistance. Therefore, structure characterization is critical to design cost effective and environmentally friendly disinfection techniques [2]. Confocal laser scanner microscopy (CLSM) allows for in vivo and in situ biofilms observation.
In parallel to the experimental studies, the use of efficient mathematical models allows the prediction of the biofilm evolution for particular values of the involved parameters associated to different conditions. Having in view the experimental dynamics of the particular biofilm formed by the L1A1 L. monocytogenes strain, we start by considering the most successful 1D continuum model studied in the recent work [2]. With the knowledge acquired in the 1D model, a 2D continuum multi-species model is developed [3] so that we are able to describe several dynamics shown by different L. monocytogenes strains. Both models are solved numerically by applying efficient numerical techniques such as Crank-Nicolson schemes, WENO methods or the Level Set method [3,4]. The numerical results that arise are compared with the experimental measurements obtained in the IIM-CSIC (Vigo, Spain), and the Micalis Institute, INRA (Massy, France).

2. One-Dimensional Model

To elucidate the mechanisms explaining the life cycle of the biofilms formed by L1A1 strain we analysed several models until reaching the most successful one [2]. Unknown parameters from the model were estimated using data fitting techniques within the AMIGO2 toolbox [5]. The model is a 1D deterministic reaction-diffusion model. It consist of a set of (non-linear) partial differential equations (PDEs) which describe the spatio-temporal dynamics of biomass and nutrients. The key features of the model are:
  • There is a sharp front of biomass at the bulk/solid transition.
  • Biomass density can not exceed a maximum bound which is a parameter of the model.
  • Biomass production is due to nutrient consumption.
  • Nutrients diffuse in the bulk and in the biofilm with different diffusion constants.
  • The detachment is related to biofilm ageing.
All in all, the model is described by the following equations:
S t = x ( d 1 ( C ) S x ) K 1 S C
C t = d 2 2 C x + K 3 S C K 4 1 1 + e x p ( k d [ D m i n C B D ( t ) ] )
completed with appropriate initial and boundary conditions. Equation (1) describes the nutrients dynamics whereas Equation (2) describes the biomass dynamics.

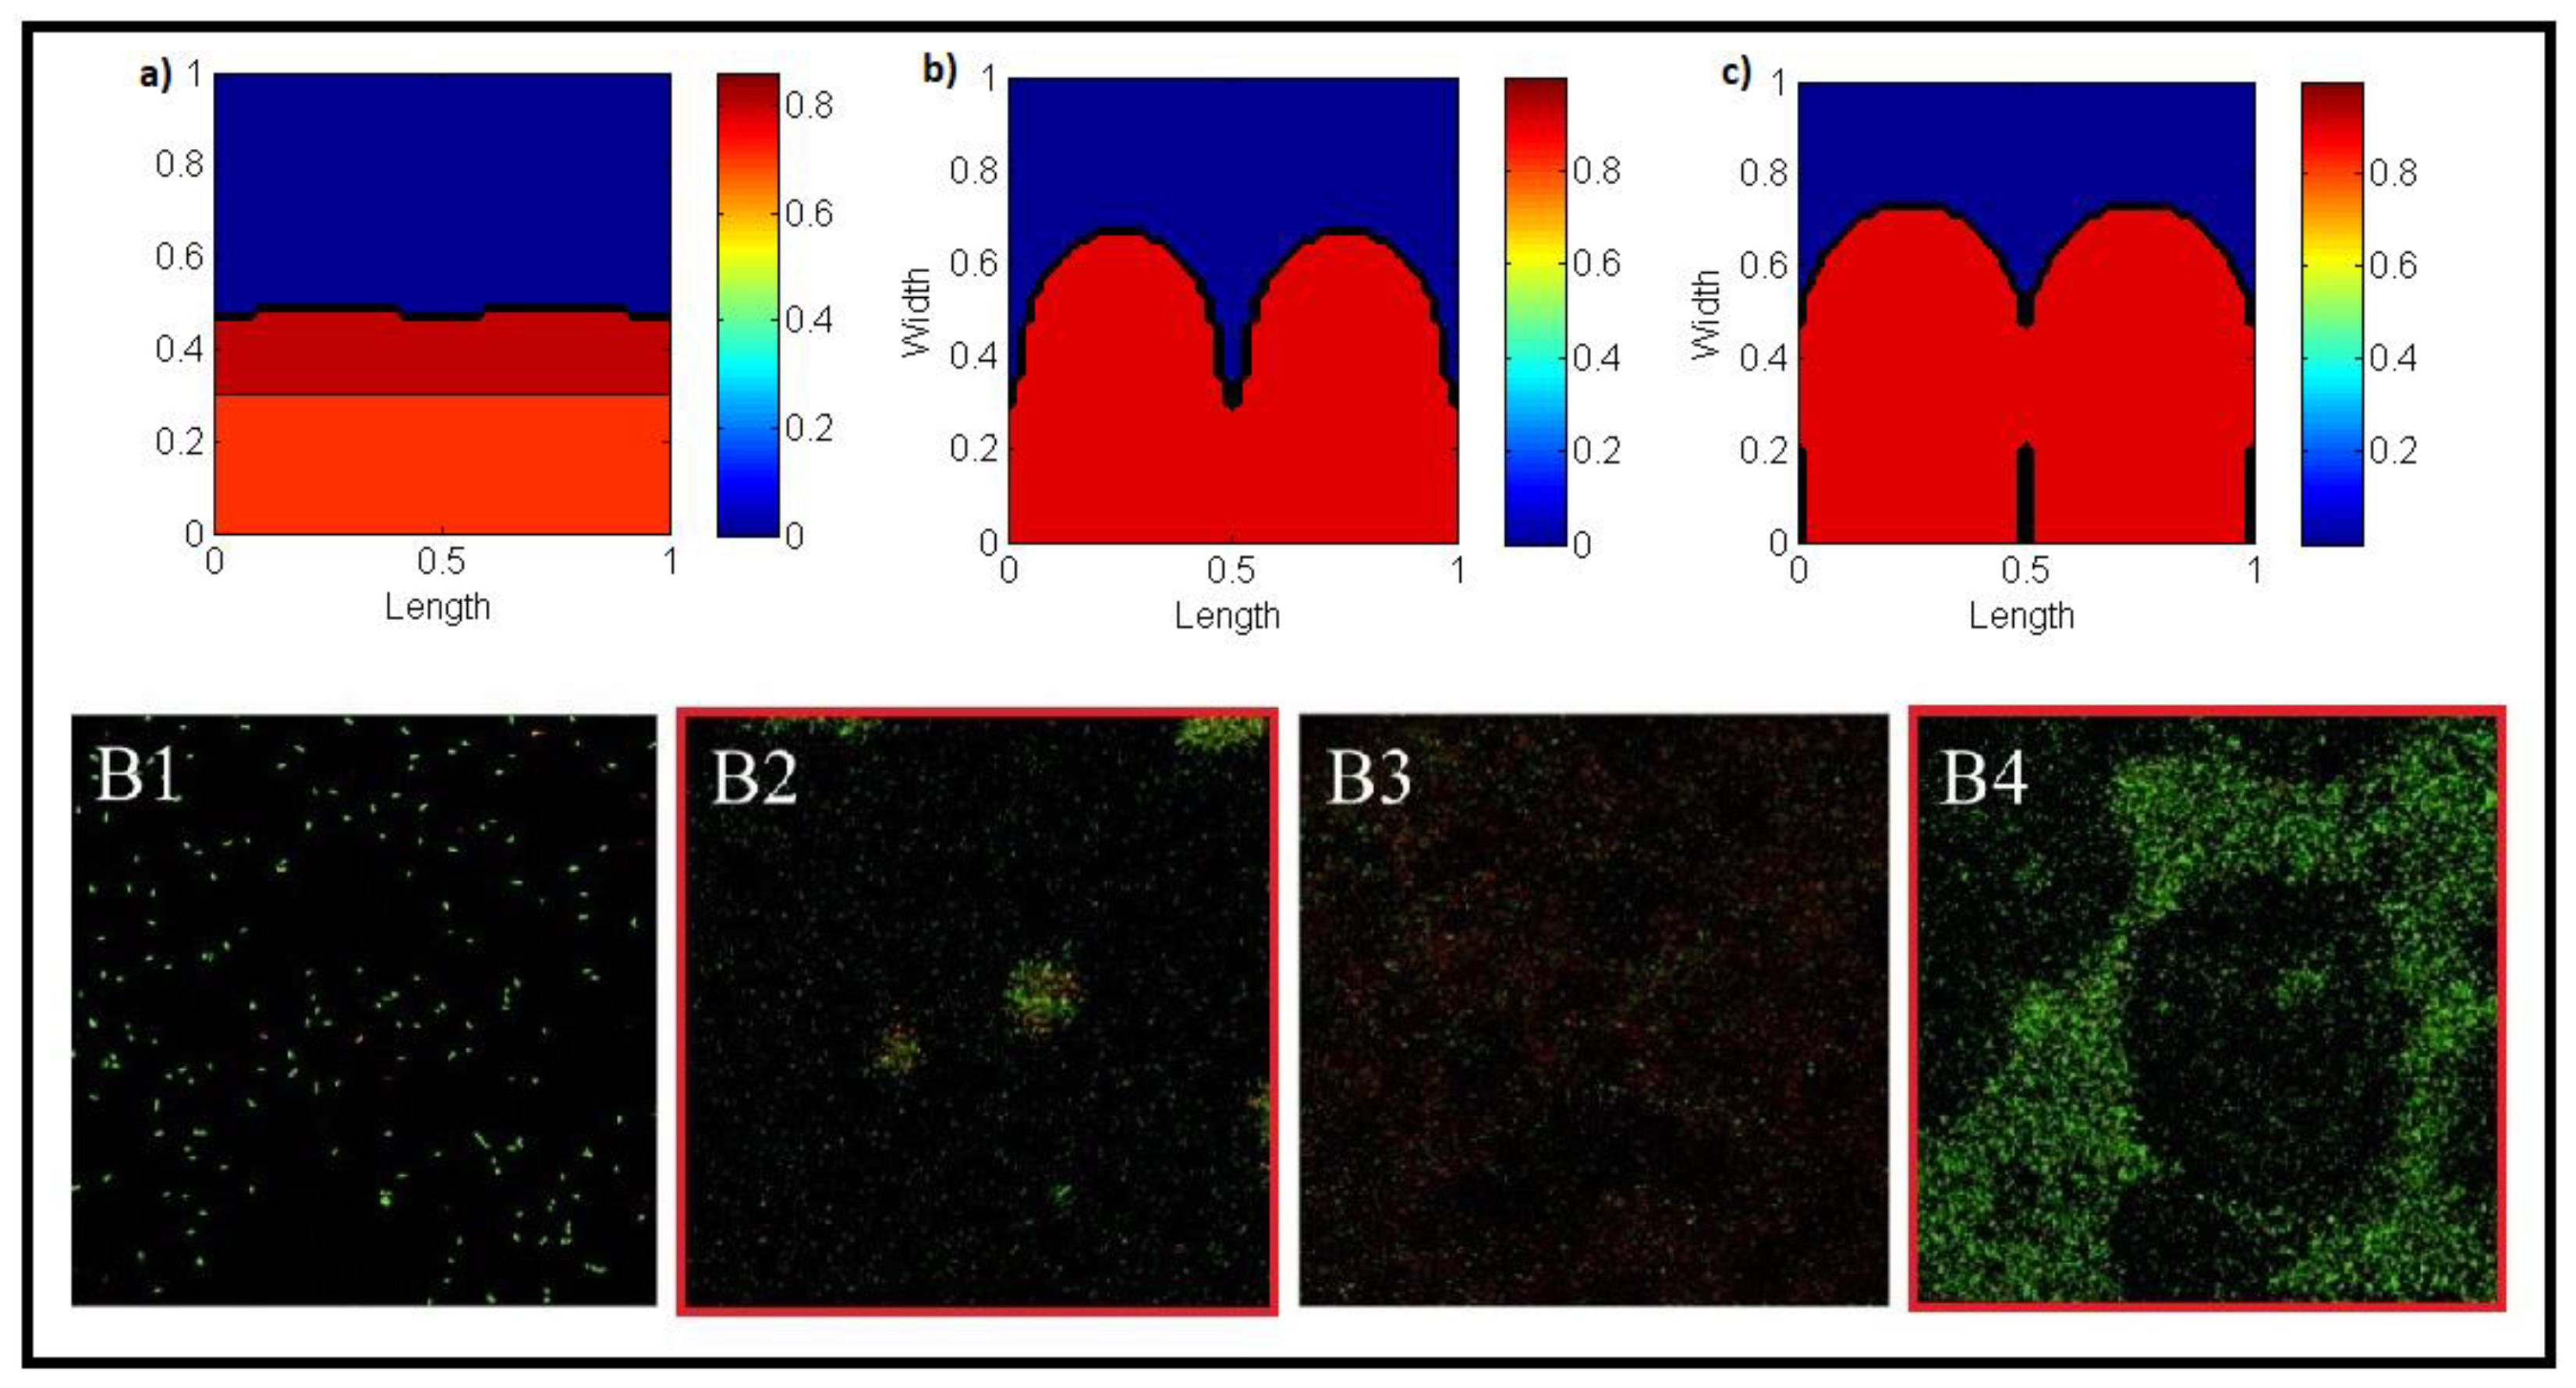
3. Two-Dimensional Model

With the insights provided by the 1D case, a two-dimensional model is built so that it is able to describe the dynamics of the L1A1 strain as well as the clustered or honeycomb patterns presented by other strains such as the CECT 5873 [6]. The proposed model is a deterministic multi-species model of the W-G type. The key hypotheses are:
  • Biofilm described as a viscous fluid.
  • Nutrients and biomasses concentrations governed by a mass conservation law.
  • Active and inactive biomasses are of the same microbial species and incompressible.
  • The time scale for the biomass-related processes is much slower that for the nutrients-related.
  • Nutrients are diluted in the media. Biomass exists only inside the biofilm.
  • The detachment is related to cells death and the degradation of the extracellular DNA, i.e., to biofilm ageing.
All in all, the model is described by the following equations:
2 S = V 1 h ^ T 2 S Ω H b ^ τ
2 P = V 1 Ψ ^ S V 1 F D ( V 2 ) Ω l τ
U ´ = P Ω l τ
τ Φ + F e | | Φ | | = 0 Ω l τ
τ V 1 P . V 1 = V 1 [ Ψ ^ S ( 1 1 + e x p ( k d ( D m i n m e a n ( V 2 ) ) ) + ε 2 ) V 1 ( Ψ ^ S 1 1 + e x p ( k d ( D m i n m e a n ( V 2 ) ) ) ) ] Ω l τ
τ V 2 P . V 2 = V 1 ε 2 V 2 ( V 1 Ψ ^ S V 1 1 + e x p ( k d ( D m i n m e a n ( V 2 ) ) ) ) Ω l τ
plus appropriate initial and boundary conditions. Equation (3) describes the nutrients dynamics and Equation (4) describes the biofilm expansion growth pressure. Equations (5) and (6) are related to the level set method. Equations (7) and (8) are the active and inactive biomass dynamics equations.

4. Results

After solving both models numerically with the appropriate optimal model parameters, the results yielded are presented in Figure 1 and Figure 2. Starting with the 1D case, Figure 1 it can be noted that biomass thickness is slowed down reaching its peak around 100 h. Nutrients are consumed until the nutrients impairing mechanism starts, preventing biomass from consuming all the nutrients in the domain. Also, it can be observed how the massive detachment happens in the final stage. Results reveal that the model is in clear agreement with the experimental data. Therefore concluding that the life cycle of L1A1 L. monocytogenes under the tested experimental conditions may be explained by taking into account impaired nutrients uptake and a massive detachment due to biofilm ageing.
As for the 2D model, Figure 2 shows the different dynamics achieved by the model with appropriate modifications for the model parameters. The results for the flat biofilms correspond to the dynamics of L1A1 L. monocytogenes and are in good agreement with the experimental measurements. On the other hand, the results for the clustered biofilms and honeycomb patterns represent the dynamics of the CECT 5873 L. monocytogenes strain at different stages of its life cycle, as can be seen in Figure 2, in cases B2 and B4 respectively.

Author Contributions

Conceptualization E.B.-C. and C.V.; Methodology E.B.-C., A.L.-N. and C.V.; Software A.L.-N.; Validation E.B.-C.; Formal analysis A.L.-N. and C.V.; Investigation E.B.-C.; Resources E.B.-C.; Supervision E.B.-C. and C.V.

Acknowledgments

This research was funded by FPU grant (ref. FPU13/02191) from the Spanish government, predoctoral grant (ref. PRE/2013/293) from the Galician Government, mobility grant from Centro Singular CITIC, Spanish projects MTM2016-76497-R and MTM2013-47800-C2-1-P, grant GRC2014/044 from the Galician Government and FEDER funds.

Conflicts of Interest

The authors declare no conflict of interest.

References

  1. Swaminathan, B.; Gerner-Smidt, P. The epidemiology of human listeriosis. Microbes Infect. 2007, 9, 1236–1243. [Google Scholar] [CrossRef] [PubMed]
  2. Balsa-Canto, E.; Vilas, C.; López-Núñez, A.; Mosquera-Fernández, M.; Briandet, R.; Cabo, M.L.; Vázquez, C. Modeling reveals the role of aging and glucose uptake impairment in L1A1 Listeria monocytogenes biofilm life cycle. Front. Microbiol. 2017, 8, 2118. [Google Scholar] [CrossRef] [PubMed]
  3. López-Núñez, A. Contributions to Mathematical Modelling and Numerical Simulation of Biofilms. Ph.D. Thesis, Universidade da Coruña, A Coruña, Spain, 2018. [Google Scholar]
  4. Balsa-Canto, E.; López-Núñez, A.; Vázquez, C. Numerical methods for a non-linear reaction-diffusion system modelling a batch culture of biofilm. Appl. Math. Model. 2017, 41, 164–179. [Google Scholar] [CrossRef]
  5. Balsa-Canto, E.; Henriques, D.; Gabor, A.; Banga, J.R. AMIGO2, a toolbox for dynamic modeling optimization and control in systems biology. Bioinformatics 2016, 32, 3357–3359. [Google Scholar] [CrossRef] [PubMed]
  6. Mosquera-Fernández, M.; Sánchez-Vizuete, P.; Briandet, R.; Cabo, M.L.; Balsa-Canto, E. Quantitative image analysis to characterize the dynamics of Listeria monocytogenes biofilms. Int. J. Food Microbiol. 2016, 236, 130–137. [Google Scholar] [CrossRef] [PubMed]
Figure 1. Best fit for the real data of the averaged nutrients and biofilm thickness dynamics predicted by the 1D model. Red line corresponds to the numerical results whereas the black points correspond to the experimental measurements.
Proceedings 02 01182 g001
Figure 2. Numerical results for the active biomass in the 2D case. Above: (a) flat biofilms; (b) clusterd biofilms, (c) Honeycomb pattern. Below: CECT 5873 dynamics with IMARIS. Starting with an initial attachment (B1), the biofilm develops a clustered structure (B2). After the apparition of an important quantity of inert biomass (B3), the biofilm develops a honeycomb structure. Source: [6].
Proceedings 02 01182 g002
Publisher’s Note: MDPI stays neutral with regard to jurisdictional claims in published maps and institutional affiliations.

