1. Introduction
Architects and engineers will have a major role in designing future buildings of a high environmental quality combined with a high quality indoor environment [
1]. The World Health Organization (WHO) emphasizes that indoor environmental conditions influence the health and well-being of building occupants. To achieve better indoor environmental conditions, heating and cooling are required, either by natural ventilation or by mechanical modes. Natural ventilation can reach much higher ventilation rates than mechanical ventilation systems, which are especially designed for fresh air supply. Passive solar heating and HVAC systems (heating, ventilation and air-conditioning) in cold and warm climates of both summer and winter are used to design energy efficient buildings.
Thermal comfort is determined by occupants and by estimating indoor environmental parameters. “Thermal comfort” describes a person’s psychological state of mind and is usually referred to in terms of whether someone is feeling too hot or too cold. Discomfort and illness among building occupants is commonly discussed in terms of “sick building syndrome”. Factors that are considered to evaluate indices to define local, overall thermal sensation and comfort are air temperature and speed, exterior/interior glass/façade radiant temperatures, transient effect, heat loss by evaporation, convection, radiation, and conduction are considered. Thermo-physiological model integrated with CFD simulation models takes into account heat and moisture transfer, humidity, metabolic rate and clothing insulation for evaluating thermal comfort. The predicted mean vote model developed by Fanger is the most widely used model to evaluate the thermal comfort index considering skin temperature and metabolic rate when assessing indoor thermal environments [
2].
In the present work, a three dimensional model of an office is developed using SOLIDWORKS
® software version 2018. Model parameters assume the office is kept at an ambient temperature of 21 °C with an outside building temperature of 0 °C with an airflow rate of 0.01 m
3/s to maintain air circulation with in the office. The current study is designed to determine comfort factors i.e., PMV and PPD for the office model to assess the comfort level. The model is further extended to study the perception of draughts with coolness/warmth of home in terms of draught rate (%) and draught temperature. The results obtained in the simulation model are compared with the ASHRAE standard 55-2010 [
3].
2. Thermal Comfort Theory
Assessment of the thermal environment in the occupied zone requires knowing the thermal comfort parameters as well as factors which provide information about air quality, calculated with the HVAC’s data are PPD, PMV, draught temperature, draught rate, air diffusion performance index, contaminant removal effectiveness, local air quality index. However, thermal comfort depends on six major factors as defined by Fanger [
2]. These are categorized into ‘individual’ factors and ‘environmental’ factors. Metabolic rate, clothing insulation, air temperature, mean radiant temperature, air velocity, and water vapor pressure are the factors required to achieve thermal equilibrium in a steady state condition. The perception of thermal sensation and human comfort depends on maintaining a balance between heat produced by the human body and the heat loss with surroundings. Heat generated by the human body are depends on human metabolic rate (M), similarly heat loss occurs through respiration (Res) and latent heat of evaporation from skin (E) (due to sweat) are considered to estimate the net heat generated by human body.
Heat balance of the human body, where thermal equilibrium corresponds to a null S value:
where ‘W’ represents mechanical work, ‘R’ radiation, ‘C’ convection, ‘K’ conduction.
First index called the Predicted Mean Vote (PMV) can be estimated by metabolic rate and net thermal load ‘L’.
The PMV equation only applies to humans exposed for a long period to constant conditions at a constant metabolic rate.
Similarly, another index called the predicted percentage dissatisfied is expressed in terms of PMV are as follows:
ASHARE standard 55 [
3] or ISO 7730: 2005 [
4] states that the following condition to be met to establish comfort levels.
Apart from thermal comfort, other factors that can influence comfort levels are usability of a space, acoustics, ventilation, daylight and energy use in a building. The present article focus on ventilation and a heat source role on comfort levels.
3. Simulation of Indoor Environment
3.1. Three Dimension Model
In the present work, a three-dimensional model representing a large office room in an building are designed using Solidworks
® version 2018 software (Dassault Systèmes SolidWorks Corporation, UK).
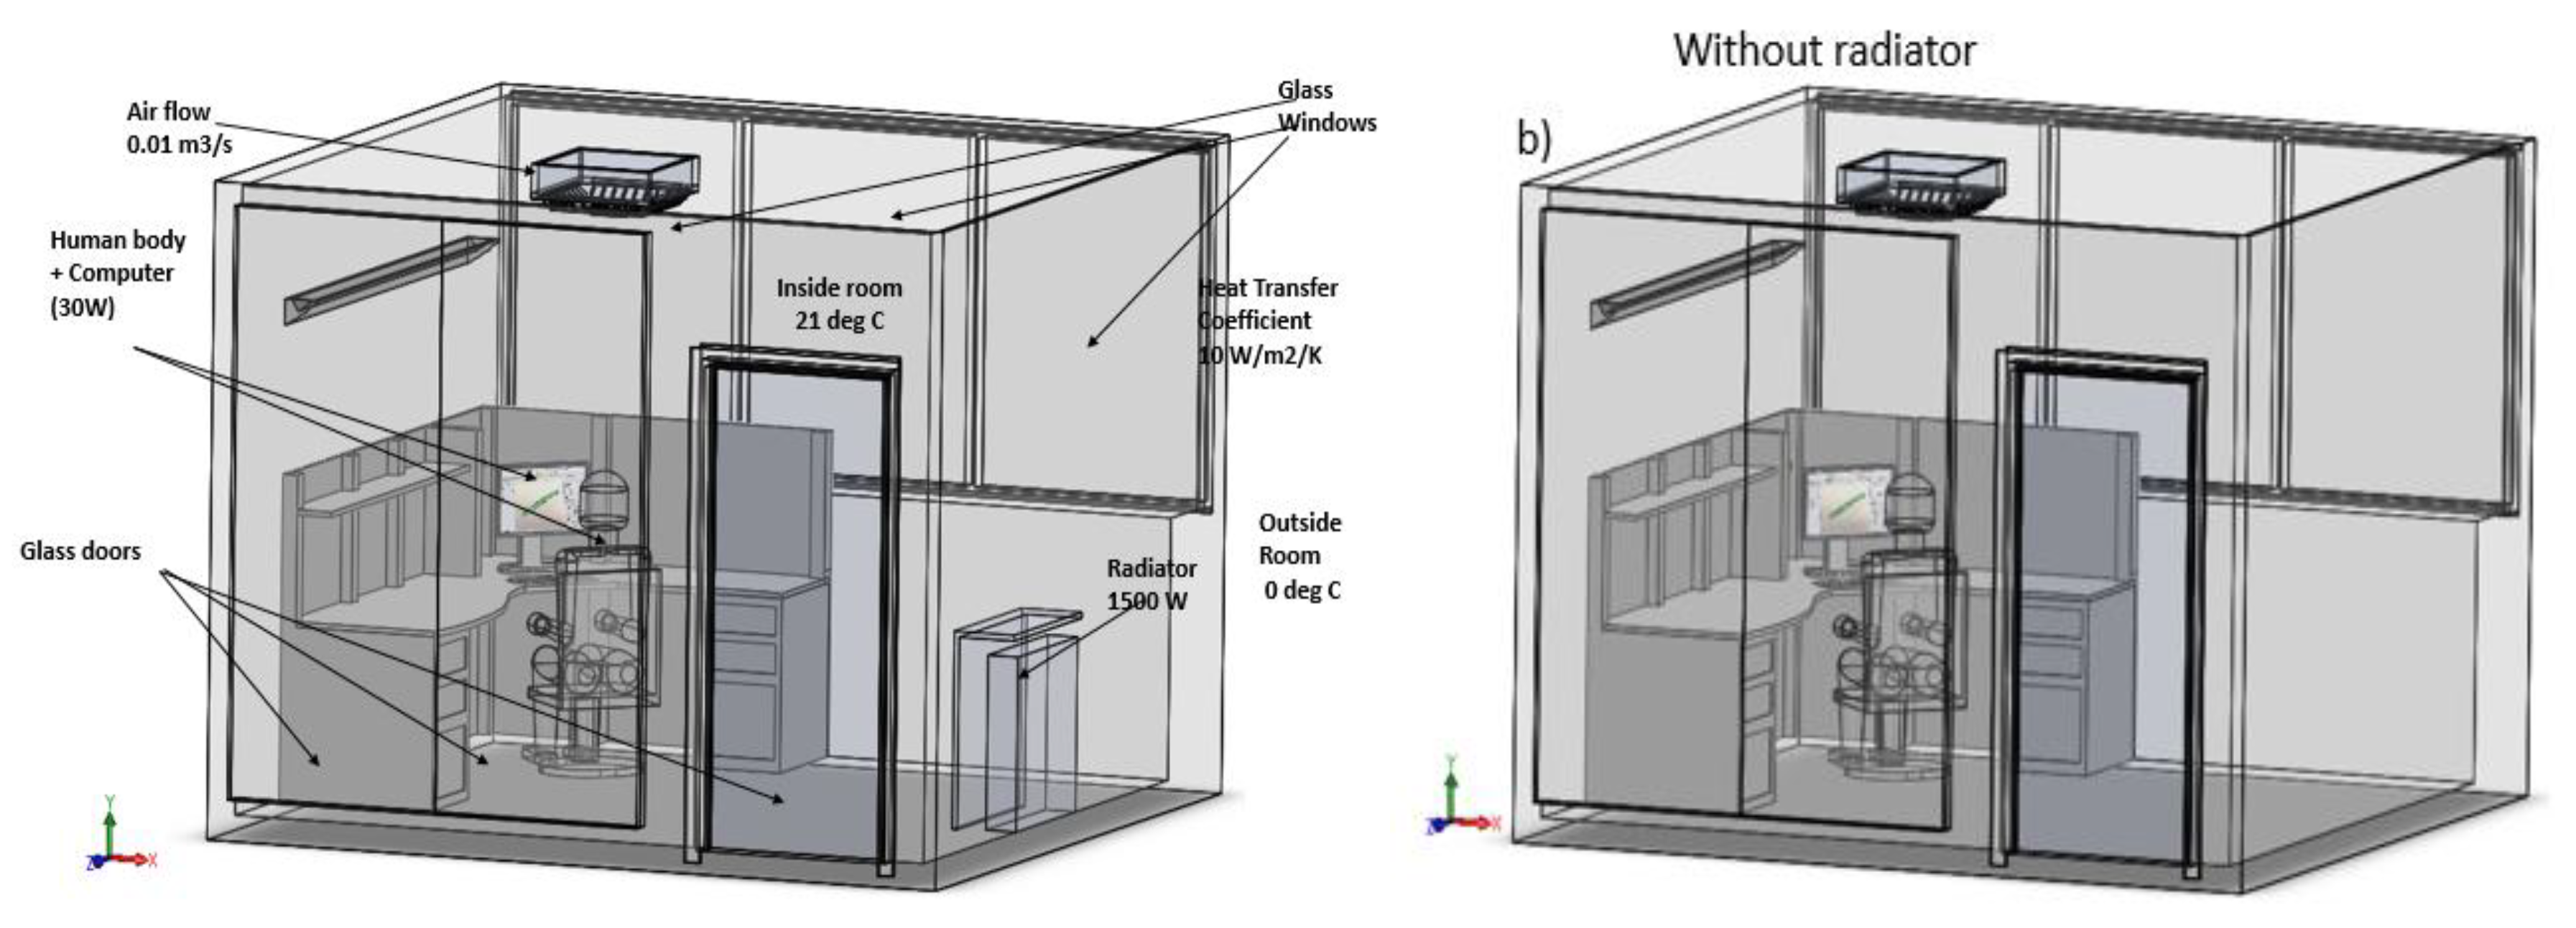
Figure 1a represents the 3D model used for computational fluid dynamic (CFD) simulations accounting HVAC systems with indoor air (21 °C) and outdoor temperatures (0 °C). HVAC module has building materials library, which allow defining real case material properties for model components. From
Figure 1a it is clear that, three windows are fitted at rear wall, there are two glass walls, and one glass door is fitted on the front side of the office room. A natural ventilation is provided through windows, the front door, as well at a vent in the ceiling, and a radiator is placed at inside the wall surface.
3.2. Model Parameters
To simulate the office model and predict the comfort level of the occupant few data from literature are used [
5]. The following parameters are defined in the simulation model:
Glass material are defined as Quartz glass with radiation transparency with an absorptive coefficient. The values of absorptive coefficient vary with wavelength of the solar radiation
Assuming hardboard (medium) are chosen to define boards, sheets and decking with a heat transfer co-efficient 10 W/m2/K
Natural ventilation at the ceiling with a volume flow rate 0.01 m3/s
Heat source—radiator (1500 Watt) and human body (30 Watt)
4. Results and Discussions
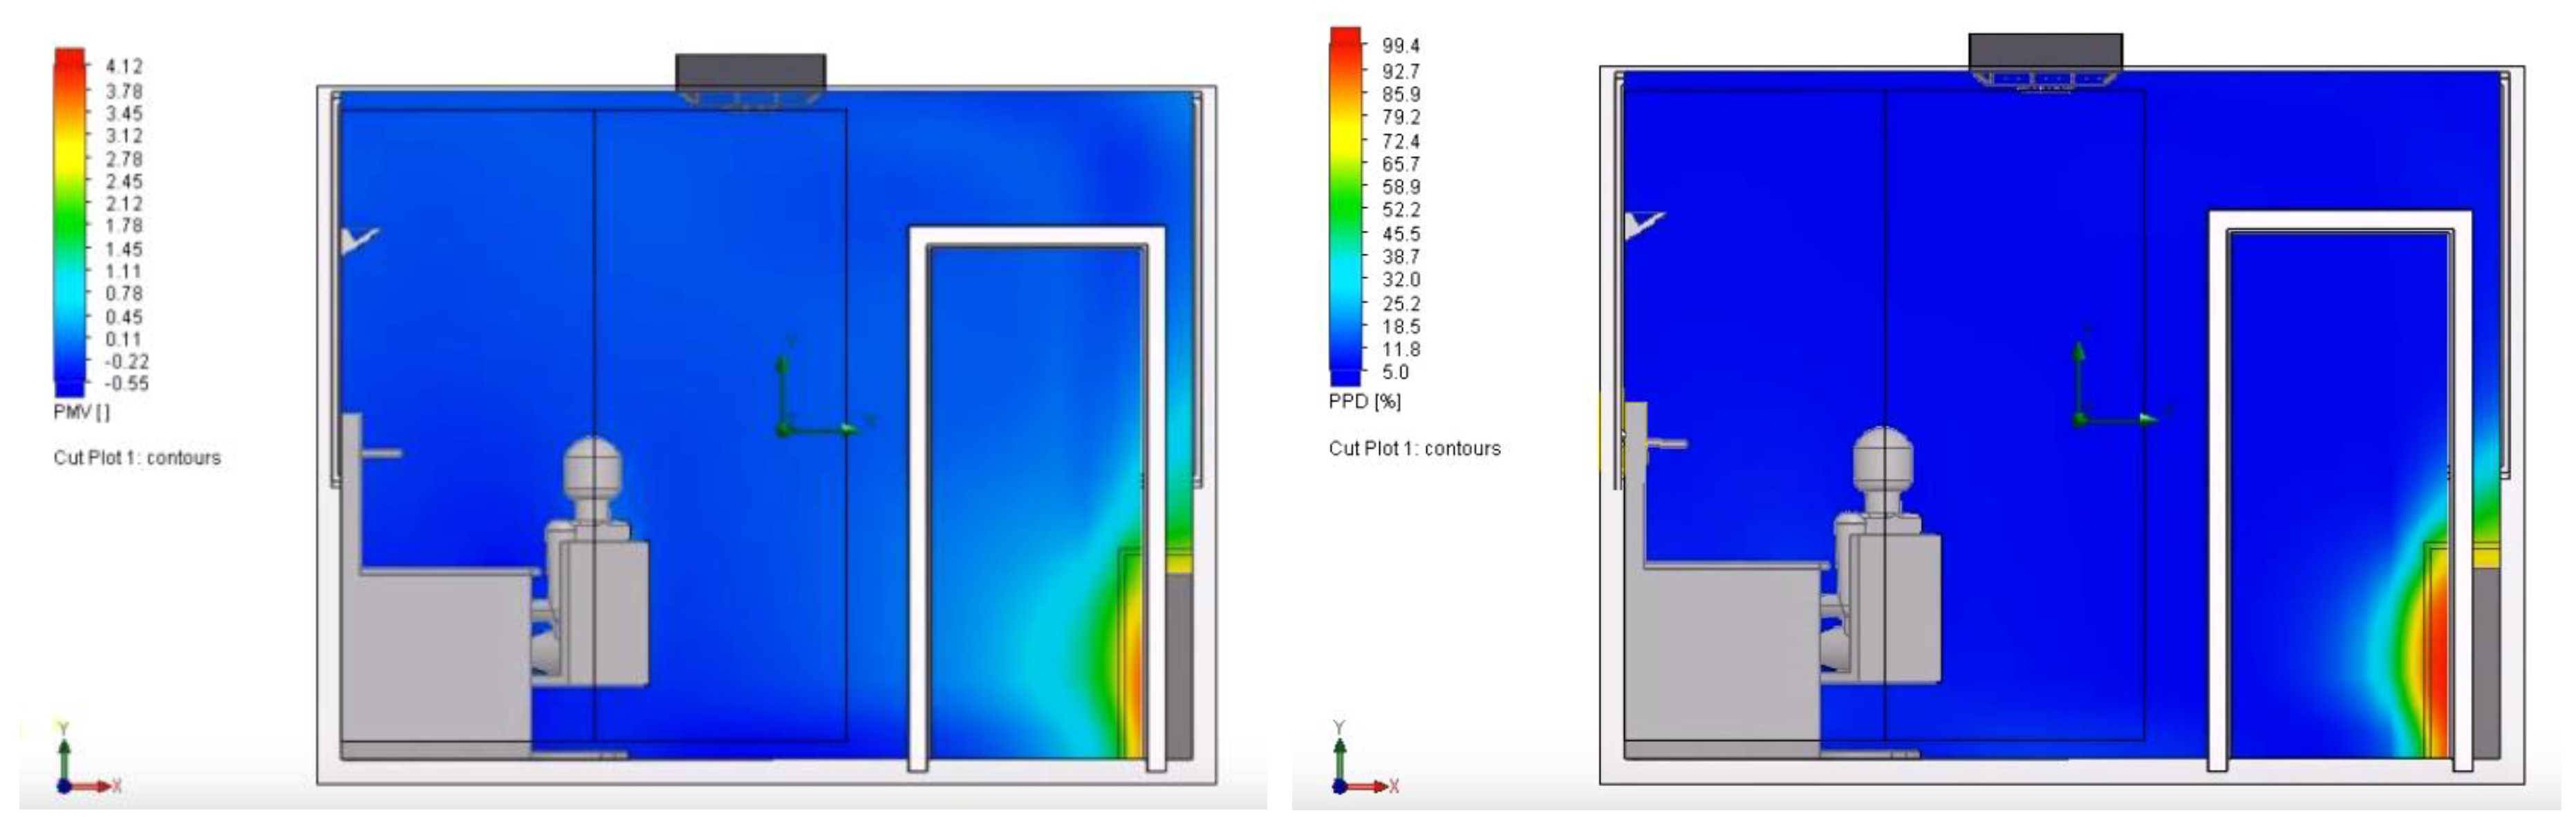
PMV is defined as a well-known standard indicator for thermal sensation and comfort, the prediction index were computed using CFD tool i.e., SOLIDWORKS flow simulation software. PMV model is subjective human perception, expressed through the vote of comfort on a scale ranging from −3 (very cold) to +3 (very hot), and the difference between the heat generated and the heat released by the human body. The accuracy of the results in any simulation will depend on the quality of the mesh and computational domain selected for analysis. The results indicate temperature around the radiator is warmer compared to the occupant location. Due to natural convection, glass window show much lower temperature compared to other portion of room.
Figure 2, represents a cut plot demonstrating the occupant sensation against thermal conditions exists inside the room. Simulation results indicate PMV values near the radiator is around 4, compared to occupant zone where the PMV value recorded closer to zero. If PMV value is zero, which indicate a neutral temperature feeling. The simulation results indicate the PMV value demonstrate the air temperature away from radiator would feel comfortable for a worker/occupant. Similarly, a cut plot shown in
Figure 2 represent PPD percentage, indicating occupant sitting away from the radiator would feel comfortable with the indoor air temperature.
The model will further extended to estimate the comfort factors for the office model without radiator (refer
Figure 1b), but maintaining other simulation parameters as same as model with radiator. In the future work, the model will be extended to account humidity level and radiation properties defining daylight spectrum to estimate the occupants comfort level.
5. Discussion and Conclusions
In this research, a three-dimensional numerical simulation has been developed using “CFD” software to predict the comfort level of the occupant. All the realistic conditions including the air temperature, occupant’s net heat load, radiator heat source, and solar radiation based on wavelength are precisely considered. The results PMV and PPD indices showed very reasonable data when compared with the existing literature on comfort levels of occupant (as defined by ASHARE standards). In the future work, the model can be further extended to account humidity levels and radiation properties defining daylight spectrum to check the comfort level of the occupant in the office by predicting PMV, PPD and additional indices i.e., draught rate, draught percentage, air diffusion performance index (ADPI).


