An Intrinsically Pressure Insensitive Low Cost Particle Number Diluter Featuring Flow Monitoring †


Institute of Electronic Sensor Systems, Graz University of Technology, 8010 Graz, Austria
*
Author to whom correspondence should be addressed.
†
Presented at the Eurosensors 2018 Conference, Graz, Austria, 9–12 September 2018.
Proceedings 2018, 2(13), 981; https://doi.org/10.3390/proceedings2130981
Published: 10 December 2018
(This article belongs to the Proceedings of EUROSENSORS 2018)
Abstract
:We present a low cost Particle Number (PN) diluter including mass flow monitoring. The device consists of a commercial hypodermic needle, a High Efficiency Particulate Air (HEPA) filter. and a custom-made flow sensor. The flow sensor is used to monitor the diluter’s performance and enable in-time replacement of the low cost elements used. Neither the sampling flow rate nor the pressure drop drastically change the dilution factor introduced by the presented device. This makes the presented device especially useful for particle number measurements at positions close to the tailpipe of internal combustion engine powered vehicles, where aggravating, fast pressure pulsations complicate correct sampling.
1. Introduction
The particle number emitted by vehicles has been regulated by European emission standards since 2011 (Euro 5b). The high PN concentrations in raw automotive exhaust exceed the upper measurement limits of state-of-the-art PN sensors, which makes dilution inevitable.
It is common practice to apply two dilution stages [1]. In some applications (e.g., raw exhaust sampling in real driving emission measurements) these two dilution stages may not sufficiently attenuate the particle number concentration, which makes a third dilution stage necessary. The introduced dilution stage must not distort the particle size distribution and should be robust against pressure fluctuations or drifts. Commonly used dilution solutions like the ejector diluter show a strong dependence of the dilution factor on the pressure level [2]. The device presented is designed to be insensitive to pressure fluctuations and drifts. It is made of low cost components and comprises flow monitoring to enable the replacement of these components before clogging compromises the device’s performance.
2. Results
The presented diluter consists of a hypodermic needle, a HEPA filter and custom made circuit for flow monitoring. The majority (≈95%) of the aerosol that runs through the diluter passes through the HEPA filter, where more than 99.97% of particles are removed. The rest of the sample passes through the hypodermic needle and is then mixed again with the filtered part of the sample [3]. Figure 1 shows the geometry and the flow velocities in the diluter as predicted by CFD simulations.
2.1. Theoretical Description
The diluter attenuates the particle number concentration by a factor that is called dilution ratio DR. For the presented diluter, DR is only dependent on the ratio between the flow rate through the filter Qf and the flow rate through the needle Qn:
where Qtot is the total flow rate through the diluter. The flow rate through the needle as a function of the pressure drop ∆p can be theoretically described with the Darcy-Weisbach equation. For the case of a hypodermic needle (0.6 mm inner diameter) and the relatively small pressure drop of approximately 10 mbar where the Reynolds number is below 10, the form for laminar flow can be used [4].
with µ being the dynamic viscosity of the fluid, D the hydraulic diameter of the needle and Ln the length of the needle. The fluid flow rate through a porous medium as a function of the pressure drop is described by Darcy’s law. The low Reynolds number justifies the theoretical description of the flow through the HEPA filter by this law [5]:
A is the cross-sectional area, Lf is the length of the filter and k is the permeability of the medium. Inserting Equations (2) and (3) into Equation (1) yields:
Equation (4) shows that the DR does not depend on the pressure drop over the diluter. This pressure drop insensitivity is very advantageous for the application in engine exhaust sampling where short and long time related pressure fluctuations occur. The device faces moderate temperatures and particle concentration levels if it is employed as a tertiary dilution stage. Therefore, the performance of the device is not significantly compromised by the deposition of particles, even at relatively long operation times.
2.2. Dilution Ratio in Simulation and Experiment
The flow through the filter and the needle at different pressure drops were measured using a Gilian Gilibrator 2 bubble flow meter. The measurements were done for the three different orientations of the needle orifice relative to the aerosol shown in Figure 2. Figure 3 shows the results of these measurements. The obtained measurement points where fitted with a power law:At ideal conditions the exponents b of all four fitted curves should amount to 1 according to Equations (2) and (3). The deviation of the observed values can be assigned to entrance and exit effects for the needle and to several turns and tapers in the filter path. For the needle turned by 180°, both fit parameters are larger than for the other orientations. In this case the aerosol is not only pushed through the needle by the static pressure drop but also by the dynamic pressure caused by the fluid flow. An illustration of the flow velocities for a total flow of predicted by CFD simulations is shown in Figure 1.
Figure 4 shows the DR for different total flow rates calculated from the data shown in Figure 3 and the dilution ratio as predicted by 3-D CFD simulations performed using COMSOL. The experimental and the simulation data agree reasonably well. At low flow rates, the influence of the orientation decreases, because the dynamic pressure effects scale quadratically with the flow rate. The diluter with the α = 180° needle orientation shows a smaller pressure drop sensitivity than the one with α = 0°. The DR shows a very small dependency on the total flow rate compared to the ejector diluter and it can be further reduced by geometry optimizations.
2.3. Flow Monitoring
An agglomeration of deposited particles inside the needle or the filter can lead to a change in the pressure drop to flow characteristics, which consequently changes the DR of the device. To enable in-time replacement of the needle or the filter, the flow through the needle is monitored. If the total flow rate is known (this is usually the case), monitoring the flow rate through the needle enables the direct calculation of the dilution ratio (Equation (1)).
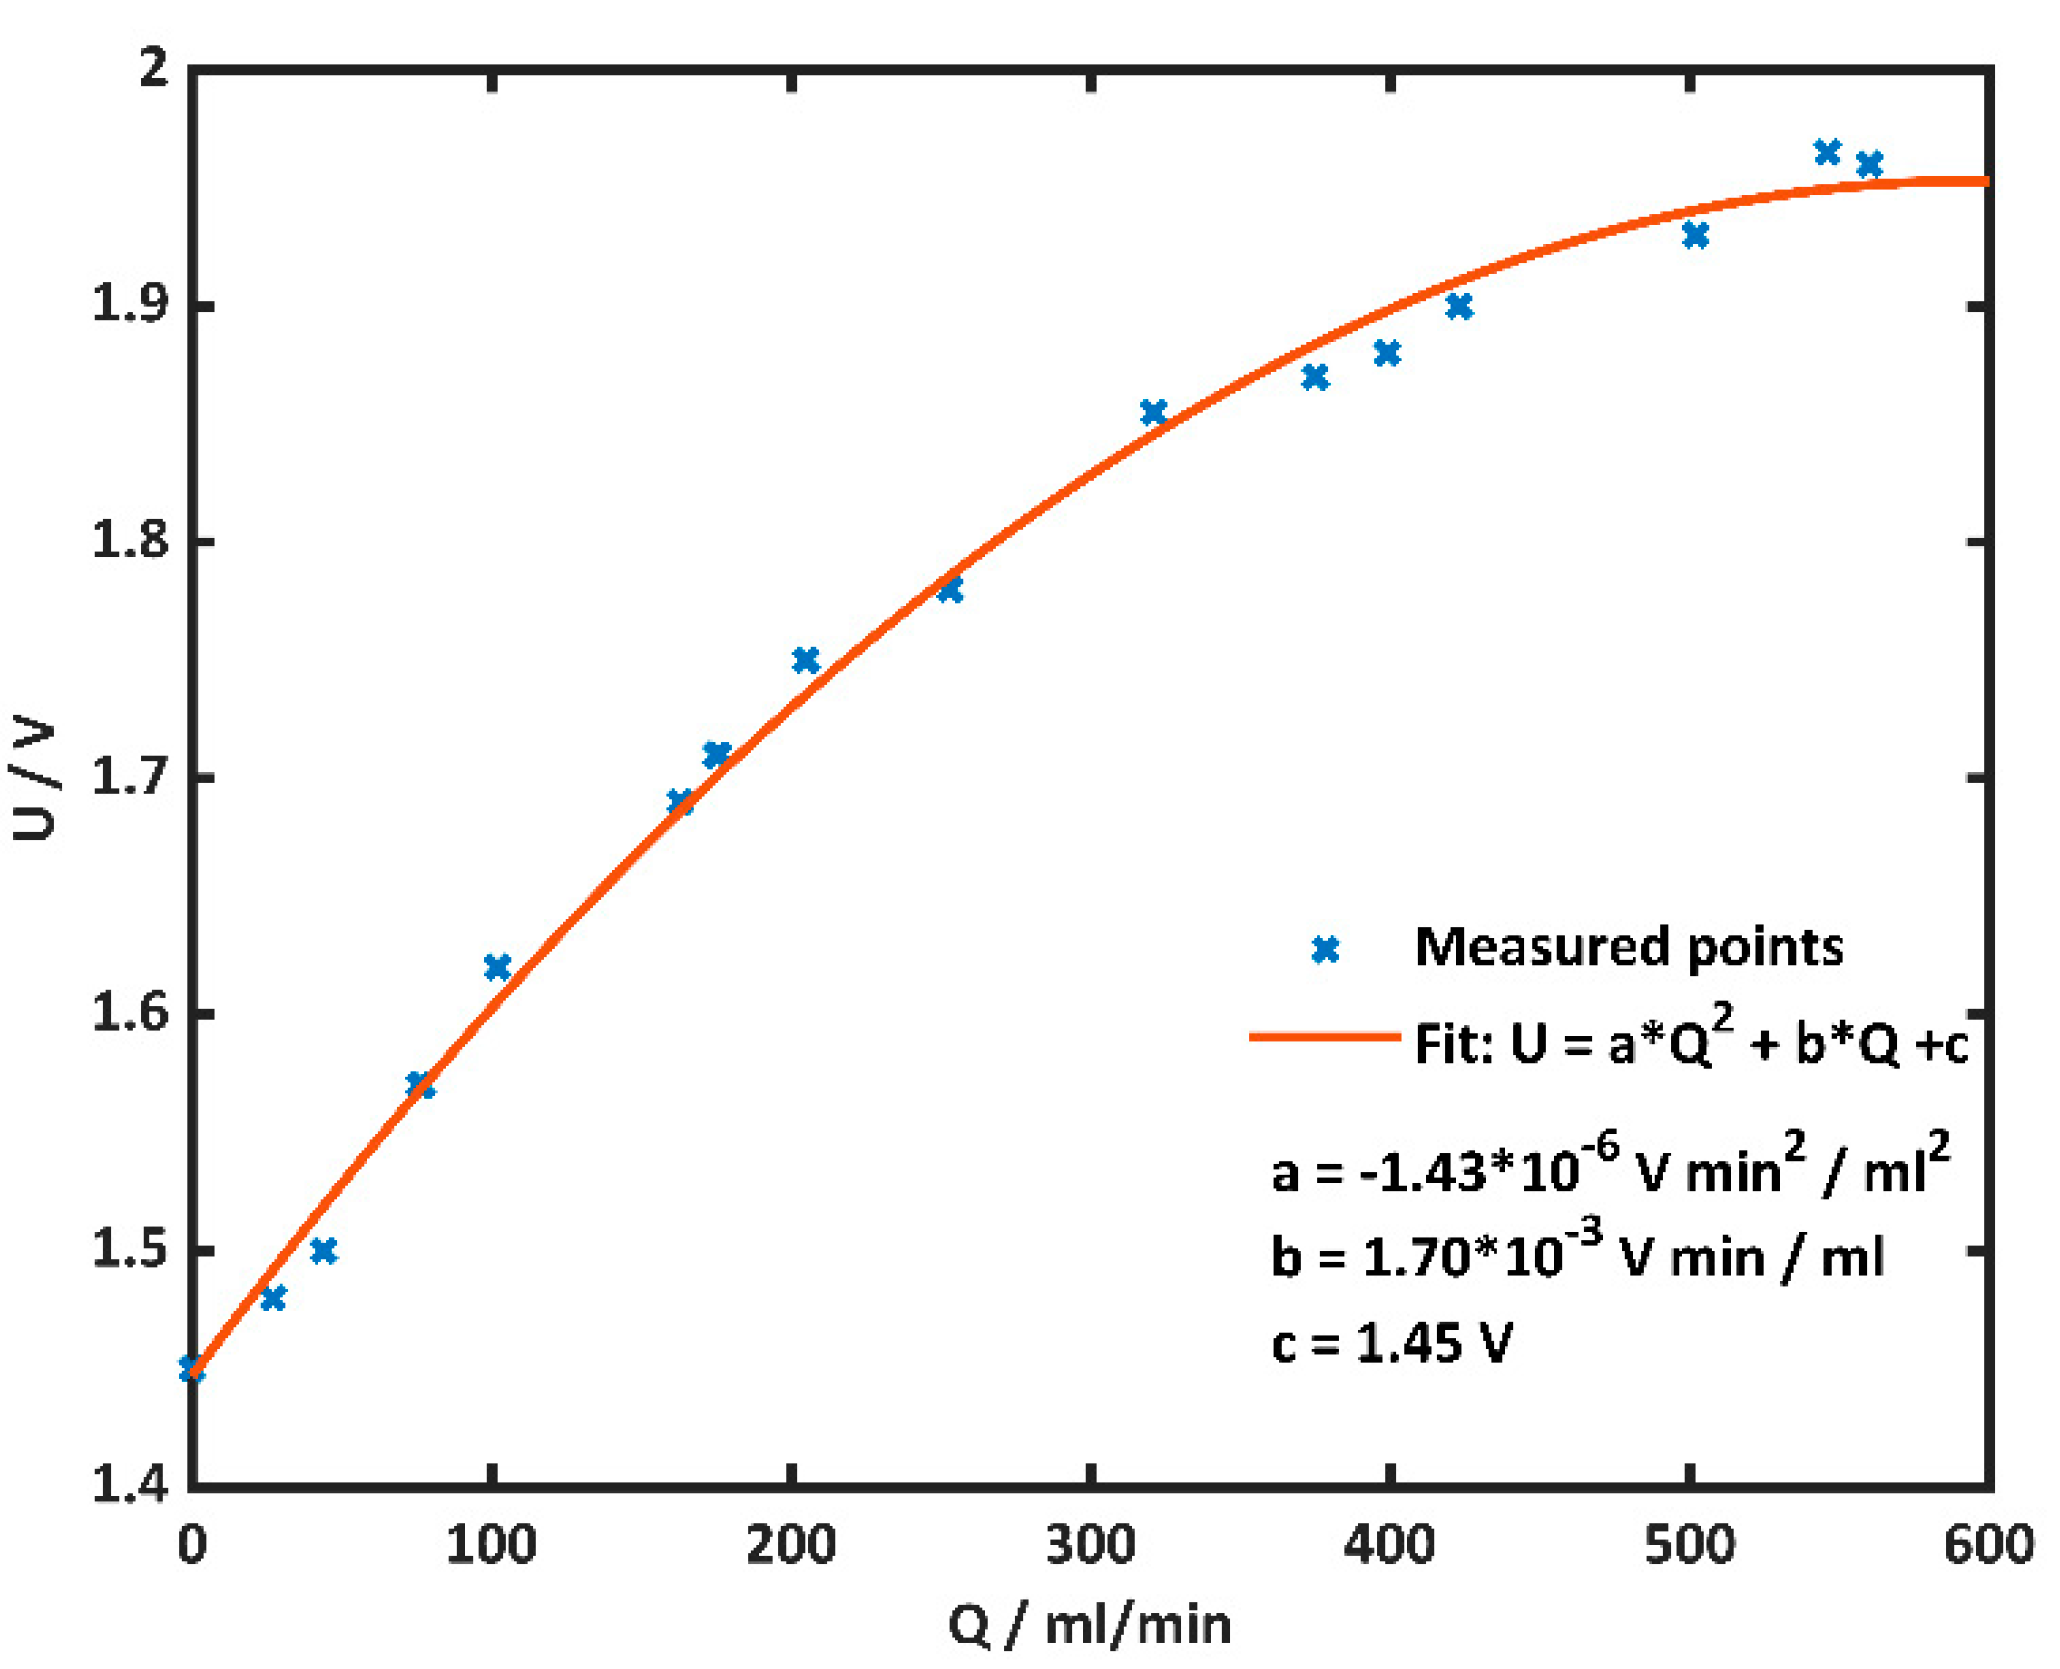
Figure 5 shows a schematic of the flow sensor. The shown system is heated by the resistor to keep the NTC resistance at 22 kΩ (42.5 °C). The higher the flow through the needle, the more heat is transported away, thus the more voltage has to be applied to the resistor to keep the NTC at 42.5 °C. Figure 6 shows the dependence of the applied voltage, on the flow rate through the needle. The measured data is fitted with a second degree polynomial. The flow through the needle can be monitored by measuring the voltage applied to the heating resistor. The measurements have been successfully reproduced after changing the bypassing needle.
3. Conclusions and Outlook
We designed a device which attenuates the particle number concentration. The costs of the components used do not exceed 40 €. Laws that describe the pressure drop dependence of the flow rate in tubes and porous media, predict that the magnitude of this attenuation is independent of the total flow rate. Flow measurements and CFD simulations showed that the dependence on the total flow does not cancel out perfectly, but the sensitivity of the DR is very low compared to other devices. It has been shown that the orientation of the needle orifice relative to the aerosol flow has a significant influence on the dilution ratio and its dependence on the flow rate. Geometry modifications will be performed to further improve the robustness of the dilution ratio. A flow sensor enables monitoring of the introduce dilution ratio. The measured signal shows a quadratic dependence on flow rate. The needle that bypasses the HEPA filter can be exchanged without changing the characteristics of the flow sensor. The influence of the sample temperature and the ambient temperature on the measured signal will be investigated in detail and implemented into the model function. Furthermore, particle losses within the device will be studied in detail and accounted for by defining a Particle Dilution Ratio PDR. The presented device is used for engine exhaust particle number measurements in the framework of the H2020 project DownToTen.
Author Contributions
M.B.: Methodology, Software, Validation, Formal Analysis, Investigation, Writing—Original Draft Preparation, Visualization. A.B.: Conceptualization, Writing—Review & Editing, Supervision, Project Administration, Funding Acquisition
Funding
This work is conducted in the framework of the H2020 project DownToTen. This project has received funding from the European Union’s Horizon 2020 research and innovation programme under grant agreement Nr. 724085.
References
- Giechaskiel, B.; Dilara, P.; Sandbach, E.; Andersson, J. Particle measurement programme (PMP) light-duty inter-laboratory exercise: comparison of different particle number measurement systems. Meas. Sci. Technol. 2008, 19, 095401. [Google Scholar] [CrossRef]
- Bergmann, M.; Vogt, R.; Szente, J.; Maricq, M.; Benter, T. Using ejector diluters to sample vehicle exhaust at elevated pressures and temperatures. SAE Int. J. Engines 2008, 1, 1167–1178. [Google Scholar] [CrossRef]
- Fuchs, N.; Sutugin, A. Coagulation rate of highly dispersed aerosols. J. Colloid Sci. 1965, 20, 492–500. [Google Scholar] [CrossRef]
- Brown, G.O. The history of the Darcy-Weisbach equation for pipe flow resistance. In Environmental and Water Resources History; American Society of Civil Engineering: Washington, DC, USA, 2003; pp. 34–43. [Google Scholar]
- Al-Hussainy, R.; Ramey, H., Jr.; Crawford, P. The flow of real gases through porous media. J. Pet. Technol. 1966, 18, 624–636. [Google Scholar] [CrossRef]
Figure 1.
Velocities at the centered cut plane of the diluter at a total flow rate of . CFD simulation performed using COMSOL.
Figure 1.
Velocities at the centered cut plane of the diluter at a total flow rate of . CFD simulation performed using COMSOL.
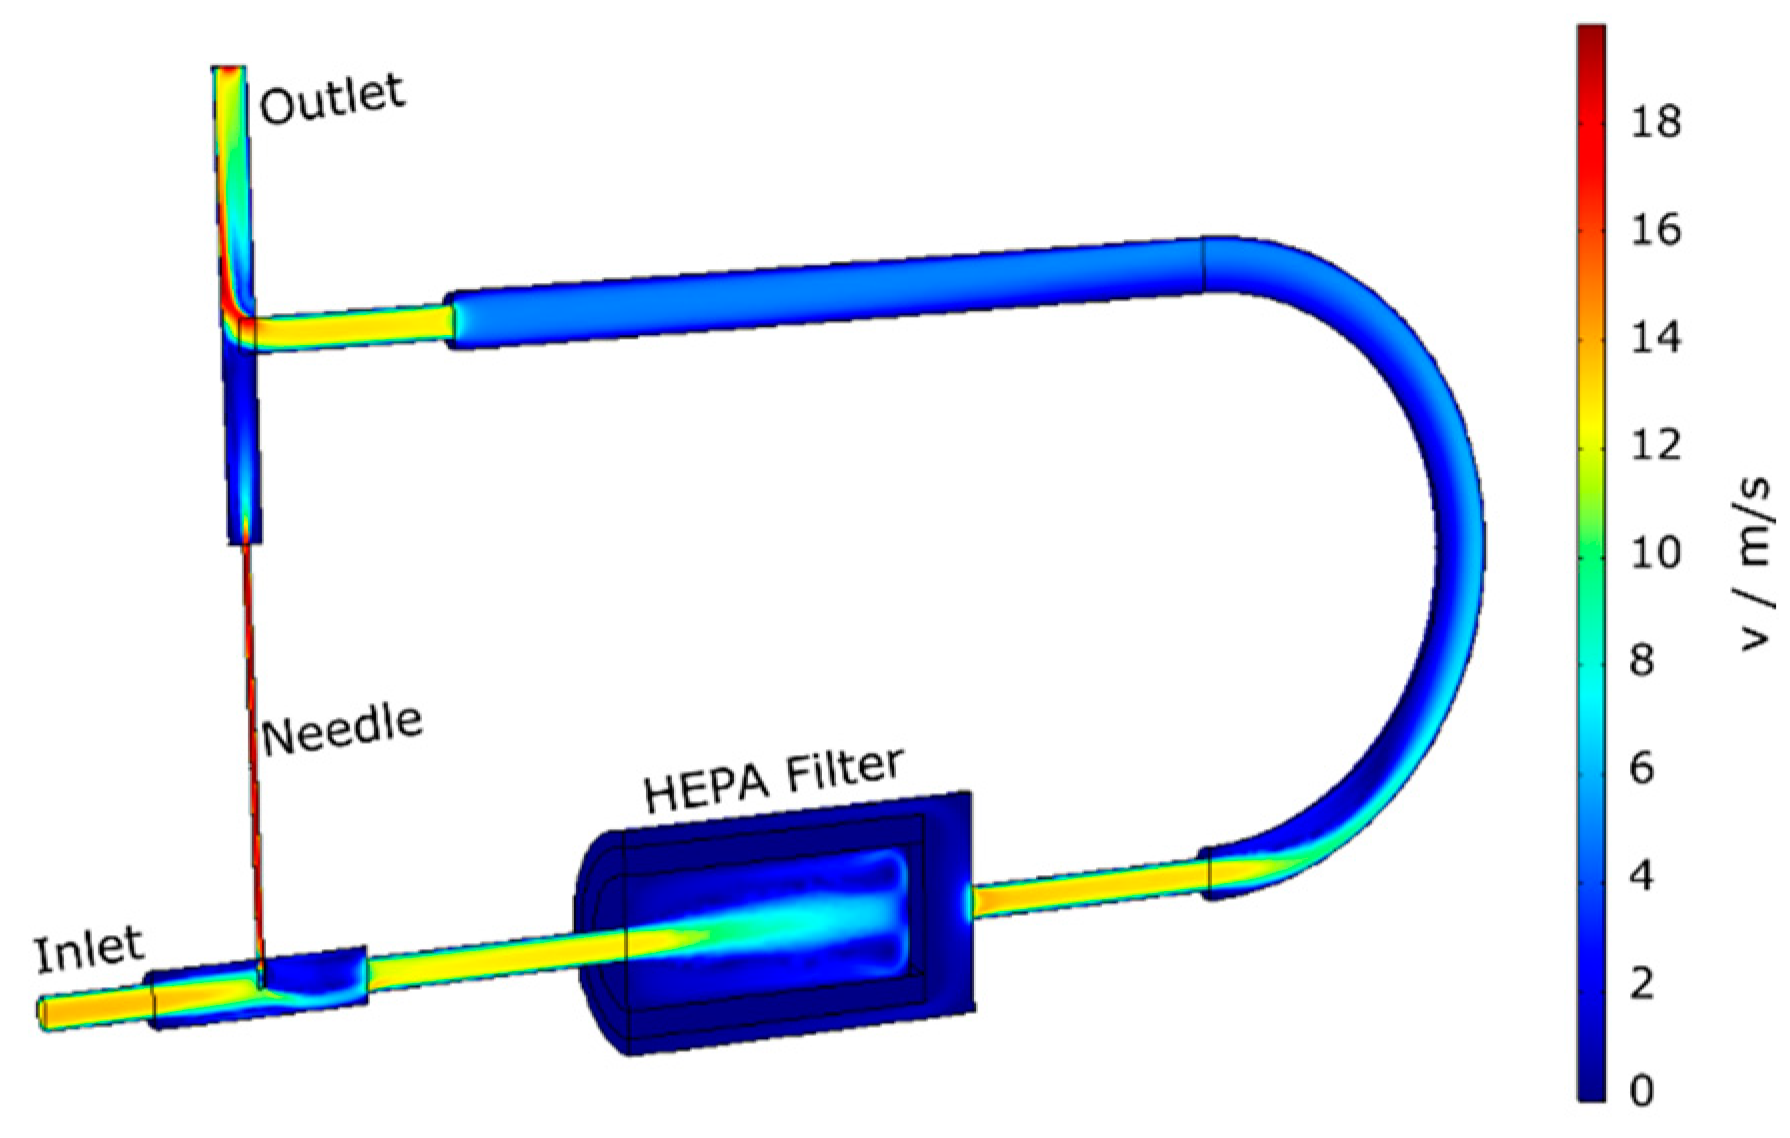
Figure 2.
Schematic illustration of different needle orifice orientations relative to the flow. The angle between the needle orifice and the flow velocity is described by α.
Figure 2.
Schematic illustration of different needle orifice orientations relative to the flow. The angle between the needle orifice and the flow velocity is described by α.
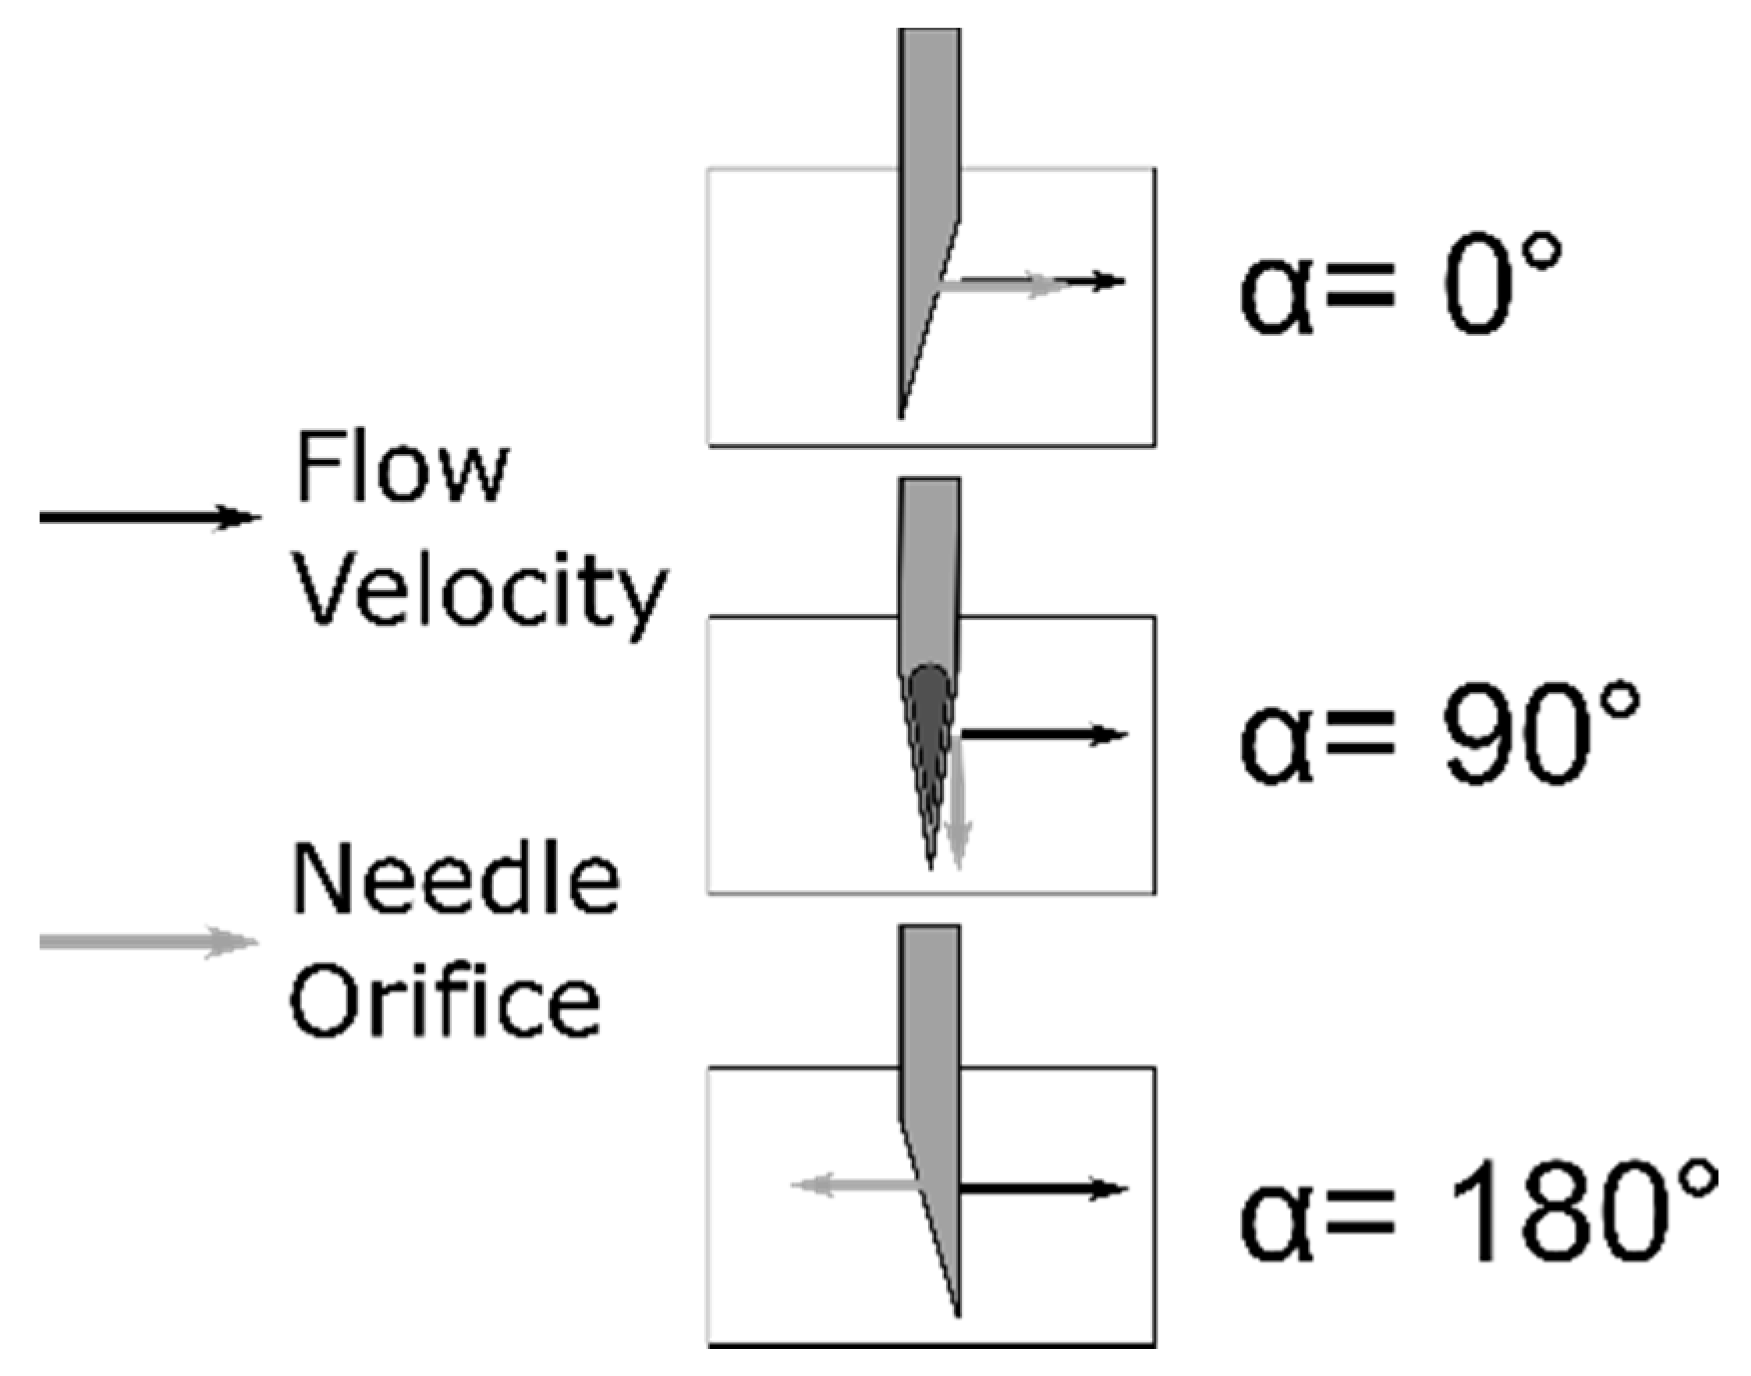
Figure 3.
Flow rate as a function of total pressure drop for different needle orientations (right y-axis) and the HEPA filter (left y-axis).
Figure 3.
Flow rate as a function of total pressure drop for different needle orientations (right y-axis) and the HEPA filter (left y-axis).
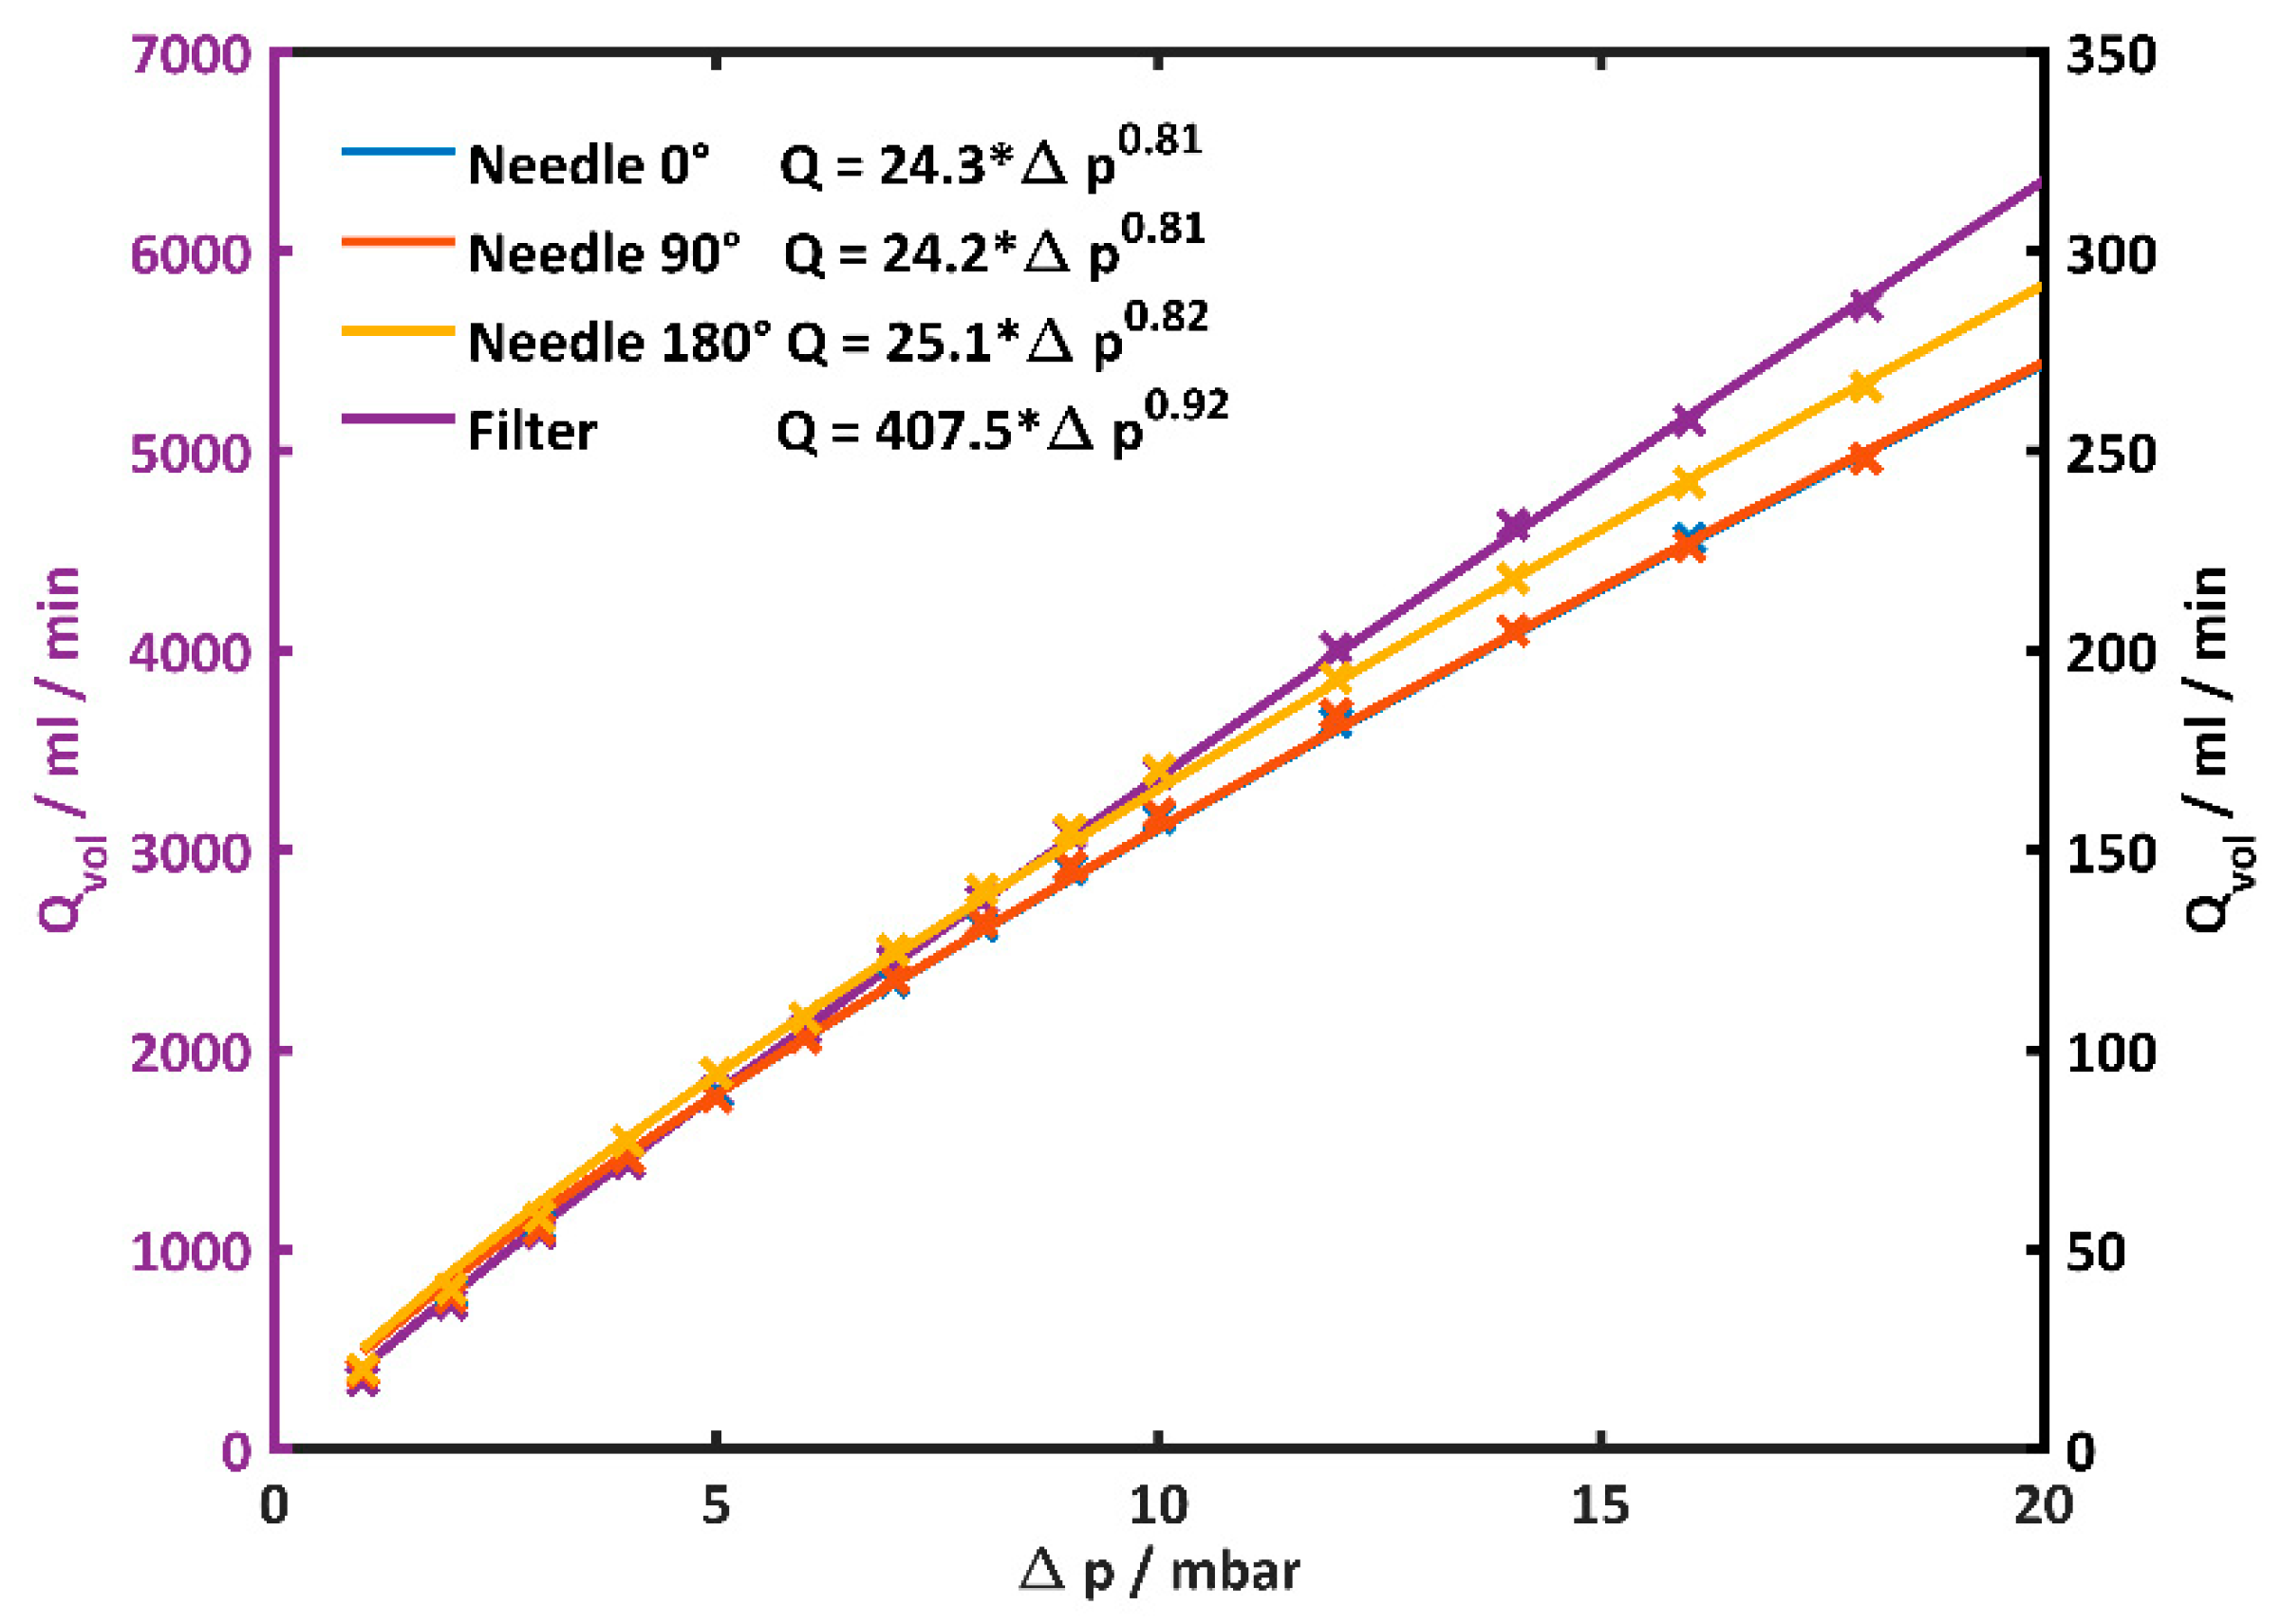
Figure 4.
Comparison of the dilution ratio determined by flow measurements and simulations using COMSOL, for two different needle orientation angles α.
Figure 4.
Comparison of the dilution ratio determined by flow measurements and simulations using COMSOL, for two different needle orientation angles α.

Figure 5.
Schematic of the flow sensor and the calibration setup. The flow sensor consists of a 38 Ω heating resistor and a NTC soldered onto hypodermic needle. An electronic circuit controls the heating power to keep the NTC resistance at same values as a reference resistor.
Figure 5.
Schematic of the flow sensor and the calibration setup. The flow sensor consists of a 38 Ω heating resistor and a NTC soldered onto hypodermic needle. An electronic circuit controls the heating power to keep the NTC resistance at same values as a reference resistor.

Figure 6.
Voltage applied to the heating resistor to keep the NTC resistance at 22 kΩ for different flow rates. The sample temperature and the ambient temperature were 26.0°C. The parameters of the quadratic polynomial fit are given below the legend.
Figure 6.
Voltage applied to the heating resistor to keep the NTC resistance at 22 kΩ for different flow rates. The sample temperature and the ambient temperature were 26.0°C. The parameters of the quadratic polynomial fit are given below the legend.
Publisher’s Note: MDPI stays neutral with regard to jurisdictional claims in published maps and institutional affiliations. |
© 2018 by the authors. Licensee MDPI, Basel, Switzerland. This article is an open access article distributed under the terms and conditions of the Creative Commons Attribution (CC BY) license (http://creativecommons.org/licenses/by/4.0/).
Share and Cite
MDPI and ACS Style
Bainschab, M.; Bergmann, A. An Intrinsically Pressure Insensitive Low Cost Particle Number Diluter Featuring Flow Monitoring. Proceedings 2018, 2, 981. https://doi.org/10.3390/proceedings2130981
AMA Style
Bainschab M, Bergmann A. An Intrinsically Pressure Insensitive Low Cost Particle Number Diluter Featuring Flow Monitoring. Proceedings. 2018; 2(13):981. https://doi.org/10.3390/proceedings2130981
Chicago/Turabian StyleBainschab, Markus, and Alexander Bergmann. 2018. "An Intrinsically Pressure Insensitive Low Cost Particle Number Diluter Featuring Flow Monitoring" Proceedings 2, no. 13: 981. https://doi.org/10.3390/proceedings2130981