An Inductively Coupled Biodegradable Capacitive Pressure Sensor †


1
BioMediTech Institute and Faculty of Biomedical Sciences and Engineering, Tampere University of Technology, 33720 Tampere, Finland
2
BioMediTech Institute and Faculty of Medicine and Life Sciences, University of Tampere, 33104 Tampere, Finland
*
Author to whom correspondence should be addressed.
†
Presented at the Eurosensors 2018 Conference, Graz, Austria, 9–12 September 2018.
Proceedings 2018, 2(13), 914; https://doi.org/10.3390/proceedings2130914
Published: 26 November 2018
(This article belongs to the Proceedings of EUROSENSORS 2018)
Abstract
:A biodegradable inductively coupled pressure sensor is presented. Three sensors were fabricated using melt processed biodegradable polymers and electron-beam evaporated magnesium. All the sensors showed similar pressure responses from 0 to 0.2 bar. In addition, the responses of the sensors to temperature changes and static pressure are reported. Due to the limited quality factor of the resonance sensors, single measurements were noisy. For this reason, averaging of multiple measurements was needed to achieve consistent results.
1. Introduction
Biodegradable sensors could be used in applications where only temporary measurements are needed. For example, biodegradable implantable sensors would allow acute measurements without a need for removal surgery. Furthermore, the amount of electronic waste produced by disposable sensors could be reduced by using biodegradable alternatives.
Inductive coupling provides a readout method without batteries for wireless short-range measurements [1]. Most of the previously reported implantable biodegradable pressure sensors utilize skin-penetrating wires for data transfer [2,3,4], which cause an increased risk of infection [5]. To our knowledge, only one wireless biodegradable pressure sensor design has so far been reported [6]. In addition to implants, applications where the sensor is difficult to access using external wires include for example food packaging sensors.
In this study, we present an inductively coupled biodegradable capacitive pressure sensor design without vias. The purpose of the study was to develop simple sensor fabrication methods for biodegradable materials and to test the performance of the resulting pressure sensor design.
2. Materials and Methods
2.1. Sensor Fabrication
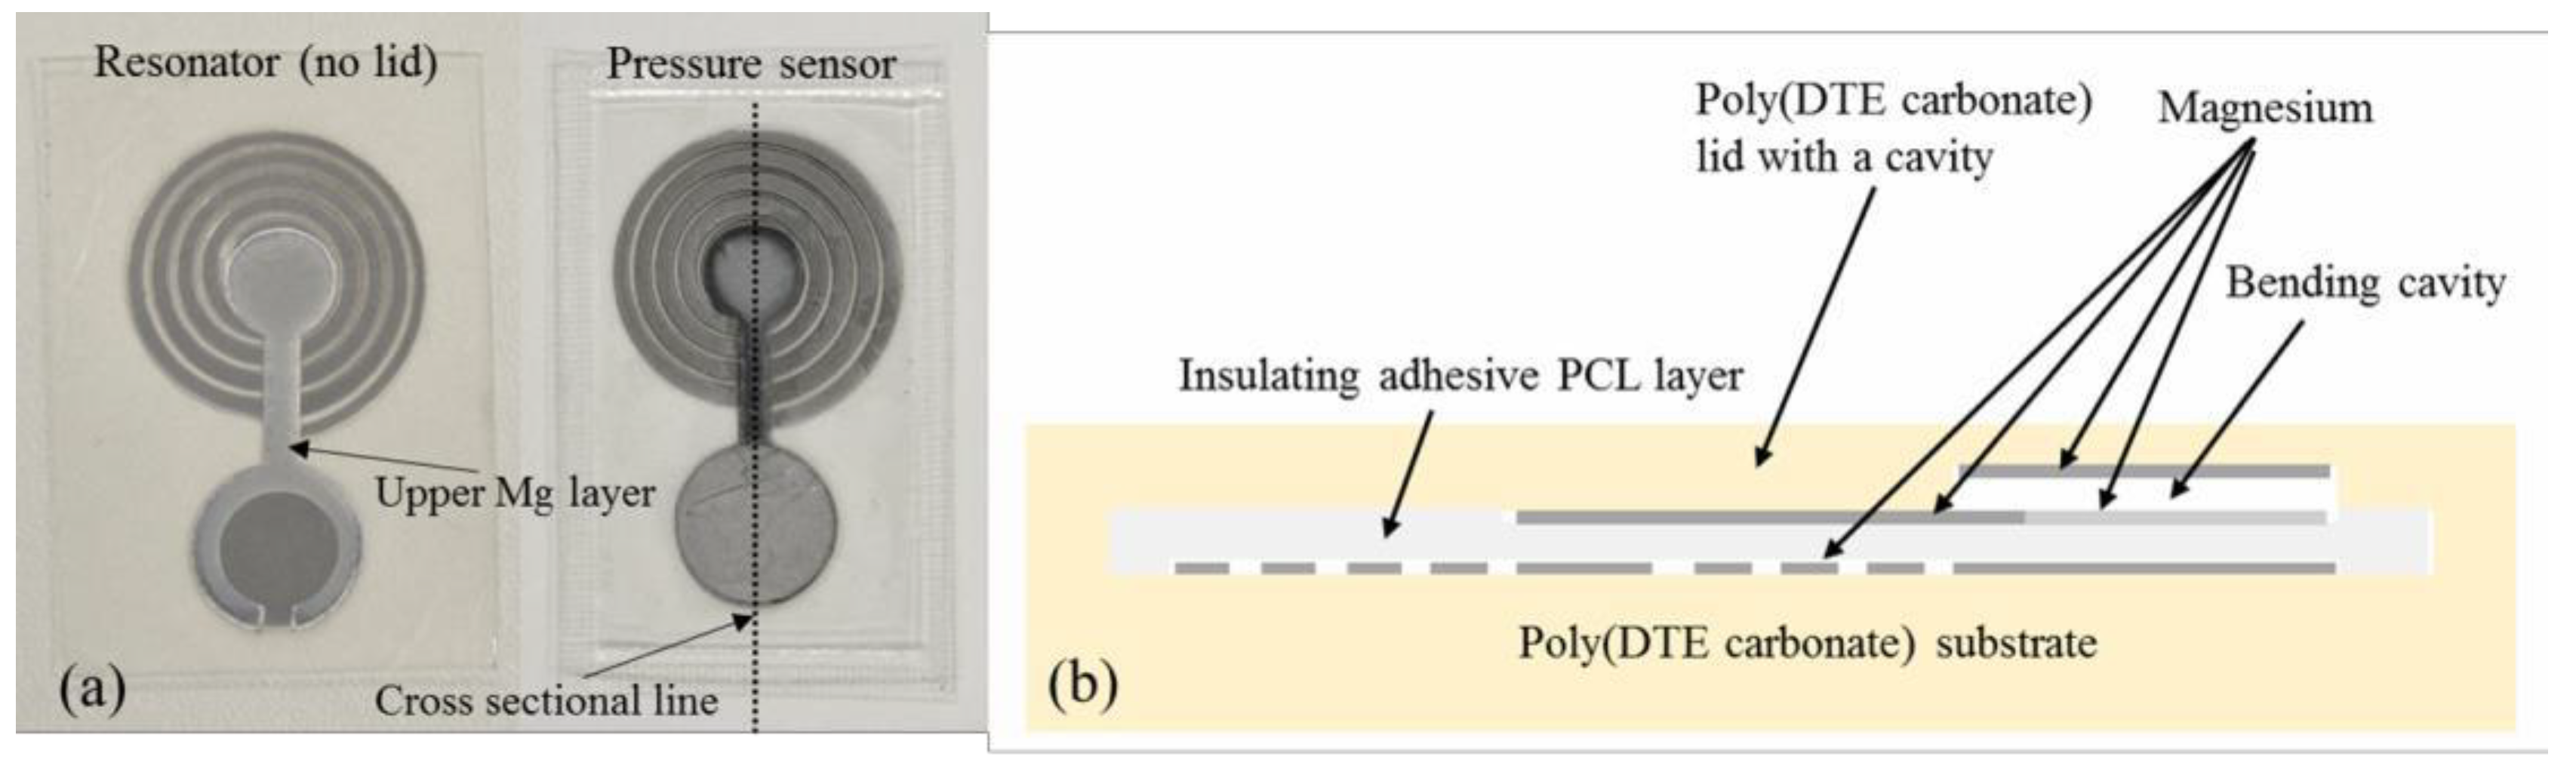
The fabrication of the sensors started by extruding rods from biodegradable poly(desamino tyrosyl-tyrosine ethyl ester carbonate) (poly(DTE carbonate); Integra LifeSciences, Plainsboro, NJ, USA) powder using a co-rotating twin-screw extruder (Neste Oy, Porvoo, Finland). Pieces of the rod were then compression molded to substrates (30 × 40 × 0.4 mm3) onto which resonators were built. First, 7 µm of magnesium was e-beam evaporated through 3D printed shadow masks to form a coil connected to an electrode. Thereafter, a compression molded polycaprolactone (PCL; Corbion, Gorinchem, The Netherlands) sheet with a thickness of approximately 20 µm was melted onto the substrate, covering the Mg patterns. The melting was done in vacuum to prevent the formation of air bubbles. Another Mg layer was then deposited onto the PCL layer to complete the resonator structure (Figure 1a).
Pressure-sensing lids with thicknesses of 200–300 µm were compression molded by placing a 20 µm thick steel disc with a diameter of 12 mm under a poly (DTE carbonate) sheet to create a 20 µm deep cavity to the lid. A round Mg electrode (diameter 11 mm) was evaporated to the bottom of the cavity. The lid was attached to the resonator by using the PCL layer as an adhesive. PCL was melted around the upper Mg layer of the resonator and the lid was pressed onto the molten PCL layer. The lid and the resonator were finally sealed from the sides using a heat sealer. A plain resonator was used as a reference in the measurements except for the static pressure measurements.
2.2. Sensor Characterization
The sensors were measured through a glass bottle (reading distance approximately 6 mm) using an external reader coil that was connected to an impedance analyzer (Agilent 4396B). The bottle was pressurized using a pressure regulator. A pressure calibrator was connected in series with the bottle and the regulator. The pressure responses were measured from 0 to 0.5 bar and back three times in the increments of 0.1 bar, with one measurement per pressure step. A resonator without the pressure sensing lid was measured for reference. A more detailed measurement was carried out from 0 to 0.2 bar and back (two cycles). Now, 30 measurements per pressure step were recorded and averaged. The response of the sensors to static pressure was tested by measuring the sensors once per minute for one hour first at normal room pressure, then at an elevated pressure of 0.1 bar and finally again at normal room pressure. After changing the pressure, three minutes were waited prior to starting the measurements. The changes in resonance frequencies were translated to pressure values using the slope of the linear fit of the 0–0.2 bar range as a basis for sensitivity. The average of the first 60 measurements at room pressure was selected as 0 bar pressure. The frequency range in all the pressure measurements was from 25 to 70 MHz.
The temperature response of the sensors was characterized by recording and averaging 100 measurements at different temperatures between 24 °C (room temperature) and 42 °C. The frequency range in the temperature measurements was from 20 to 100 MHz. The reader coil was placed into an oven and the sensor inside the glass bottle was placed onto the coil without the cork. The temperature was allowed to stabilize for one hour at each point before the measurement.
3. Results
All three sensors showed nonlinear responses in the range from 0 to 0.5 bar as illustrated in Figure 2a. No pressure sensitivity was noticed in the resonator without the pressure sensing lid part. The lower pressure range from 0 to 0.2 bar was approximated using a linear model; sensors A, B and C showed sensitivities of −1.25, −1.47 and −1.47 kHz/mbar, respectively. The standard deviations of the 30 measurements at each pressure step in Figure 2b–d were around 30 kHz. The initial resonance frequencies of the sensors were between 36–56 MHz.
The three sensors performed in a similar manner under static pressure (Figure 3a). The 0.1 bar pressure was clearly distinguished from the normal room pressure, but variation was relatively large. The resonance frequency of sensor A started drifting during the 1h room pressure measurement that followed the static pressure phase. All sensors and the resonator showed nonlinear temperature responses (Figure 3b). Sensor C was the least sensitive to temperature changes.
4. Discussion
Wireless pressure measurements of three biodegradable sensors were successfully performed. The manual assembly process probably caused the differences in the individual sensors. Variation in the initial resonance frequencies might have been due to the varying thickness of the insulating PCL layer and possible differences in the 3D printed evaporation masks and their alignment. Furthermore, any deviations in the attachment or in the thickness of the lid could have caused variation in the results. The plain resonator was not pressure sensitive, demonstrating that the sensor function did indeed rely on the cavity based varying capacitor.
The sensitivity of our sensors (from −1.25 to −1.47 kHz/mbar at 0–0.2 bar) was lower than that of the wireless biodegradable sensor of Luo et al. [6] with −3.9 kHz/mbar. This might have been due to the thicker substrate in our sensor. Non-degradable inductor-capacitor (LC) sensor sensitivities have been reported from below 1.5 kHz/mbar to more than 1.5 MHz/mbar [7]. We estimate that improving the quality factor of our resonance sensor to decrease the variation caused by the background noise is more crucial for many applications than increasing the sensitivity. A more consistent insulating layer would probably be essential in this regard. On the other hand, the conductivity of the e-beam evaporated magnesium also limits the quality factor of the resonator. The conductivity of the used material is one of the most critical challenges in wireless radio-frequency resonators [1].
The increment of 0.1 bar was clearly visible in the static pressure measurement despite the noise that is present in the single measurements. Furthermore, the recovery of the sensor from static pressure caused drifting in sensor A. The temperature response of the resonator without the pressure-sensing lid suggested that the temperature sensitivity of the sensors was caused by changes in the resonator structure. The results indicate that temperature compensation is needed in applications where temperature changes are significant.
To conclude, the results of the preliminary measurements were promising, showing that the sensors were wirelessly readable and responded to pressure. Future research includes improving the quality factor of the sensor, as well as testing the sensor in buffer solution to investigate the lifetime and performance of the sensor in aqueous conditions.
Acknowledgments
This study was funded by Business Finland as a part of the Human Spare Parts research program and by the Kalle and Dagmar Välimaa fund of the Finnish Cultural Foundation.
Conflicts of Interest
The authors declare no conflict of interest.
References
- Boutry, C.M.; Chandrahalim, H.; Streit, P.; Schinhammer, M.; Hänzi, A.C.; Hierold, C. Towards biodegradable wireless implants. Philos. Trans. R. Soc. A Math. Phys. Eng. Sci. 2012, 370, 2418–2432. [Google Scholar] [CrossRef] [PubMed]
- Kang, S.-K.; Murphy, R.K.J.; Hwang, S.-W.; Lee, S.M.; Harburg, D.V.; Krueger, N.A.; Shin, J.; Gamble, P.; Cheng, H.; Yu, S.; et al. Bioresorbable silicon electronic sensors for the brain. Nature 2016, 530, 71–76. [Google Scholar] [CrossRef] [PubMed]
- Boutry, C.M.; Kaizawa, Y.; Schroeder, B.C.; Chortos, A.; Legrand, A.; Wang, Z.; Chang, J.; Fox, P.; Bao, Z. A stretchable and biodegradable strain and pressure sensor for orthopaedic application. Nat. Electron. 2018, 1, 314–321. [Google Scholar] [CrossRef]
- Curry, E.J.; Ke, K.; Chorsi, M.T.; Wrobel, K.S.; Miller III, A.N.; Patel, A.; Kim, I.; Feng, J.; Yue, L.; Wu, Q.; et al. Biodegradable Piezoelectric Force Sensor. Proc. Natl. Acad. Sci. USA 2018, 115, 909–914. [Google Scholar] [CrossRef] [PubMed]
- Yu, L.; Kim, B.J.; Meng, E. Chronically Implanted Pressure Sensors: Challenges and State of the Field. Sensors 2014, 14, 20620–20644. [Google Scholar] [CrossRef] [PubMed]
- Luo, M.; Martinez, A.W.; Song, C.; Herrault, F.; Allen, M.G. A Microfabricated Wireless RF Pressure Sensor Made Completely of Biodegradable Materials. J. Microelectromech. Syst. 2014, 23, 4–13. [Google Scholar] [CrossRef]
- Huang, Q.A.; Dong, L.; Wang, L.F. LC Passive Wireless Sensors toward a Wireless Sensing Platform: Status, Prospects, and Challenges. J. Microelectromech. Syst. 2016, 25, 822–841. [Google Scholar] [CrossRef]
Figure 1.
The structure of the biodegradable sensor: (a) a resonator and an assembled sensor. The size of the sensors was approximately 0.7 × 30 × 40 mm3. (b) A schematic overview of the cross section of the sensor. The cross sectional line is shown in the pressure sensor photograph.
Figure 1.
The structure of the biodegradable sensor: (a) a resonator and an assembled sensor. The size of the sensors was approximately 0.7 × 30 × 40 mm3. (b) A schematic overview of the cross section of the sensor. The cross sectional line is shown in the pressure sensor photograph.

Figure 2.
The pressure responses of (a) all the sensors and a resonator from 0 to 0.5 bar with three cycles and one measurement per pressure step (b–d) individual sensors from 0 to 0.2 bar with two cycles and an average of 30 recorded measurements per pressure step.
Figure 2.
The pressure responses of (a) all the sensors and a resonator from 0 to 0.5 bar with three cycles and one measurement per pressure step (b–d) individual sensors from 0 to 0.2 bar with two cycles and an average of 30 recorded measurements per pressure step.

Figure 3.
The response of the sensors to (a) static pressure and (b) temperature (error bars imply SD).
Figure 3.
The response of the sensors to (a) static pressure and (b) temperature (error bars imply SD).

Publisher’s Note: MDPI stays neutral with regard to jurisdictional claims in published maps and institutional affiliations. |
© 2018 by the authors. Licensee MDPI, Basel, Switzerland. This article is an open access article distributed under the terms and conditions of the Creative Commons Attribution (CC BY) license (https://creativecommons.org/licenses/by/4.0/).
Share and Cite
MDPI and ACS Style
Hänninen, A.; Salpavaara, T.; Lekkala, J.; Kellomäki, M. An Inductively Coupled Biodegradable Capacitive Pressure Sensor. Proceedings 2018, 2, 914. https://doi.org/10.3390/proceedings2130914
AMA Style
Hänninen A, Salpavaara T, Lekkala J, Kellomäki M. An Inductively Coupled Biodegradable Capacitive Pressure Sensor. Proceedings. 2018; 2(13):914. https://doi.org/10.3390/proceedings2130914
Chicago/Turabian StyleHänninen, Aleksi, Timo Salpavaara, Jukka Lekkala, and Minna Kellomäki. 2018. "An Inductively Coupled Biodegradable Capacitive Pressure Sensor" Proceedings 2, no. 13: 914. https://doi.org/10.3390/proceedings2130914