W-Sn Mixed Oxides and ZnO to Detect NOx and Ozone in Atmosphere †
by
 , ,
, ,
Ambra Fioravanti
1,* ,
,
Sara Morandi
2,
Alessia Amodio
2,
Mauro Mazzocchi
3,
Michele Sacerdoti
4 and
Maria Cristina Carotta
1 1
C.N.R.—IMAMOTER, Via Canal Bianco 28, 44124 Ferrara, Italy
2
Dipartimento di Chimica, Università di Torino, Via P. Giuria 7, 10125 Torino, Italy
3
C.N.R.—ISTEC, Via Granarolo 64, 48018 Ravenna, Italy
4
Dipartimento di Fisica e Scienze della Terra, Università di Ferrara, Via Saragat 1, 44122 Ferrara, Italy
*
Author to whom correspondence should be addressed.
†
Presented at the Eurosensors 2018 Conference, Graz, Austria, 9–12 September 2018.
Proceedings 2018, 2(13), 836; https://doi.org/10.3390/proceedings2130836
Published: 4 December 2018
(This article belongs to the Proceedings of EUROSENSORS 2018)
Abstract
:Thick films of zinc oxide (ZnO) in form of nanospheres or hexagonal prisms and of tungsten-tin (W-Sn) mixed oxides at nominal Sn molar fraction (0.1, 0.3 and 0.5) were prepared. The functional materials were synthesized and characterized by SEM and TEM, X-ray diffraction, specific surface area measurements, UV-Vis-NIR and IR spectroscopies. The gas sensing measurements highlighted that ZnO is more performant in form of nanoprisms, while W-Sn sensors offer a better response towards NOx and ozone with respect to pure WO3.
1. Introduction
Road traffic and fuel combustion utilities strongly influence the air quality in urban atmosphere, above all NOx and ozone in addition to particulate matter. Thereby, the monitoring of the atmospheric pollutants is necessary, but particularly interesting through portable and versatile devices based on thick film gas sensors, having low requirements in terms of power, consumables, maintenance and installation costs. Taking advantage of previous experiences of some of the authors in this area, this work has been aimed to prepare and study materials and sensors based on semiconductor metal oxides specifically devoted to detect NOx and ozone [1,2,3,4]. For this work, W-Sn solid solutions and nanoforms of ZnO have been considered. For W-Sn materials, the aim was to join advantages of high sensitivity toward oxidizing gases of WO3 and Sn addition to reduce WO3 grain growth with temperature. For ZnO, the aim was to compare nanoparticle aggregates with 2D-nanocrystals for detecting oxidizing gases.
2. Materials and Methods
The single oxides WO3 and SnO2, W-Sn mixed oxides and nanoforms of ZnO were successfully synthesized and used to prepare thick film gas sensors. W-Sn mixed oxides (nominal Sn molar fraction of 0.1, 0.3 and 0.5) were obtained by sol-gel co-precipitation method using required stoichiometric proportions of Tin(II) 2-ethylhexanoate in a proper amount of 1-butanol and WCl6 dissolved in absolute ethanol. Diluted HNO3 solution was added to catalyze the hydrolysis process and the resulting yellowish green powder was calcined at 550 °C for 2 h. Both ZnO nanoforms were synthetized through sol–gel processes, starting from a water solution of zinc nitrate hexahydrate. ZnO nanospheres were prepared adding to the solution a proper amount of ammonium hydroxide, the precipitate then washed, dried and calcined at 450 °C, whereas ZnO hexagonal prisms were directly obtained keeping the mixture in oven at temperatures lower than 100 °C for several hours. All materials were characterized through FE-SEM and TEM electron microscopy, BET and XRD analysis. Diffuse reflectance UV-Vis-NIR and absorbance FT-IR spectroscopies, in situ conditions, were employed to characterize the electronic properties of the materials. Screen printing technique was used to deposit the sensing layers and the corresponding thick films (all fired at 650 °C in this work) were tested for sensing in a sealed test chamber using the flow-through technique. In order to correlate the spectroscopic analysis with electrical characterizations, Schottky barriers versus temperature in dry air as well as in 100 ppm of CO and 10 ppm of NO2 have been measured. Dynamical responses in presence of the target gases have been carried out, as well.
3. Results
XRD patterns of pure WO3, W-Sn(0.1), W-Sn(0.3) and W-Sn(0.5) powders correspond to monoclinic crystal structure (space group P21/n) of polycrystalline WO3 without any other phases (Figure 1), the crystallite size of the above powders, evaluated by Scherrer’s formula, being 85, 25, 24 and 19 nm, respectively. XRD analysis, performed onto ZnO samples, attributes a hexagonal wurtzite structure, space group P63mc, for both nanoforms. Further characterizations onto ZnO samples can be found in [1].
In agreement with XRD analysis, FE-SEM observations confirmed that the addition of Sn to WO3 successfully reduced the coalescence of WO3 grains as shown in Figure 2a–d in which the images of calcined materials are reported. Figure 2e,f shows ZnO powders shaped into nanoparticles or hexagonal prisms.
From the electrical point of view, all studied materials behave as n-type semiconductors because of lattice defects as highlighted in the Arrhenius plots (not shown here for sake of brevity) in which the semiconductor behavior was modulated by the Schottky barrier formation at gas–semiconductor interface. With respect to W-Sn materials, UV-Vis-NIR and FT-IR spectroscopies (see Figure 3) highlighted the predominant electronic defects. In particular, in reducing atmosphere, WO3 shows polaron formation (band in the near IR region, deepness in the band gap = 0.55 eV), while SnO2 shows the increase of mono-ionized oxygen vacancies (band in the medium IR, deepness in the band gap = 0.19 eV). The mixed oxides W-Sn(0.1), W-Sn(0.3) and W-Sn(0.5) show polaron formation as observed for WO3.
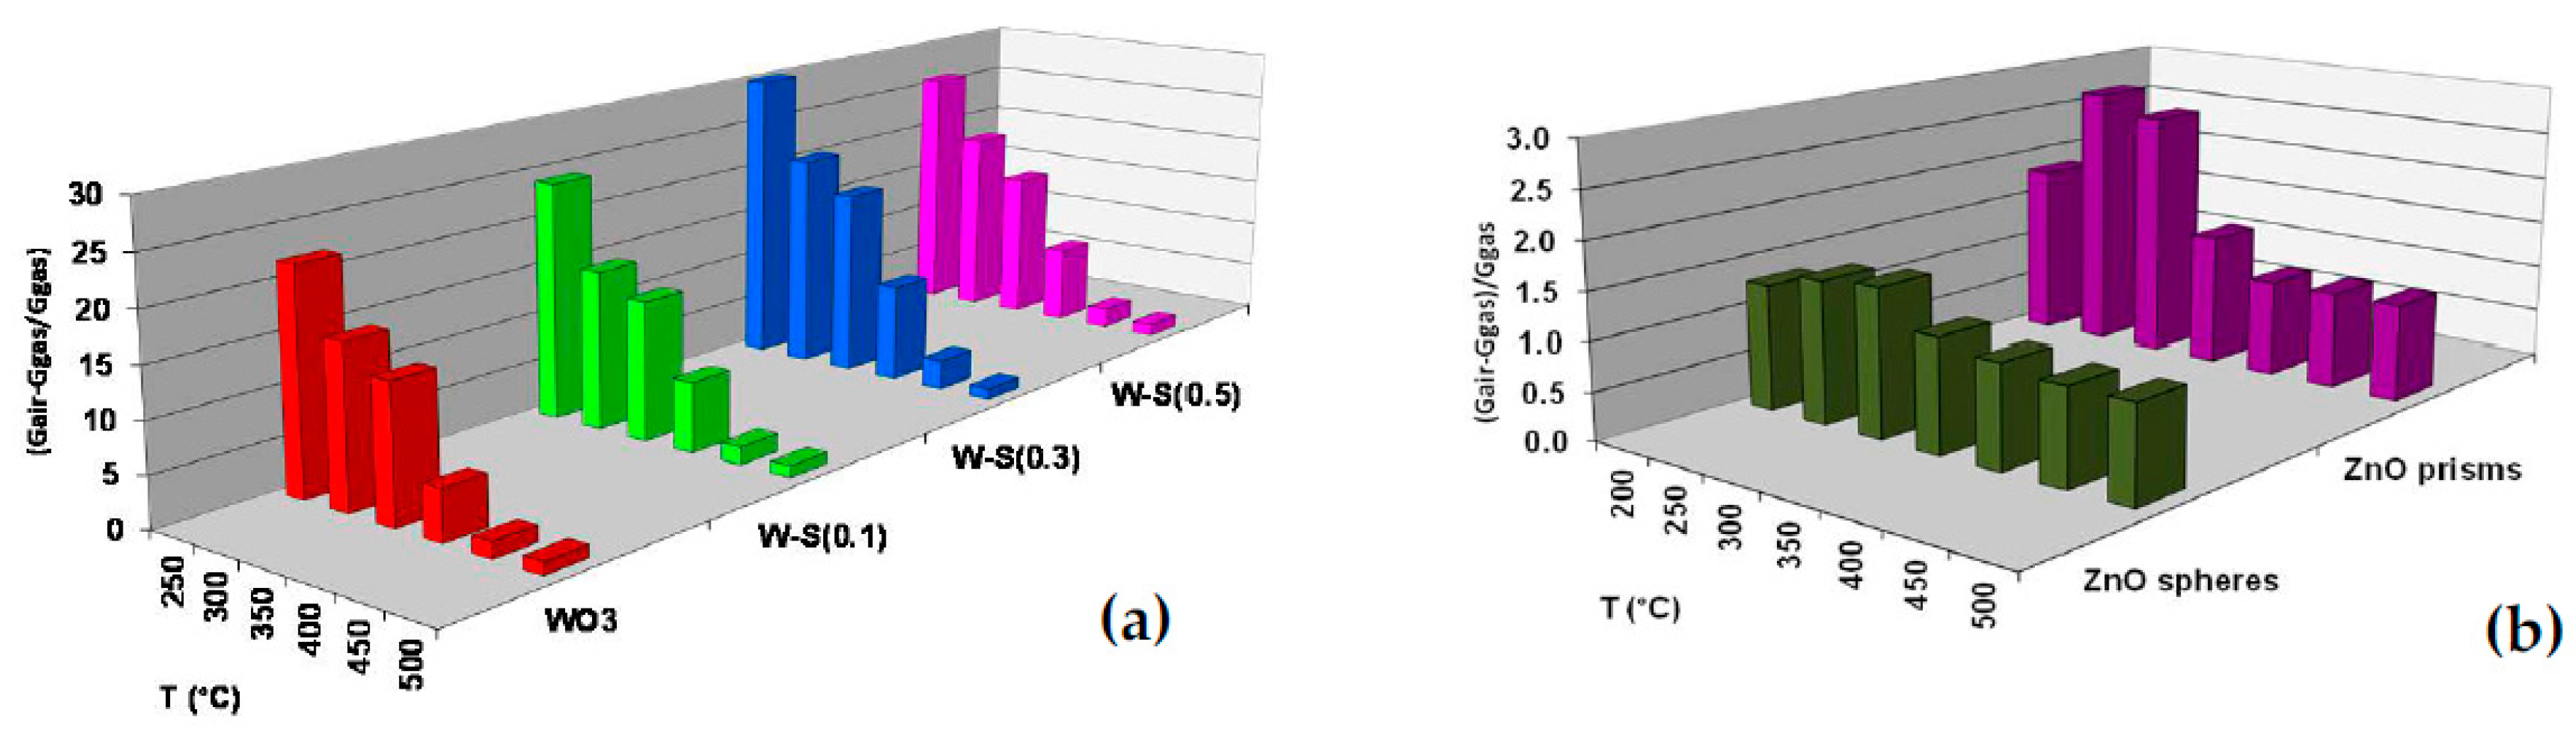
The behavior of the energy barriers versus temperature is a powerful tool to characterize the various sensing materials toward the different gases. Indeed, if the testing gas is reducing and the semiconductor is of type n, it will turn out that the Schottky barrier will decrease because a certain quantity of electrons pass to the conduction band, vice versa if the testing gas is oxidizing or the semiconductor is of type p. It can be observed that the only material, among those here characterized, really effective toward CO was SnO2 for which the barrier in CO (see Figure 4a) was strongly decreased than the one in air, meaning that a large amount of electrons was able to cross the barrier due to surface chemical reaction between the gas and surface adsorbed oxygen ions. On the contrary, SnO2 was poorly responsive toward NO2 except at very low temperatures, while all other materials examined were almost insensitive to CO, but exhibited high responses to NO2. In particular, the sensor with nominal Sn molar fraction of 0.3 exhibited the highest difference between the energy barrier in NO2 and in air (see Figure 4b) as well as it offered the highest response in the dynamical measurement toward 1 ppm of NO2 (see Figure 5a).
In Table 1, the electrical responses to 50 ppm of carbon monoxide obtained at different working temperatures for all samples are reported. Except SnO2, all other sensors exhibited poor responses. It can be also noted that ZnO spheres better performed with respect to ZnO prisms. Indeed, as typical for reducing gases, spherical geometry is favored with respect to bi-dimensional one, while, for oxidizing gases, the relation between the response and the grain dimension must be still completely understood. However, the Figure 5 b shows that, in the case of ozone and ZnO sensors, the bi-dimensional morphology is more performant than the spherical one.
Author Contributions
A.F. and M.C.C. conceived the work, synthesized the materials, prepared the sensors and performed the electrical characterizations, S.M. and A.A. carried out the XRD, BET and spectroscopic characterizations, S.M. collaborated with A.F. and M.C.C. to the analysis of all data and to write the paper, M.M. performed the FE-SEM characterizations and M.S. analyzed all crystallographic data.
Funding
This research received no external funding.
Conflicts of Interest
The authors declare no conflict of interest.
References
- Morandi, S.; Fioravanti, A.; Cerrato, G.; Lettieri, S.; Sacerdoti, M.; Carotta, M.C. Facile synthesis of ZnO nano-structures: Morphology influence on electronic properties. Sens. Actuators B Chem. 2017, 249, 581–589. [Google Scholar] [CrossRef]
- Fioravanti, A.; Bonanno, A.; Gherardi, S.; Carotta, M.C.; Skouloudis, A.N. A portable air-quality station based on thick film gas sensors for real time detection of traces of atmospheric pollutants. In IOP Conference Series: IOP Conference Series: Materials Science and Engineering; IOP Publishing: Bristol, UK, 2016; Volume 108, p. 012005. [Google Scholar] [CrossRef]
- Carotta, M.C.; Cervi, A.; Fioravanti, A.; Gherardi, S.; Giberti, A.; Vendemiati, B.; Vincenzi, D.; Sacerdoti, M. A novel ozone detection at room temperature through UV-led-assisted ZnO thick film sensors. Thin Solid Films 2011, 520, 939–946. [Google Scholar] [CrossRef]
- Guidi, V.; Blo, M.; Butturi, M.A.; Carotta, M.C.; Galliera, S.; Giberti, A.; Malagù, C.; Martinelli, G.; Piga, M.; Sacerdoti, M.; et al. Aqueous and alcoholic syntheses of tungsten trioxide powders for NO2 detection. Sens. Actuators B Chem. 2004, 100, 277–282. [Google Scholar] [CrossRef]
Figure 1.
XRD pattern of pure WO3 and W-Sn powders (nominal Sn molar fraction of 0.1, 0.3 and 0.5).
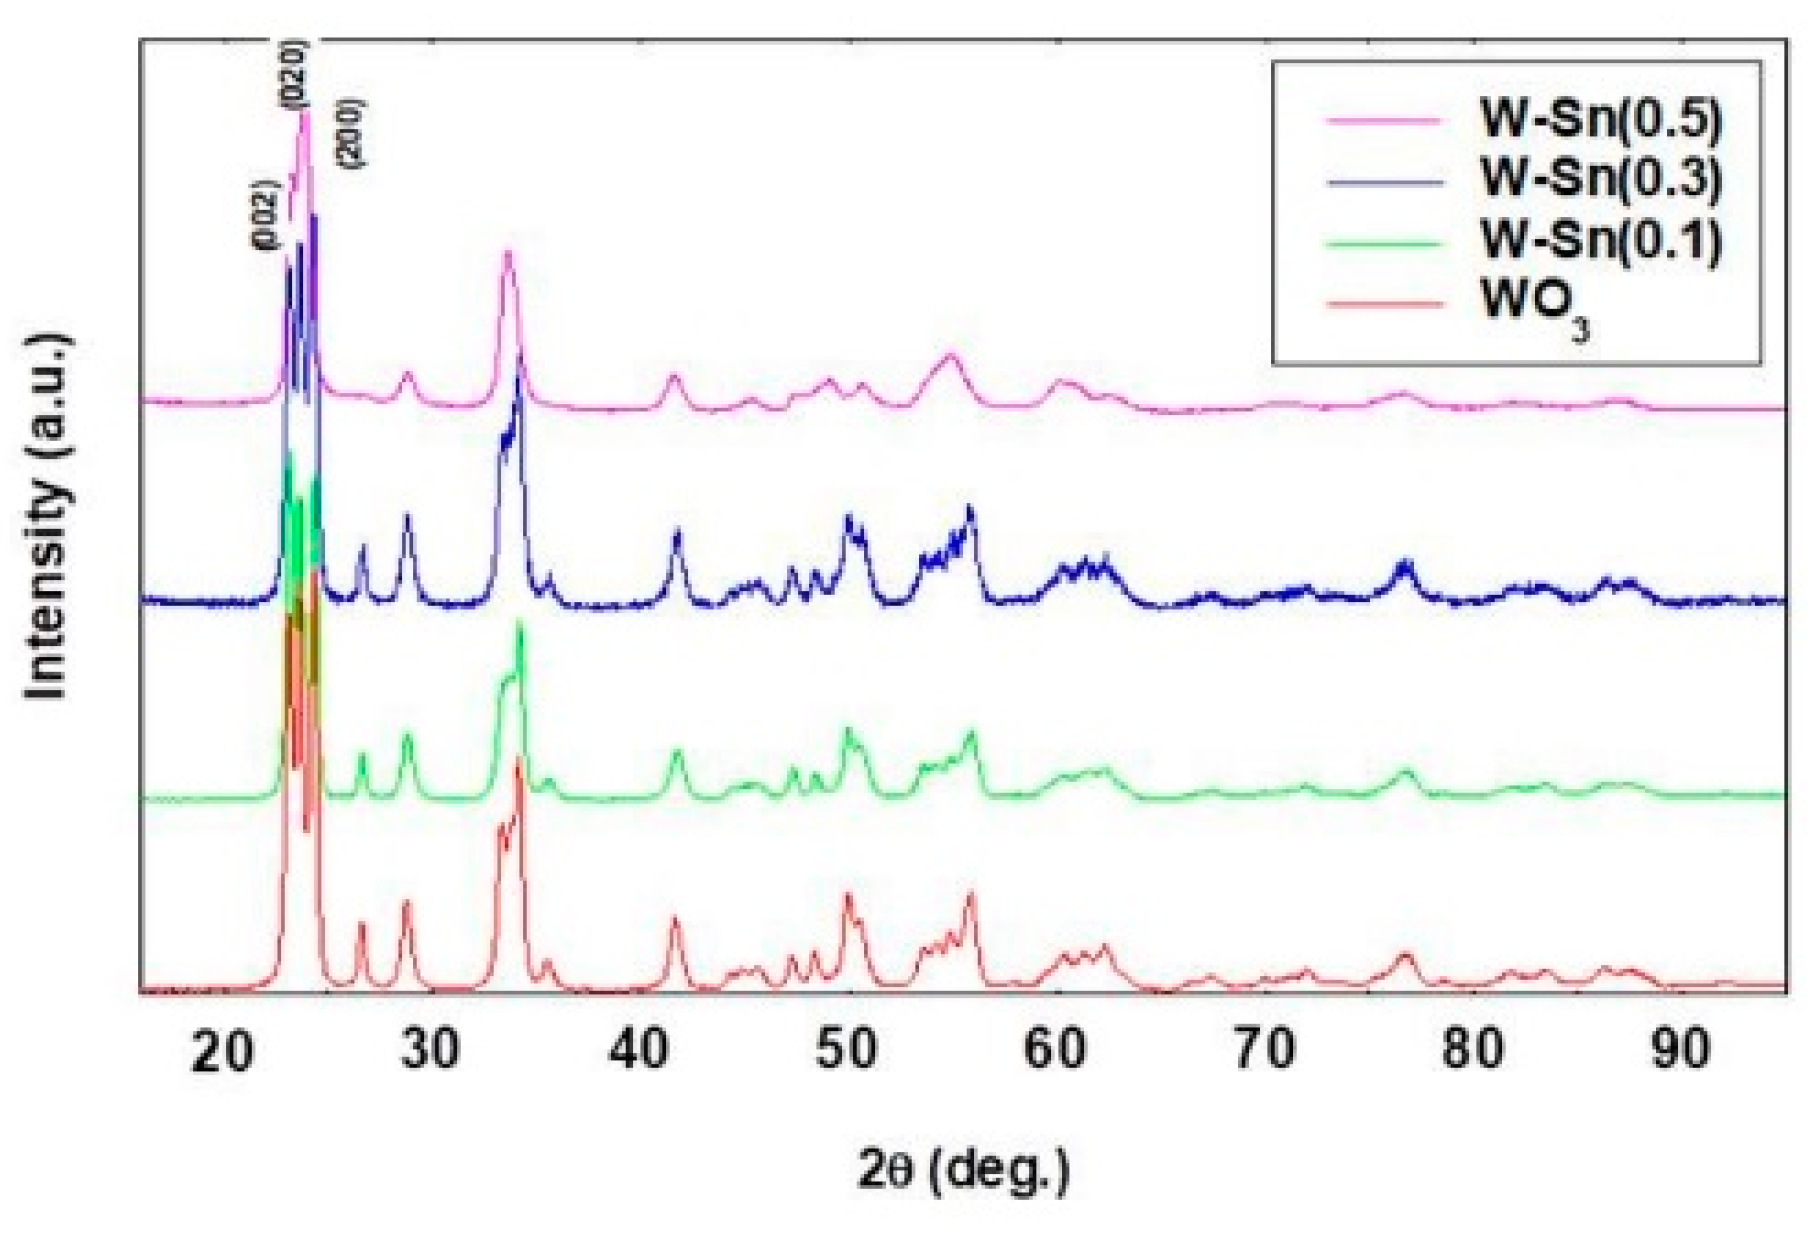
Figure 2.
FE-SEM images of the calcined powders: (a) WO3; (b) W-Sn(0.1); (c) W-Sn(0.3); (d) W-Sn(0.5); (e) ZnO nanoprisms; (f) ZnO nanospheres.
Figure 2.
FE-SEM images of the calcined powders: (a) WO3; (b) W-Sn(0.1); (c) W-Sn(0.3); (d) W-Sn(0.5); (e) ZnO nanoprisms; (f) ZnO nanospheres.
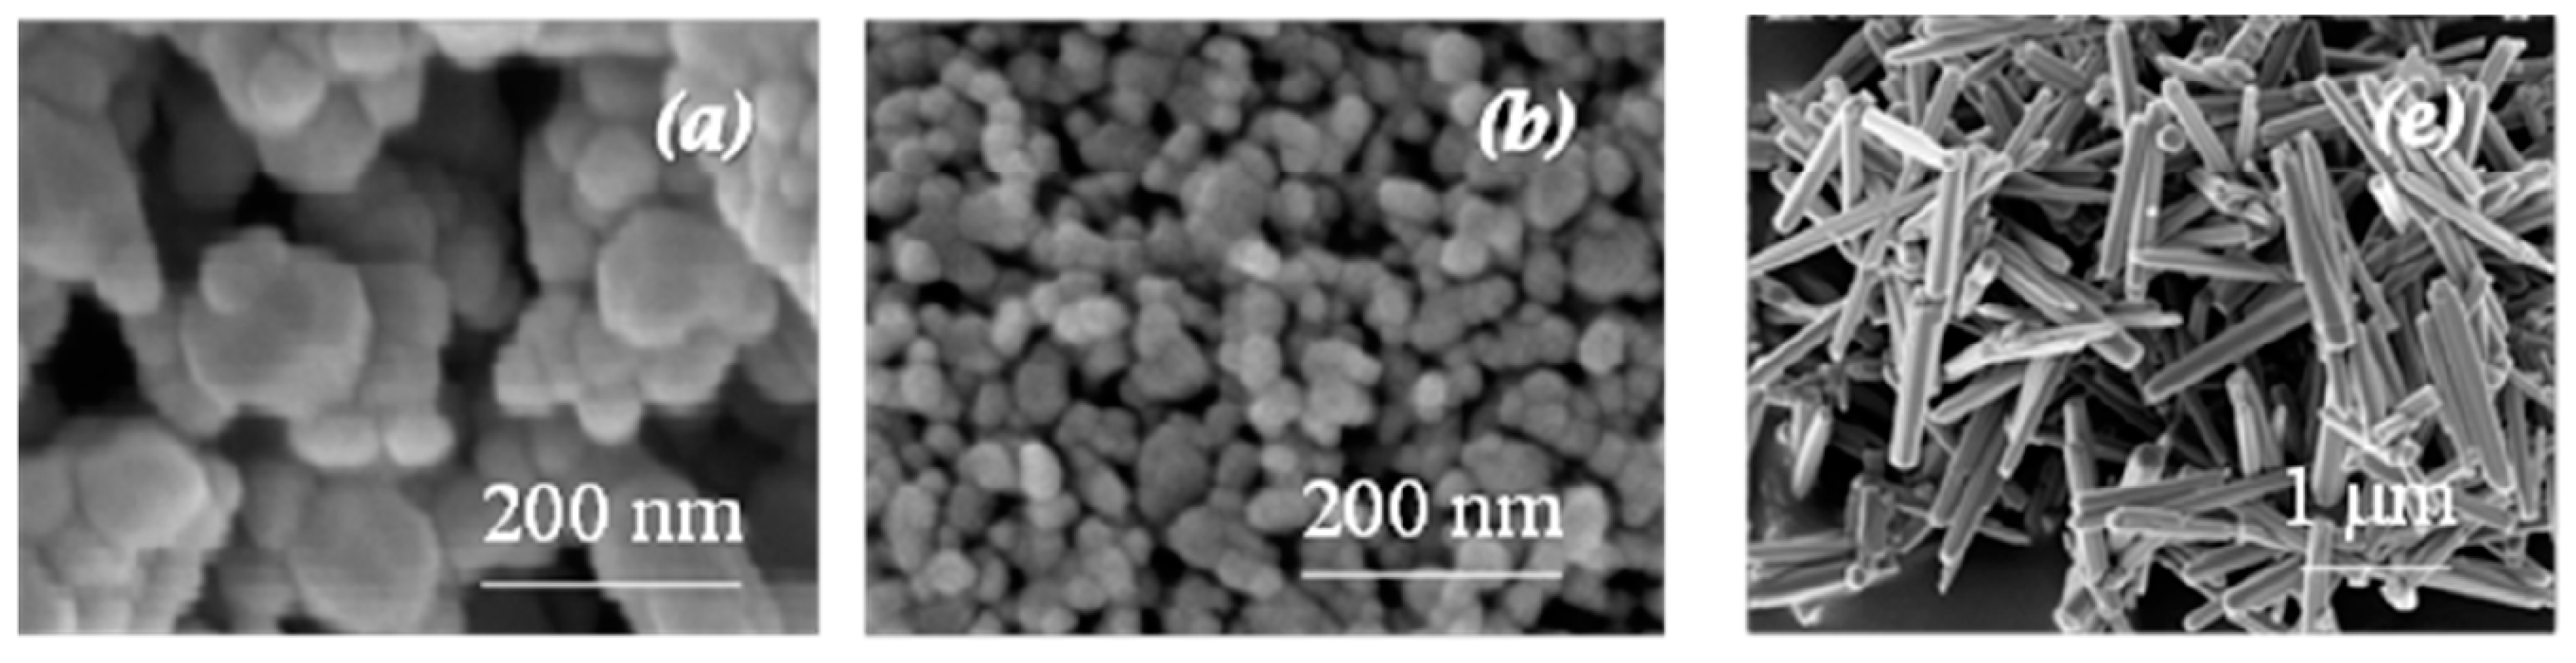
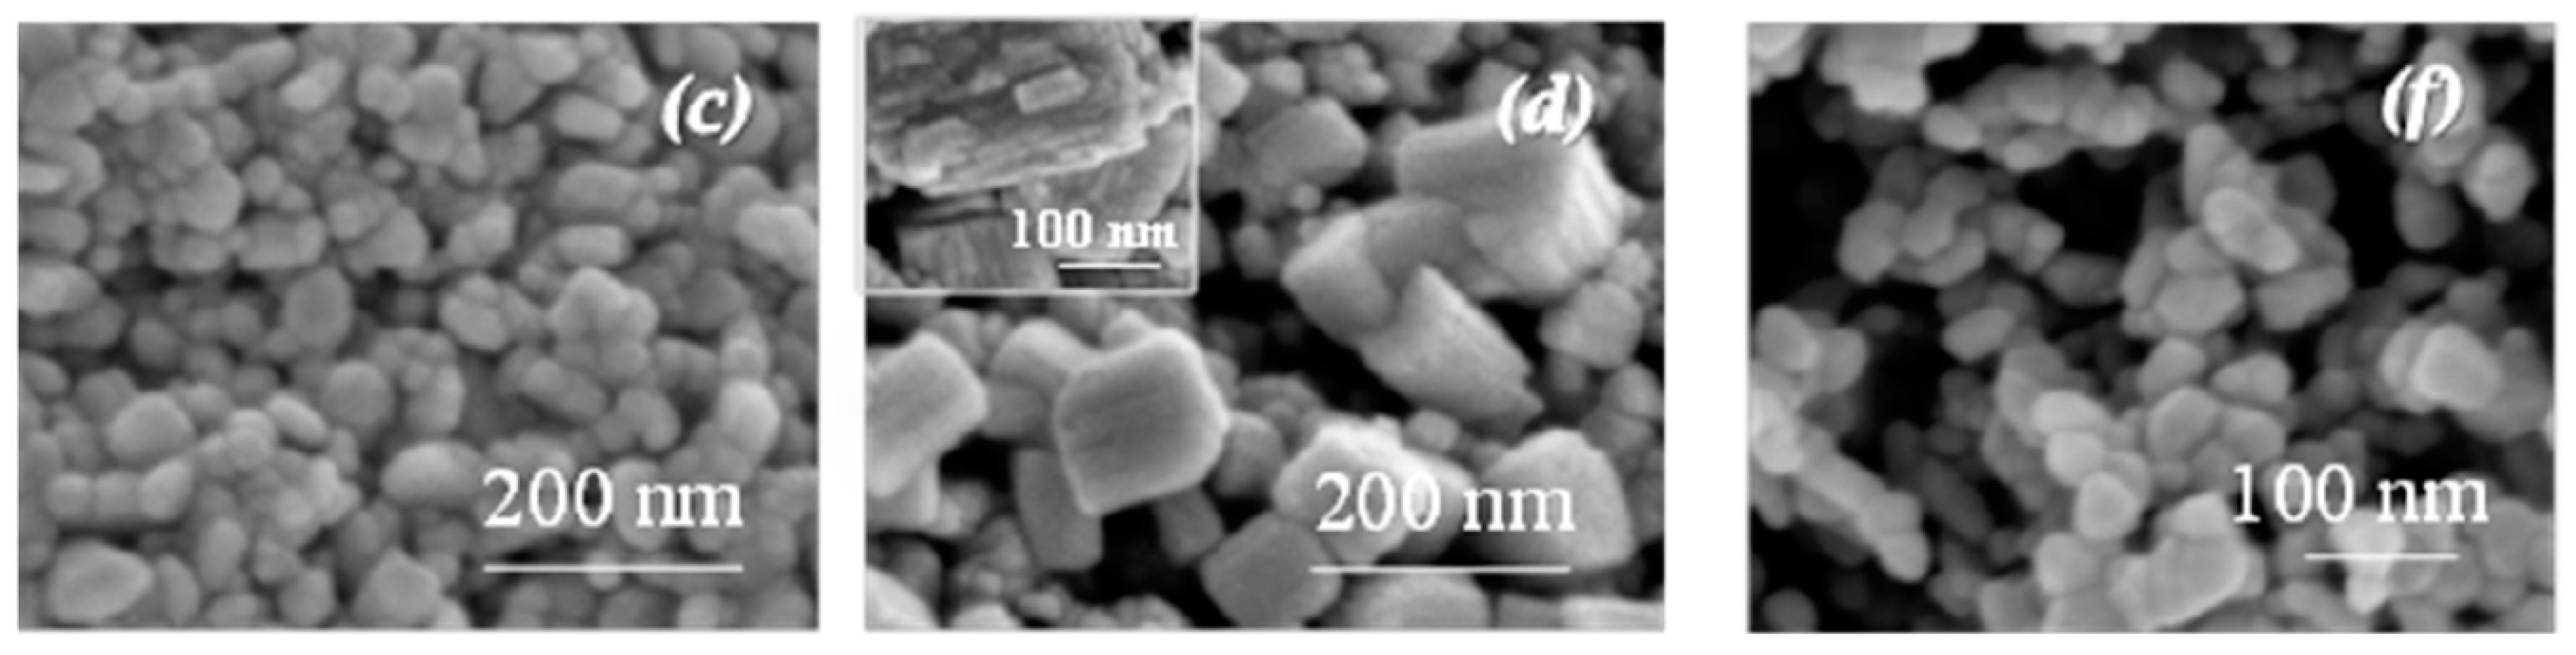
Figure 3.
FT-IR spectra of W-Sn samples during interaction with CO/O2 (1:5, pCO = 5 mbar) at the temperature of the maximum absorption intensity.
Figure 3.
FT-IR spectra of W-Sn samples during interaction with CO/O2 (1:5, pCO = 5 mbar) at the temperature of the maximum absorption intensity.
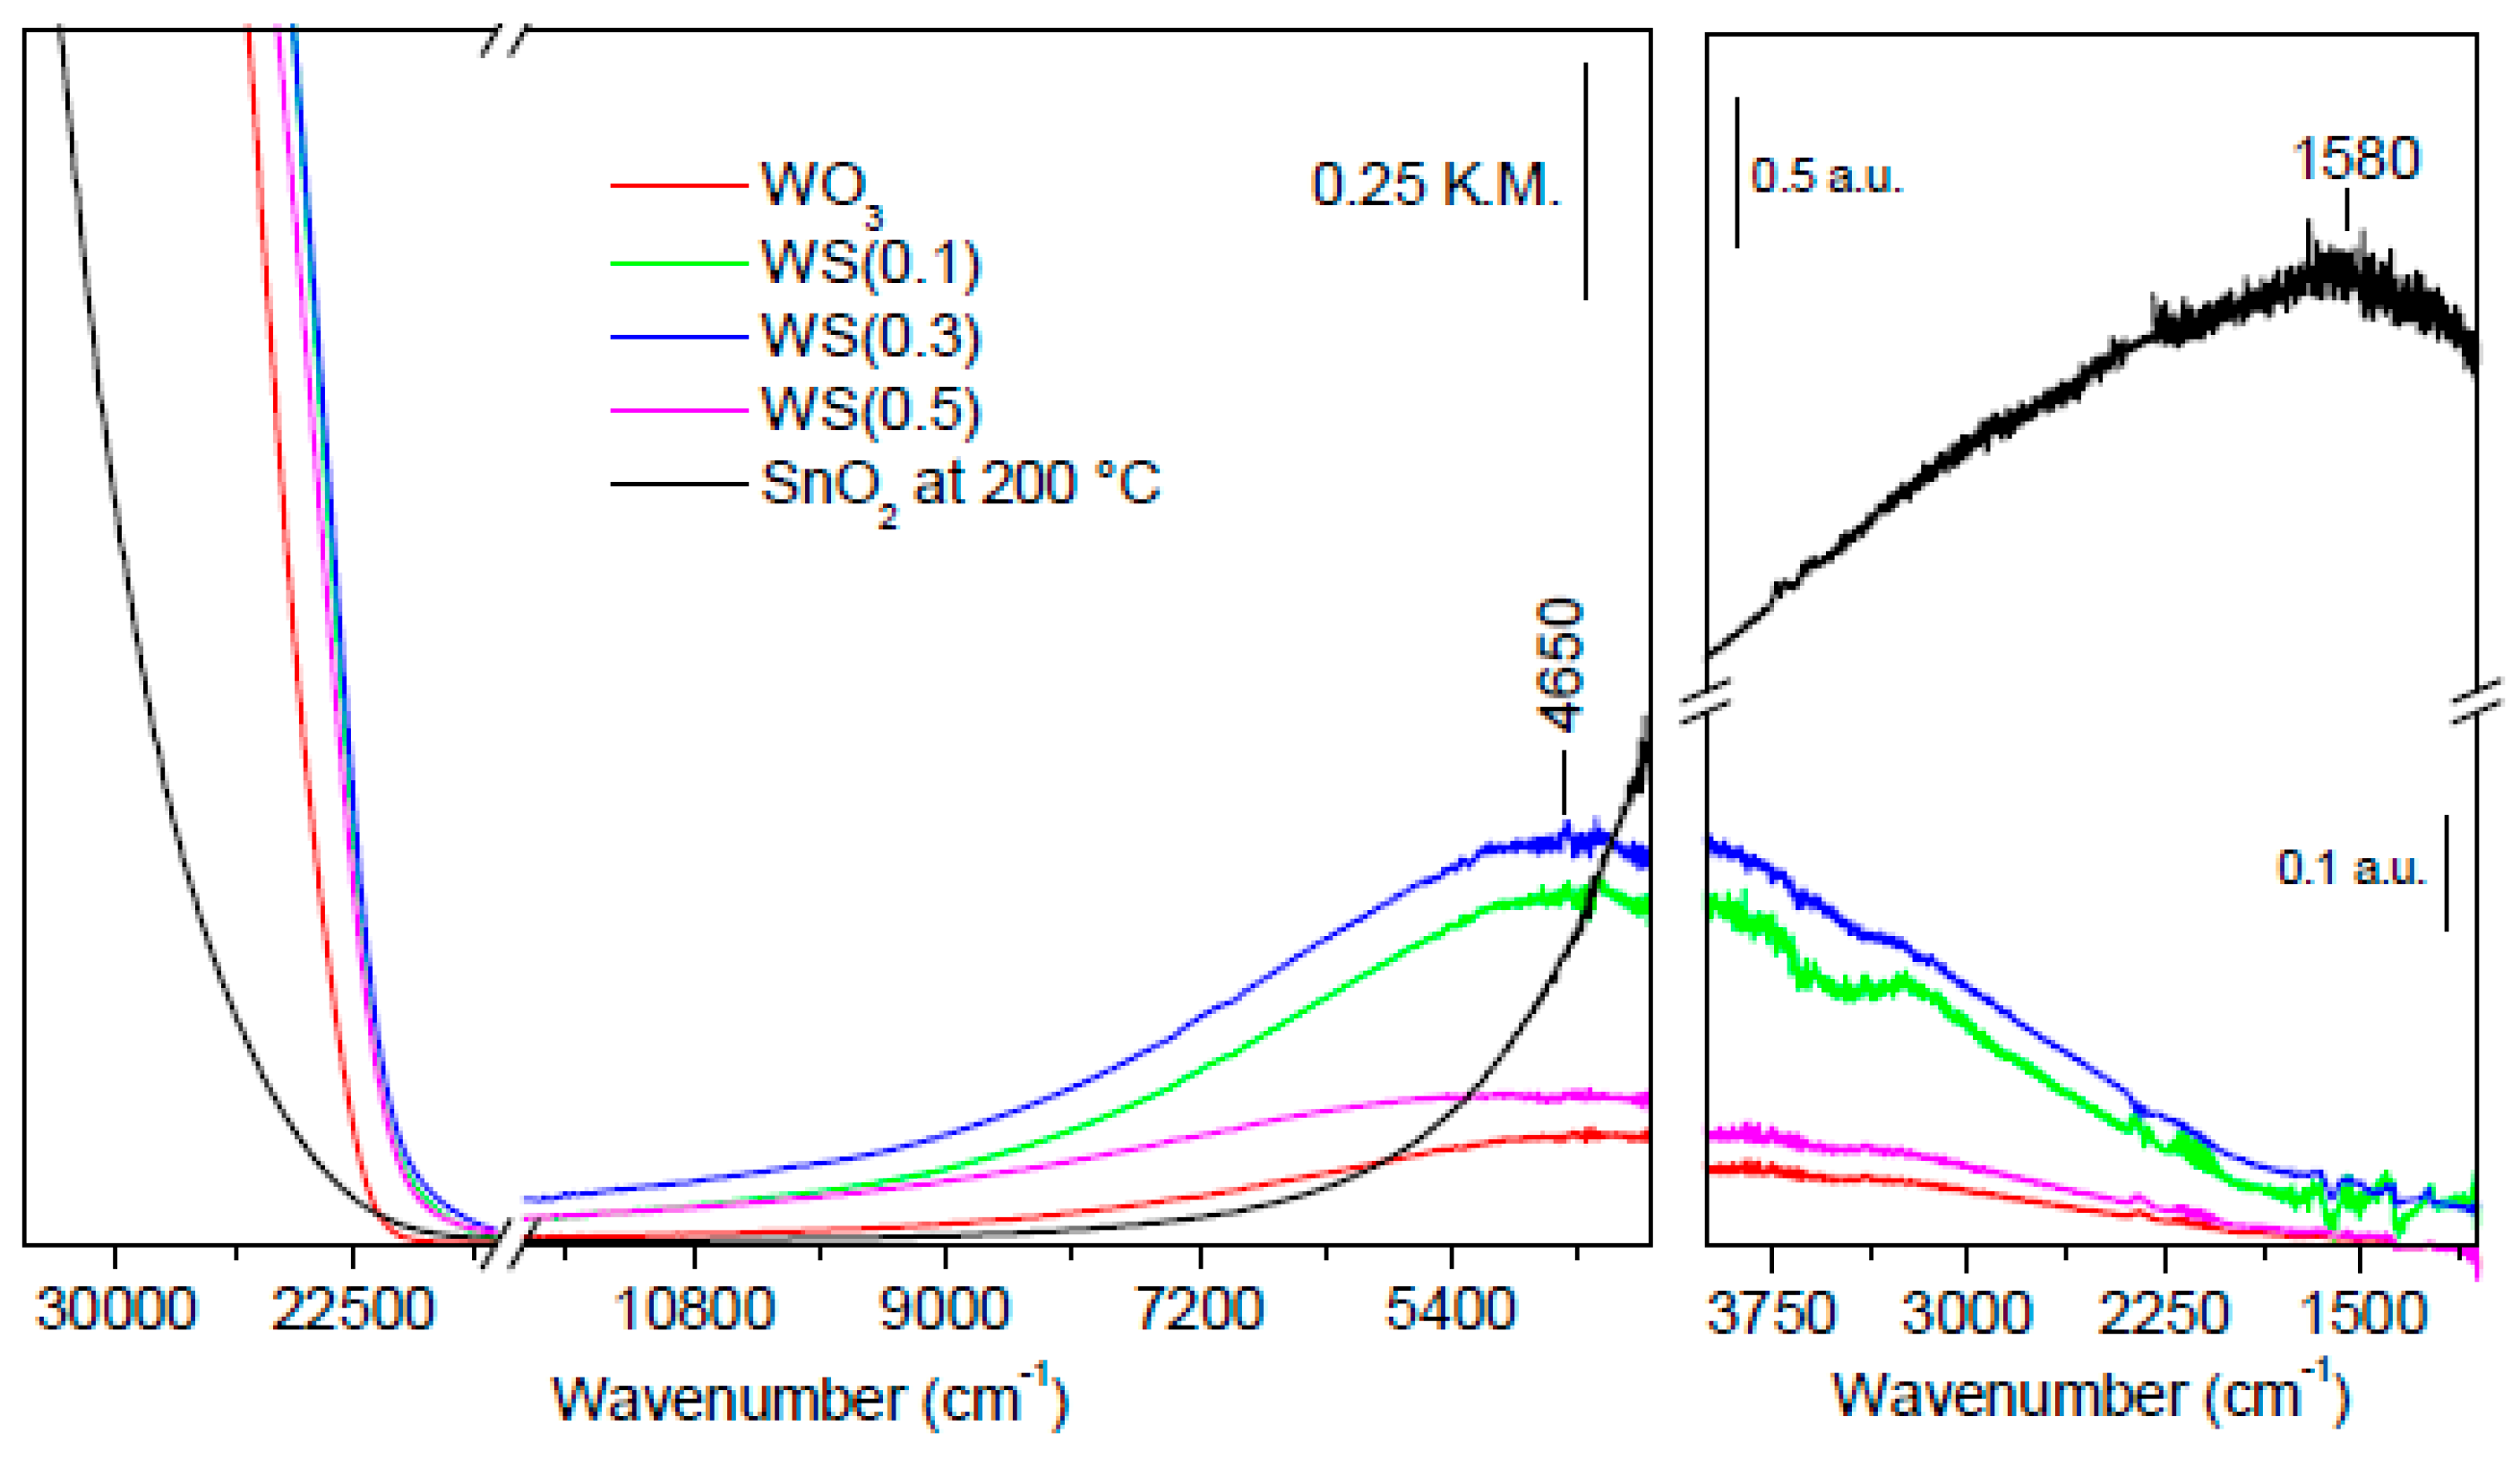
Figure 4.
(a) Comparison between the energy barriers in dry air and in 100 ppm of CO; (b) in dry air and in 10 ppm of NO2.
Figure 4.
(a) Comparison between the energy barriers in dry air and in 100 ppm of CO; (b) in dry air and in 10 ppm of NO2.
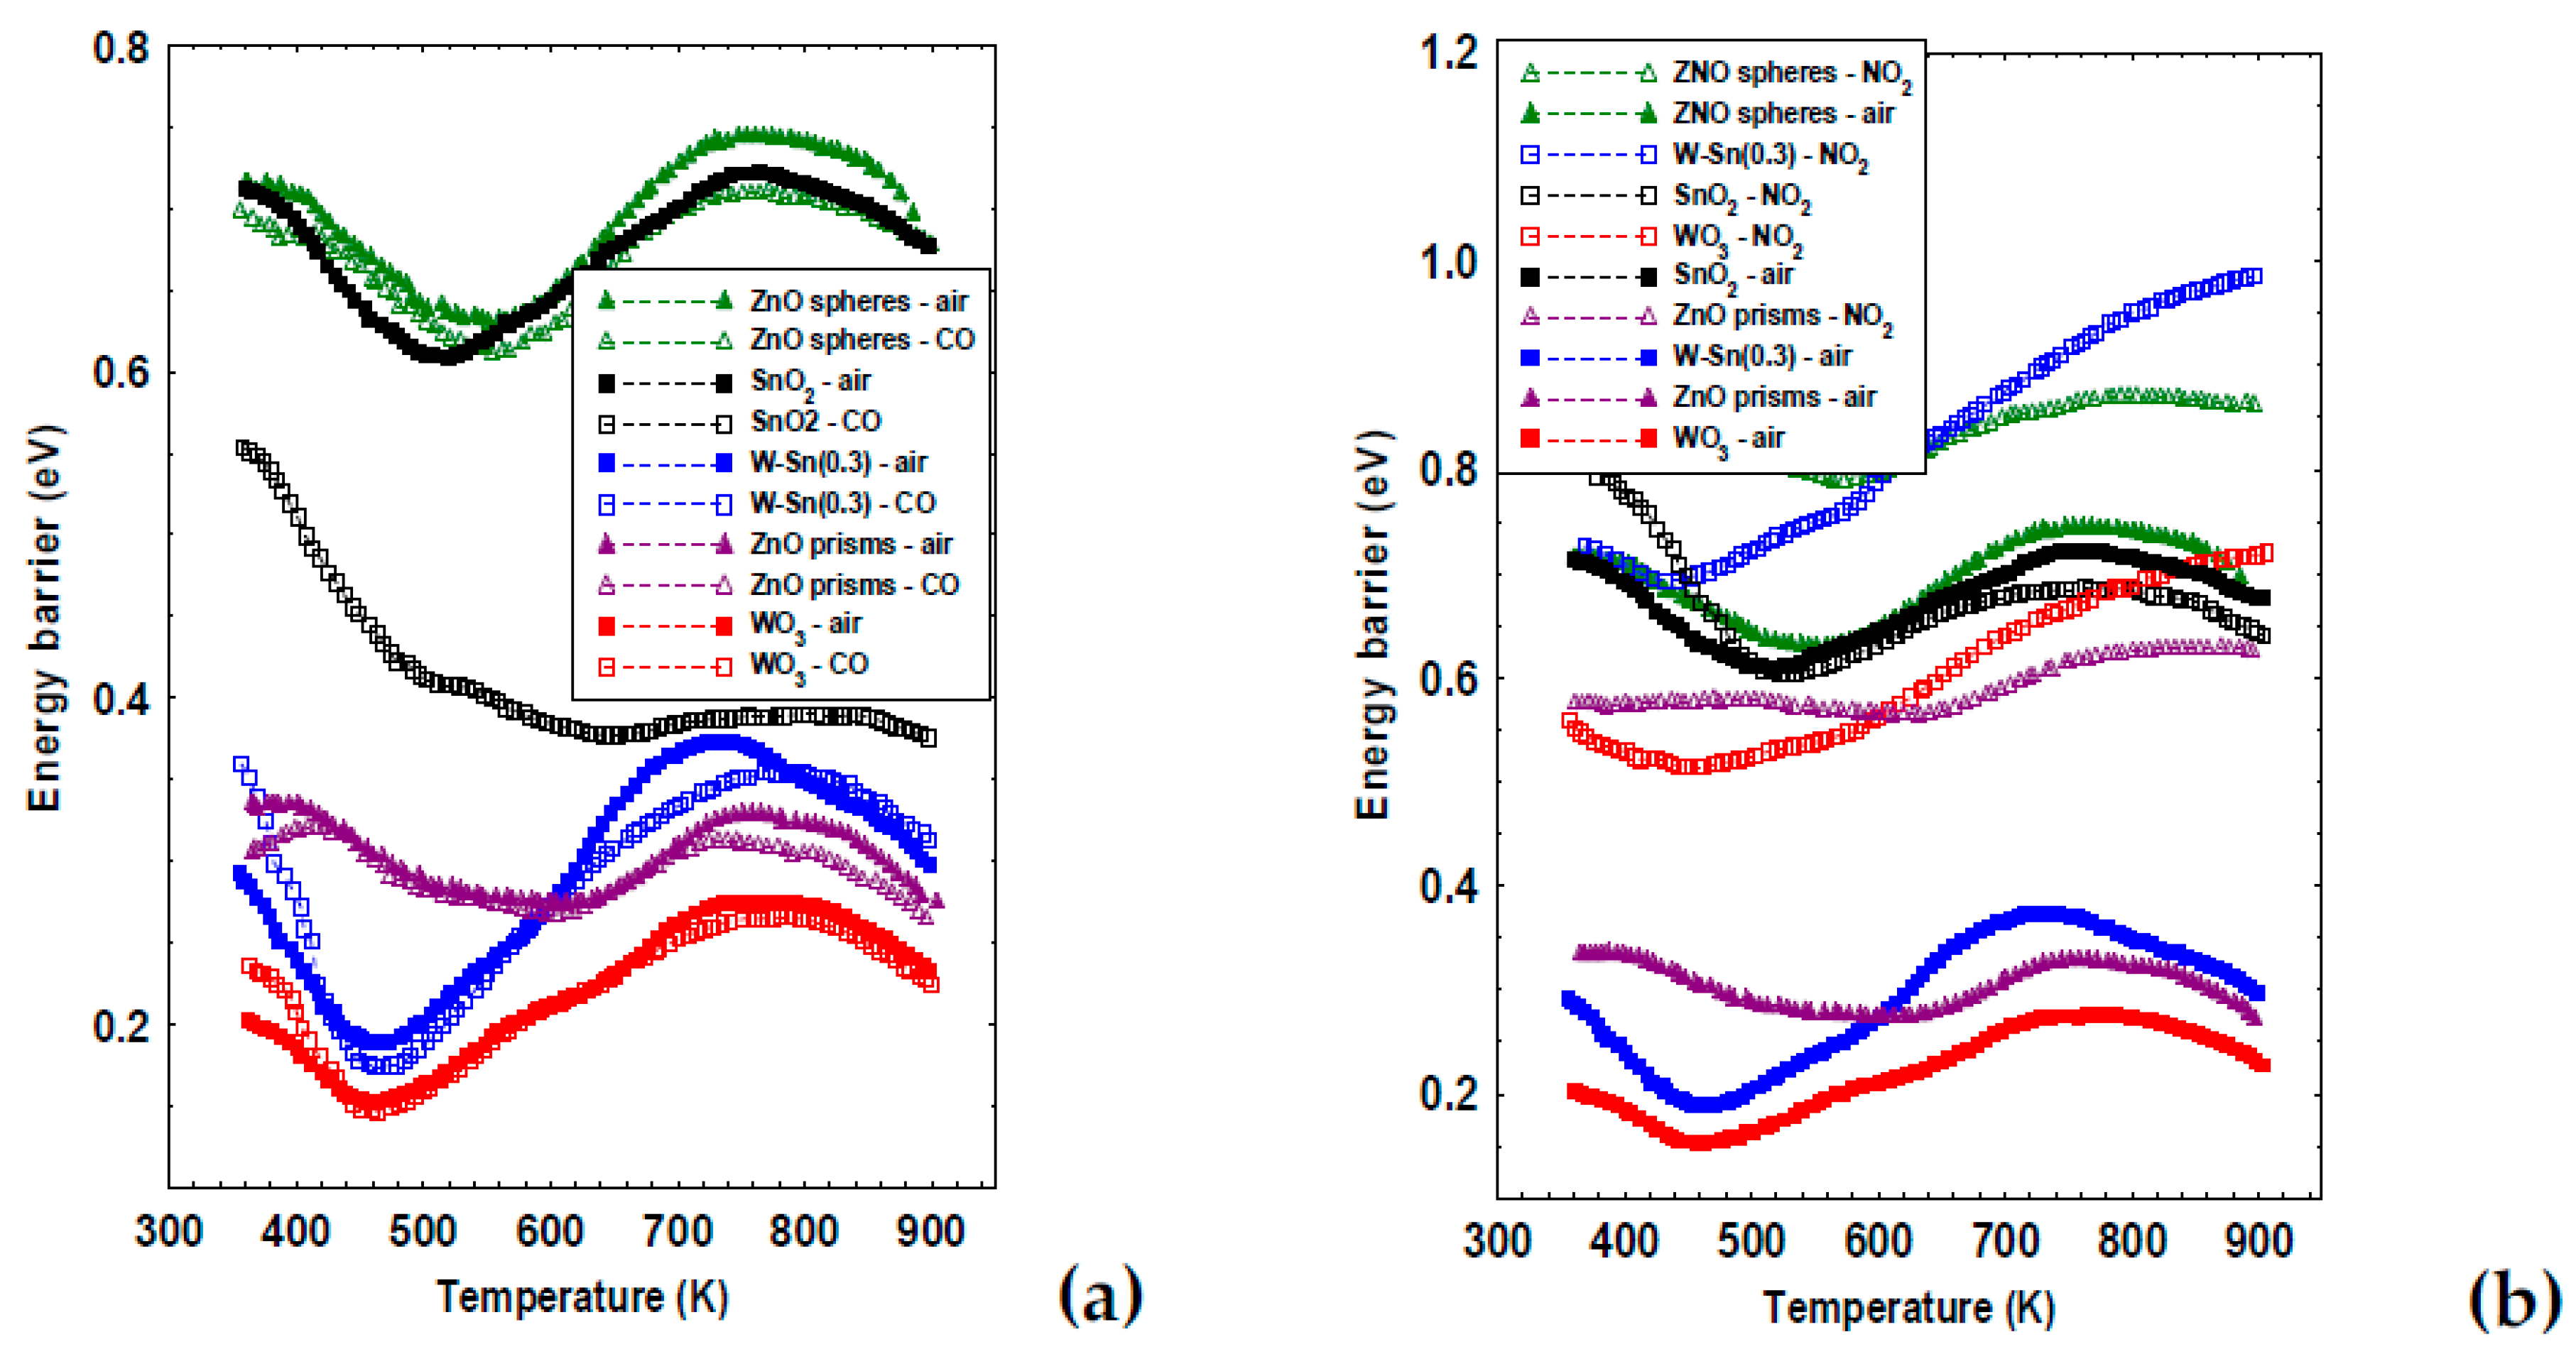
Figure 5.
(a) Responses of W-Sn sensors to 1 ppm of NO2 reported as (Gair-Ggas)/Ggas obtained at different working temperatures; (b) responses to 100 ppb of O3 for ZnO spheres and prisms both fired at 650 °C.
Figure 5.
(a) Responses of W-Sn sensors to 1 ppm of NO2 reported as (Gair-Ggas)/Ggas obtained at different working temperatures; (b) responses to 100 ppb of O3 for ZnO spheres and prisms both fired at 650 °C.

Table 1.
Responses of all sensors to 50 ppm of CO reported as Ggas/Gair obtained at different temperatures.
Table 1.
Responses of all sensors to 50 ppm of CO reported as Ggas/Gair obtained at different temperatures.
| Temperature (°C) | ||||
|---|---|---|---|---|
| Sample | 350 | 400 | 450 | 500 |
| WO3 | 1.06 | 1.06 | 1.06 | 1.02 |
| W-S(0.1) | 1.13 | 1.15 | 1.09 | 1.12 |
| W-S(0.3) | 1.14 | 1.12 | 1.08 | 1.08 |
| W-S(0.5) | 1.28 | 1.3 | 1.23 | 1.02 |
| SnO2 | 6.36 | 4.71 | 3.70 | 2.90 |
| ZnO spheres | 1.81 | 1.54 | 1.63 | 1.57 |
| ZnO prisms | 1.06 | 1.06 | 1.06 | 1.02 |
Publisher’s Note: MDPI stays neutral with regard to jurisdictional claims in published maps and institutional affiliations. |
© 2018 by the authors. Licensee MDPI, Basel, Switzerland. This article is an open access article distributed under the terms and conditions of the Creative Commons Attribution (CC BY) license (https://creativecommons.org/licenses/by/4.0/).
Share and Cite
MDPI and ACS Style
Fioravanti, A.; Morandi, S.; Amodio, A.; Mazzocchi, M.; Sacerdoti, M.; Carotta, M.C. W-Sn Mixed Oxides and ZnO to Detect NOx and Ozone in Atmosphere. Proceedings 2018, 2, 836. https://doi.org/10.3390/proceedings2130836
AMA Style
Fioravanti A, Morandi S, Amodio A, Mazzocchi M, Sacerdoti M, Carotta MC. W-Sn Mixed Oxides and ZnO to Detect NOx and Ozone in Atmosphere. Proceedings. 2018; 2(13):836. https://doi.org/10.3390/proceedings2130836
Chicago/Turabian StyleFioravanti, Ambra, Sara Morandi, Alessia Amodio, Mauro Mazzocchi, Michele Sacerdoti, and Maria Cristina Carotta. 2018. "W-Sn Mixed Oxides and ZnO to Detect NOx and Ozone in Atmosphere" Proceedings 2, no. 13: 836. https://doi.org/10.3390/proceedings2130836