1. Introduction and Motivation
Heating, ventilation, and air conditioning (HVAC) systems, domestic hot water, lighting, and their appliances account for the most of the overall energy consumption of nowadays buildings. Studies [
1] demonstrate great saving potential for such systems when they are adjusted properly. A basic strategy for saving energy in HVAC systems is to monitor the system precisely with several flow sensors distributed along the pipe system. Such a flow sensor was already developed for air environments by the authors [
2,
3]. However, measurement principle and readout method of the sensor enables the possibility to measure the flow velocity in various fluids. In this paper, we present finite element method (FEM) results as well as a comparison to measurement results, which enable a fast and easy way to evaluate and optimize the sensor’s behaviour in different fluids.
2. Experimental Procedure (Design, Simulation, and Experiments)
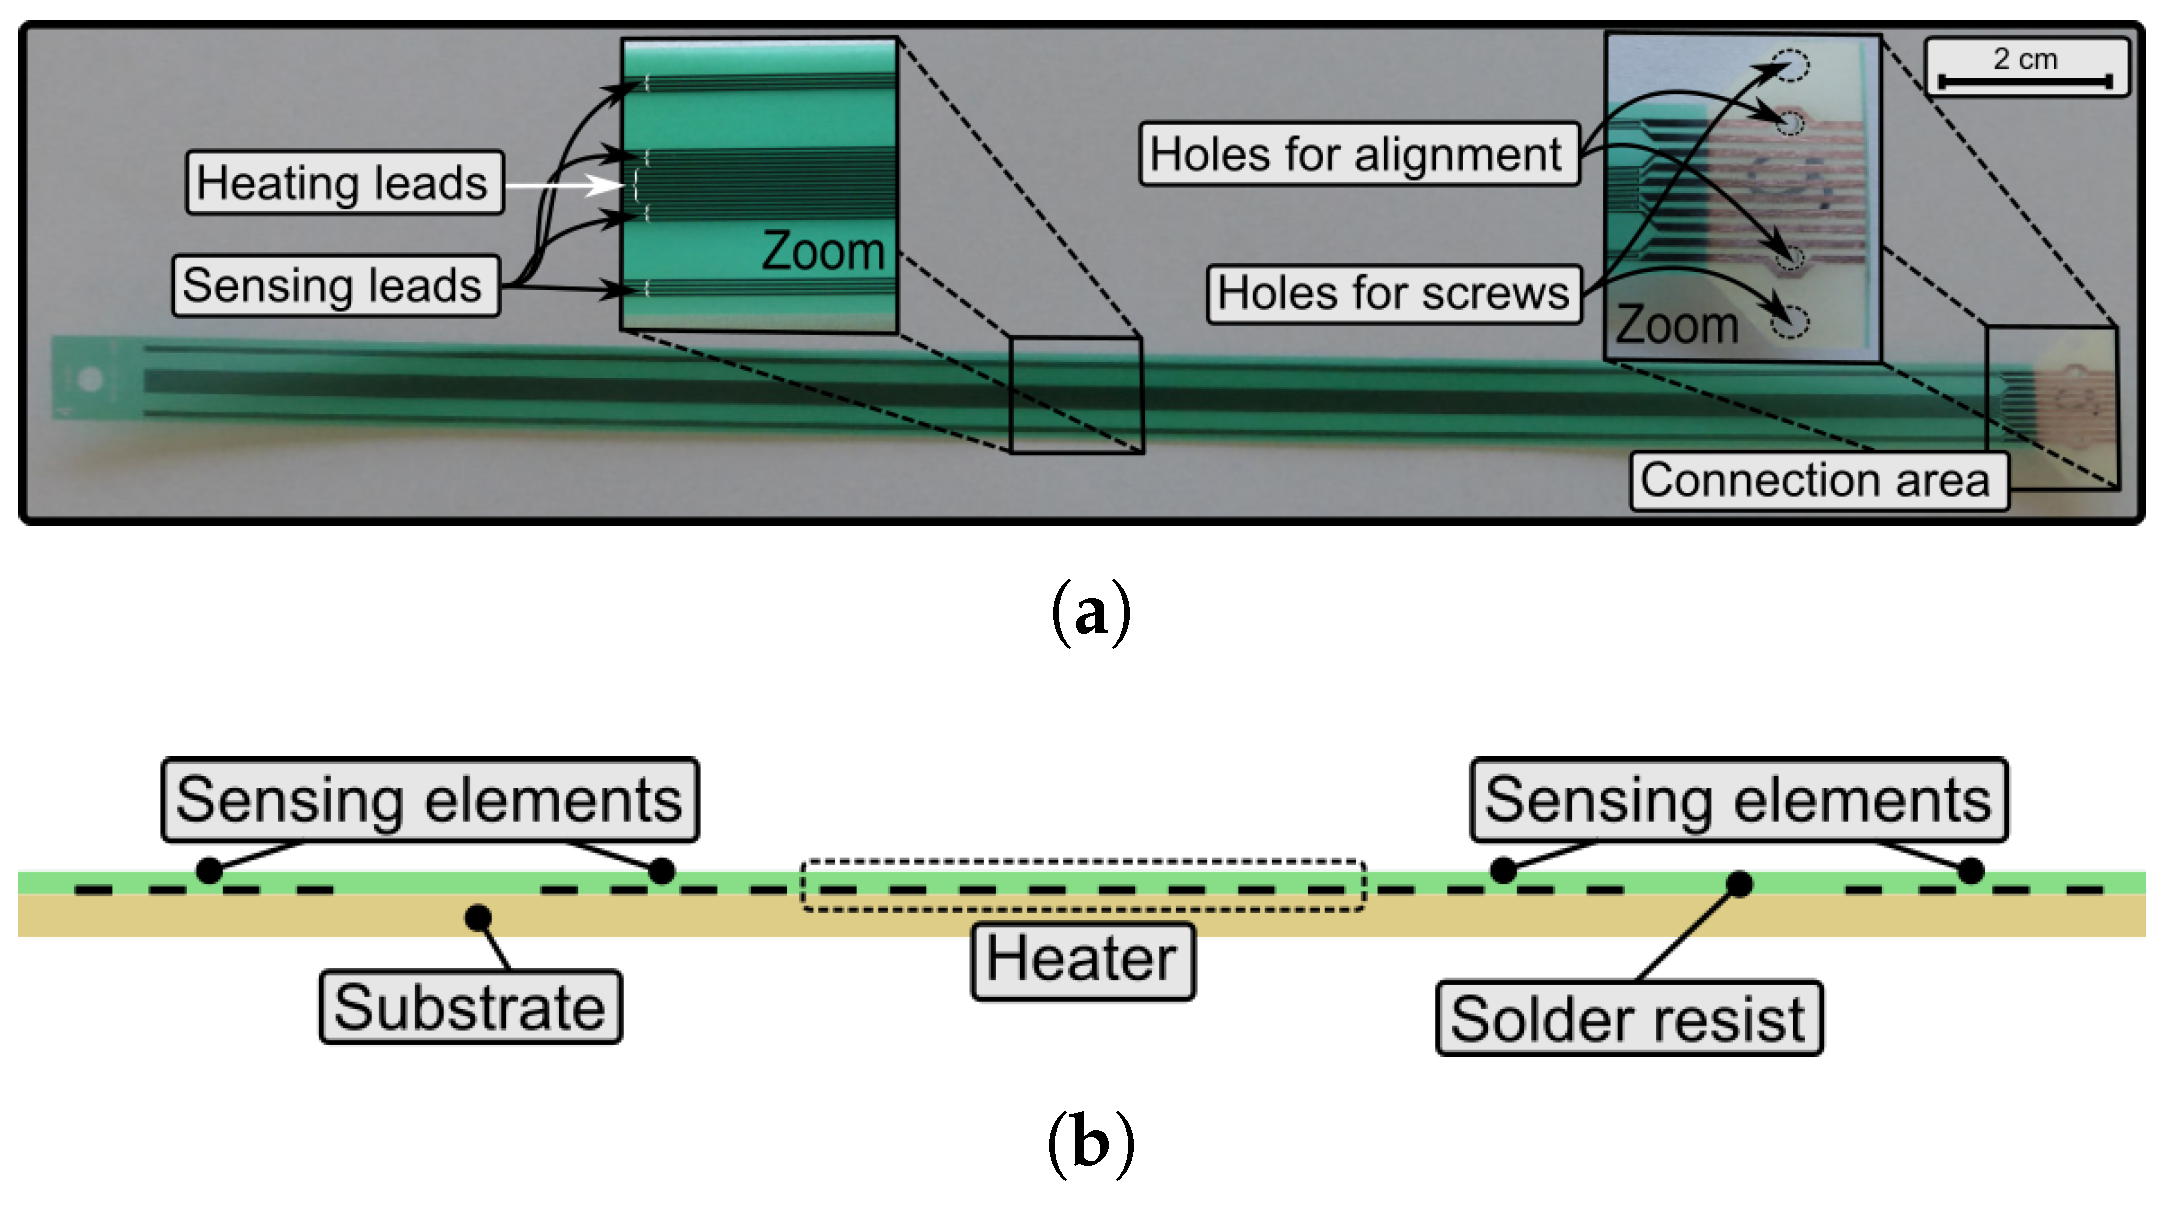
The sensor (
Figure 1a) consists of the substrate, the conductive layer, and the passivation layer. The substrate is a conventional FR4 glass epoxy laminate and exhibits a thickness of 100 ± 13 μm. A flexible copper foil is used as conducting paths (leads) with a thickness of 5.0 ± 1.7 μm on a 35 μm thick carrier foil. There are one heater lead and four sensing leads with a width of 100 μm. The heater lead supplies the sensor system with heating power. It is located in the middle of the sensor and shaped in a meander pattern with the order of eight. Besides the heater, sensing leads are located, two upstream and two downstream, with a meander pattern with the order of four. On top of the leads, a polymer layer is deposited for protection from corrosive media made of photostructurable kapton solder resist (polyimide film) with a thickness of 30 ± 10 μm.
A 2D-FEM model was set up with Comsol Multiphysics in order to predict the sensor characteristic. The applied conjugated heat transfer model combines the heat transfer module with the laminar flow module. The model is based on the cross-sectional view depicted in
Figure 1b. The flow channel in the simulation has a height of 5cm, a width of 25cm, and a length of 10cm. The sensor solid surfaces are set to an initial temperature of 293.15K. The heating power is set via the overall heat transfer rate
, with
as the volume of the heater and
as the total generated power.
There are two different types of fluid materials in this simulation: gases (air, argon, helium) and liquids (water, ethanol, engine oil). For each fluid material, a stationary study with an auxiliary sweep was chosen to perform the simulation. The auxiliary sweep changes two parameters: the inlet flow velocity
as well as the heating power
. For gases,
is in the range 0 m/s to 10 m/s increment
m/s and
is in the range 0 W to 2 W increment
W while for liquids
is in the range 0 m/s to 2 m/s increment
m/s and
is in the range 0 W to 10 W increment
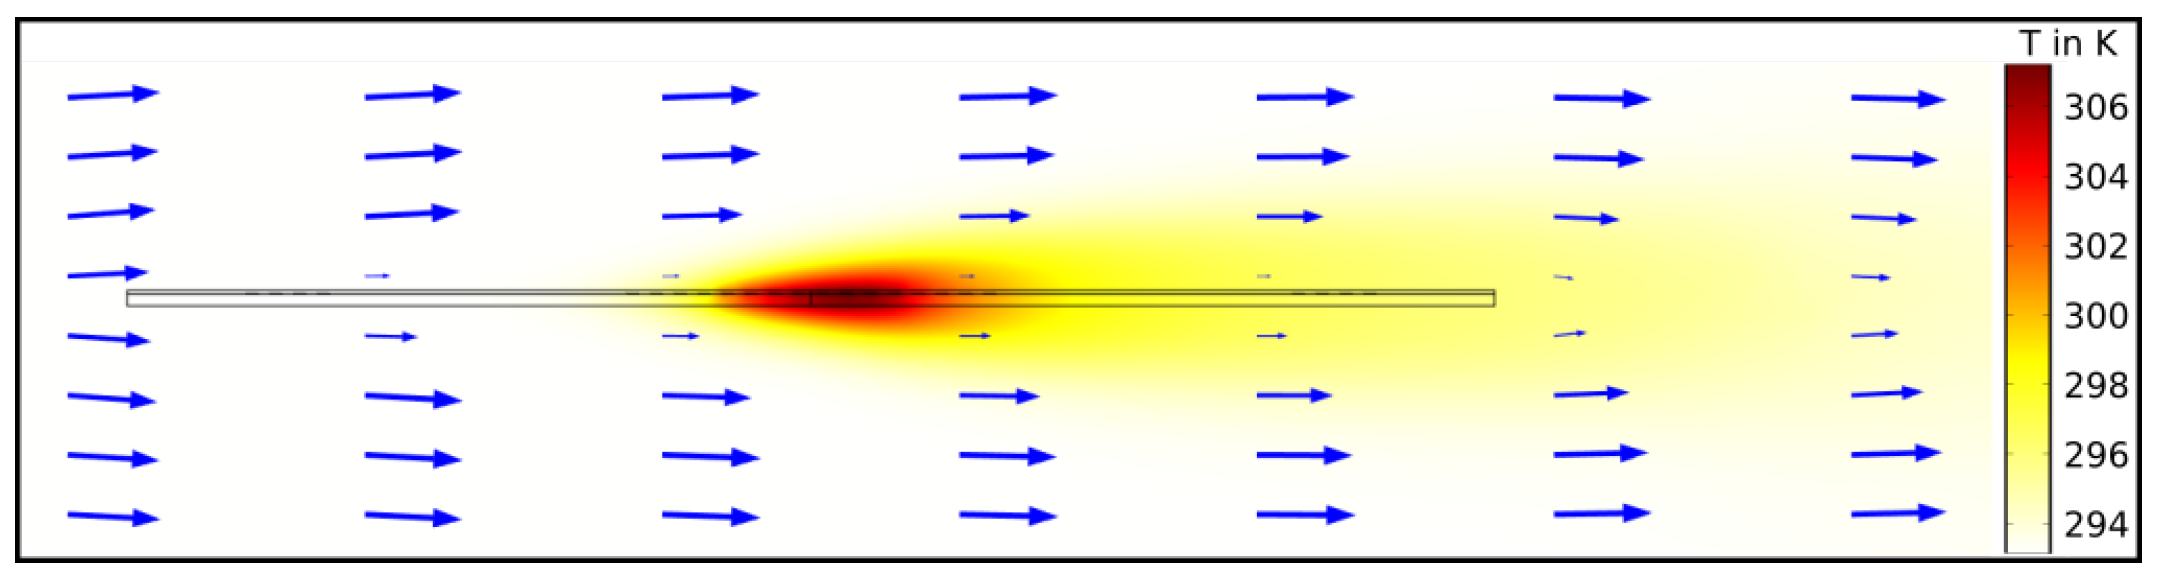
W. The simulation results yield the excess temperature of each lead for each parameter combination and fluid material. In
Figure 2, the temperature distribution (colour) and the velocity field (blue arrows) of the simulation are shown where a heating power of 1 W, a flow velocity of 1m/s, and air as fluid are applied. It can be seen that the temperature profile is shifted downstream when a flow occurs, which means the up- and downstream sensing elements experience different temperatures.
The experiments for air were performed in ventilation pipes of a living-lab office building [
4]. The PCB sensor was installed into a straight pipe (
mm) and it was spanned across. A reference sensor was located 750mm downstream of the PCB sensor with a state absolute accuracy of
. The flow is imposed by a central fan unit from two offices where control flaps ensure the defined flow rates.
3. Results
Based on the simulated results at the four sensing leads for each fluid material, temperature differences for each flow velocity, heating power, and fluid material are calculated. Subsequently, this temperature difference is the sum of the inner sensing lead temperatures (mean temperature at the middle of the sensor) minus the sum of the outer sensing lead temperatures (mean temperature at the periphery of the sensor):
.
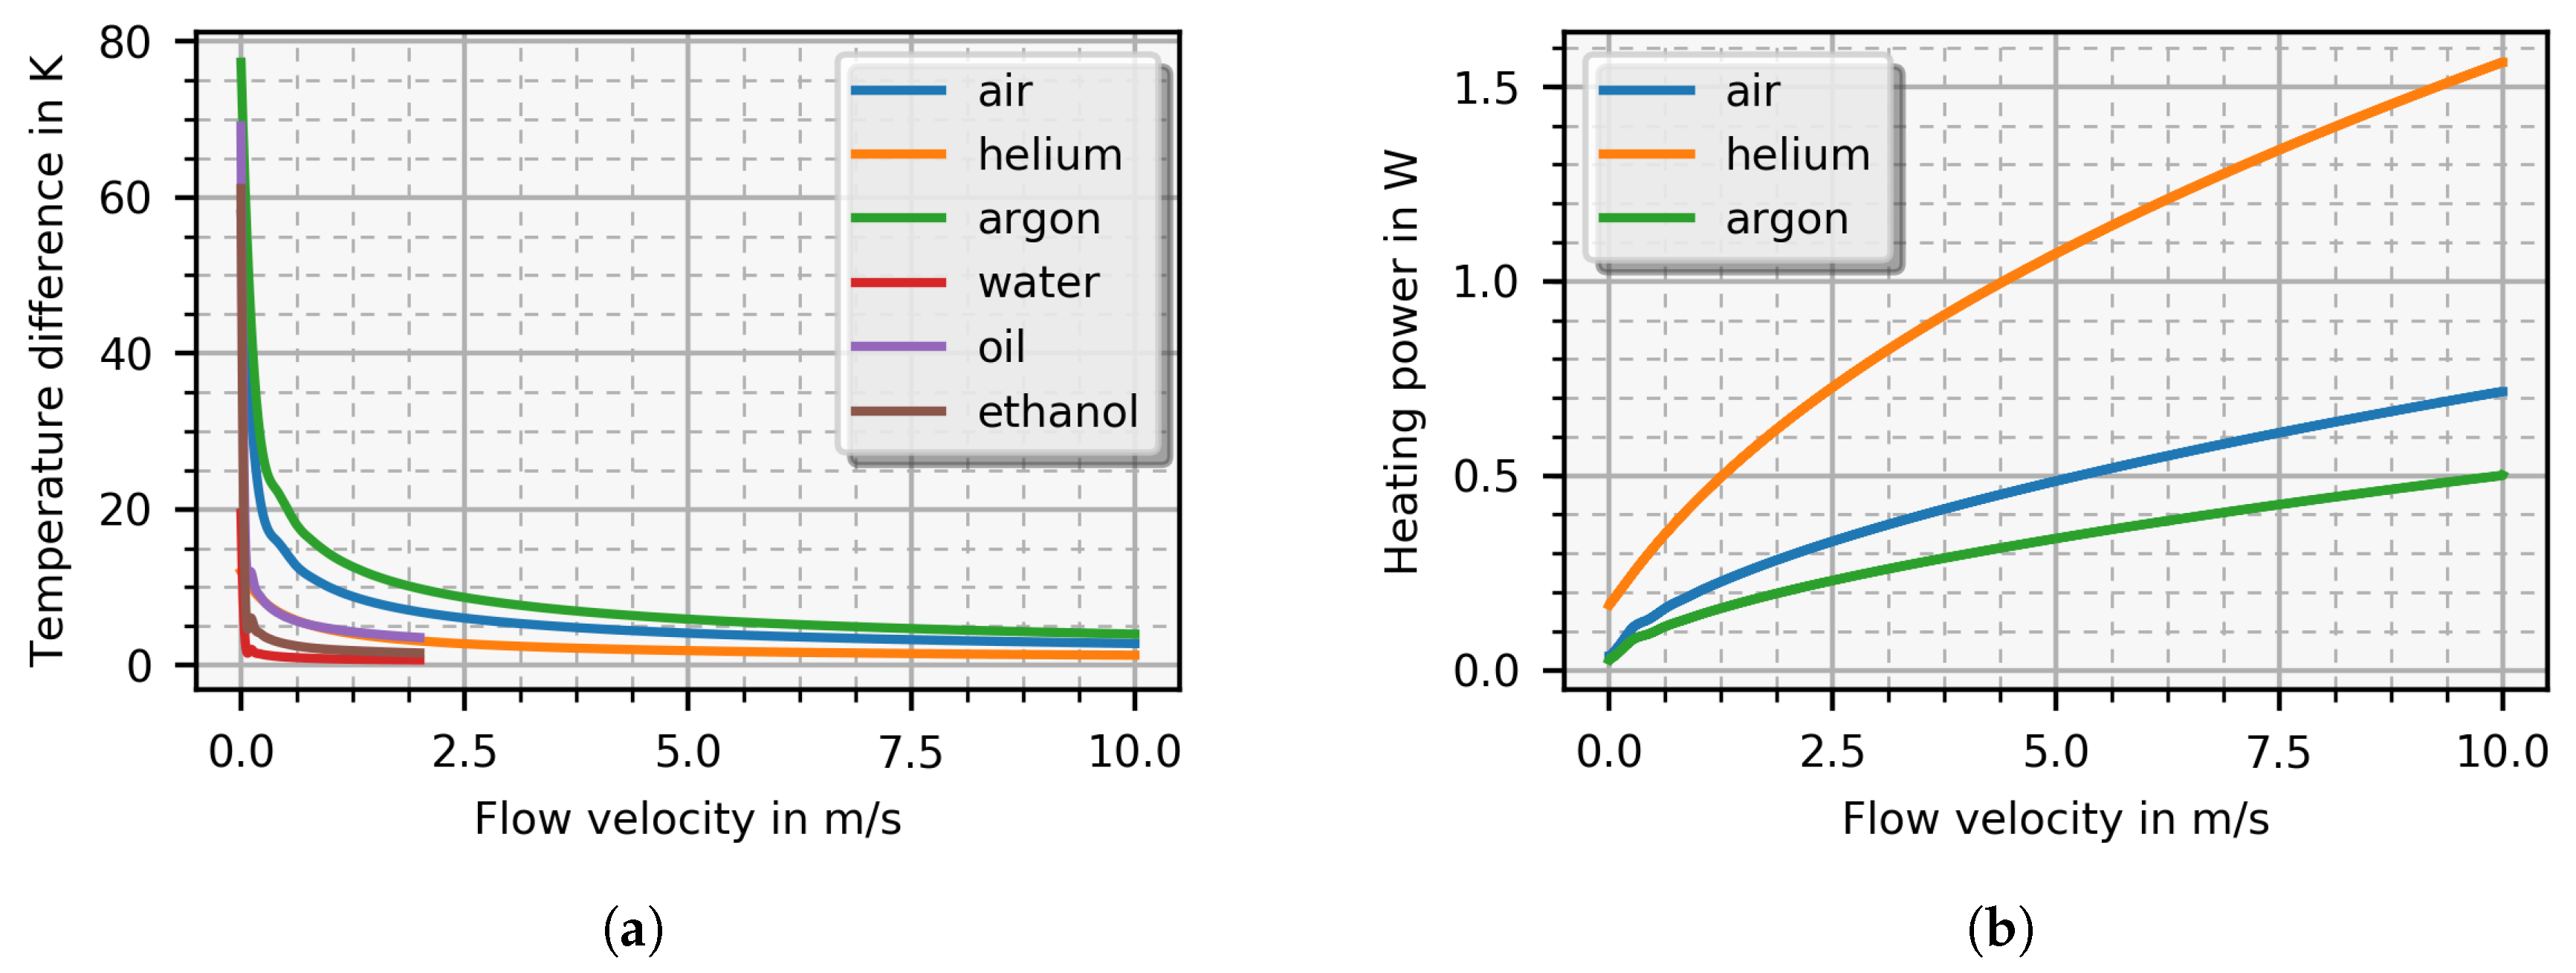
are the individual lead temperatures and their indices indicate the position on the sensor: U/D stand for up- and downstream and I/O for inner and outer position. In
Figure 3a, this temperature difference is depicted versus the mean flow velocity for each test fluid at a heating power of 1W for gases and 3W for fluids. As expected, gases reach a far higher temperature difference and can be measured over a wider velocity range. Fluids reach saturation at low velocities (<1m/s) due to their higher thermal conductivity, which leads to a higher heat dissemination.
Afterwards, a specific temperature difference is chosen and from the related contour line, the required heating power is identified.
Figure 3b shows the needed heating power of several gases versus the mean flow velocity where the temperature difference is set to 2K while
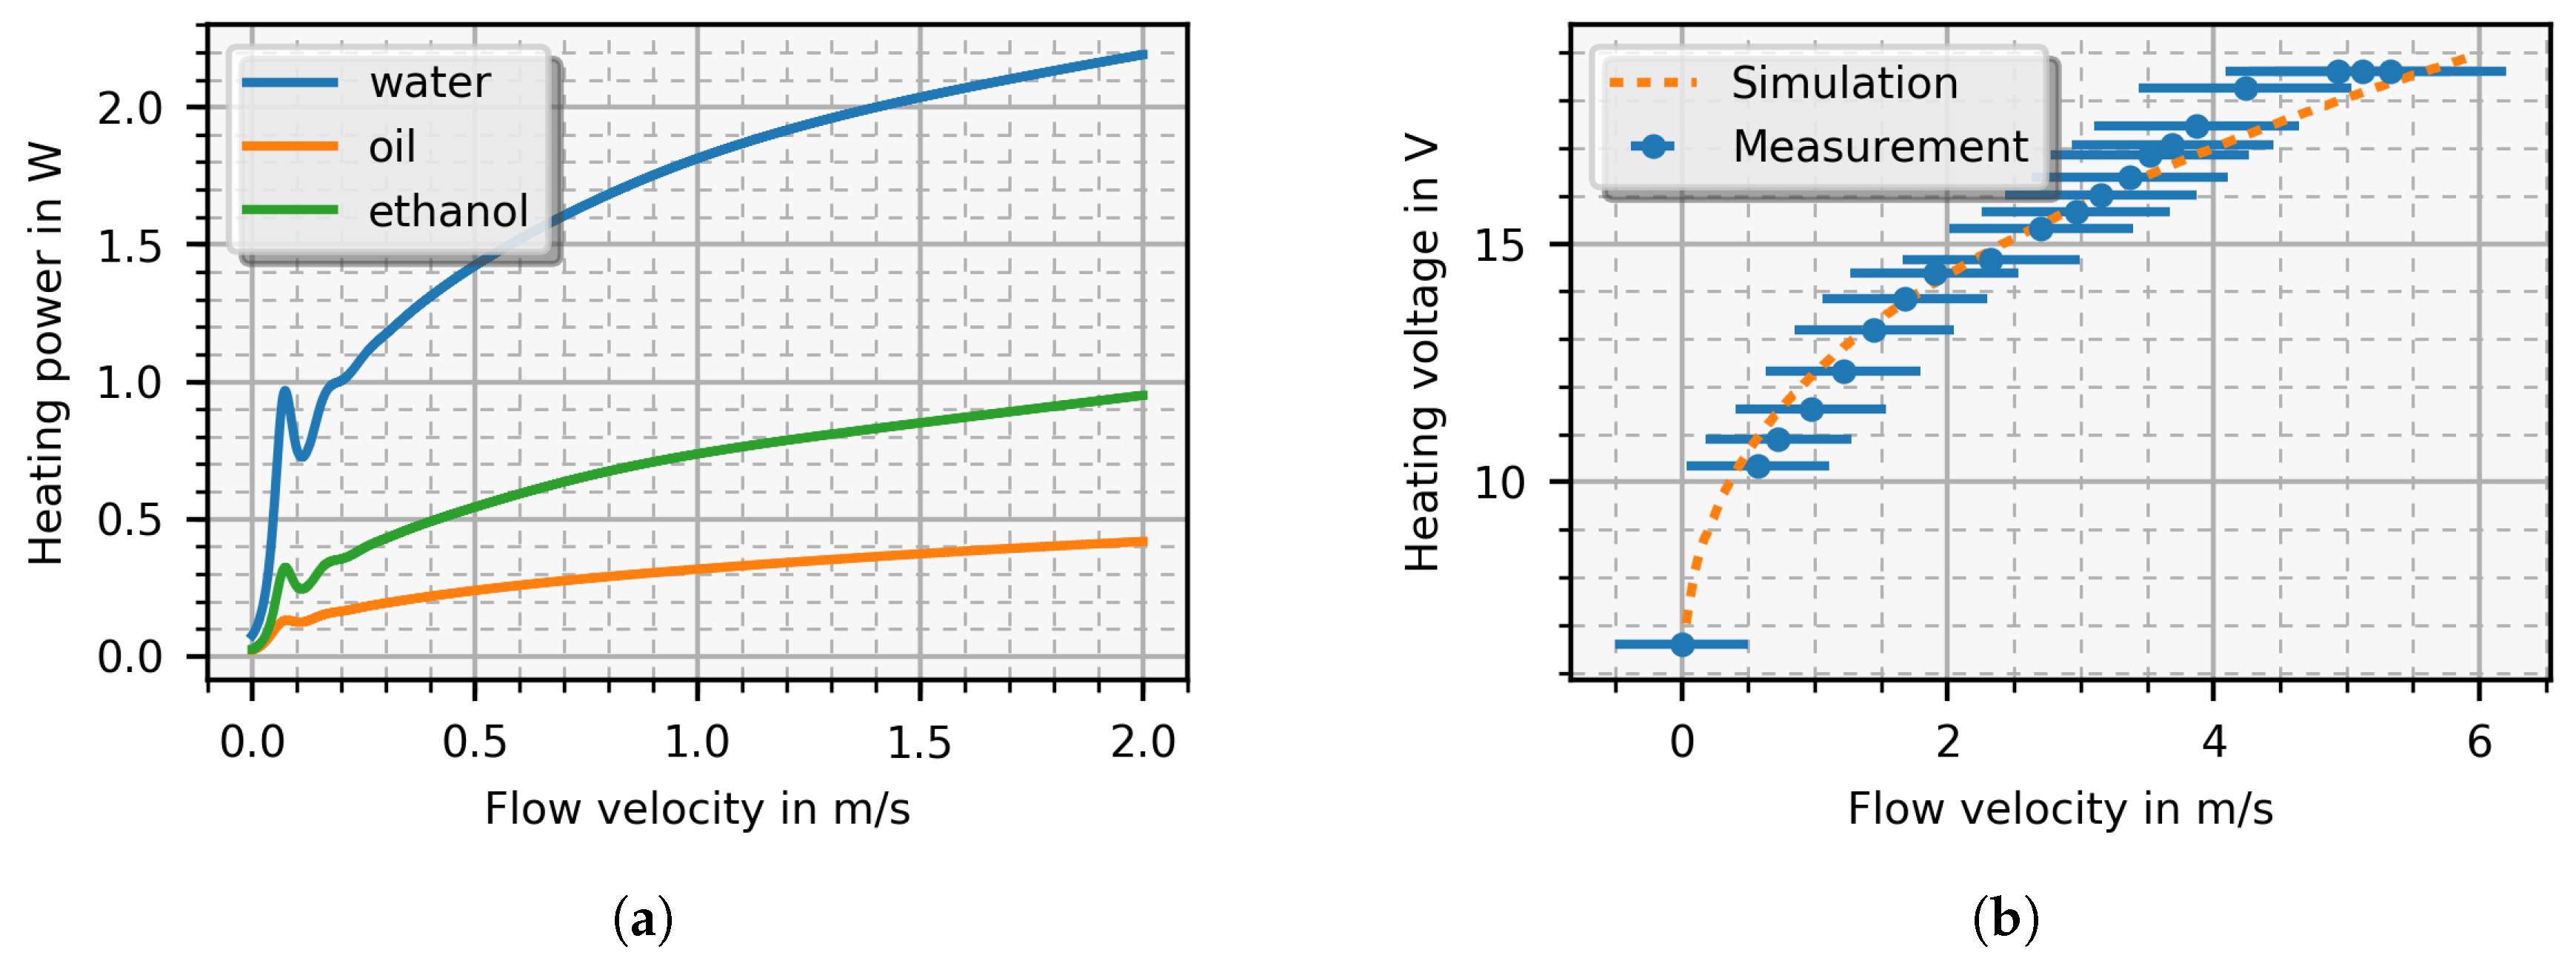
Figure 4a shows the needed heating power for several liquids where the temperature difference is set to 0.5K. In
Figure 4b, the heater voltage of the measurement result versus the mean flow velocity is depicted in comparison with a simulation result for air as test fluid. The simulated heating power is converted into the corresponding heating voltage as measured output quantity. The simulation results are in good agreement with the measurements underpinning the credibility of our modelling approach.
4. Discussion
In this paper, we presented 2D-FEM simulations of a PCB-based thermal flow sensor. Even though the sensor is designed to work in air environments, design and readout method (constant temperature mode) allow to measure the flow velocity in various fluids. With the combination of a material and auxiliary sweep, the temperatures of four sensing leads for each applied heating power, inlet flow velocity, and fluid material are simulated. In a post processing step, a temperature difference as well as the required heating power are calculated for the simulation of the constant temperature mode.
By changing the temperature difference, the sensitivity as well as the required heating power can be adjusted. A high temperature difference allows for a higher sensibility but, unfortunately, requires more heating power. At some point, the sensor will be destroyed when the heating power reaches a critical value. Therefore, a trade-off between sensitivity and heating power has to be made.
The simulation results are based on several simplifications. First and foremost, the simulation relies on a 2D-FEM model with all its benefits and drawbacks. It is assumed that the temperature field does not change in lateral direction, which holds not true in general. Moreover, the reversing loops of the copper leads at the tip of the sensor as well as the connection lines at the bottom of the sensor disturb the temperature field. A small amount of injected heat power is conducted away by the medium without contribution to the convection process. In addition, there are additional supply lines to the heater and contact resistances, which are not modelled in the simulation. As a result, more heating power is needed in reality than in the simulation. However, an extensive finite volume simulation with a
-
f turbulence model was carried out confirming the assumption of a laminar flow profile at the sensor surface [
4].
