The Impact of Pressure Management Techniques on the Water Age in an Urban Pipe Network—The Case of Kos City Network †


Civil Engineering Department, University of Thessaly, 38221 Volos, Greece
*
Author to whom correspondence should be addressed.
†
Presented at the 3rd EWaS International Conference on “Insights on the Water-Energy-Food Nexus”, Lefkada Island, Greece, 27–30 June 2018.
Proceedings 2018, 2(11), 699; https://doi.org/10.3390/proceedings2110699
Published: 31 July 2018
(This article belongs to the Proceedings of EWaS3 2018)
Abstract
:The goal of this article is to study the impact that pressure management in distribution systems has, on the quality of the supplied water in terms of its water age, using the water distribution network of Kos city, capital of Kos Island in Greece was used as the case study network. This was achieved through network simulation using the Watercad V8i software, followed by the division of the network in district metered areas (DMA) and the placement of pressure reducing valves (PRV) in the entering nodes of each DMA. Research aimed also to optimize DMAs’ borders using the water age as the optimization criterion, instead of maximum pressure reduction. Different scenarios were tested on the calibrated and validated hydraulic model of Kos city water distribution network.
1. Introduction
Pipe reliability is the ultimate goal of each water utility regarding the management of its water distribution system [1,2,3]. Nevertheless, recent research has proved that District Metered Areas (DMAs) implementation as the first step towards Water Distribution Networks (WDNs) optimization. Pressure Management (PM) measures are also widely used by water utilities in order to reduce water losses and detain the deterioration of network’s infrastructure [4,5,6,7,8,9,10,11]. Segmentation of a network provides many significant benefits, such as increased system control as well as pressure reduction in some cases. Pressure management (PM) reduces not only water losses, but also residential and commercial demands, thus water demand management is achieved within the limits of sustainable water use. This is based on the fact that part of the water being used for residential and commercial purposes is pressure dependent. Combining water losses reduction with demand reduction may greatly reduce the System’s Input Volume (SIV). In some cases, pressure management can lead to reduction that exceeds 25% of the initial SIV.
Along with the positive effects of dividing a network to DMAs and implementing PM measures, comes the possible of a negative impact to the age of the water remaining inside a DMA’s borders. Stagnant water is a major danger that can badly affect water quality. Aging also leads to higher concentrations of residual chlorine inside a DMA’s pipes, which has further side effects. The present paper studies the variations of residual chlorine and water age occurring after dividing a network into DMAs and installing Pressure Release Valves (PRVs) as a PM measure.
2. Case Study Network
Kos city water distribution network was used as the case study network, where several operating scenarios were tested utilizing its calibrated and validated hydraulic model developed [12,13]. Kos city water supply network is being supplied by 22 drillings utilizing the reserves of Vorinas spring field. Eight boreholes feed the Sfageia water tank, five feed the Yperkeimeni water tank and the Italian one. The Sfageia water tank has a capacity of 2550 m3 with a bottom elevation of +52, while the Yperkeimeni water tank has a capacity of 500 m3 and a bottom elevation of +72. The Italian water tank, along with its later extensions (Greek tanks), with a total capacity of 1800 m3 has a bottom elevation of +51.70. The waters of the Vorinas spring are led to a charge well and from there under pressure they end up in the Yperkeimeni Tank. Its overflow then feeds the Italian.
Kos network has a total length of 64,117 m, including a supply network (15,836.9 m), a distribution network (25,710.9 m) and customers’ pipes (22,569.2 m). The materials used for the entire network are mainly PVC and asbestos-cement, while less is cast iron and steel. More specifically, PVC pipes are 30,412 m long, asbestos cement 20,452 m, cast iron 12,178 m and steel 1075 m.
3. Hydraulic Model Development
The numerical model was developed in Watercad, based on the existing geometrical configuration (Figure 1) of the hydraulic system [12,13]. Three main scenarios (cases) were examined:
- 1st [No DMAs _ No PRVs] scenario: the initial state of the network before the formation of DMAs and without installing PRVs.
- 2nd [With DMAs _ No PRVs] scenario: DMAs are formed in the network by closing some pipes (pipe status = closed) to separate some sub-areas of the network.
- 3rd [With DMAs _ With PRVs] scenario: PRVs are added to the network to reduce the average pressure in each DMA. The pressure of the critical node (i.e., the node with the lowest pressure) is considered to be above the 200 kPa limit. (Same as 2 atmospheres.)
Water age, in a water distribution network refers to the time it takes for a single molecule of water to travel from the water resource to the consumer’s tap. It is now a recognized indicator of water quality. In particular, the lower the age gets the higher the water quality of the network becomes. Measurement is performed indirectly using hydraulic models. But as water travels through a distribution system, it undergoes various chemical transformations affecting its quality. These transformations depend on the velocity of water within the distribution network, the length of the pipes, and the interaction between the flow of water and the pipe. The age is also affected by the time the water stands still in the reservoirs/water tanks.
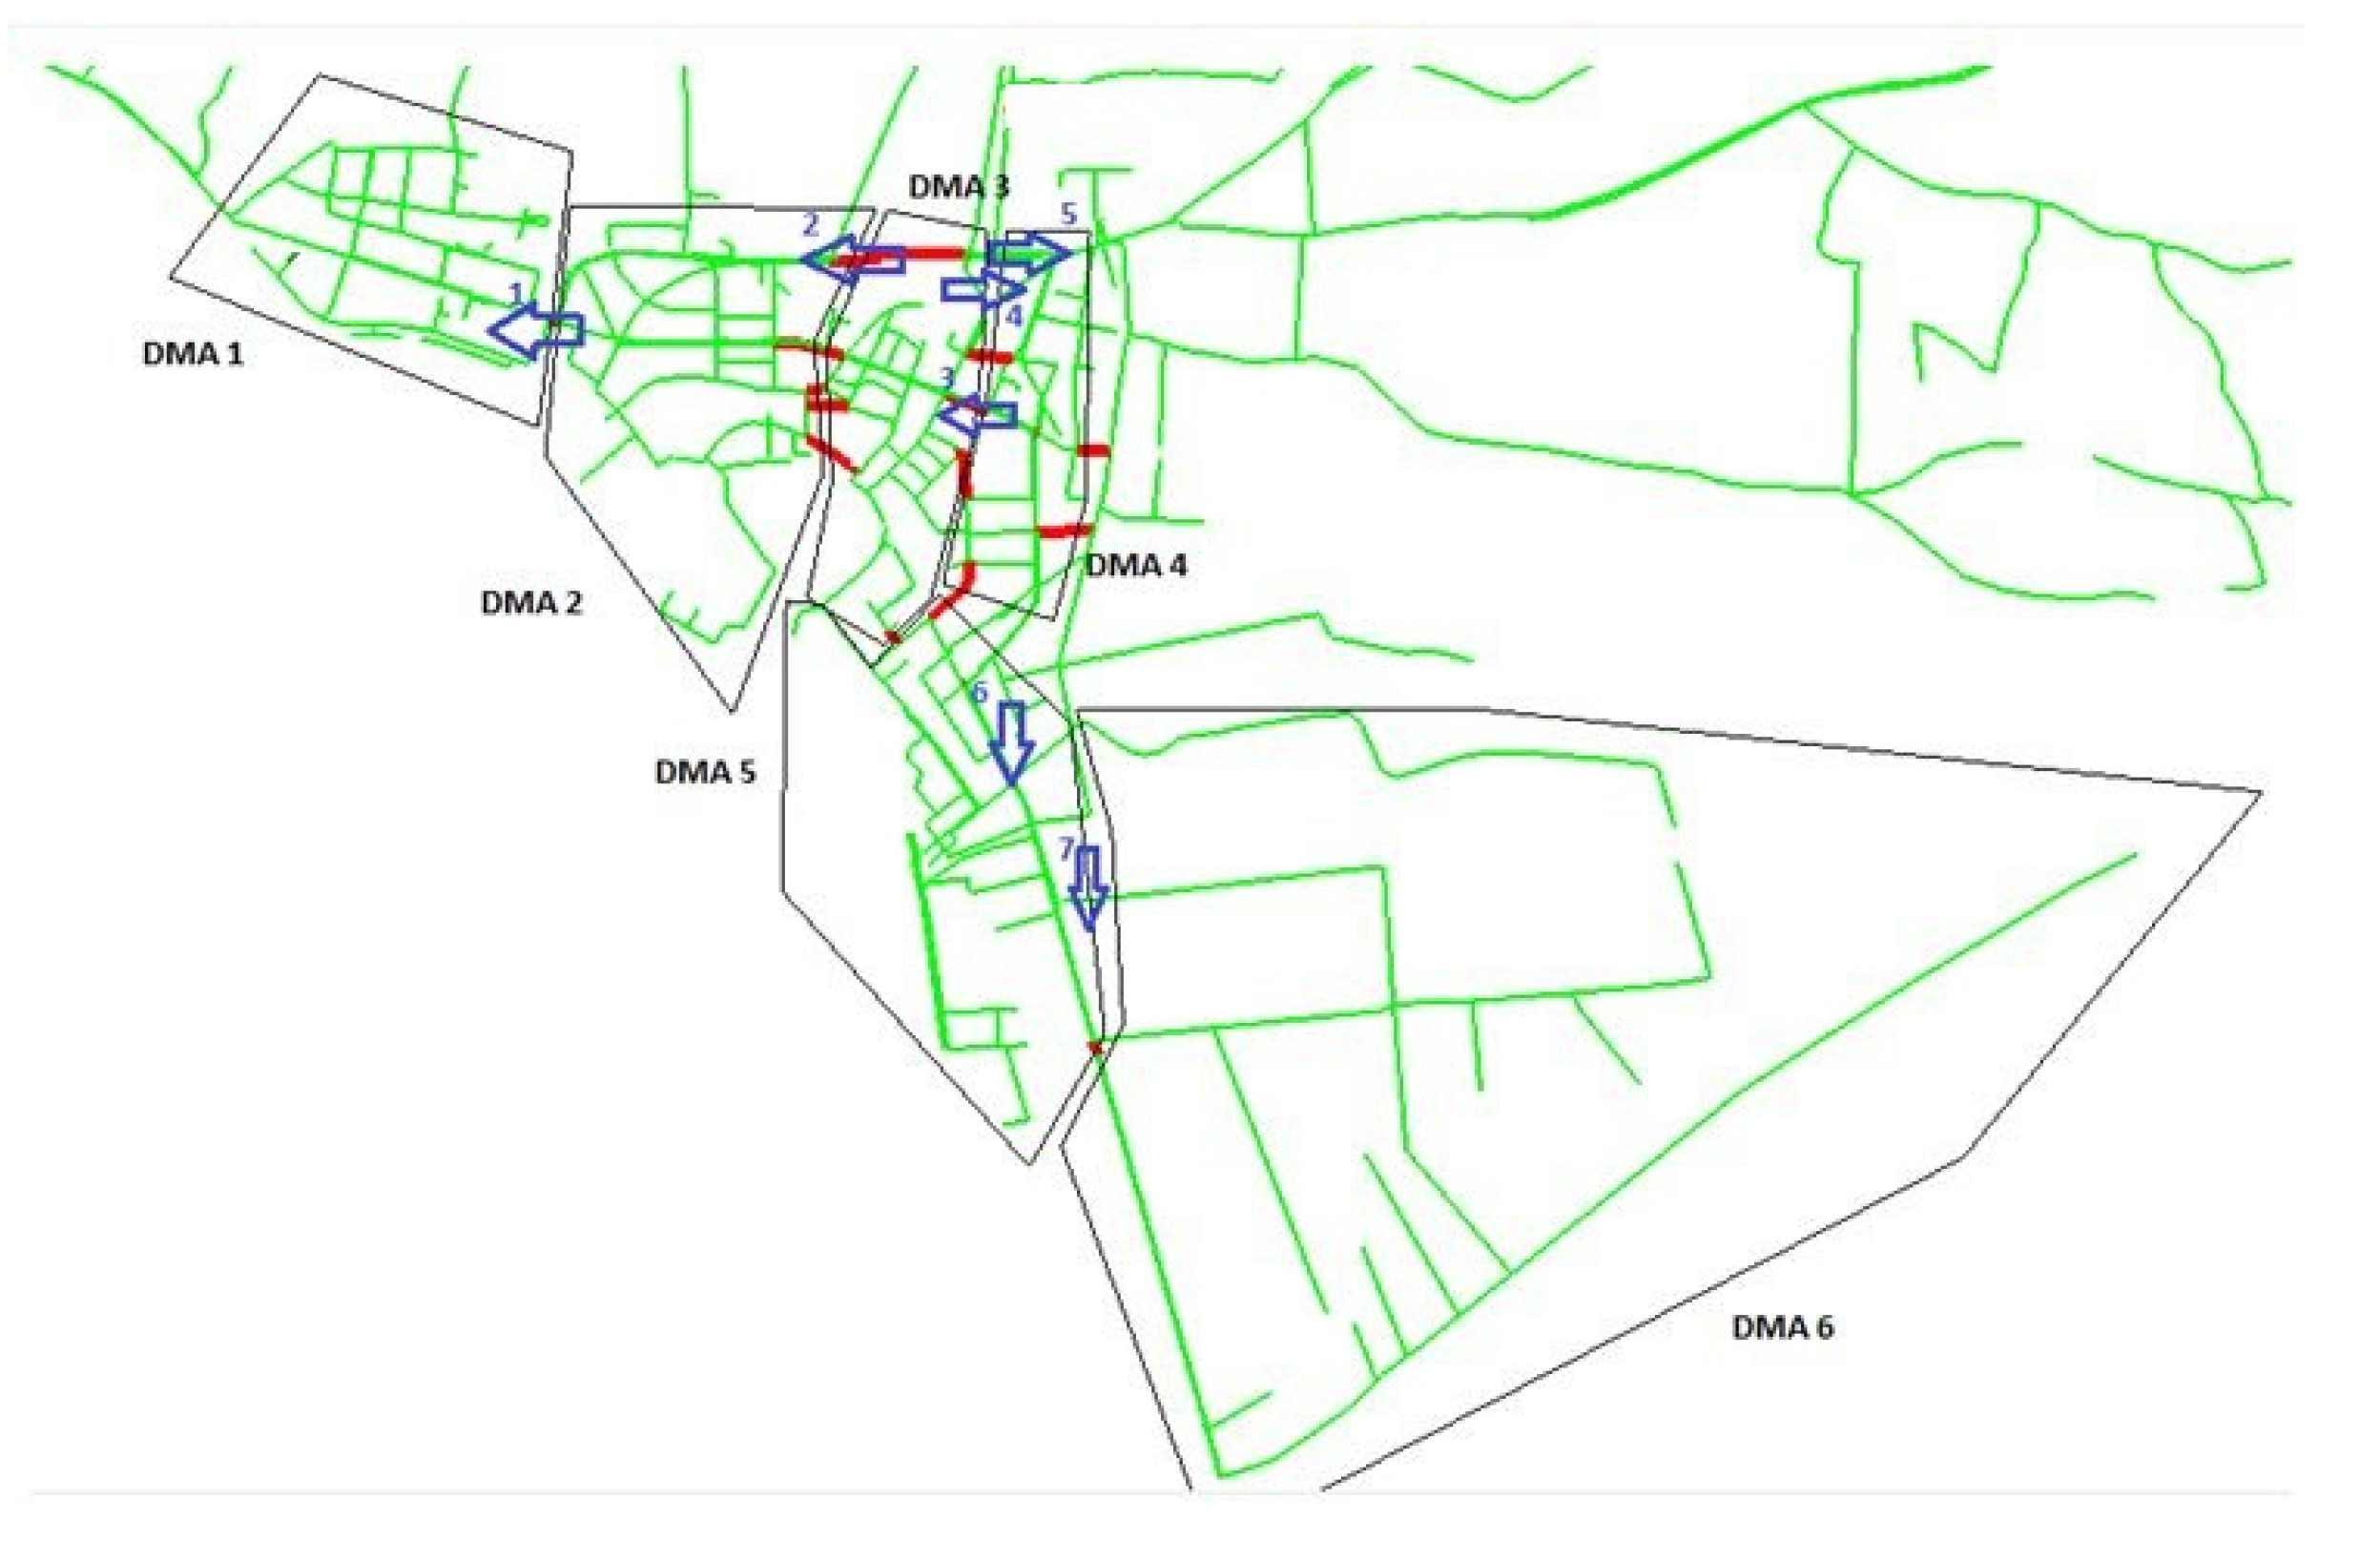
Pressure regulation plays a key role in managing water losses in water supply systems [5,6,7,8,9,10,11]. Having properly managed pressure in a network with a given demand (in pressure and supply) and having reduced its losses as much as possible, the benefits are many (longer pipe life, reduction of operating costs, reduction of total amount of chemicals due to the decrease in volume of pumped water). Figure 2 presents an indicative mapping of DMAs in Kos and their entering points/nodes.
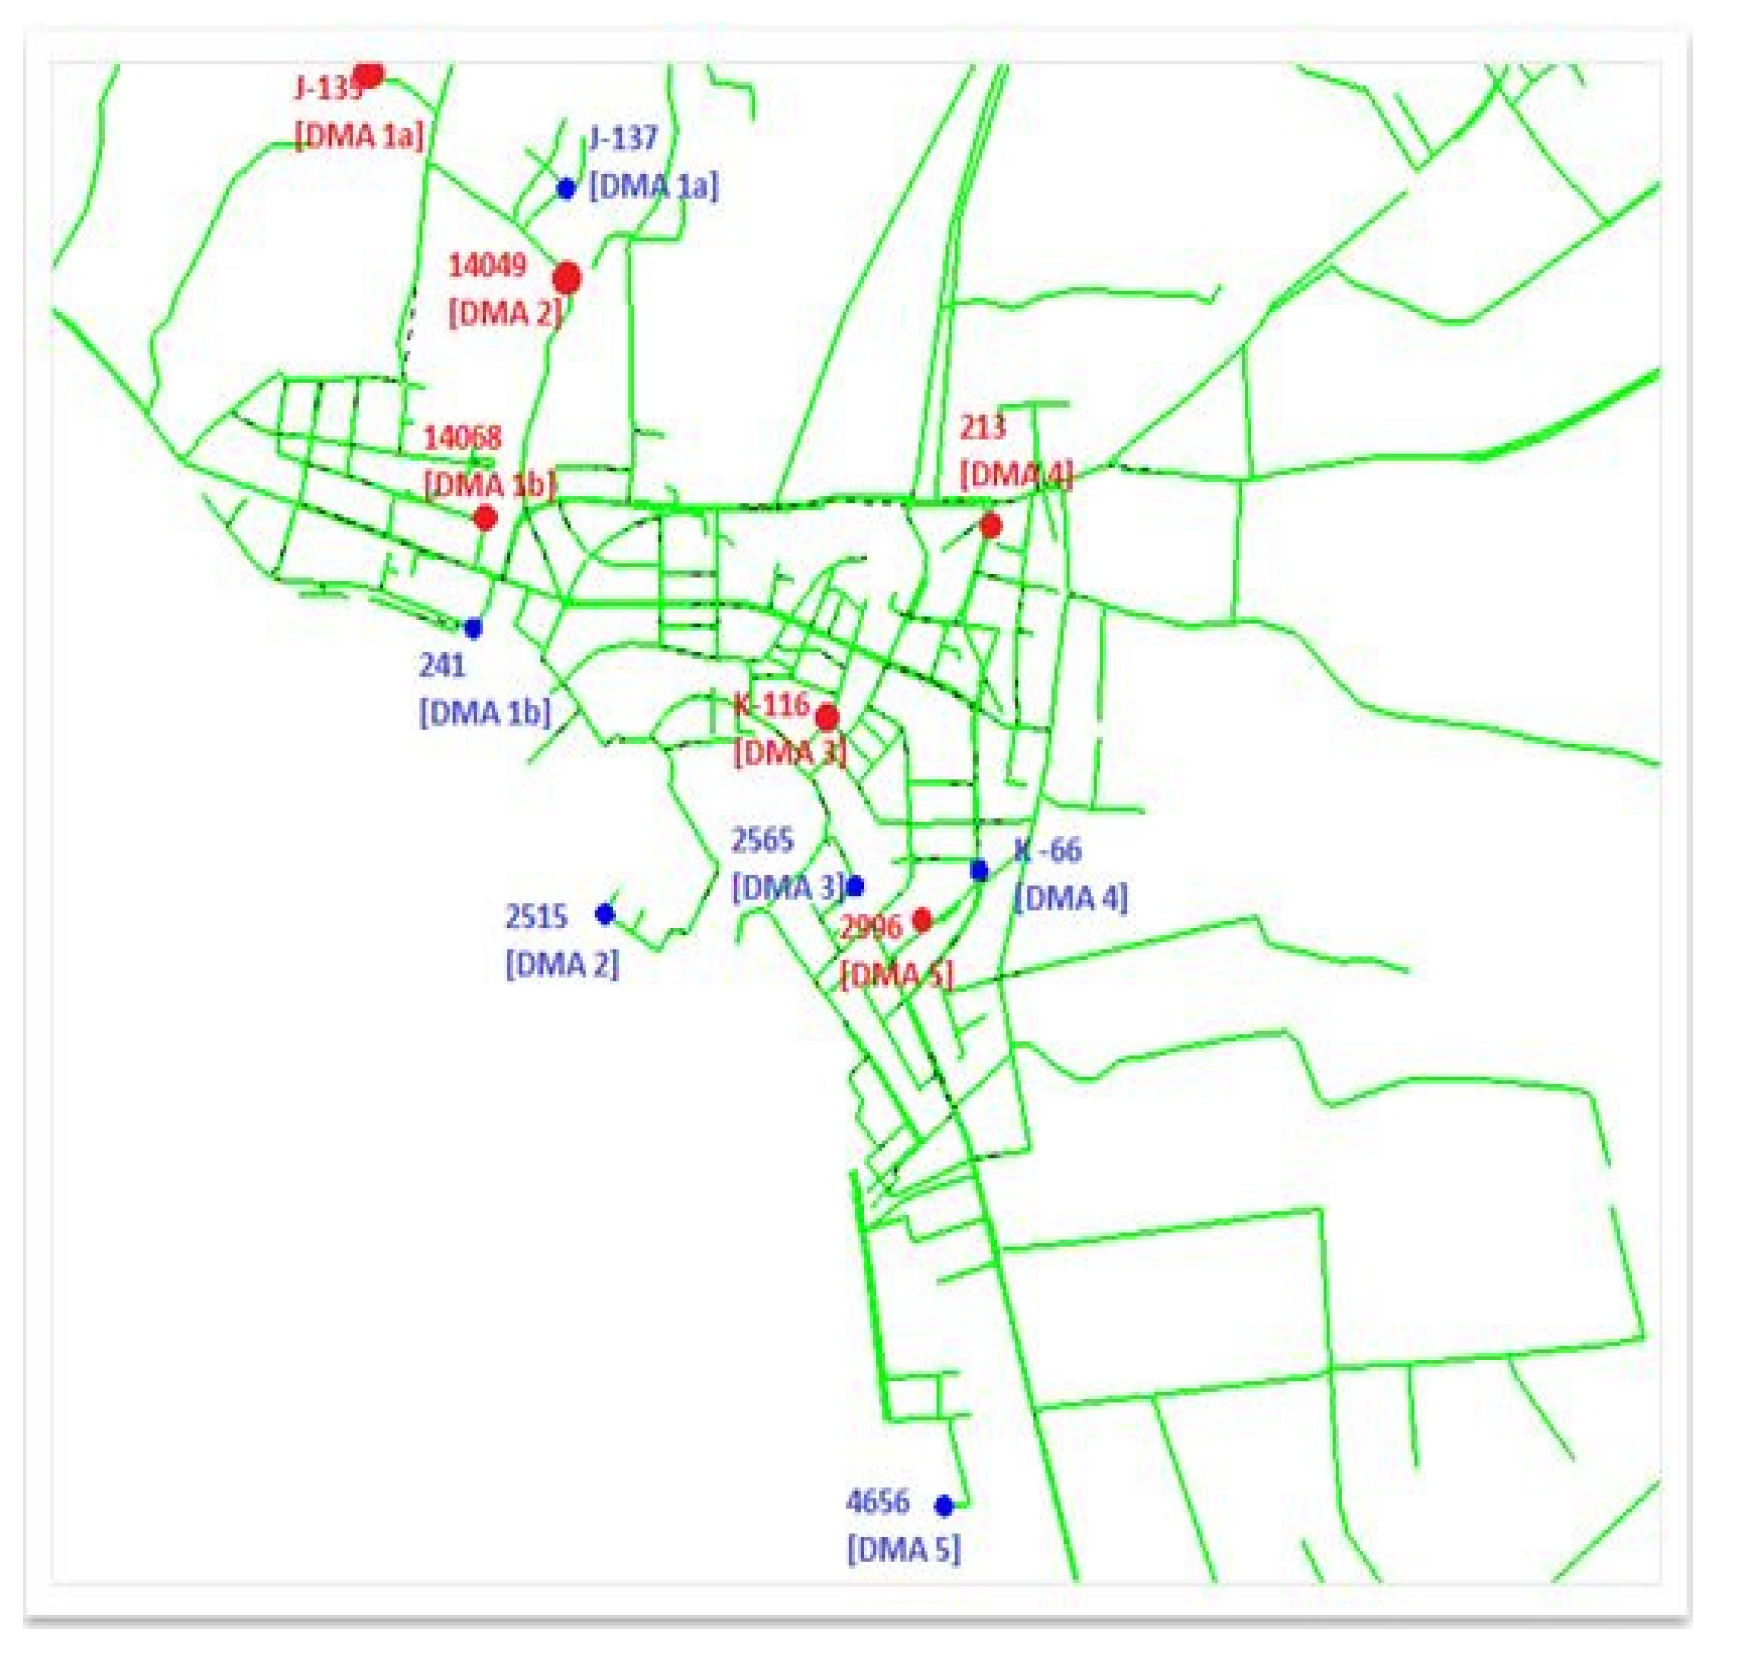
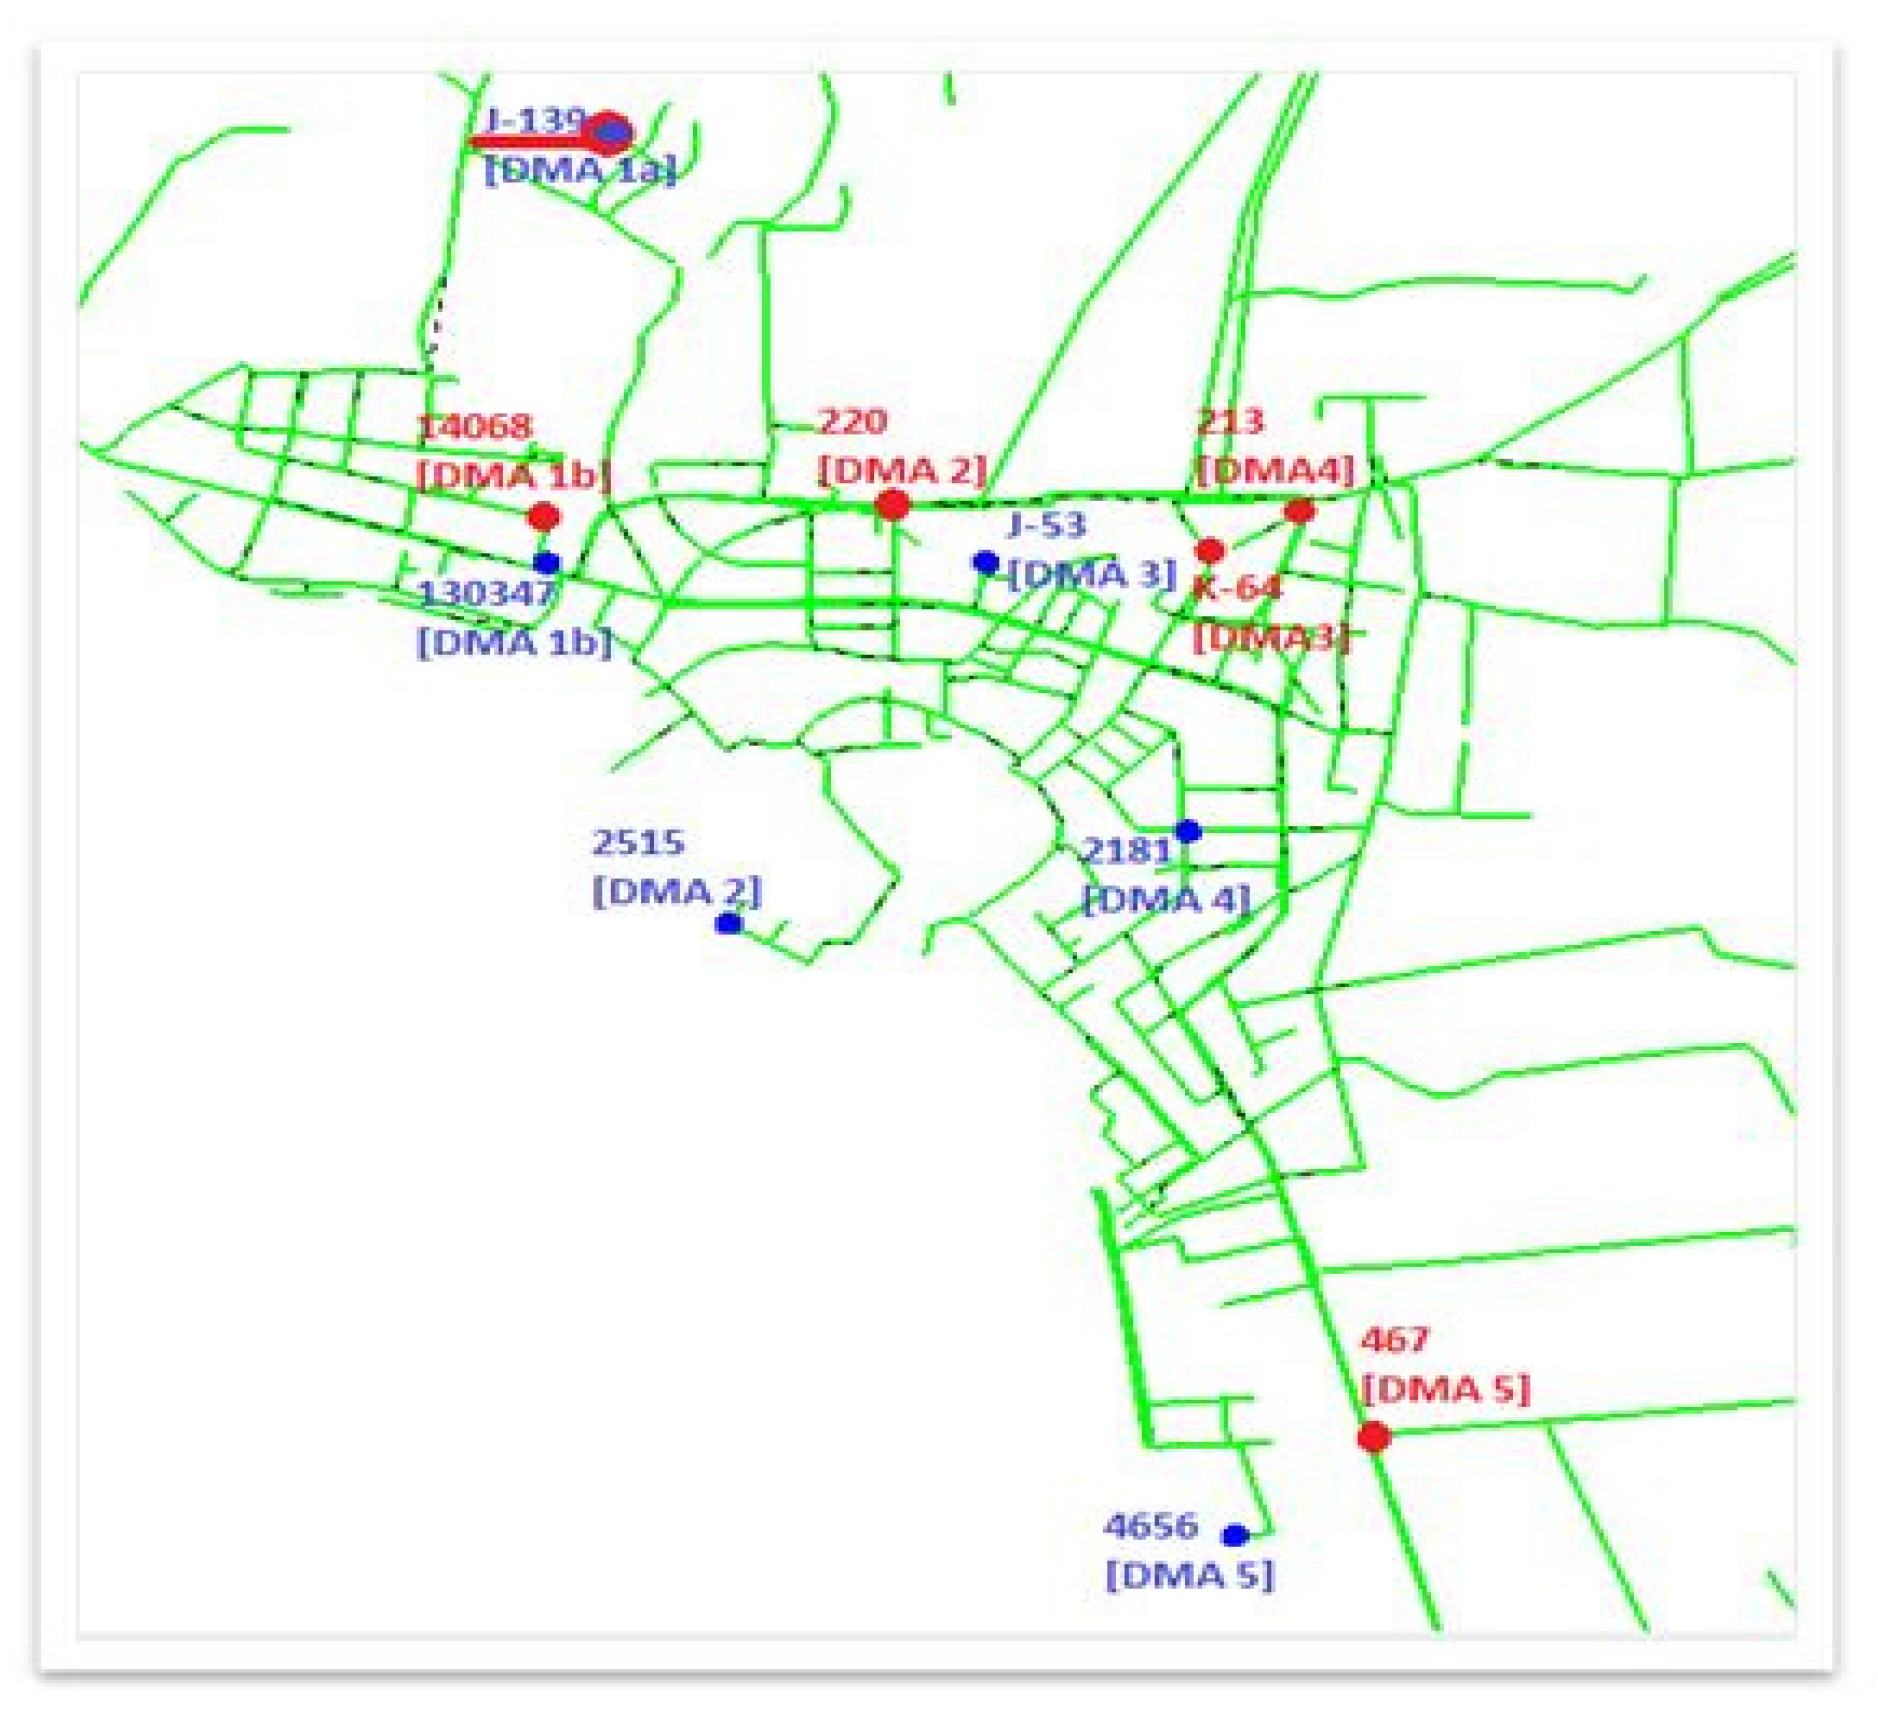
A 48 h-analysis took place for each DMA and scenario. The age-critical nodes of the network are shown in blue and the pressure-critical nodes in red for each scenario separately (Figure 3, Figure 4 and Figure 5). The configuration of critical nodes is not universal for each DMA. The application of the PRV valves results in a remarkable reduction of the mean pressure which is desired based on the network’s size and design. In DMAs 1a, 1b, 2 and 3 the critical nodes (J-139, 130347, 2515 and J-53 respectively) remain the same. Moving though from Scenario-2 to Scenario-3, there is an increase in the age of the water which, as expected, is followed by a reduction in the pressure for the particular node and a reduction in demand for water at these nodes. By installing PRVs in Scenario 3, further pressure reduction is achieved which, based on the design and the needs of the network, is ideal for its proper operation and reduction of losses. However, nodes with very low pressures are considered critical and undesirable. Figure 6 and Figure 7 present the average age per DMA (h) and consumption demand (m3) for a 48-h analysis.
The results showed that pressure reduction can be achieved installing PRVs, however the results are not the same in terms of water age. In particular, the mean age for Scenario 2 was 13.44 h while in Scenario 3 the water age after the installation of the PRVs was set at 15.54 h. Demand fluctuations have a significant impact on the operation of the water distribution system and the determination of the age of the water, which in turn affects the quality of the water. Demand reduction ultimately leads to an increase in the age of the water supplied. Indeed, in the present example, the total demand for water at the nodes after the installation of the PRVs was decreased by about 1176 m3 over a period of 48 h.
4. Water Age Adjustment after Pressure Regulation through the PRVs Installed
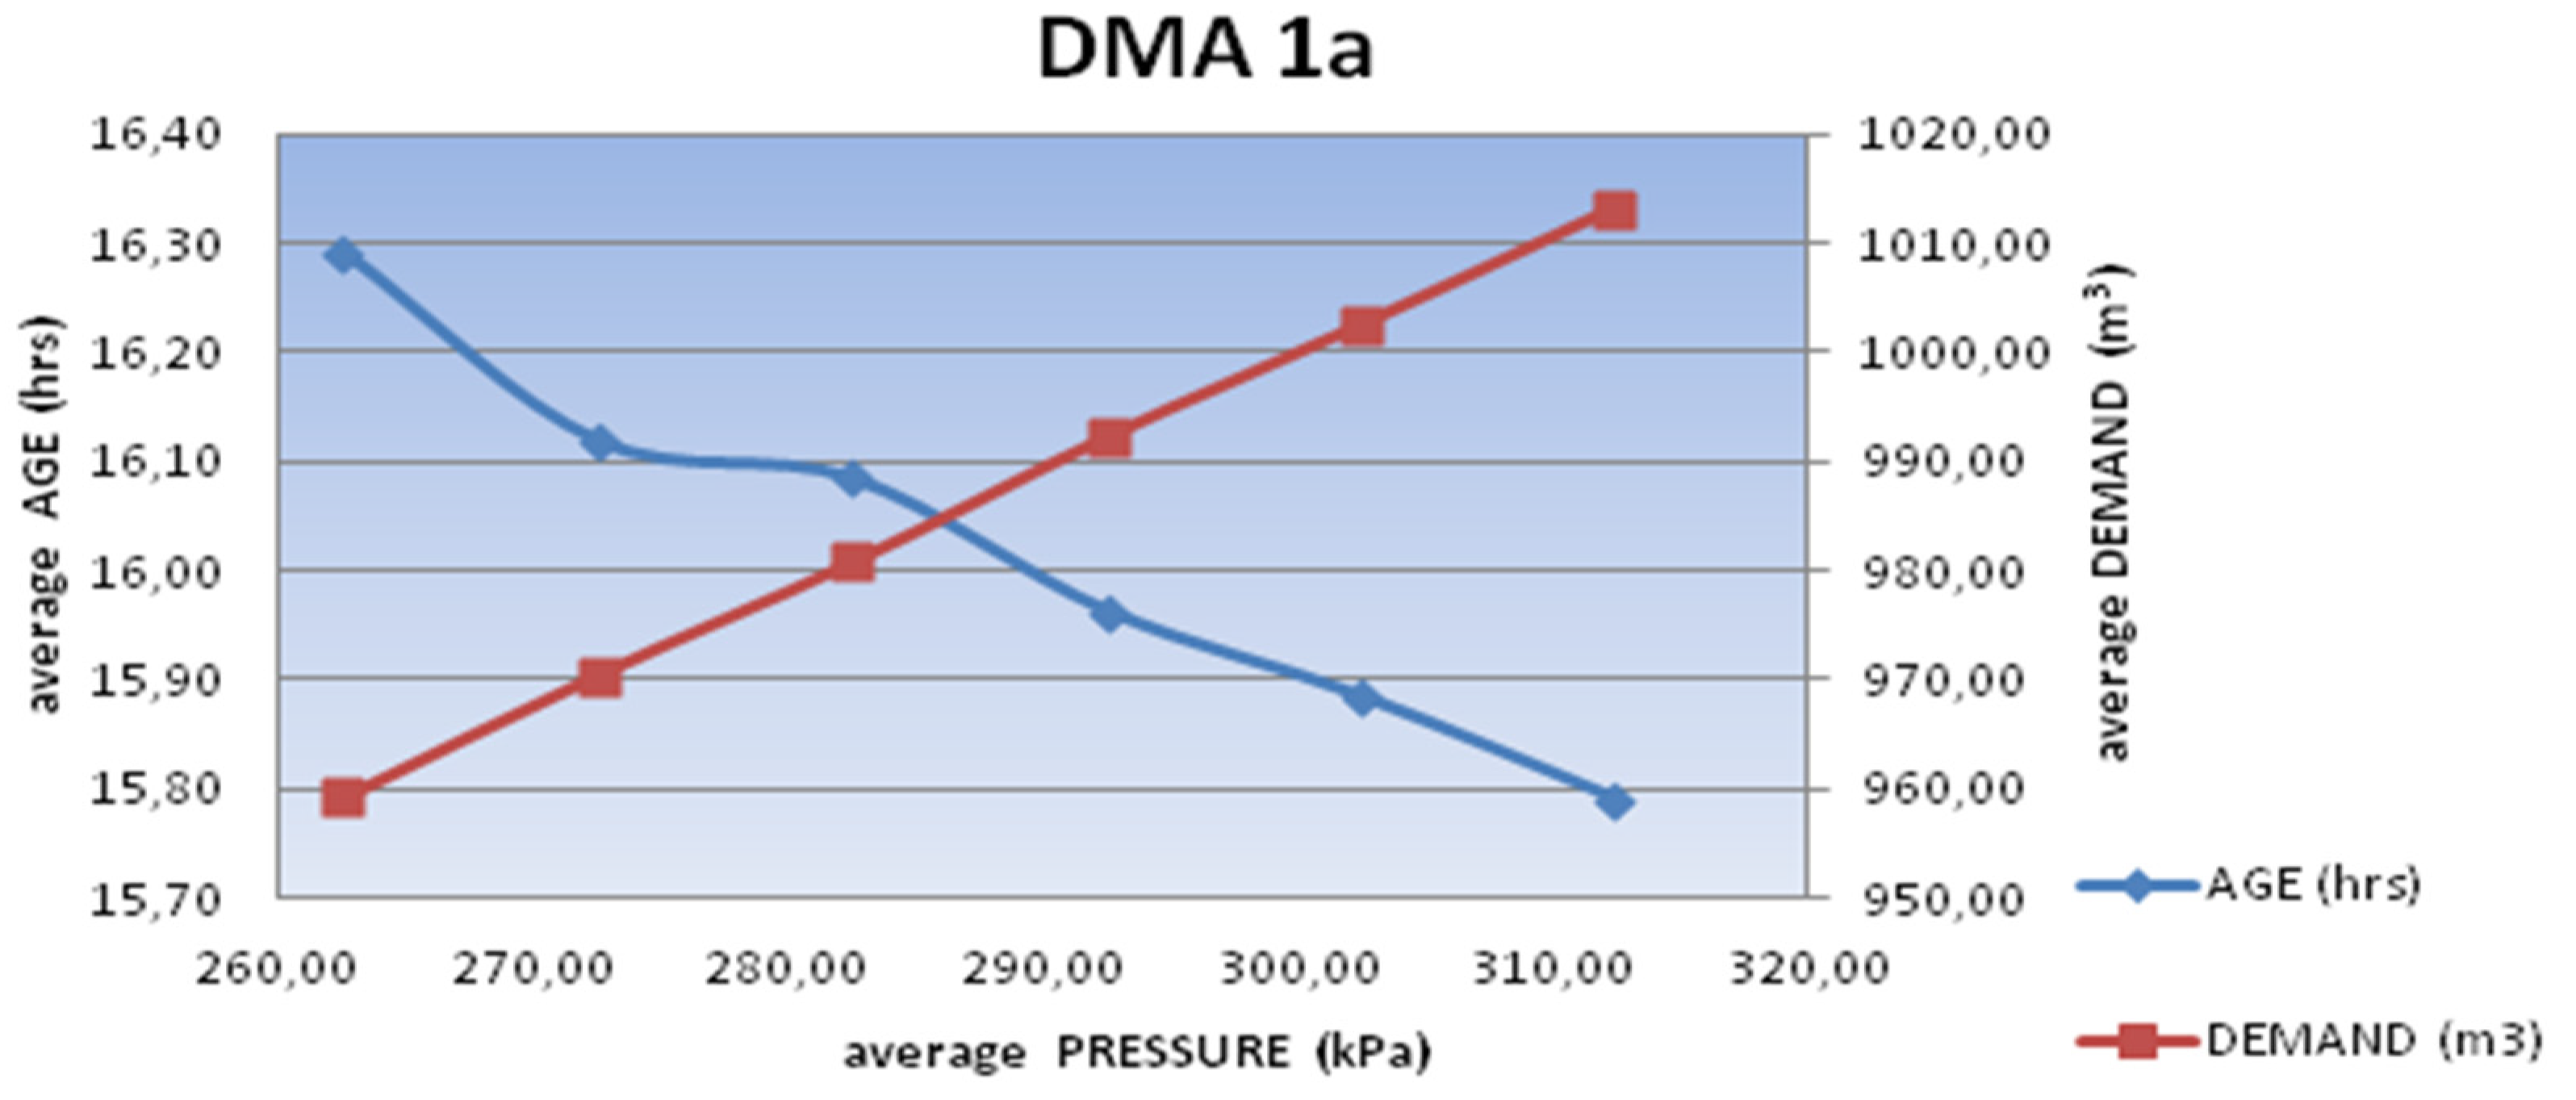
For each DMA the downstream pressures of the PRVs (Scenario 3) have been modeled (Table 1). Case 1 includes the above mentioned initial PRV pressure settings. However, in order to study how the age of water changes for different pressure values, five other scenarios/versions were studied, each corresponding to an increase in PRVs pressure adjustment by 10, 20, 30, 40 and 50 KPa (Cases 2, 3, 4, 5 and 6 respectively). This setting resulted in a change of the network pressure as a whole and consequently of the demand and age of the water being supplied. Although the increase in the water pressure was expected to trigger a decrease in the age of water, the main question remains regarding the optimal combination of water pressure decrease and water age increase limiting at the same time the volume of real water losses. Figure 8 and Figure 9 present the change in average pressure, average age and demand for each of the six cases studied for DMA 1a and DMA 2.
In each DMA the best solution was between Case 3 and Case 4. In each DMA the increase in the regulation of the PRVs in the network causes a continuous reduction in the age of the water. Nevertheless, at the same time there is an increasing demand for water at the nodes due to the increasing losses. This was something not desirable. However, if the allowable pressure values of the network PRVs were adjusted at intermediate values of Case 3 and 4, the water age is reduced so as to meet the limits of the allowable water losses values.
5. Alternative Cases of Demarcation of DMAs to Reduce Age in the Network
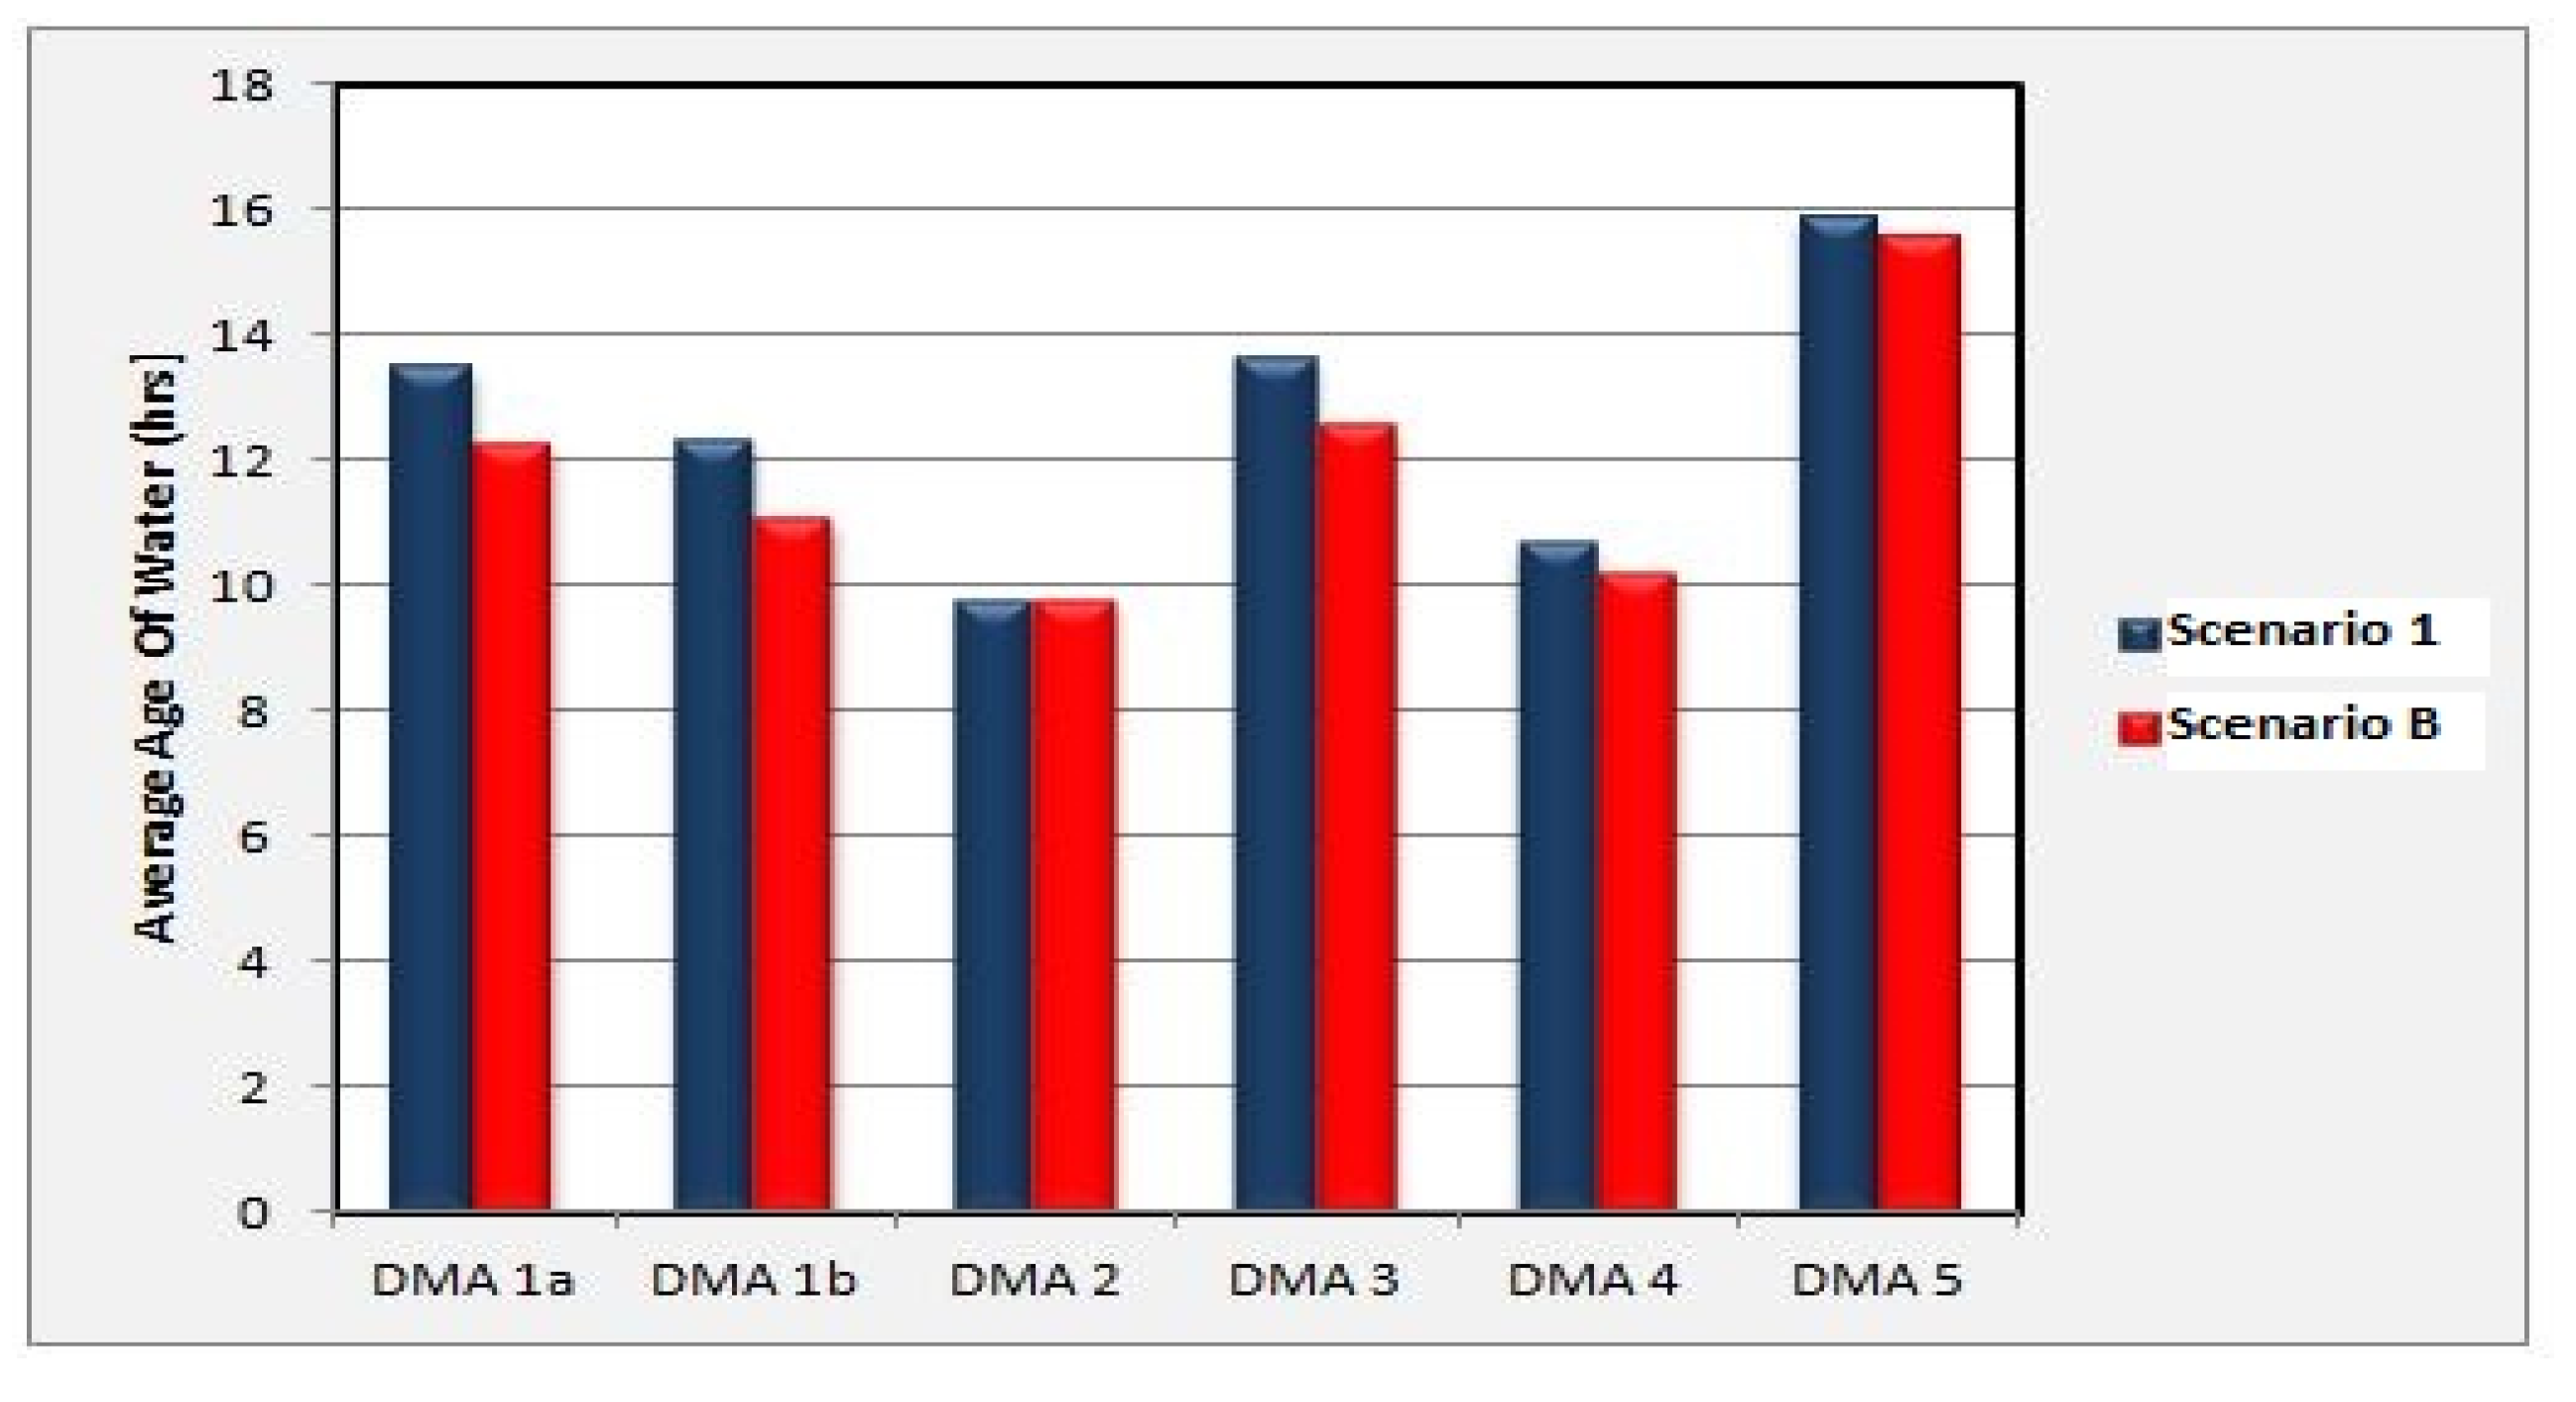
Different cases of network pipes selected to be closed were examined in order to reduce the age of the water. The pipes selected to close were the ones with large diameters provided that they are not ending pipes and do not cause negative pressures, nor pressures below 200 kPa (29 psi). Finally, in order to further reduce the age of the water, the network was divided into 4 DMAs [Scenario B] (Figure 10). Figure 11, Figure 12 and Figure 13 present the comparable results for the average age and pressure of water for Scenarios 1, 2 and B.
It is therefore noticed that water age is finally improved following a reduction of 4 to 10%. At the same time, as expected, the reduction of the water age is linked to an increase in water pressure, but this increase ranges from 1 to 4%. While in the previous scenarios the pressure values of the individual DMAs were between 450 and 500 kPa with the application of PRVs the pressure is formed from 220 to 290 kPa whereby the total volume of losses for Scenario B is reduced.
6. Conclusions
The current article presents the hydraulic simulation model of Kos city water distribution network (developed in Watercad V8i) divided in district metered areas (DMA), where pressure reducing valves (PRV) were placed in the entering nodes of each DMA. Three main scenarios were tested: (1) initial state of the network before the formation of DMAs and without installing pressure PRVs; (2) DMAs are formed in the network by closing some pipes (pipe status = closed) to separate some sub-areas of the network; (3) PRVs are added to the network to reduce the average pressure of water in each DMA. The simulations allow the assessment of water quality in the studied cases, and can help decision makers that manage the system, to choose wittingly the operation mode in terms of water age, pressure, losses and actual consumption. The present study investigates the variation of residual chlorine and water age following the division of a network in DMAs and the implementation of Pressure Management measures like the installation of PRVs. Research involves the difference between optimizing DMAs’ borders according to shorter water age instead of maximum pressure reduction. Further work is necessary to be done in order to assess the optimal number of PRVs required for each DMA and identify the most appropriate point for their placement aiming at both reducing the age of the water as well as the network losses. For this purpose, it is proposed to look for the best solutions of this study using genetic algorithms and develop the programming section to connect the Watercad and the Matlab environment.
References
- Tsitsifli, S.; Kanakoudis, V. Predicting the behavior of a network pipe using the “critical z-score” as its performance indicator. Desalination 2010, 1, 258–265. [Google Scholar] [CrossRef]
- Tsitsifli, S.; Kanakoudis, V.; Bakouros, I. Pipe networks Risk Assessment based on Survival Analysis. Water Resour. Manag. 2011, 14, 3729–3746. [Google Scholar] [CrossRef]
- Kanakoudis, V.; Tsitsifli, S. Water pipe network reliability assessment using the DAC method. Desalin. Water Treat. 2011, 1–3, 97–106. [Google Scholar] [CrossRef]
- Patelis, M.; Kanakoudis, V.; Gonelas, K. Combining pressure management and energy recovery benefits in a water distribution system installing PATs. Water Suppl. Res. Technol. AQUA 2017, 66, 520–527. [Google Scholar] [CrossRef]
- Kanakoudis, V.; Gonelas, K. Applying pressure management to reduce water losses in two Greek cities’ Water Distribution Systems: Expectations, problems, results and revisions. Procedia Eng. 2014, 89, 318–325. [Google Scholar] [CrossRef]
- Kanakoudis, V.; Gonelas, K. The joint effect of water price changes and pressure management, at the economic annual real losses level, on the system input volume of a water distribution system. Water Sci. Technol. Water Suppl. 2015, 15, 1069–1078. [Google Scholar] [CrossRef]
- Kanakoudis, V.; Gonelas, K. Non-revenue water reduction through pressure management in Kozani’s water distribution network: From theory to practice. Desalin. Water Treat. 2016, 57, 11436–11446. [Google Scholar] [CrossRef]
- Kanakoudis, V.; Gonelas, K. Assessing the results of a virtual pressure management project applied in Kos Town water distribution network. Desalin. Water Treat. 2016, 57, 11472–11483. [Google Scholar] [CrossRef]
- Gonelas, K.; Kanakoudis, V. Reaching Economic Leakage Level through Pressure Management. Water Sci. Technol. Water Suppl. 2016, 16, 756–765. [Google Scholar] [CrossRef]
- Kanakoudis, V.; Gonelas, K. Analysis and calculation of the short and long run economic leakage level in a water distribution system. Water Util. 2016, 12, 57–66. [Google Scholar]
- Kanakoudis, V.; Tsitsifli, S.; Demetriou, D. Applying an integrated methodology toward non-revenue water reduction: The case of Nicosia, Cyprus. Desalin. Water Treat. 2016, 57, 11447–11461. [Google Scholar] [CrossRef]
- Kanakoudis, V.; Gonelas, K. Properly allocating the urban waters meters’ readings to the nodes of a water pipe network simulation model in a developing water utility. Desalin. Water Treat. 2015, 54, 2190–2203. [Google Scholar] [CrossRef]
- Kanakoudis, V.; Gonelas, K. Accurate water demand spatial allocation for water networks modeling using a new approach”. Urban Water 2015, 12, 362–279. [Google Scholar] [CrossRef]
Figure 1.
Water distribution network of Kos in CAD format.
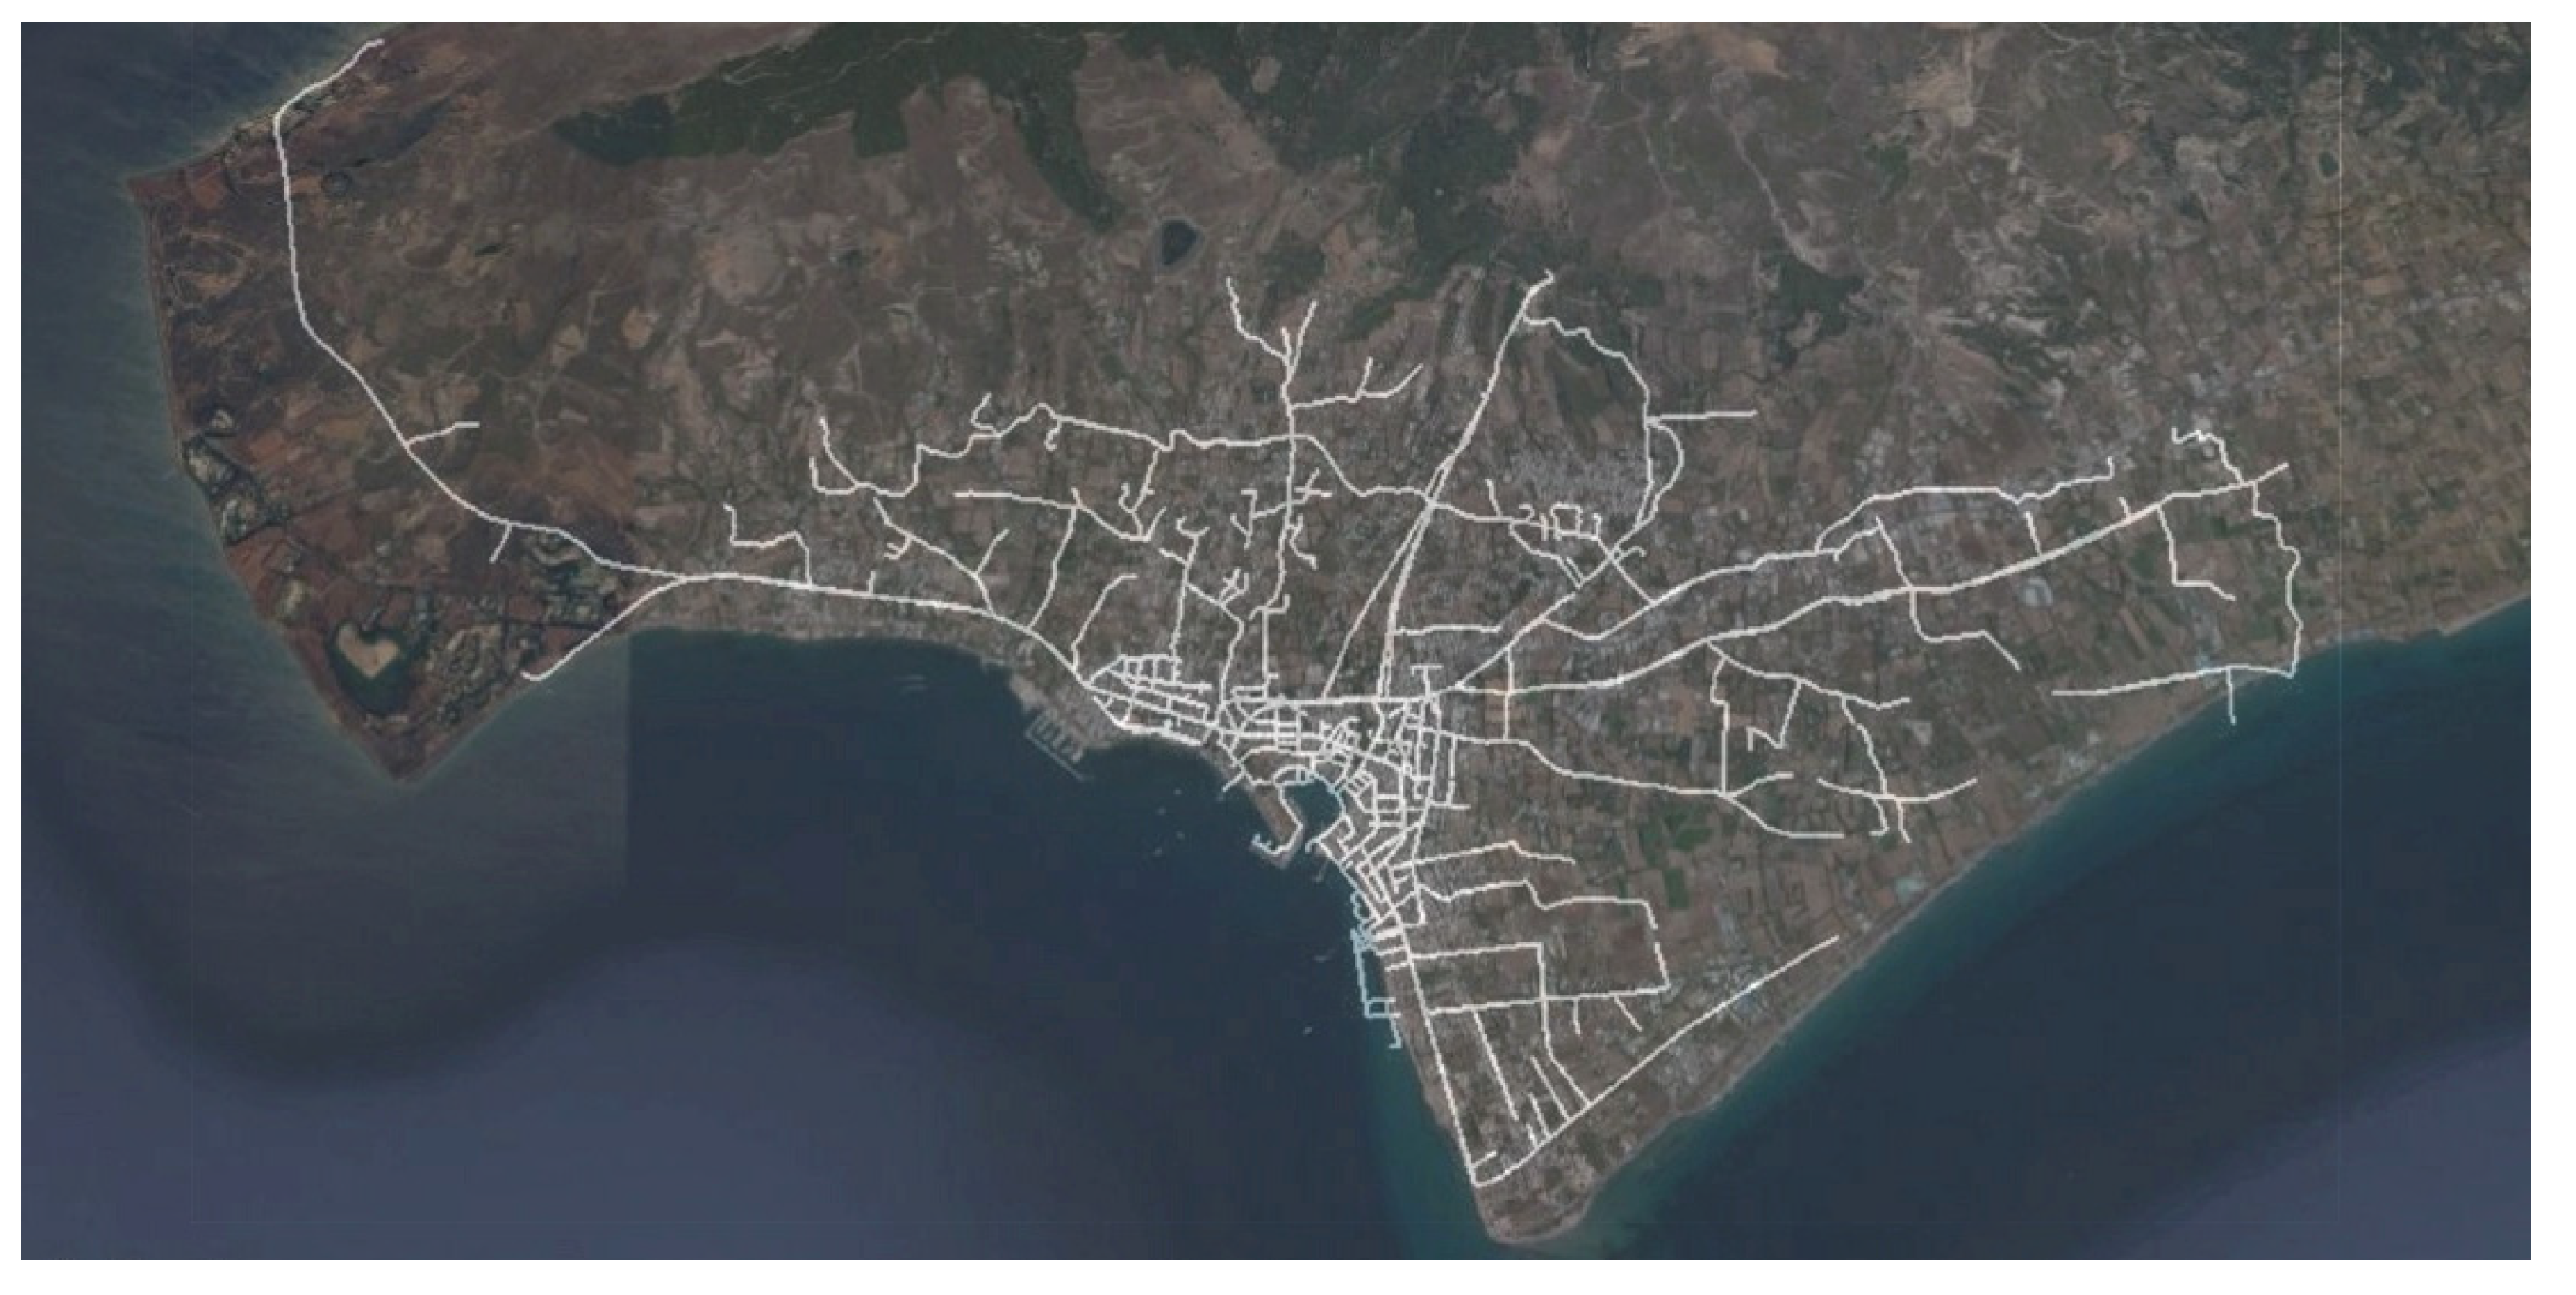
Figure 2.
Dividing the case study network in DMAs.
Figure 3.
Scenario 1_Age critical nodes.
Figure 4.
Scenario 2_Age critical nodes.

Figure 5.
Scenario 3_Age critical nodes.
Figure 6.
Average age of water for each scenario studied.

Figure 7.
Consumption Demand for each scenario studied.

Figure 8.
Average pressure, average age and demand for each of the six cases for DMA 1a.
Figure 9.
Average pressure, average age and demand for each of the six cases for DMA 2.
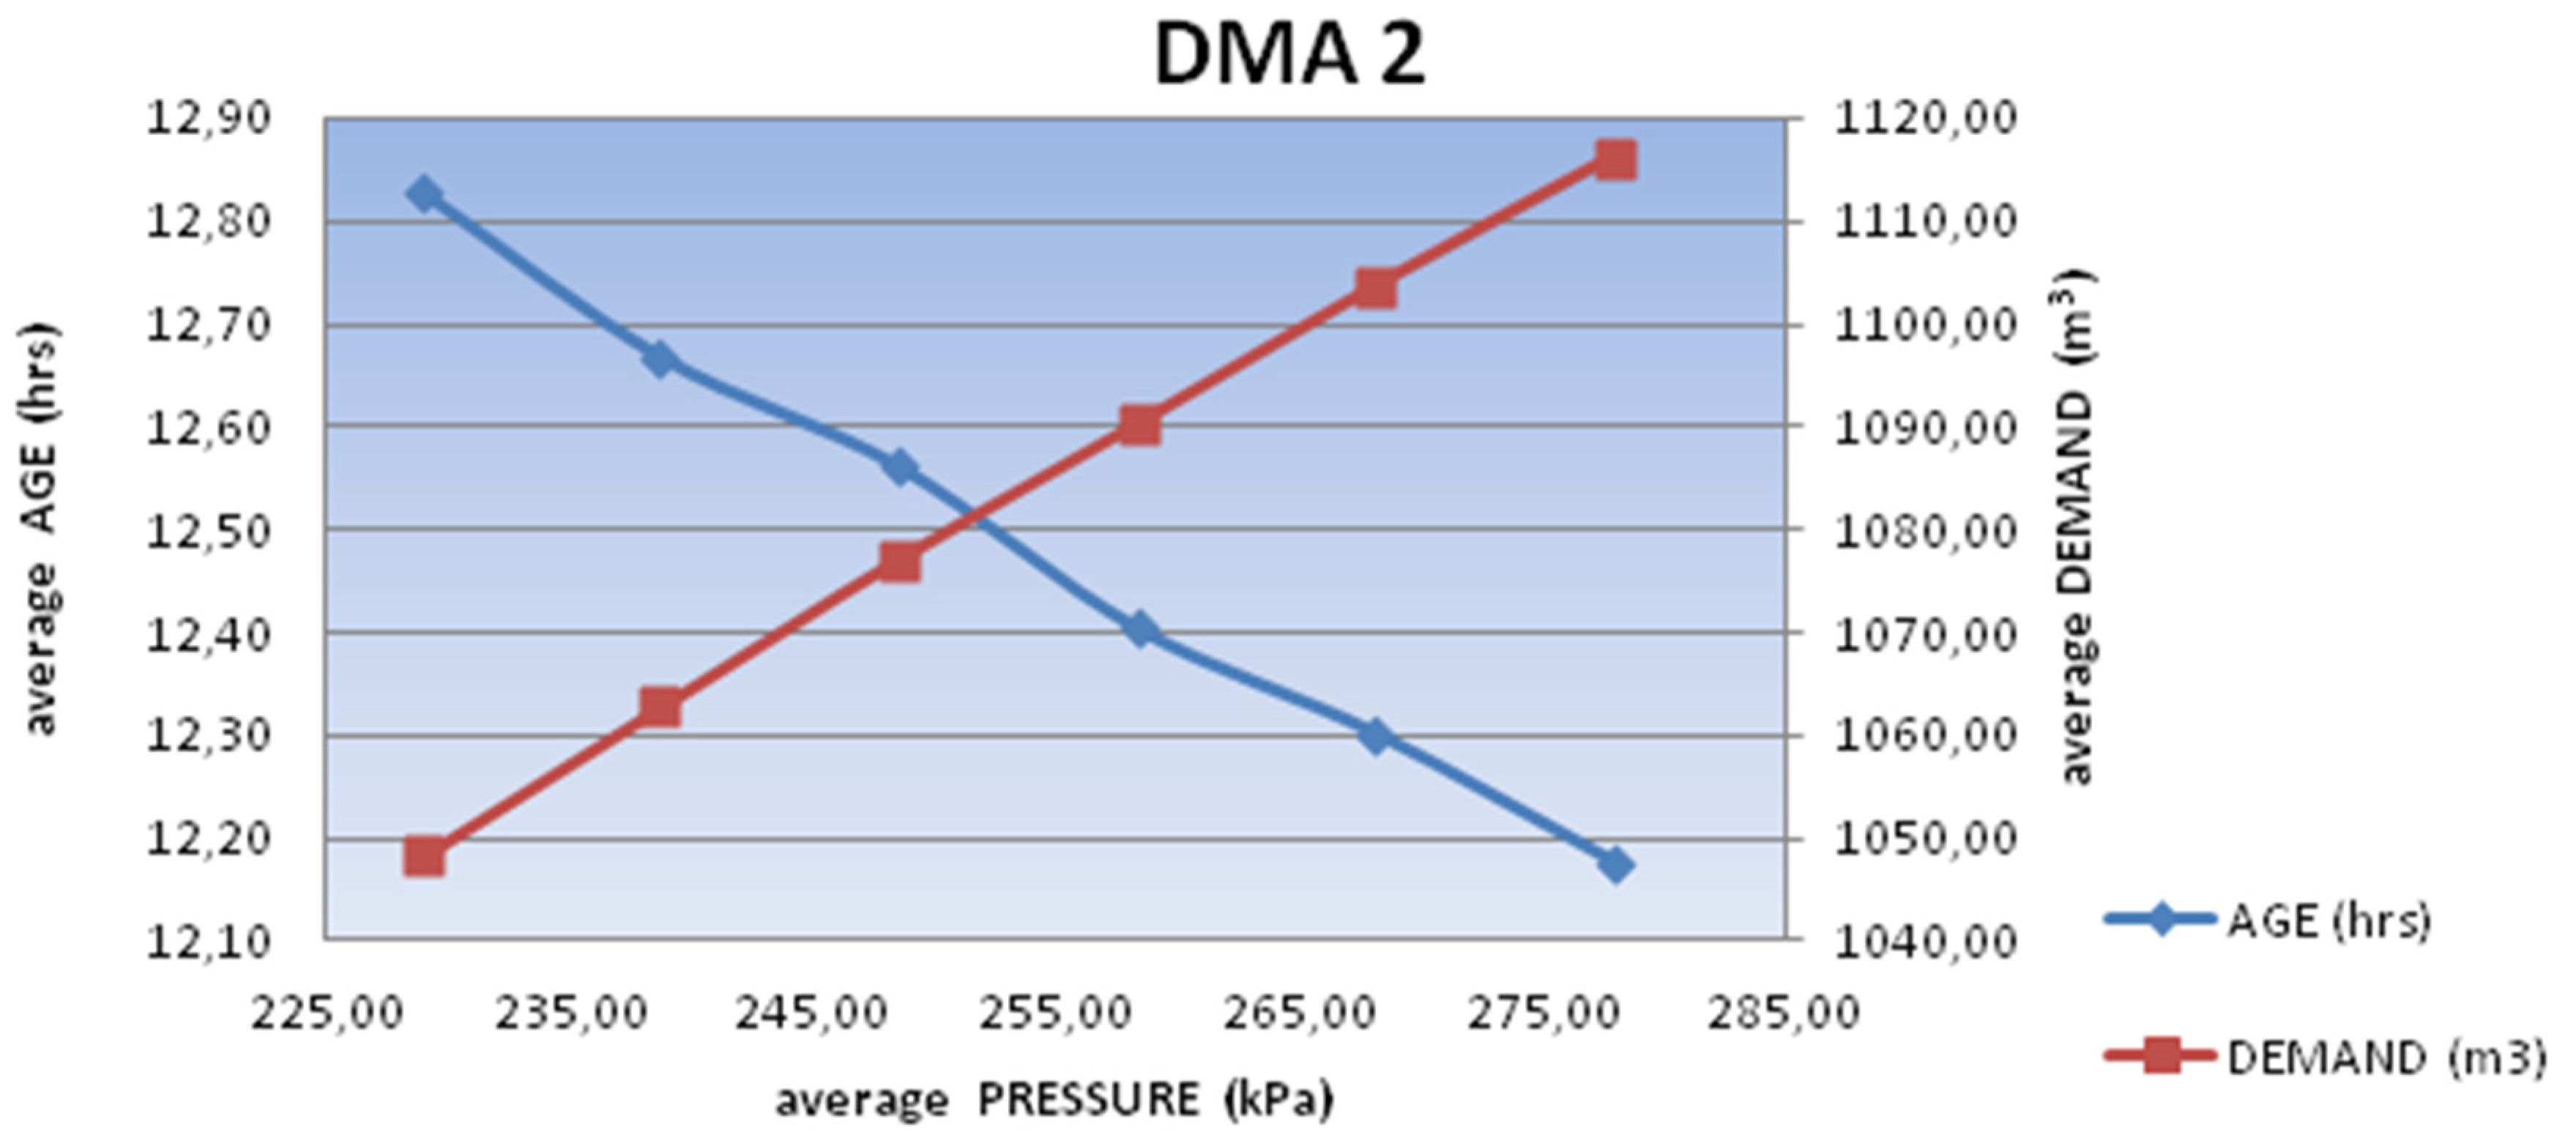
Figure 10.
New separation in DMAs [Scenario B].
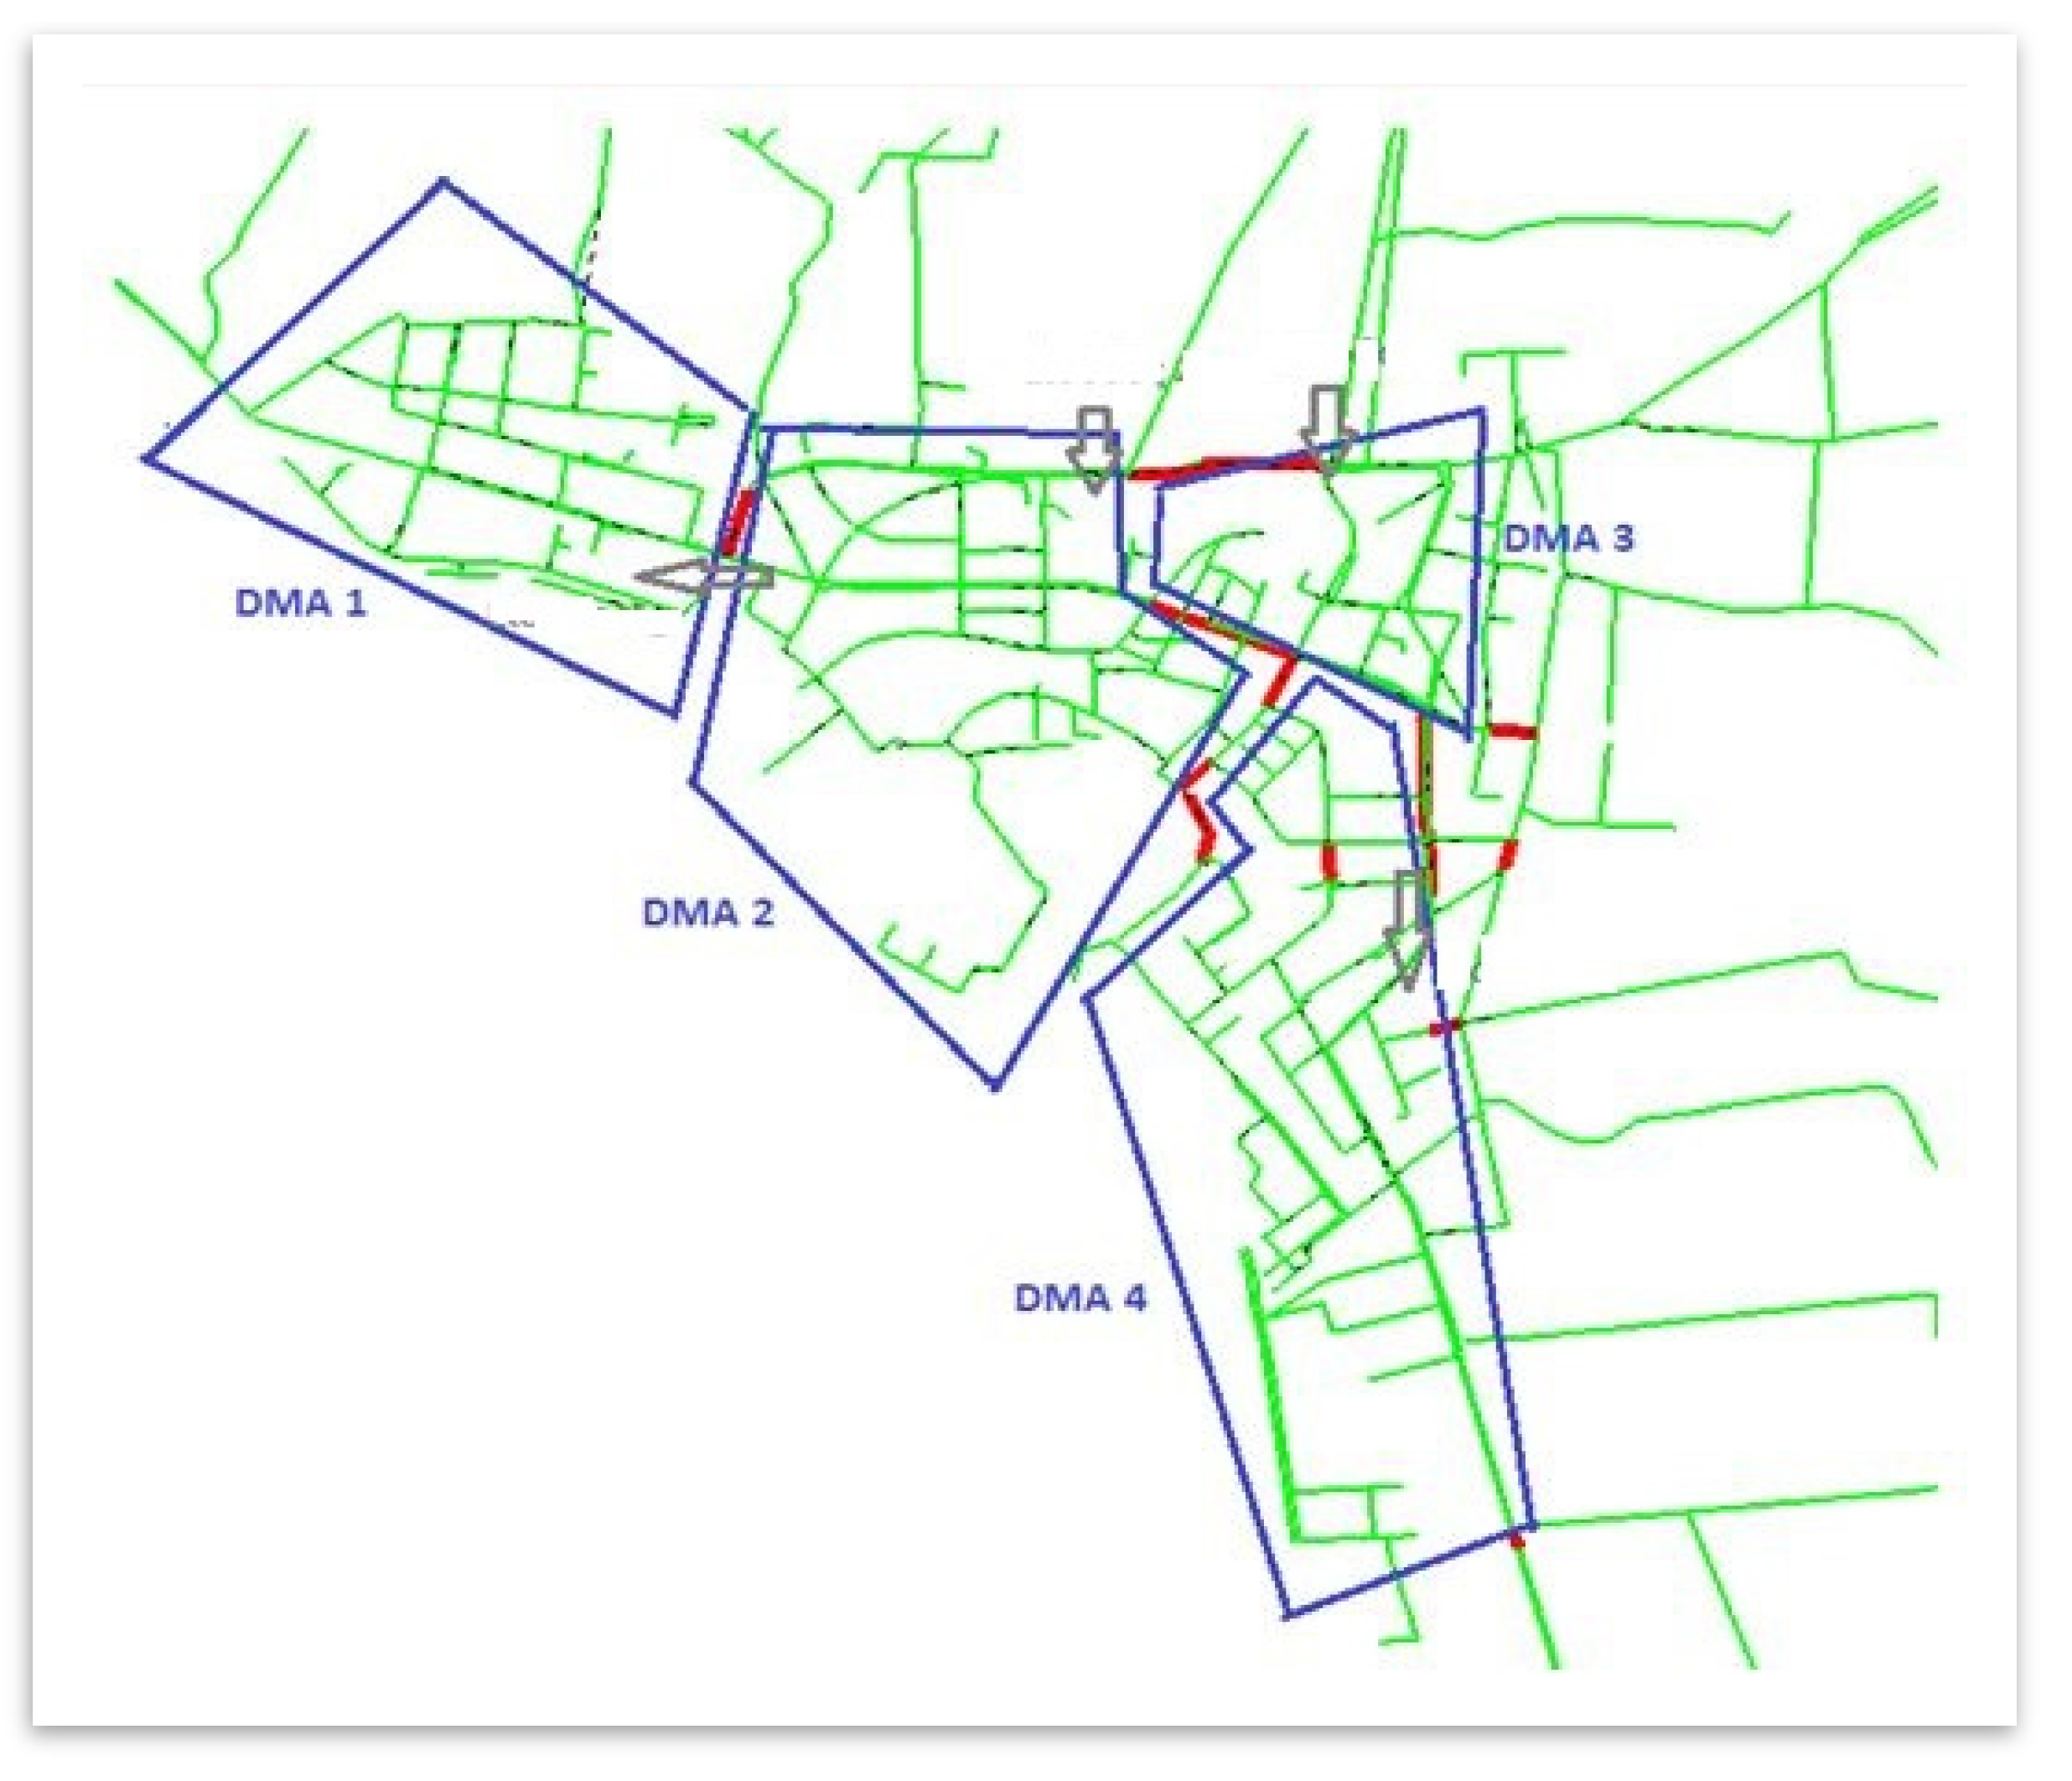
Figure 11.
Average Age of water for Scenario 1 & 2.
Figure 12.
Average Age of water for Scenario 1 & B.

Figure 13.
Pressure for Scenario 1,2 & B.


Table 1.
Initial PRVs Pressure Settings (Case 1).
| PRV Label | Title 2 |
|---|---|
| PRV-1 | 350 |
| PRV-2 | 232 |
| PRV-3 | 205 |
| PRV-4 | 213.5 |
| PRV-5 | 226 |
| PRV-6 | 227 |
| PRV-7 | 300 |
| PRV-8 | 227 |
| PRV-9 | 350 |
| PRV-10 | 225 |
| PRV-11 | 289.5 |
| PRV-12 | 299.5 |
Publisher’s Note: MDPI stays neutral with regard to jurisdictional claims in published maps and institutional affiliations. |
© 2018 by the authors. Licensee MDPI, Basel, Switzerland. This article is an open access article distributed under the terms and conditions of the Creative Commons Attribution (CC BY) license (https://creativecommons.org/licenses/by/4.0/).
Share and Cite
MDPI and ACS Style
Kravvari, A.; Kanakoudis, V.; Patelis, M. The Impact of Pressure Management Techniques on the Water Age in an Urban Pipe Network—The Case of Kos City Network. Proceedings 2018, 2, 699. https://doi.org/10.3390/proceedings2110699
AMA Style
Kravvari A, Kanakoudis V, Patelis M. The Impact of Pressure Management Techniques on the Water Age in an Urban Pipe Network—The Case of Kos City Network. Proceedings. 2018; 2(11):699. https://doi.org/10.3390/proceedings2110699
Chicago/Turabian StyleKravvari, Anastasia, Vasilis Kanakoudis, and Menelaos Patelis. 2018. "The Impact of Pressure Management Techniques on the Water Age in an Urban Pipe Network—The Case of Kos City Network" Proceedings 2, no. 11: 699. https://doi.org/10.3390/proceedings2110699