The Water-Energy Nexus at City Level: The Case Study of Skiathos †


Department of Civil Engineering, University of Thessaly, Pedion Areos, 38334 Volos, Greece
*
Author to whom correspondence should be addressed.
†
Presented at the 3rd EWaS International Conference on “Insights on the Water-Energy-Food Nexus”, Lefkada Island, Greece, 27–30 June 2018.
Proceedings 2018, 2(11), 694; https://doi.org/10.3390/proceedings2110694
Published: 31 July 2018
(This article belongs to the Proceedings of EWaS3 2018)
Abstract
:Water and energy are two inextricably linked resources of great importance, as they are the key for satisfying basic human needs. In this study a water–energy nexus analysis is conducted in order to achieve a sustainable supply and effectively manage water and energy at city level. Different electricity uses such as domestic, agricultural and commercial are compared and tested on how they correlate with water use. Moreover, time series of water and energy consumption for the island of Skiathos are analyzed using specific distance metrics. The results of the analysis show that water and energy are intimately related.
1. Introduction
Water is mankind’s most precious resource since there are no substitutes serving the essential functions of life. Human beings consume water directly and also use it in the production of food, for washing, sanitation, and for various industrial and domestic uses. Water supply and demand is affected by many factors such as population growth, increasing urbanization, intergovernmental relations, political and policy choices, social factors, technological growth, and uncertainties of climate. In addition to these issues, water consumption directly affects energy consumption [1].
Water is an essential element for the extraction, refining, processing and conveying energy and for the operation of hydroelectric and thermal power plants and on the other hand, provision of water for any kind of human activities requires huge quantities of energy [2]. Energy is essential to people to run their homes or industries. Population growth, urbanization and climate change exert pressure on water and energy resources worldwide, as global demand increases rapidly. Water and energy are key for satisfying the basic human needs; billions of people however are still lacking access to these resources. The direct interconnection of these two critical resources is easily established, since clean water needs energy to be produced and power plants need cooling water to operate [3].
On a global basis, water and energy should be affordable for all people. The need to find more efficient ways to use water and energy wisely, in households, in agriculture, and in industry is emerging. Decision makers, researchers and engineers have to recognize the water-energy nexus as a vital one. Using water wisely includes producing potable water and cleaning wastewater with less energy. Pumping water, pressurizing water distribution systems, and pumping wastewater are major energy consumers [4].
The need for a water-energy analysis is becoming increasingly important as the need for resource efficiency becomes progressively urgent. In a water-constrained world, it is critical to deeply understand the use of water throughout the entire life cycle of electricity production [5,6,7]. In all countries the use of water and energy is interconnected. Specifically, in the United States, more than 400 billion gallons of water are withdrawn daily from surface and ground water sources in order to supply various kinds of uses such as domestic, agricultural, industrial etc. Information about the energy that is needed to pump, transport, deliver, and process water is fragmentary and not well documented overall [8]. In a 2002 report, the Electric Power Research Institute (EPRI) estimated that nearly 4% of the nation’s electricity use goes toward moving and treating water and wastewater by public and private entities [9].
The main contribution of this paper is to demonstrate a water–energy nexus analysis, in order to achieve sustainable supply and effectively manage water and energy at city level by comparing the different electricity uses such as household, public, commercial, agricultural, etc., and by showing how they correlate with total water use. The time series that have been analyzed are water and electricity consumption of the island of Skiathos and specific distance metrics are used to check their similarity.
2. Materials and Methods
Water and energy consumption time series are analyzed, intending to identify what the correlation of the two resources is. The energy consumption is divided in individual uses such as domestic, commercial, agricultural, industrial and public as well. We used three distance metrics in order to achieve our results. Specifically, we used Minkowski distance which includes Euclidean and Manhattan distance [10], and also the Pearson’s Correlation Coefficient (PCC).
Our data are time series of water and electricity monthly consumption of the island of Skiathos from 2010 to 2015. For the analysis, we used the total water consumption of the island on one hand, and on the other hand, we used cumulatively agricultural energy consumption, commercial, industrial, and public. Additionally, we investigated how total consumption of water correlate with domestic use of energy consumption. Both water and energy data have been normalized in order to sum to 1. The normalization of the data is essential due to the fact that all data should be of the same measurement unit and so the results can be trustworthy.
The distance measures are very useful techniques that have been used in a wide range of applications such as fuzzy set theory, multicriteria decision making, researches, etc. Among the great variety of distances, we can find in literature the Minkowski distance, which can be considered as a generalization of both the Euclidean distance and the Manhattan distance and the PCC as well [11,12].
2.1. Minkowski Distance
The Minkowski distance (Euclidean and Manhattan) can be calculated by the equation (1) given below:
The generic r parameter in Equation (1) can be replaced by the value 2 to yield the Euclidean distance, the value 1 would yield the Manhattan distance, and all the intermediate values in the (1 < r < 2) interval yield an array of Minkowski distances. In this research we will use the values 1 and 2 for the parameter r [13]. The values someone can find when calculating the Minkowski distance varies from 0 to 2. To be more specific, the closer to 0 the is, the more related the two time series are. On the contrary, the closer to 2 the is, the more unrelated the two time series are.
2.2. Pearson’s Correlation Coefficient
The similarity measure is clearly application-dependent, so here we used also PCC, chosen through the several similarity measures have been proposed, since our data is linear. PCC measures the strength and direction of a linear relationship between two variables X and Y and can be defined as [14,15]:
The Statistical Package for the Social Sciences (SPSS) is used for the calculation of the PCC, which are presented in the following section. Below in Table 1, the values of PCC and how the two time series are correlated according to their values, are displayed:
3. Results and Discussion
Initially, we had all our data normalized, as aforementioned, in order to have a clear depiction of their actual consumption behavior. Observing the diagrams below, (Figure 1) one can see that the total consumption of water approaches the energy consumption—agricultural, commercial, industrial and public use—in a very satisfying way. The reason we summed the 4 uses of energy is due to the fact that they appeared to have a similar consumption behavior.
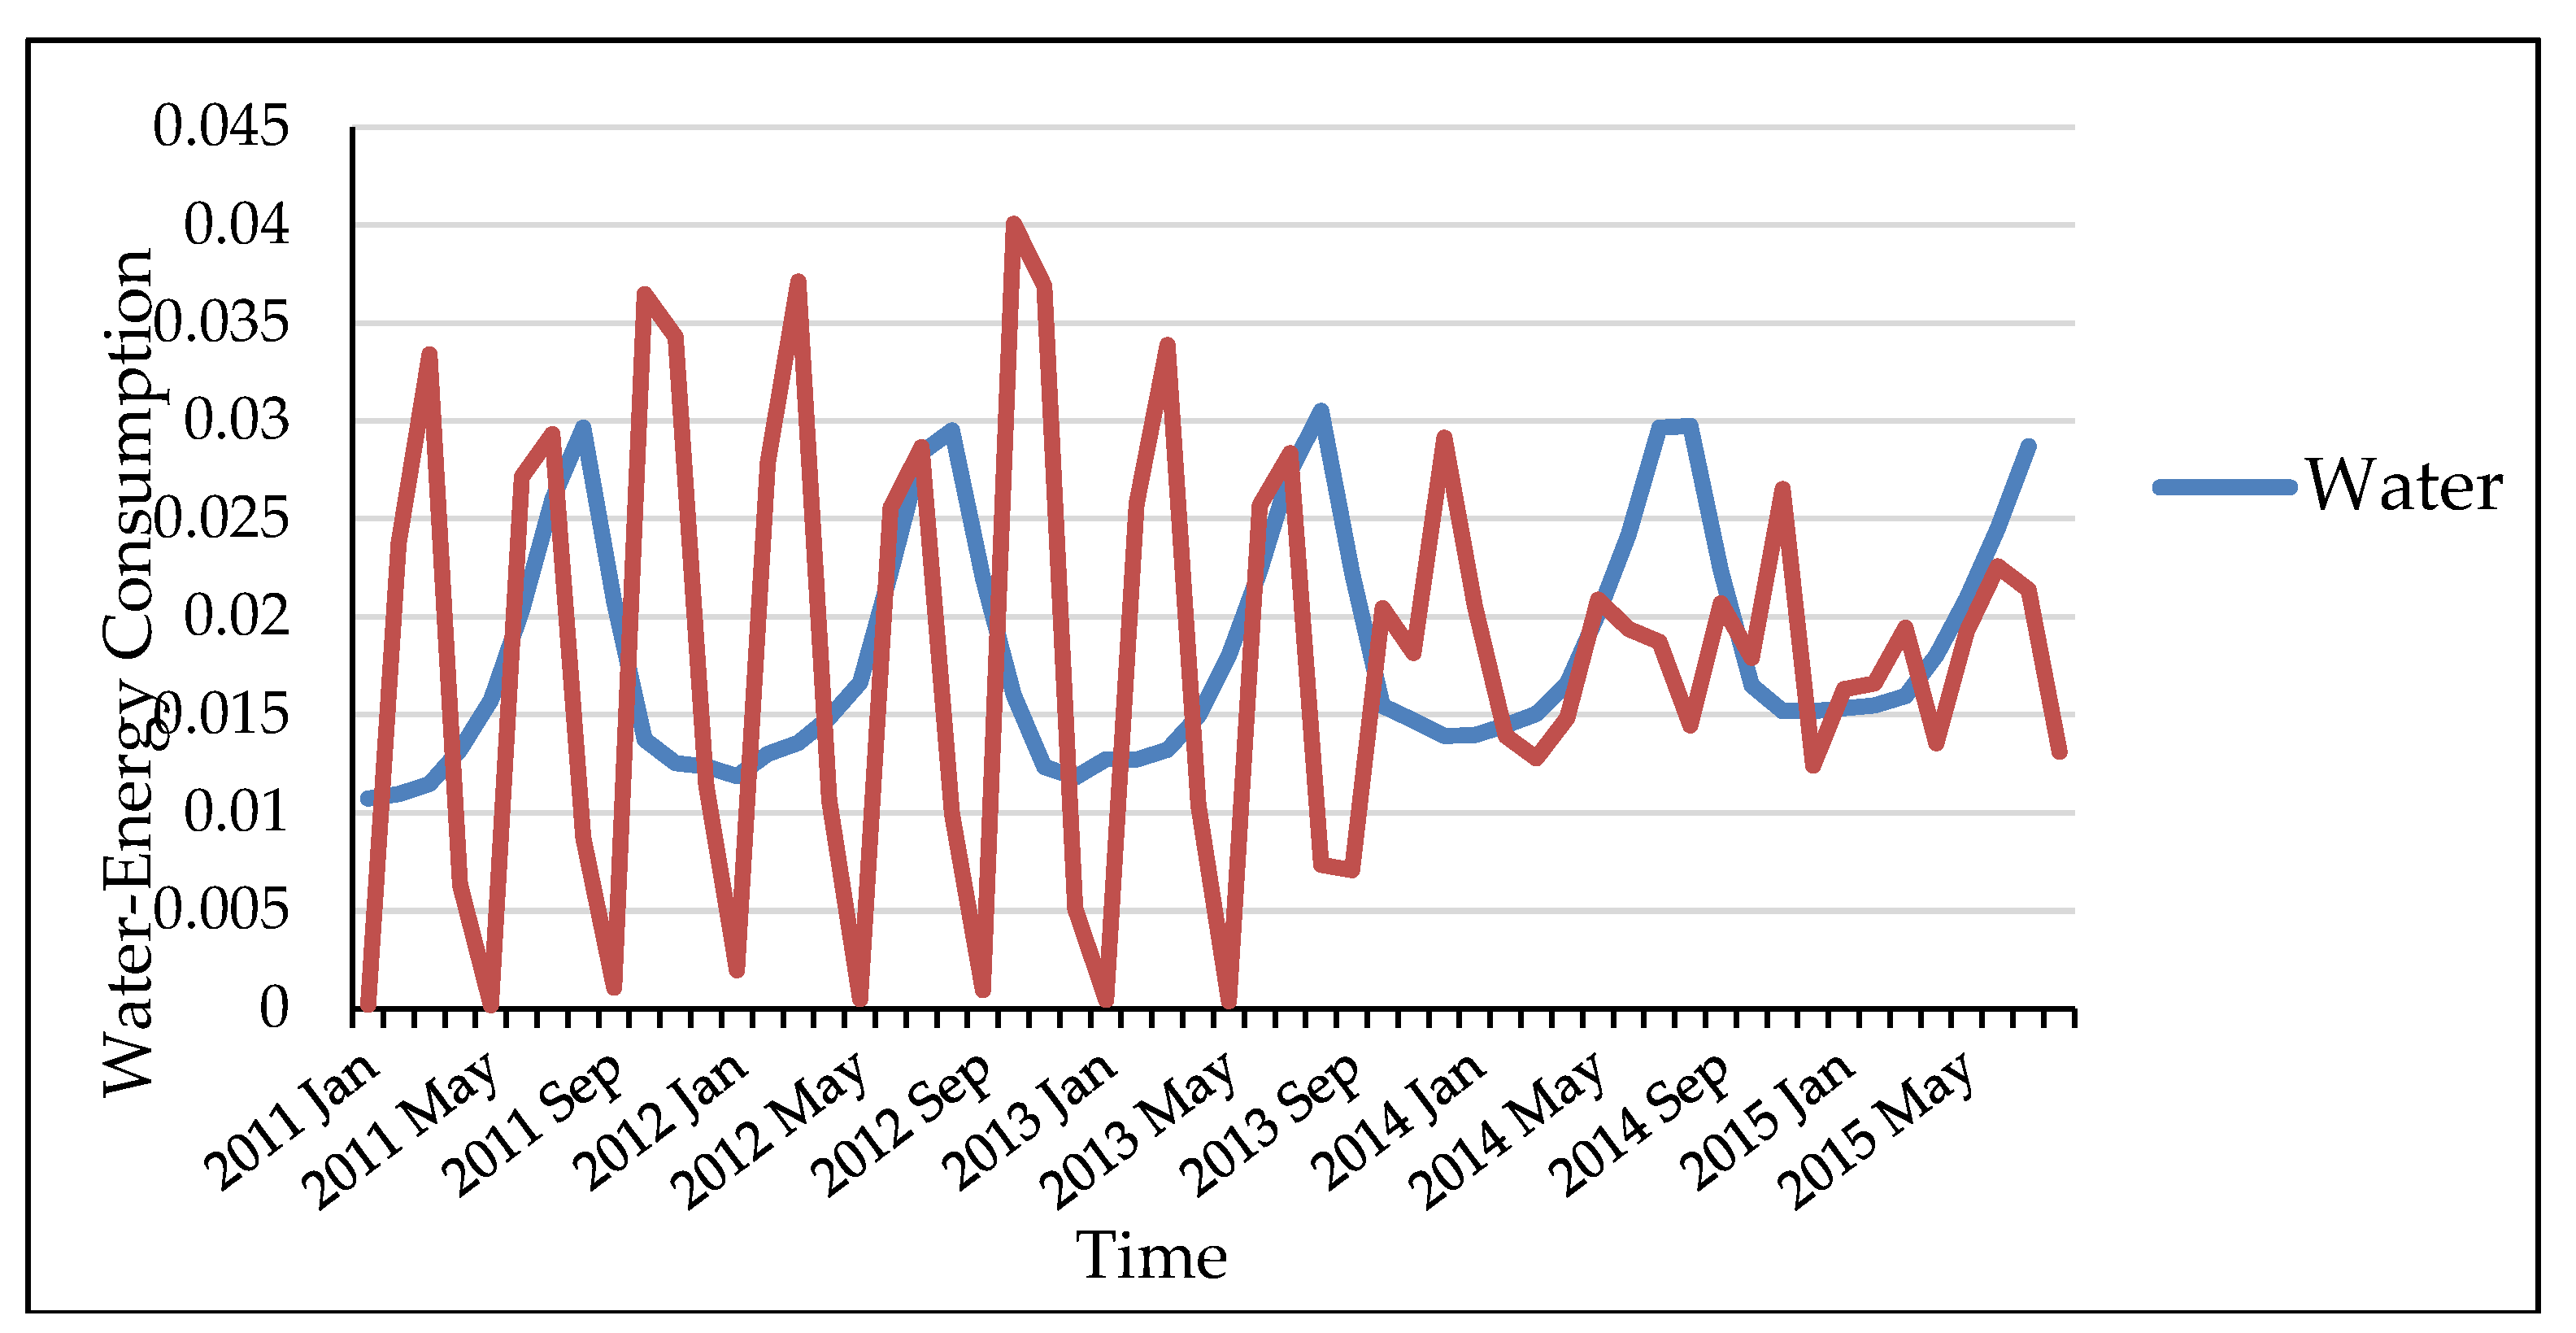
On the other hand, we notice that total consumption of water and domestic use of energy consumption seem not to have the same consumption behavior (Figure 2). We will investigate those two consumptions and try to prove that they are unrelated.
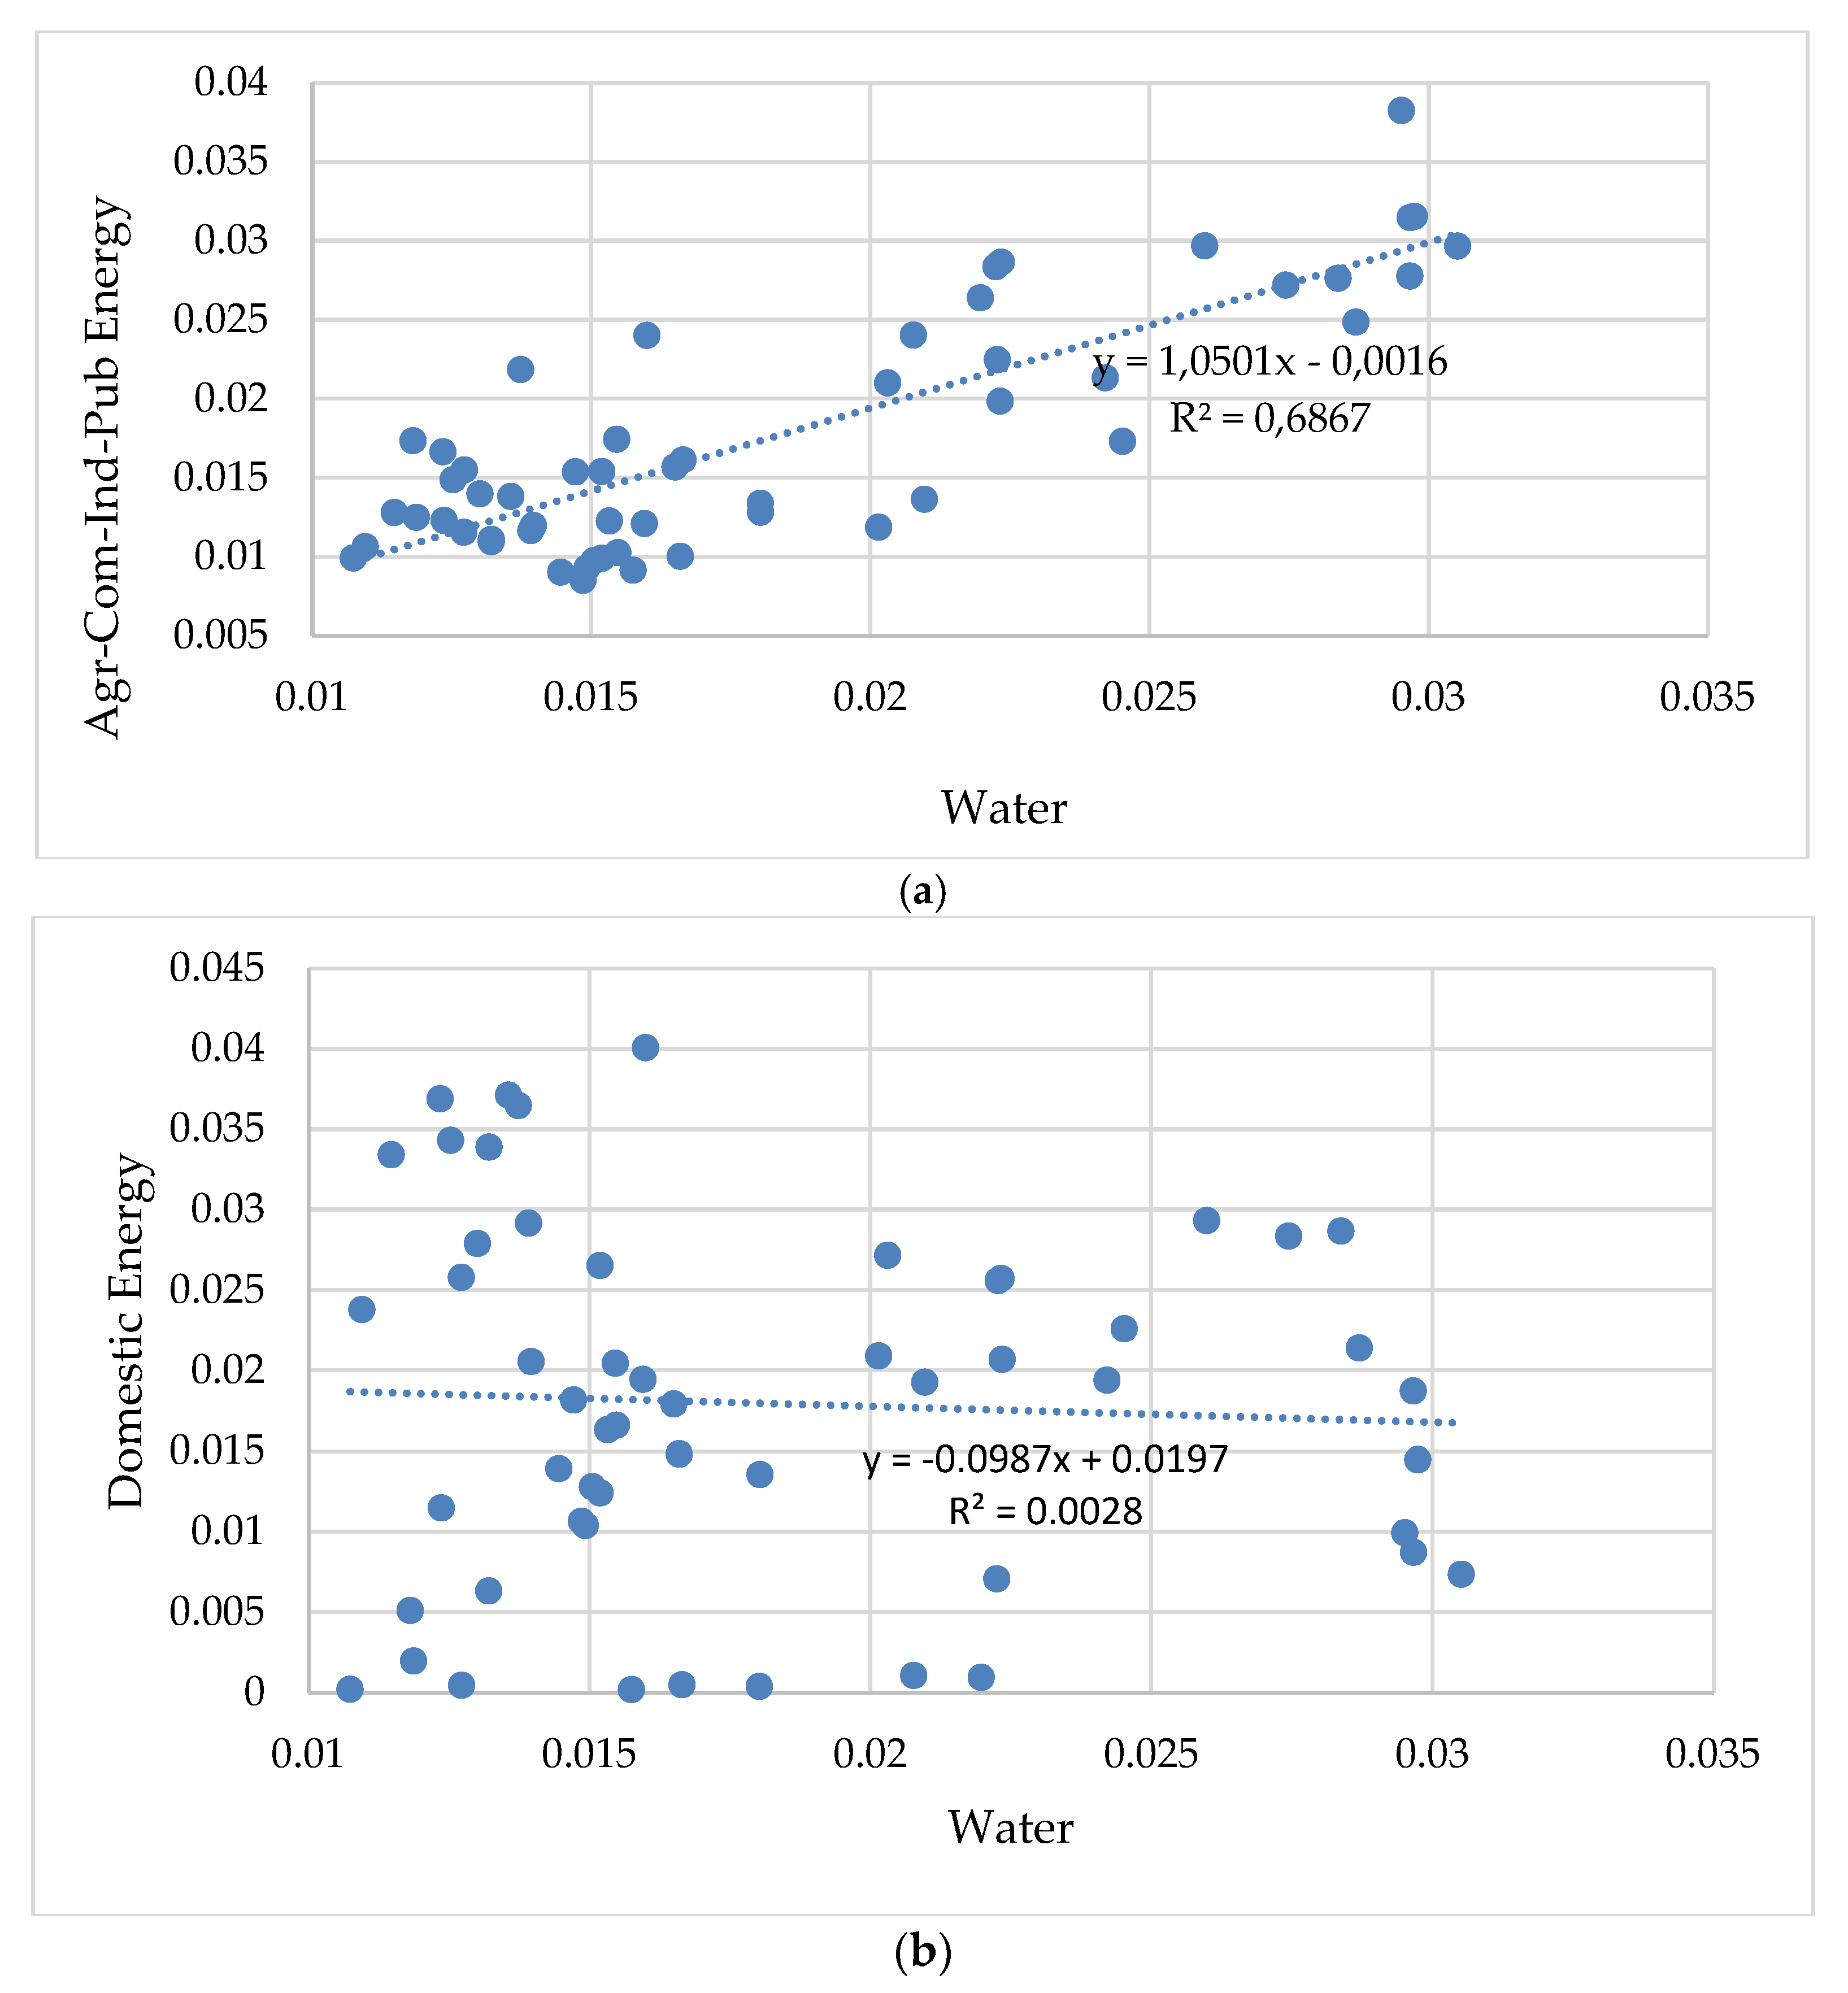
The next step was to calculate the 3 distance metrics and confirm or not the above assumptions. The values of the distance measurements are presented in Table 2. The first PCC value (0.829) confirms a very strong linear correlation among the two consumptions (Total Water/Commercial-Agricultural-Public-Industrial use of Energy), according to Table 1, and the variable a, in the third column, indicates that the specific test is significant. In graph (a) in Figure 3, this outcome and also their linear function showing the very strong linear correlation they have, is depicted. To the best of our knowledge, this can be explained by the reason that in Skiathos there is agricultural, commercial and industrial activity. The main agricultural products are oil and olives, since 28% of the island is covered by olive trees. In addition, since antiquity, there has been cultivation of a local vineyard from which there is a small production for own consumption. Industrial production includes local food processing industries.
The second PCC value (−0.053) in Table 2, reveals that there is no linear correlation between total water consumption and the domestic energy use. Furthermore, the variable a, indicates that this test is not significant. The question here arises is why this is happening. Our research concerns the Greek island of Skiathos and according to the Water Utility of the island, the water is not potable due to its high mercury content. This means, that many domestic uses of water, such as cooking, personal hygiene (especially infant hygiene) and drinking water have been replaced by bottled water. That fact, might have caused the reduction of water consumption through faucets in households and also created this difference between the two consumptions. The graph (b) in Figure 3, visualizes the aforementioned.
Minkowski Distance (Euclidean and Manhattan) is also calculated and the results are also in Table 2. As we can see all four values, for the two groups of consumptions, for both Euclidean and Manhattan distance, are closer to 0 rather than to 2. There are some differences in the outcomes of two groups, showing that the first one (water/commercial, agricultural, industrial and public use of energy consumption) contains more correlated consumptions but in general opposes to the result found calculated with the PCC. The error is bigger in values of the second group (water/domestic use of energy consumption), since they appear as correlated consumptions while as in PPC value they have no linear correlation. Considering the above, the Minkowski distance is not the best metric measurement for these data due to the inaccuracy of their outputs. Contrariwise, the PPC seems to be a very good distance metric because its results seem to give better results and can be trustworthy for future prediction of that kind of data set.
4. Conclusions
In this paper, we presented a water-energy nexus analysis for the Greek island of Skiathos. We analyzed the consumptions of different uses of energy—agricultural, commercial, industrial and public—and we concluded that there is a very strong linear correlation with total water consumption. We also examined the correlation of domestic use of energy with total water consumption and the results showed no linear correlation between them. For the results we used PCC and Minkowski Distance (Euclidean and Manhattan) after having all our data normalized at first level. The PCC proved to be the best distance measurement and the Minkowski Distance not a suitable one for our case study.
Through this investigation people could be motivated not only to save energy but also save water as well in order to get financial benefits, because energy is much pricier than water. Residents should be informed at a very early stage, such as in school for example, in order to save water and energy starting from their households and by achieving that, we could save the environment in general.
Acknowledgments
The work described in this paper has been conducted within the project WATER4CITIES—Holistic Surface Water and Groundwater Management for Sustainable Cities—which is implemented in the framework of the EU Horizon2020 Program, Grant Agreement Number 734409. This paper and the content included in it do not represent the opinion of the European Union, and the European Union is not responsible for any use that might be made of its content.
References
- Plappally, A.K. Energy requirements for water production, treatment, end use, reclamation, and disposal. Renew. Sustain. Energy Rev. 2012, 16, 4818–4848. [Google Scholar] [CrossRef]
- Ziogou, I.; Zachariadis, T. Quantifying the water–energy nexus in Greece. Int. J. Sustain. Energy 2017, 36, 972–982. [Google Scholar] [CrossRef]
- Wa’el, A.H.; Memon, F.A.; Savic, D.A. An integrated model to evaluate water-energy-food nexus at a household scale. Environ. Model. Softw. 2017, 93, 366–380. [Google Scholar]
- Olsson, G. Water and energy nexus. Encycl. Sustain. Sci. Technol. 2011, 11932–11946. [Google Scholar]
- Schnoor, J.L. Water-energy nexus. Environ. Sci. Technol. 2011, 45, 5065–5065. [Google Scholar] [CrossRef] [PubMed]
- Meldrum, J.; Nettles-Anderson, S.; Heath, G.; Macknick, J. Life cycle water use for electricity generation: a review and harmonization of literature estimates. Environ. Res. Lett. 2013, 8, 015031. [Google Scholar] [CrossRef]
- Murrant, D.; Quinn, A.; Chapman, L. The water-energy nexus: future water resource availability and its implications on UK thermal power generation. Water Environ. J. 2015, 29, 307–319. [Google Scholar] [CrossRef]
- Copeland, C. Energy-Water Nexus: The Water Sector’s Energy Use; Congressional Research Service: Washington, DC, USA, 2014; p. 7-5700. [Google Scholar]
- Goldstein, R.; Smith, W. Water and Sustainability (Volume 4): US Electricity Consumption for Water Supply and Treatment: The Next Half Century; Electric Power Research Institute (EPRI): Palo Alto, CA, USA, 2002. [Google Scholar]
- Miśkiewicz, J. Analysis of time series correlation. The choice of distance metrics and network structure. Acta Phys. Pol. A 2012, 121, B89–B94. [Google Scholar] [CrossRef]
- Merigó, J.M.; Gil-Lafuente, A.M. Using the OWA operator in the Minkowski distance. Int. J. Comput. Sci. 2008, 3, 149–157. [Google Scholar]
- Vadivel, A.; Majumdar, A.K.; Sural, S. Performance comparison of distance metrics in content-based image retrieval applications. In Proceedings of International Conference on Information Technology (CIT), Bhubaneswar, India, 20–22 December 2003; pp. 159–164. [Google Scholar]
- Shahid, R.; Bertazzon, S.; Knudtson, M.L.; Ghali, W.A. Comparison of distance measures in spatial analytical modeling for health service planning. BMC Health Serv. Res. 2009, 9, 200. [Google Scholar] [CrossRef] [PubMed]
- Liao, T.W. Clustering of time series data—A survey. Pattern Recogn. 2005, 38, 1857–1874. [Google Scholar] [CrossRef]
- Rodgers, J.L.; Nicewander, W.A. Thirteen ways to look at the correlation coefficient. Am. Stat. 1988, 42, 59–66. [Google Scholar] [CrossRef]
Figure 1.
The consumption behavior of total consumption of water in relation to agricultural, commercial, industrial and public use of energy consumption.
Figure 1.
The consumption behavior of total consumption of water in relation to agricultural, commercial, industrial and public use of energy consumption.
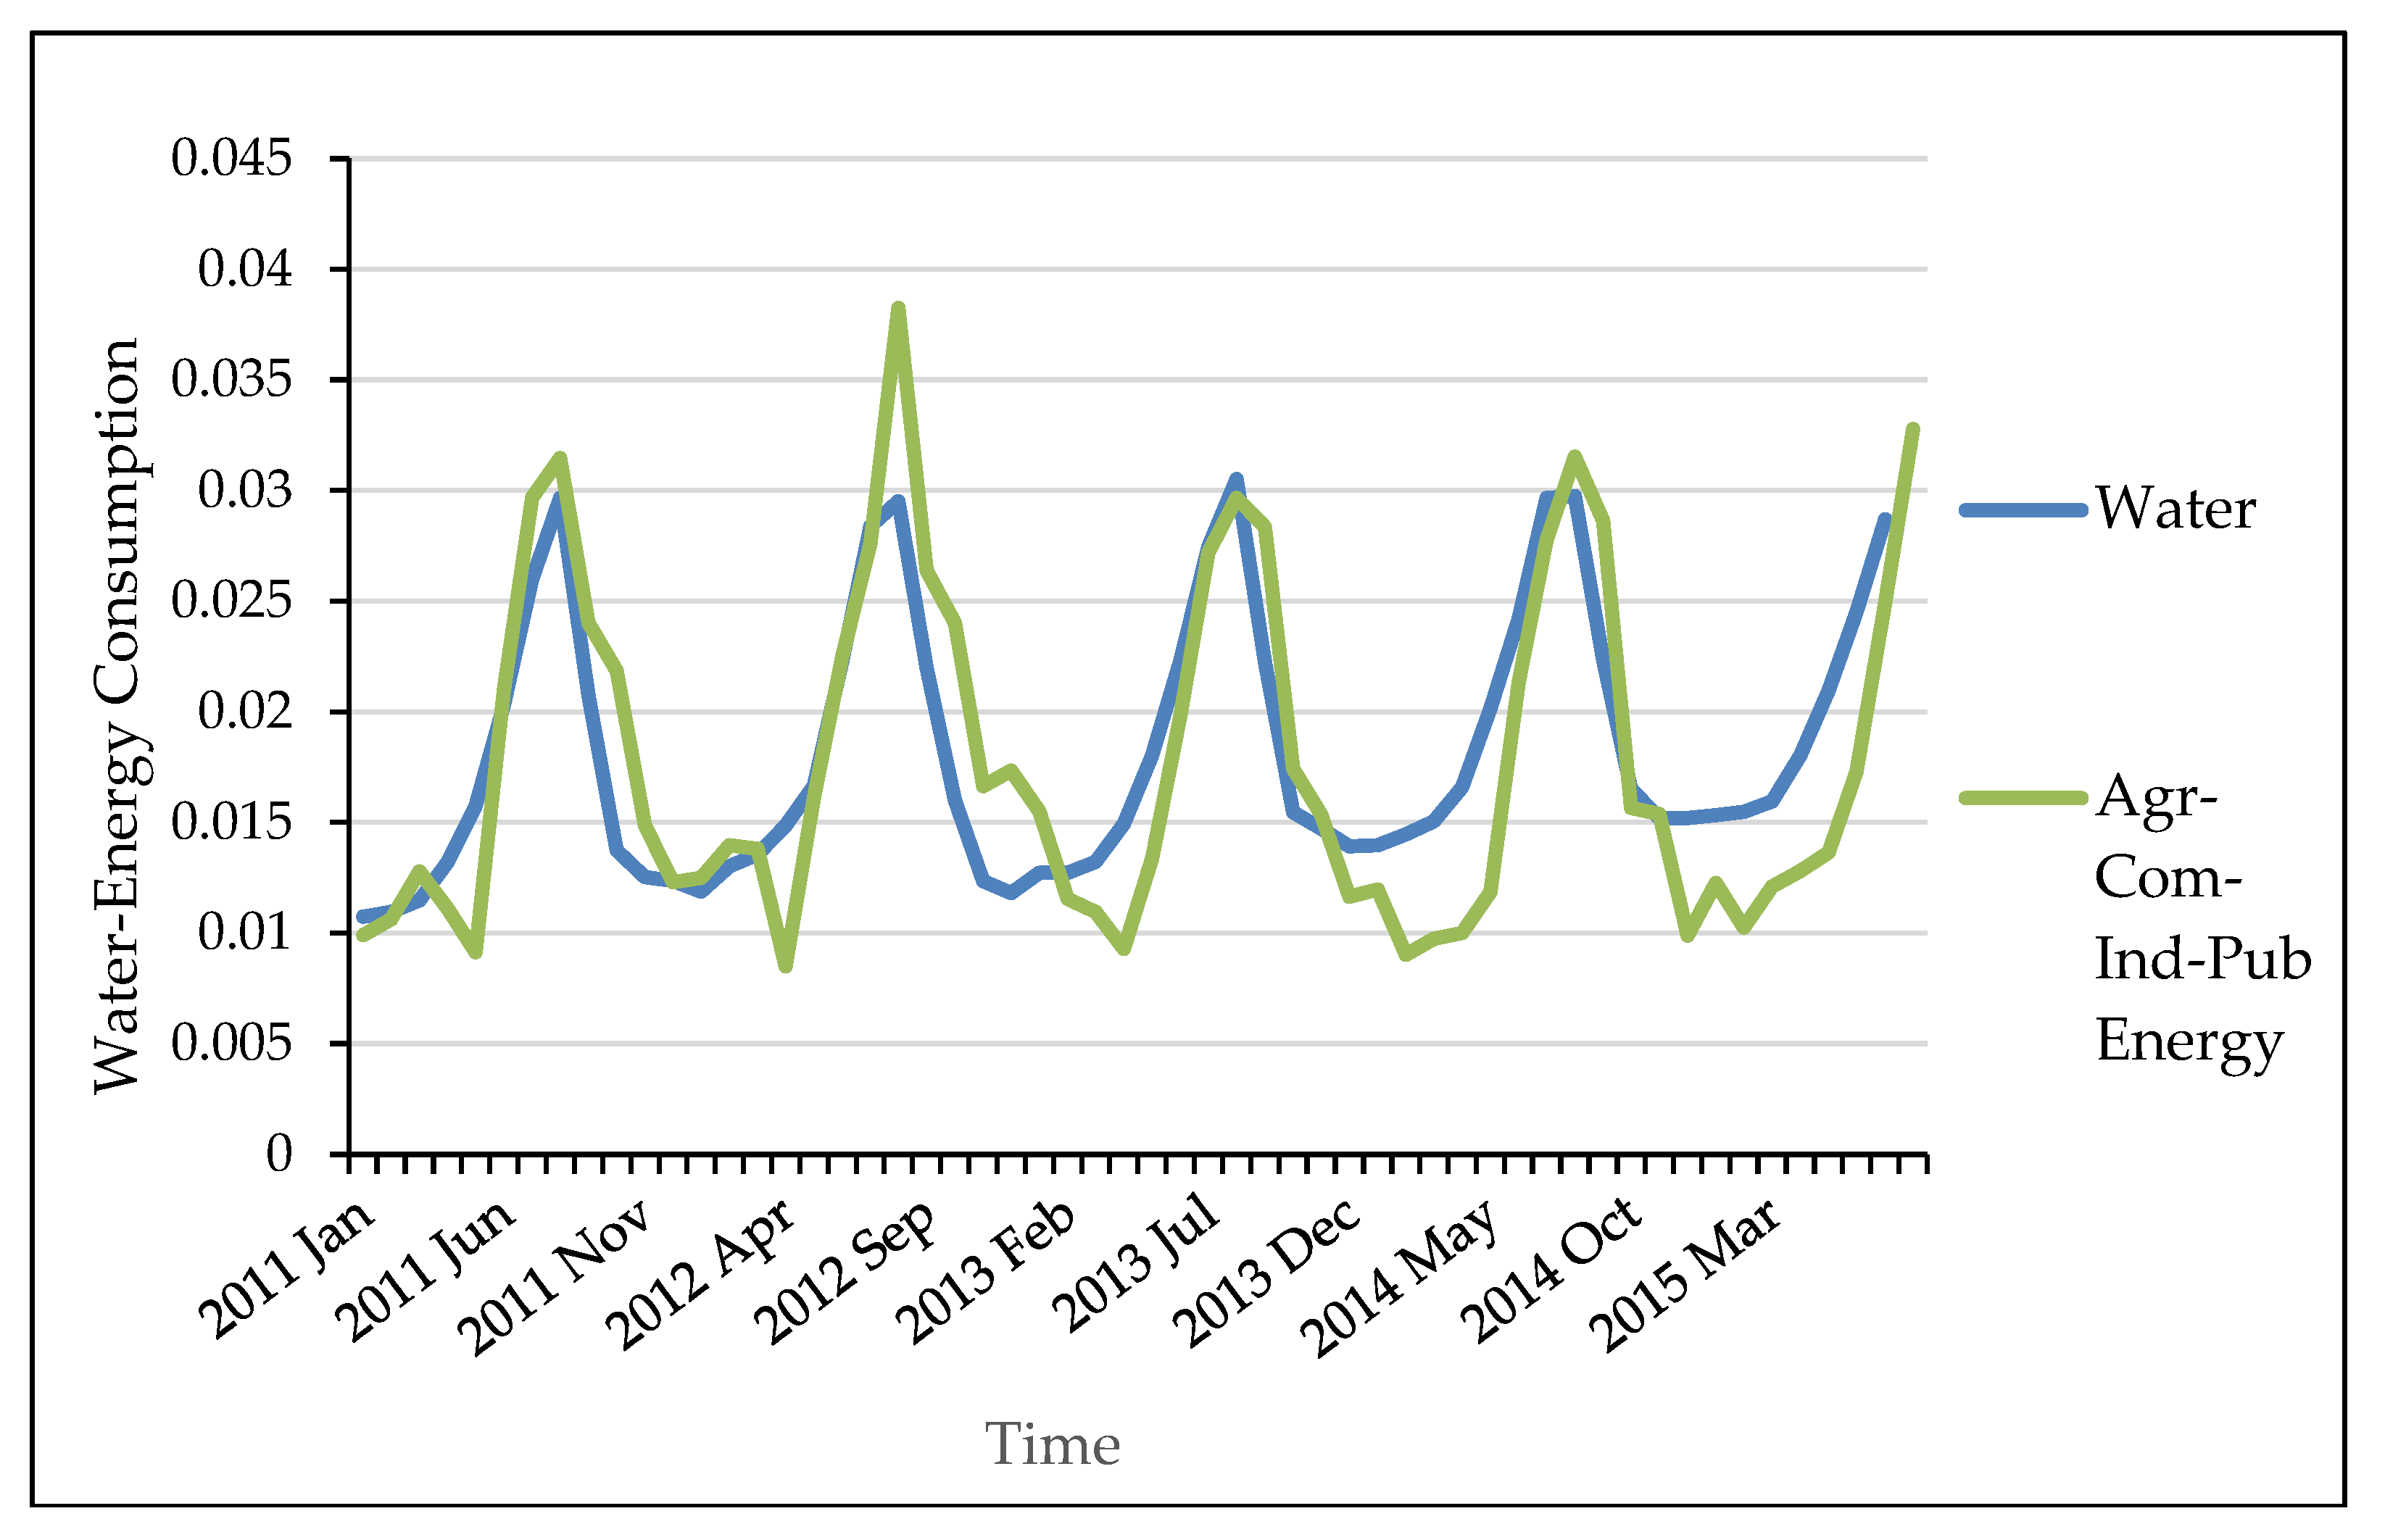
Figure 2.
The consumption behavior of water in relation to domestic energy consumption.

Figure 3.
The PCC graphs between water and energy consumption (normalized values): (a) PCC graph for total water and for 4 uses of energy consumption (agricultural, commercial, industrial and public); (b) PCC graph for total water and domestic use of energy consumption.
Figure 3.
The PCC graphs between water and energy consumption (normalized values): (a) PCC graph for total water and for 4 uses of energy consumption (agricultural, commercial, industrial and public); (b) PCC graph for total water and domestic use of energy consumption.


Table 1.
PCC values and explanations.
| Value of R | Correlation |
|---|---|
| R = ±1 | perfect linear correlation |
| −0.3 ≤ R < 0.3 | no linear correlation |
| −0.5 < R ≤ −0.3 or 0.3 ≤ R < 0.5 | weak linear correlation |
| −0.7 < R ≤ −0.5 or 0.5 ≤ R < 0.7 | average linear correlation |
| −0.8 < R ≤ −0.7 or 0.7 ≤ R < 0.8 | strong linear correlation |
| −1.0 < R ≤ −0.8 or 0.8 ≤ R < 1.0 | very strong linear correlation |
Table 2.
Values of PCC, Euclidean and Manhattan Distance.
| Consumption Water/Energy | PCC | Variable a1 | Euclidean Distance | Manhattan Distance |
|---|---|---|---|---|
| Total Water/Commercial-Agricultural -Public-Industrial (Energy) | 0.829 | 0 | 0.069 | 0.375 |
| Total Water/Domestic (Energy) | −0.053 | 0.703 | 0.095 | 0.560 |
1 Variable a defines whether the test is significant or not. If a, the test is significant and if a >, the test is not significant.
Publisher’s Note: MDPI stays neutral with regard to jurisdictional claims in published maps and institutional affiliations. |
© 2018 by the authors. Licensee MDPI, Basel, Switzerland. This article is an open access article distributed under the terms and conditions of the Creative Commons Attribution (CC BY) license (https://creativecommons.org/licenses/by/4.0/).
Share and Cite
MDPI and ACS Style
Ioannou, A.E.; Laspidou, C.S. The Water-Energy Nexus at City Level: The Case Study of Skiathos. Proceedings 2018, 2, 694. https://doi.org/10.3390/proceedings2110694
AMA Style
Ioannou AE, Laspidou CS. The Water-Energy Nexus at City Level: The Case Study of Skiathos. Proceedings. 2018; 2(11):694. https://doi.org/10.3390/proceedings2110694
Chicago/Turabian StyleIoannou, Alexandra E., and Chrysi S. Laspidou. 2018. "The Water-Energy Nexus at City Level: The Case Study of Skiathos" Proceedings 2, no. 11: 694. https://doi.org/10.3390/proceedings2110694