Potential Micro-Hydropower Generation in Community-Owned Rural Water Supply Networks in Ireland †


1
Department of Civil Engineering, Trinity College of Dublin, Dublin 2 Dublin, Ireland
2
IHE Delft Institute for Water Education, Department of Environmental Engineering and Water Technology, 2601 Delft, The Netherlands
*
Author to whom correspondence should be addressed.
†
Presented at the 3rd EWaS International Conference on “Insights on the Water-Energy-Food Nexus”, Lefkada Island, Greece, 27–30 June 2018.
Proceedings 2018, 2(11), 677; https://doi.org/10.3390/proceedings2110677
Published: 30 July 2018
(This article belongs to the Proceedings of EWaS3 2018)
Abstract
:The potential of micro-hydropower generation has been evaluated in seven community-owned rural water supply networks (CORWSN) in Ireland. The replacement of the existing infrastructure in place to reduce pressure in the networks with micro-hydropower turbines (Scenario 1) was considered. New potential locations for additional pressure reduction were also considered (Scenario 2). An assessment of the energy potential and economic viability of each site was carried out, including quantification of leakage reduction impacts. While only one of the seven CORWSNs showed two potential sites with power higher than 1 kW, the power generated can still have significant impacts on local energy demands. The estimated total energy saved in Scenario 2 ranged from 0.63 MWh year−1 to 84.5 MWh year−1 according to the micro-hydropower potential in each CORWSN. Furthermore, water savings from 4348 € m−3 to 73,264 € m−3 were estimated due to the reduction of leakage volume after installing micro-hydropower turbines at the potential sites detected in Scenario 2. Thus, the water cost saving associated to the reduction of leakage volume makes the incorporation of this element in the networks feasible.
1. Introduction
The increasing pressure on both water and energy resources along with the growing impacts of climate change are leading to the necessity for improved management of both. The water sector, with an energy consumption worldwide of 120 M t in 2014 [1] and with an expected increase in the coming years, is an intensive energy consumer. Hence, the search for measures related to the reduction of the energy consumption is highly recommended.
In water distribution networks, energy is often required to supply water to each consumer. However, there are other situations in which energy is dissipated to avoid excessive pressures and, consequently, pipe bursts and leakages, by using break pressure tanks (BPTs) or pressure reducing valves (PRVs). One effective measure to reduce the energy dissipation in water networks consists of the replacement of BPTs/PRVs with micro-hydropower (MHP) turbines and more specifically, pumps as turbines (PATs).
An assessment of MHP in the UK and Irish water industry estimated a potential energy generation of 17.9 GWh per annum, showing the capability of this technology to improve the sustainability of this sector [2]. Several works related to the energy recovery by MHP have been developed. Some of them have focused on the optimal location of PATs in a network to maximize the energy recovery and water saving [3,4], whereas the joint optimization of energy recovery, pumping cost and leakage reduction has also been considered [5].
Taking into account the benefits that MHP can entail in rural areas [6], in this work, the potential of MHP generation has been evaluated in community-owned rural water supply networks (CORWSN) in Ireland [7]. Moreover, the associated leakage reduction that would arise as a result of new PAT installations and the resulting water cost saving have been also analysed.
2. Methodology
2.1. Case Study
The potential of MHP generation has been evaluated in seven CORWSN in Ireland (Figure 1). The selected networks operate by gravity. The average flow in these networks ranges from 1.7 L s−1 in Kilcredan GWS to 13.8 L s−1 in Blackstairs GWS (Table 1). Infrastructure to reduce pressure such as PRVs of BPTs can be found in Ballacolla GWS, Ballinabranna GWS, Blackstairs GWS, Heath GWS and Kilanerin GWS. No devices to reduce the pressure were located in the other two CORWSNs.
2.2. Problem Approach
The MHP potential, HPPAT (W), at each potential site in each CORWSN was determined by Equation (1):
where PAT is an index related to the PAT, ρ is the water density (kg m−3), g the gravity acceleration (m s−2), QPAT the flow rate through the PAT (m3 s−1), HPAT the hydraulic head available at the PAT (m) and η the efficiency of the PAT. The efficiency varies according to the pair of values QPAT and HPAT. However, to simplify the model a constant value of 0.66 has been assumed in this work [4].
The energy recovery by MHP has been determined in each CORWSN considering two scenarios:
- Scenario 1: This scenario consisted of the evaluation of MHP potential by replacing the current PRVs or BPTs with a PAT, where applicable. The actual pressure drop in each pressure reducing element was used to calculate the hydraulic head at the PAT.
- Scenario 2: In this case, new reduced pressure settings or new potential locations for the installation of PATs were proposed, always ensuring the minimum flow-pressure require ments at each consumption node. The potential locations were selected considering both the node elevation and the flow.
The determination of the pair of values Flow-Head for each potential site was carried out in EPANET [8]. As constraints, the physical laws of mass and energy conservation were satisfied.
2.3. Hydropower Potential Estimation by the Elevation Dimensionless Coordinate
One of the main variables involved in the determination of the hydropower potential was the geodetic variation across the network. Thus, a new dimensionless coordinate, z*, to estimate the hydropower potential in a network was proposed:
where i is an index related to node, nnodes the number of nodes, zi the elevation of node i, r an index related to the reservoir and Hr the reservoir head.
2.4. Hydropower Potential Indicator
A new indicator which informs about the energy that could be recovered from a network was proposed. This new indicator, HPER, relates the energy recovered by hydropower, HEr (kWh) and the energy supplied by the network, HEs (kWh), which in gravity networks is related to the flow and the head provided by the reservoir.
HEr can be determined by Equation (4):
where nPAT is the number of PATs considered to install in the network and t (h) the time considered for the estimation of the recovered energy. HEs was calculated by the following expression:
where nr is the number of reservoir in the network and Qr (m3 s−1) the average flow provided by the reservoir r.
2.5. Estimation of Water and Cost Saving by Leakage Reduction
The installation of elements to reduce pressure at nodes at new potential sites not only could entail energy recovery, but also a reduction of leakage volume and hence, water cost savings due to lower pressures. The water cost saving was determined by the following equation:
where cw is the water cost (€ m−3), Vlo and VlPRV (m3 day−1) are the volume of leakage in Scenario 1 and Scenario 2, respectively, and ndays is the number of days of the year. Leakage volume was obtained by Equation (7):
where p is an index related to the demand pattern, np is the number of periods in which the demand pattern is divided, Ql(p) is the total leakage flow (m3 s−1) and ∆t(p) is the duration of each period (s). The total leakage flow can be allocated in the nodes (i) of the network considering a pressure-driven demand [9]:
where ni is the number of nodes of the network and qli is the leakage flow at node i (L s−1), determined by Equation (9):
where β is the emitter exponent which takes into account the pipe material and the shape of the orifice (1.18 has been assumed in this work [9]), Pi is the pressure (m) at node i and ci is the discharge coefficient, calculated by the following expression:
α is a coefficient (L s−1 m−1−β), j is an index related to pipe, Kji is the number of pipes connected to node i and Lji is the length of the pipe j connected to node i (m).
To determine ci, the leakage flow obtained as the 80% of the minimum night flow, was assigned as base demand to each node and the hydraulic simulation of the network was carried out in EPANET [8]. From this simulation, pressure at nodes were obtained and the initial α value was determined. Afterwards, following the methodology proposed by [9] an iterative process was carried out to determine α. Then, two types of demand were assigned to nodes, one associated to leakage and pressure-dependent and the initial base demand. The accomplishment of the continuity equation was carried out by adjusting the demand pattern dpl(t), using a genetic algorithm [10] according to Equation (11):
where Qt(t) is the total flow recorded at time t and qi is the base demand at node i.
2.6. Economic Analysis
Finally, to evaluate the feasibility of the installation of a PAT at a certain potential site, the payback period, PPPAT (year) was determined since this is the key driver for a MHP installation [2]:
where CtotalPAT is the total cost of MHP facility (€), including the PAT cost, CPAT, and the costs related to the PAT control, commissioning, civil works and hydraulic equipment, grid connection, project costs and maintenance costs (15% of the total costs was considered as maintenance cost [4]). Costs from 9 PAT sites installed at different countries were collected and from these data the average PAT cost was estimated to be the 26% of the total cost. ie is the savings from displaced electricity costs (ie = 0.17 € kWh−1 has been assumed in this work [11]). CPAT (€) was estimated using the expression corresponding to a two magnetic pole pair machine [12]:
3. Results and Discussion
Daily and/or hourly flow records were collected in each CORWSN. From these data, a base demand was assigned to each consumption node according to the users they supply. When hourly data were available, the demand pattern was determined taking into account these records. Otherwise, a demand pattern obtained from the CORWSNs with available data was selected.
3.1. Elevation Dimensionless Coordinate
z* coordinate for each node and each CORWSN was calculated. The lower the values of z*, the lower the elevation of the nodes with respect to the reservoir/s head. Thus, Ballinabranna and Blackstairs showed the lowest z* median value and furthermore, the z* value for the 75% of the nodes was below 0.5 (Figure 2). Thus, a priori, the hydropower potential in these networks was expected to be high. A z* median value around 0.5 was determined in Kilanerin. Thus, the hydropower potential in this network could also be high. In contrast, Kilcredan and Ballacolla showed z* median values above 0.7 which means the elevation of 50% of the nodes was below but close to the reservoir/s head. Hence, the expected micro-hydropower in these CORWSNs will not be very significant. The z* median values in Heath and Caherlesk were 0.61 and 0.65, respectively and in both networks, several nodes with elevation close to reservoir elevation were detected.
3.2. Potential Micro-Hydropower in the CORWSNs
- Scenario 1.
The micro-hydropower potential was determined at each PRV and/or BPT located in the networks (Figure 3a). Blackstairs GWS showed the highest pair of values for flow-pressure, of 13.7 L s−1 and 67 m. Other sites in this network also showed high values of flow-pressure. Ballinabranna GWS and Kilanerin GWS showed high pressure values at the current sites although the flow in these sites was low. Both pressure and flow at the current PRVs in Heath were low. In Caherlesk and Kilcredan there are no existing devices to reduce the pressure. As for the MHP determined at each CORWSN, only those values which involved a payback period less than 10 years were considered as acceptable values. As could be expected, the highest MHP value, 6.00 kW, was detected in Blackstairs. In the rest of the sites in this network, the hydropower ranged from 0.41 kW to 0.77 kW. Four sites in this network did not show hydropower potential. Ballinabranna hydropower potential was 0.48 kW and 0.37 kW with payback period of 6 and 8 years, respectively. The MHP potential in Kilanerin was 0.55 kW, with a payback period of 6 years. For the rest of the networks, the MHP potential was very low and with associated payback period exceeding 10 years.
- Scenario 2.
New potential sites were detected at each CORWSN and the MHP energy recovery was determined considering the installation of a PAT at each site. Two different potential sites were proposed in Ballacolla, one in Ballinabranna, six in Blackstairs, two in Caherlesk, one in Kilanerin and three in Kilcredan. In Heath the current sites were maintained but the pressure setting at each PRV was reduced. In Ballacolla, the pairs of values flow-pressure at the new potential sites were higher than the values associated to the existing sites (Figure 3b). In Ballinabranna the pair of values flow-pressure at the new potential site was 0.60 L s−1 and 41 m. In Blackstairs the flow at the new sites ranged from 1.05 L s−1 to 11.36 L s−1 with associated values of pressure of 21 m and 16 m. In Caherlesk, the pairs of values flow-pressure at the new potential sites were 0.33 L s−1 and 24 m and 1.33 L s−1 and 24 m. In Heath, the pressure settings at the current PRVs were reduced except in one of them. Finally, in Kilanerin and Kilcredan the pressure did not exceed 20 m in any of the proposed sites and the flow was lower than 1.00 L s−1 in both cases. As for the MHP, only one of the potential sites in Blackstairs showed a value higher than 1 kW. In the other networks the hydropower determined was lower than 0.40 kW in all cases.
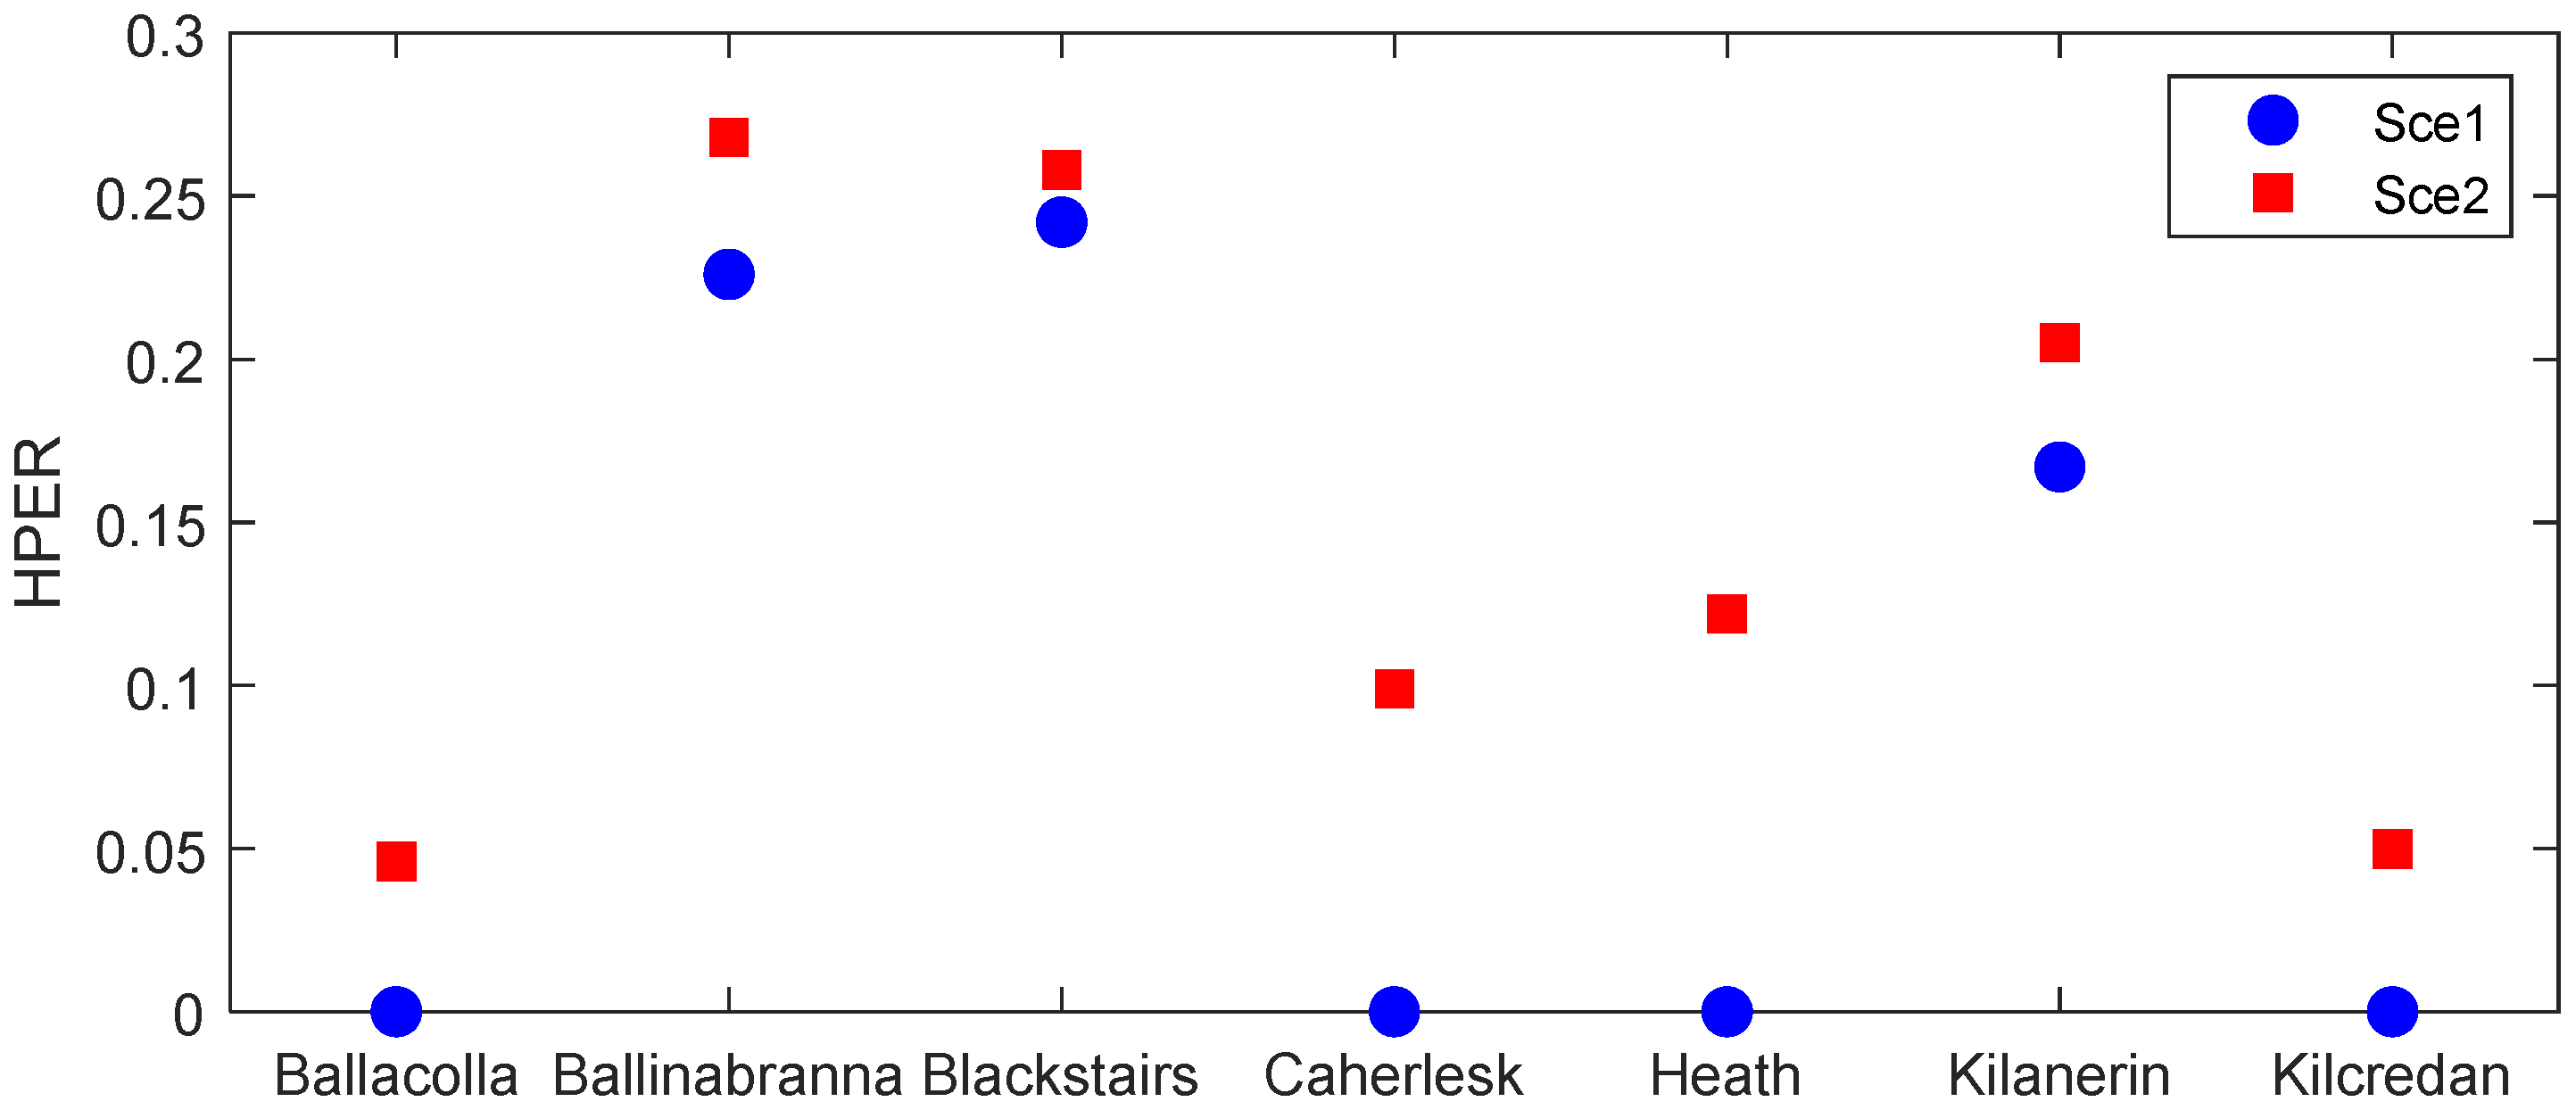
The hydropower potential indicator in Scenario 1 showed high values for those networks with low values of the z* coordinate (Ballinabranna, Blackstairs and Kilanerin) and reduced values in Ballacolla, Caherlesk and Kilcredan, where nodes elevation was close to the reservoir elevation. Nevertheless, the value of this indicator increased in all networks in Scenario 2. In Caherlesk, without any element to reduce the pressure currently, HPER showed a significant increment whereas a lesser increase was determined in Blackstairs and Ballinabranna, where the current MHP potential was high (Figure 4). The estimated total energy that could be saved in Scenario 2 ranged from 0.63 MWh year−1 in Kilcredan to 84.5 MWh year−1 in Blackstairs.
As for the payback period in Scenario 2, only three of the potential sites proposed in Blackstairs entailed periods lower than 10 years. However, the installation of the elements to reduce pressure implied also lower pressure at nodes and hence, a reduction of the leakage volume and water distribution costs. Thus, significant water savings were determined in all networks, with values ranging from 4348 m3 year−1 in Ballinabranna up to 73,264 m3 year−1 in Blackstairs (Figure 5). In contrast to Blackstairs, the lower value estimated in Ballinabranna was due to both the reduced size of this network and the location of the potential site, which only affected a few nodes. The estimation of the water cost saving was carried out considering the current running cost of the CORWSN when these data were available. Otherwise, a value of 0.3 € m−3 was assumed [4]. Water cost saving ranged from 1304 € year−1 in Ballinabranna to 21,979 € year−1 in Blackstairs. What is more, the payback period was calculated again considering the water cost saving associated to the leakage volume and the new payback period was lower than 10 years at all the new proposed potential sites and in all networks.
4. Conclusions
The micro-hydropower potential in seven CORWSNs in Ireland has been evaluated. After carrying out the analysis, the CORWSNs with the greatest geodetic variations across their network showed the most promising potential for energy recovery in both scenarios. In Scenario 1, the most promising CORWSN revealed 6 potential sites for energy recovery with payback times lower than 10 years, and power generated from 0.41 kW to 6.00 kW. In Scenario 2 in the same network, one of the proposed potential sites implied a power of 1.1 kW. Although the potential for micro hydropower energy recovery in rural sparsely populated locations is low, significant water savings and hence, water cost savings could be achieved after installing devices to reduce the pressure, thus making feasible the incorporation of PATs in networks. Further investigation should consider the comparison of PRVs and PATs as element to reduce the pressure, thus optimizing the installation cost and benefits.
Author Contributions
A.M. and I.F.G. conceived and designed the methodology; I.F.G. and D.F. analysed the data; A.M. and I.F.G. wrote the paper.
Acknowledgments
This project is part funded by the European Regional Development Fund (ERDF) through the Ireland Wales Co-operation Programme 2014–2020. The authors would also like to thank the seven CORWSNs and National Federation of Group Water Schemes, for the provision of data.
Conflicts of Interest
The authors declare no conflict of interest. The founding sponsors had no role in the design of the study; in the collection, analyses, or interpretation of data; in the writing of the manuscript, and in the decision to publish the results.
References
- IEA (International Energy Agency). Water Energy Nexus-Excerpt from the World Energy Outlook 2016. Available online: https://www.iea.org/publications/freepublications/publication/WorldEnergyOutlook2016ExcerptWaterEnergyNexus.pdf (accessed on 22 January 2018).
- Gallagher, J.; Harris, I.M.; Packwood, A.J.; McNabola, A.; Williams, A.P. A strategic assessment of micro-hydropower in the UK and Irish water industry: Identifying technical and economic constraints. Renew. Energy 2015, 81, 808–815. [Google Scholar] [CrossRef]
- Corcoran, L.; Mcnabola, A.; Coughlan, P. Optimization of Water Distribution Networks for Combined Hydropower Energy Recovery and Leakage Reduction. J. Water Resour. Plan. Manag. 2015, 142, 1–8. [Google Scholar] [CrossRef]
- Fecarotta, O.; McNabola, A. Optimal Location of Pump as Turbines (PATs) in Water Distribution Networks to Recover Energy and Reduce Leakage. Water Resour. Manag. 2017, 31, 5043–5059. [Google Scholar] [CrossRef]
- Tricarico, C.; Morley, M.S.; Gargano, R.; Kapelan, Z.; Savić, D.; Santopietro, S.; Granata, F.; de Marinis, G. Optimal energy recovery by means of pumps as turbines (PATs) for improved WDS management. Water Sci. Technol. Water Supply 2017. [Google Scholar] [CrossRef]
- Ramos, H.; Borga, A. Pumps as turbines: An unconventional solution to energy production. Urban Water 1999, 1, 261–263. [Google Scholar] [CrossRef]
- NFGWS National Federation of Group Water Schemes. Annual Report 2016. Available online: http://www.nfgws.ie/f//2016 Annual Report.pdf (accessed on 23 January 2018).
- Rossman, L. EPANET 2. Users Manual; US Environmental Protection Agency (EPA): Washington, DC, USA, 2000. [Google Scholar]
- Araujo, L.S.; Ramos, H.; Coelho, S.T. Pressure Control for Leakage Minimisation in Water Distribution Systems Management. Water Resour. Manag. 2006, 20, 133–149. [Google Scholar] [CrossRef]
- Goldberg, D.E. Genetic Algorithms in Search, Optimization, and Machine Learning; Addison-Wesley Longman Publishing Co., Inc.: Chicago, IL, USA, 1989; ISBN 0201157675. [Google Scholar]
- SEAI Electricity & Gas Prices in Ireland. 1st Semester (January–June) 2017. Available online: https://www.seai.ie/resources/publications/Electricity_Gas_Prices_January_June_2017 (accessed on 10 May 2018).
- Novara, D.; McNabola, A. The development of a decision support software for the design of Micro-Hydropower schemes utilizing a Pump as Turbine. In Proceedings of the 3rd EWaS International Conference on “Insights on the Water-Energy-Food Nexus”, Lefkada, Greece, 27–30 June 2018. [Google Scholar]
Figure 1.
Location of the selected CORWSN.
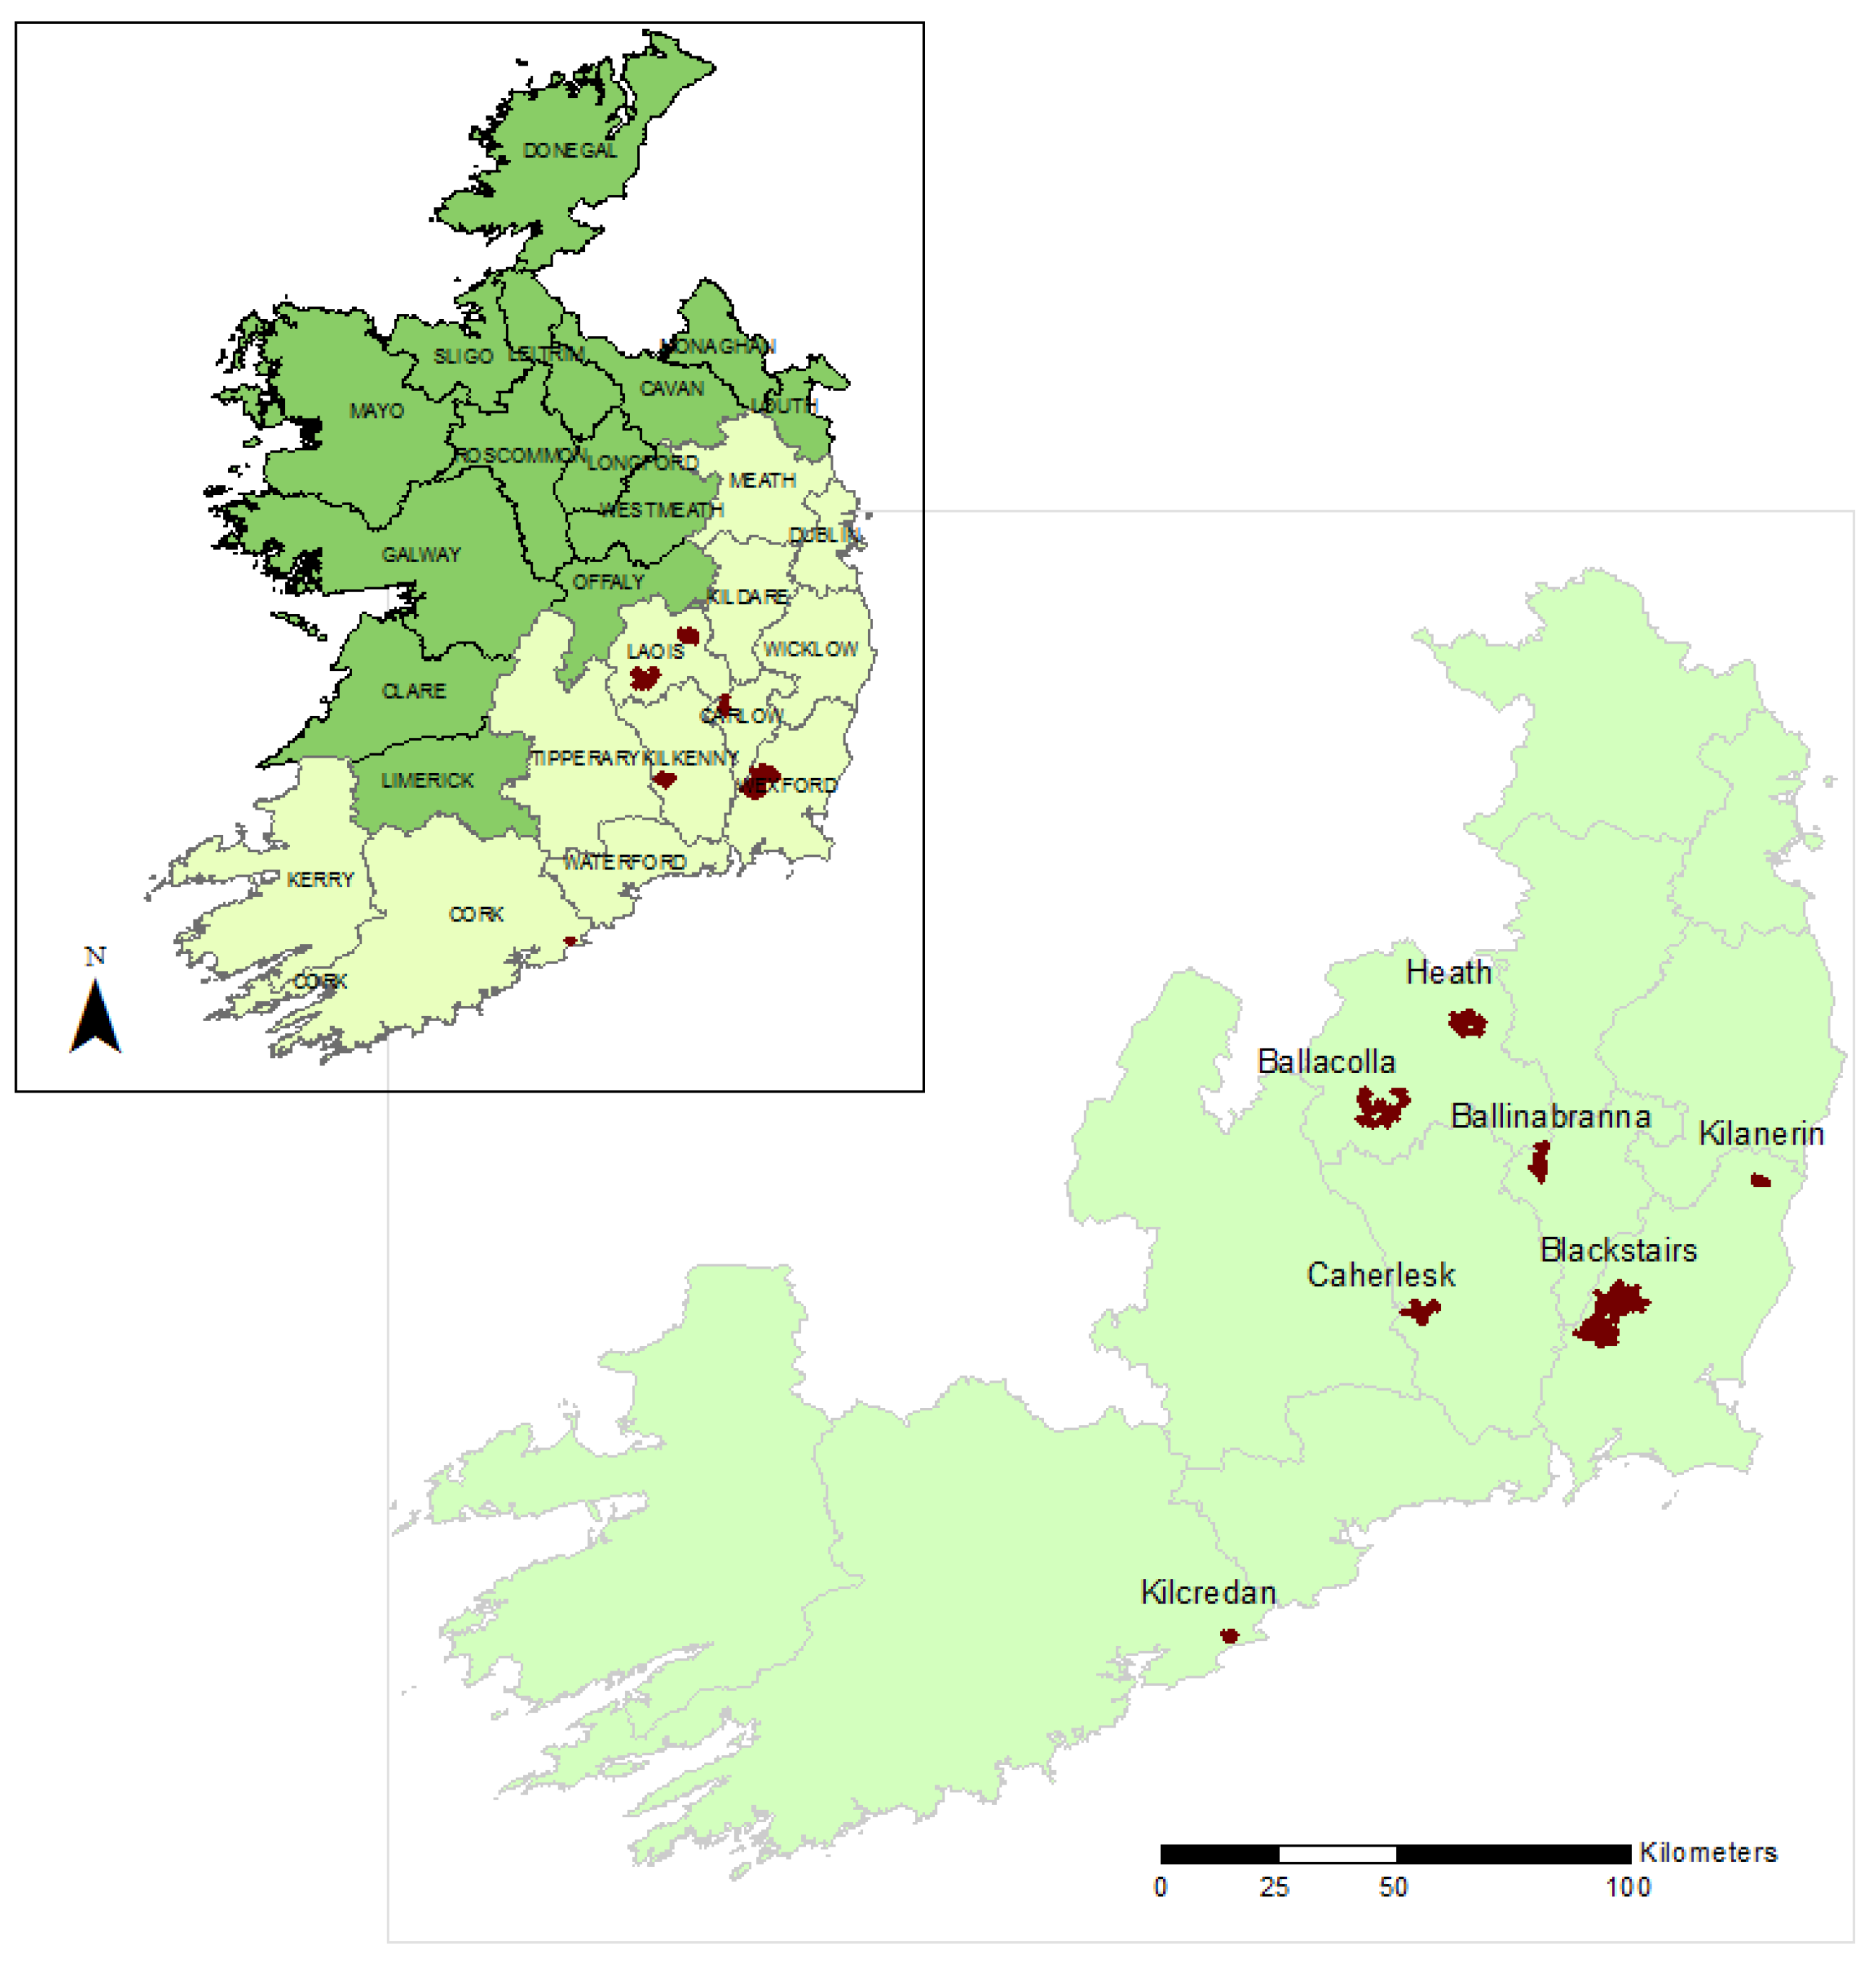
Figure 2.
z* node coordinate for each CORWSN.
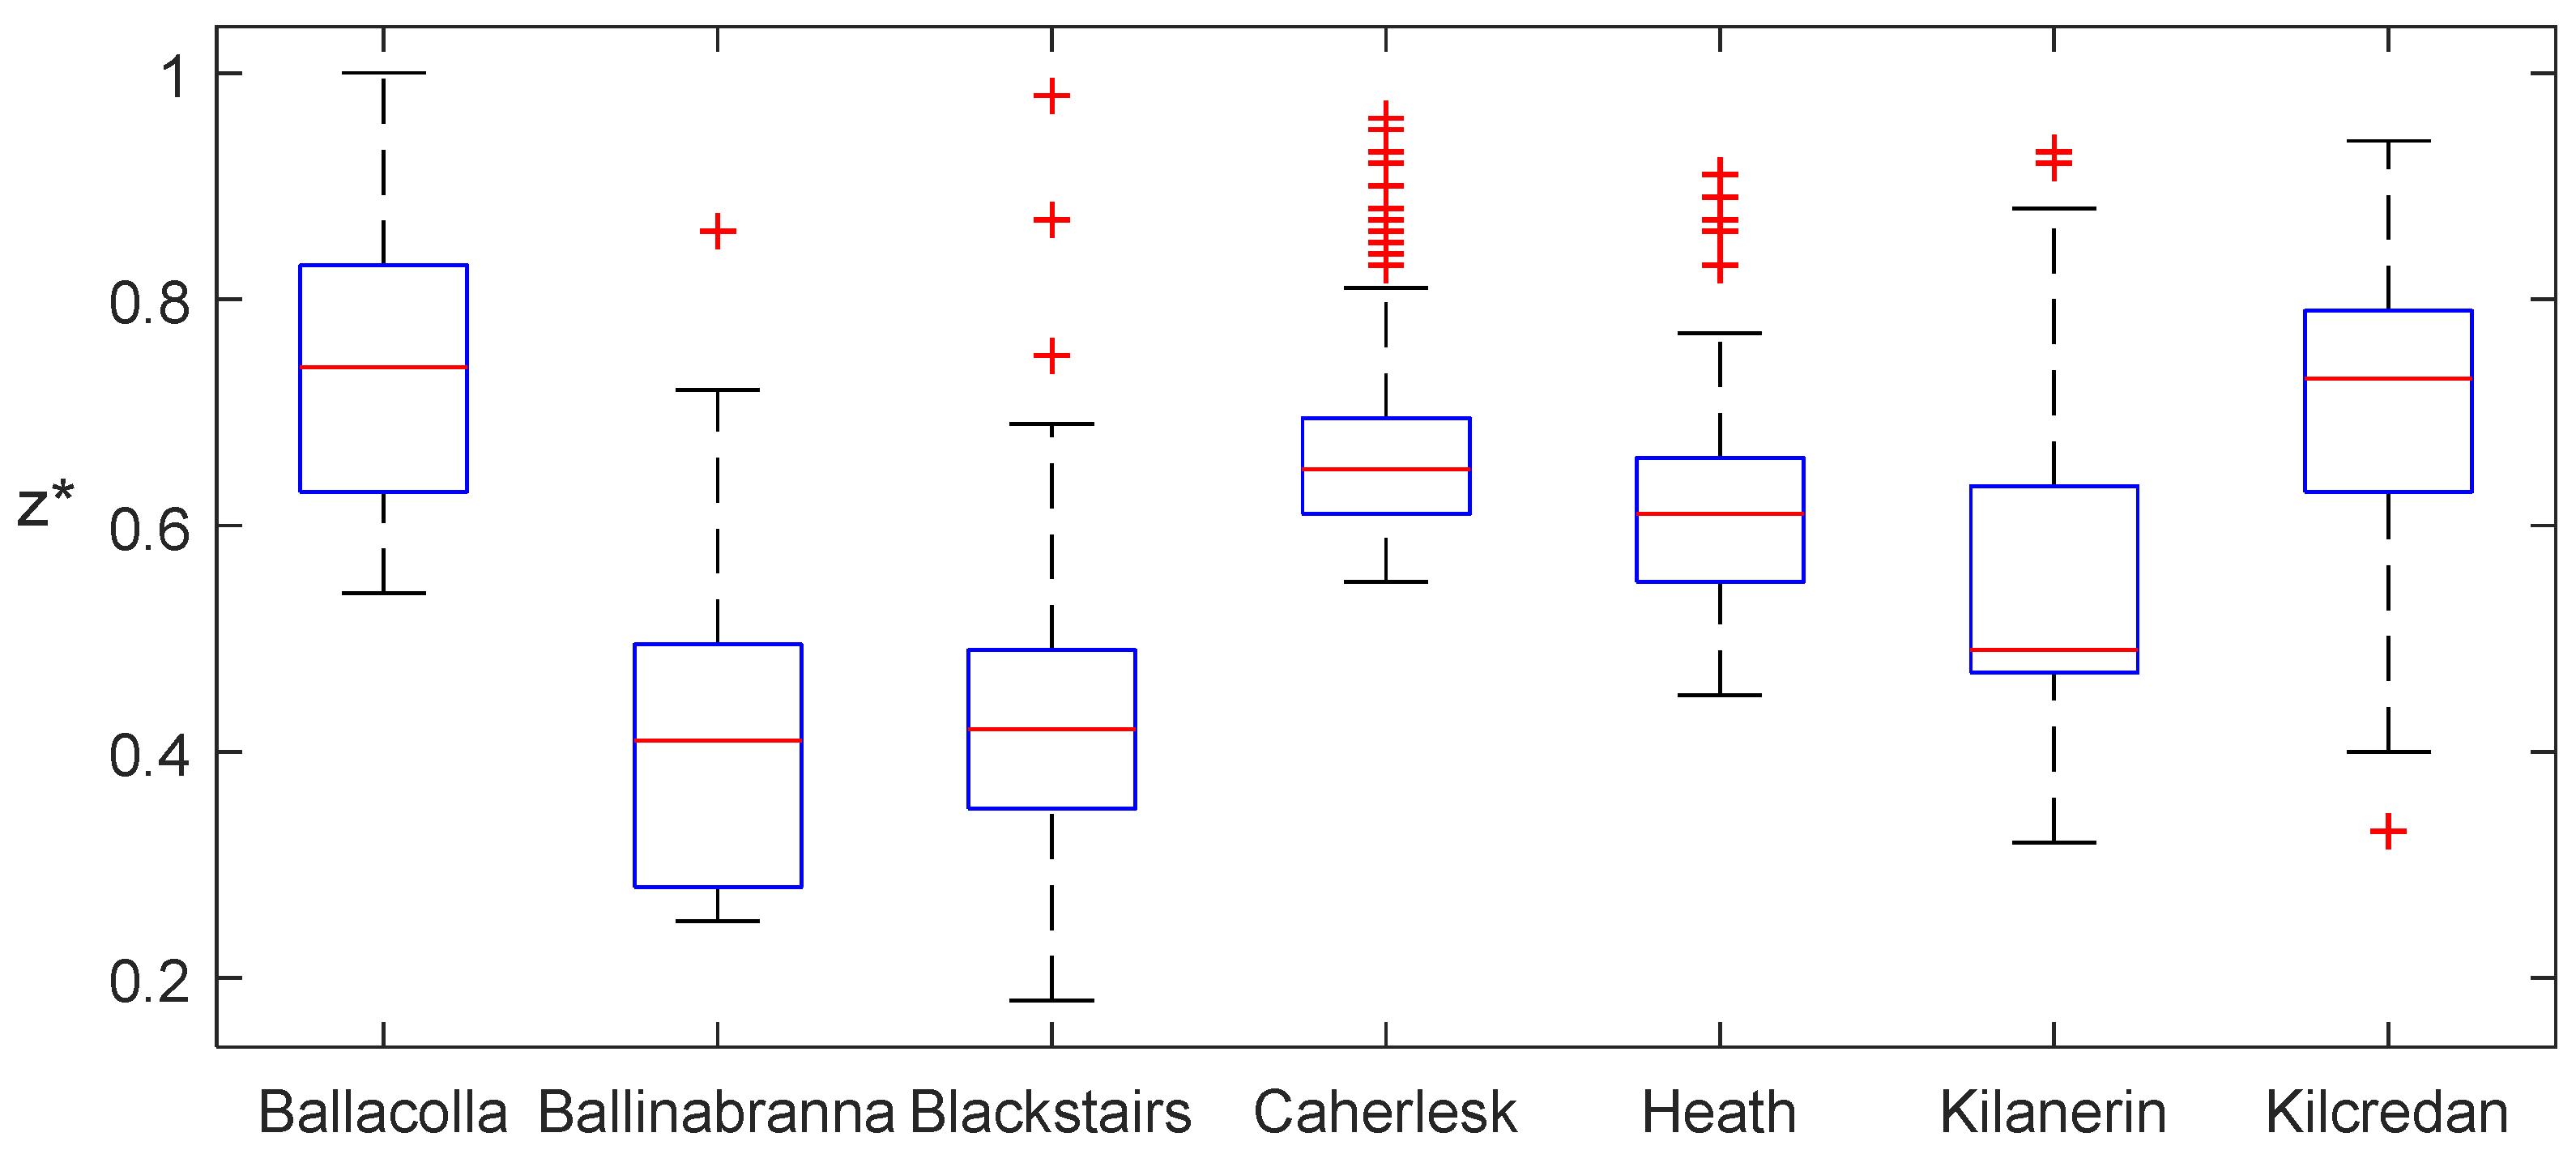
Figure 3.
Flow and pressure at each PAT replacing the existing PRVs/BPTs in the network, Scenario 1 (a) or at the new proposed sites, Scenario 2 (b).
Figure 3.
Flow and pressure at each PAT replacing the existing PRVs/BPTs in the network, Scenario 1 (a) or at the new proposed sites, Scenario 2 (b).
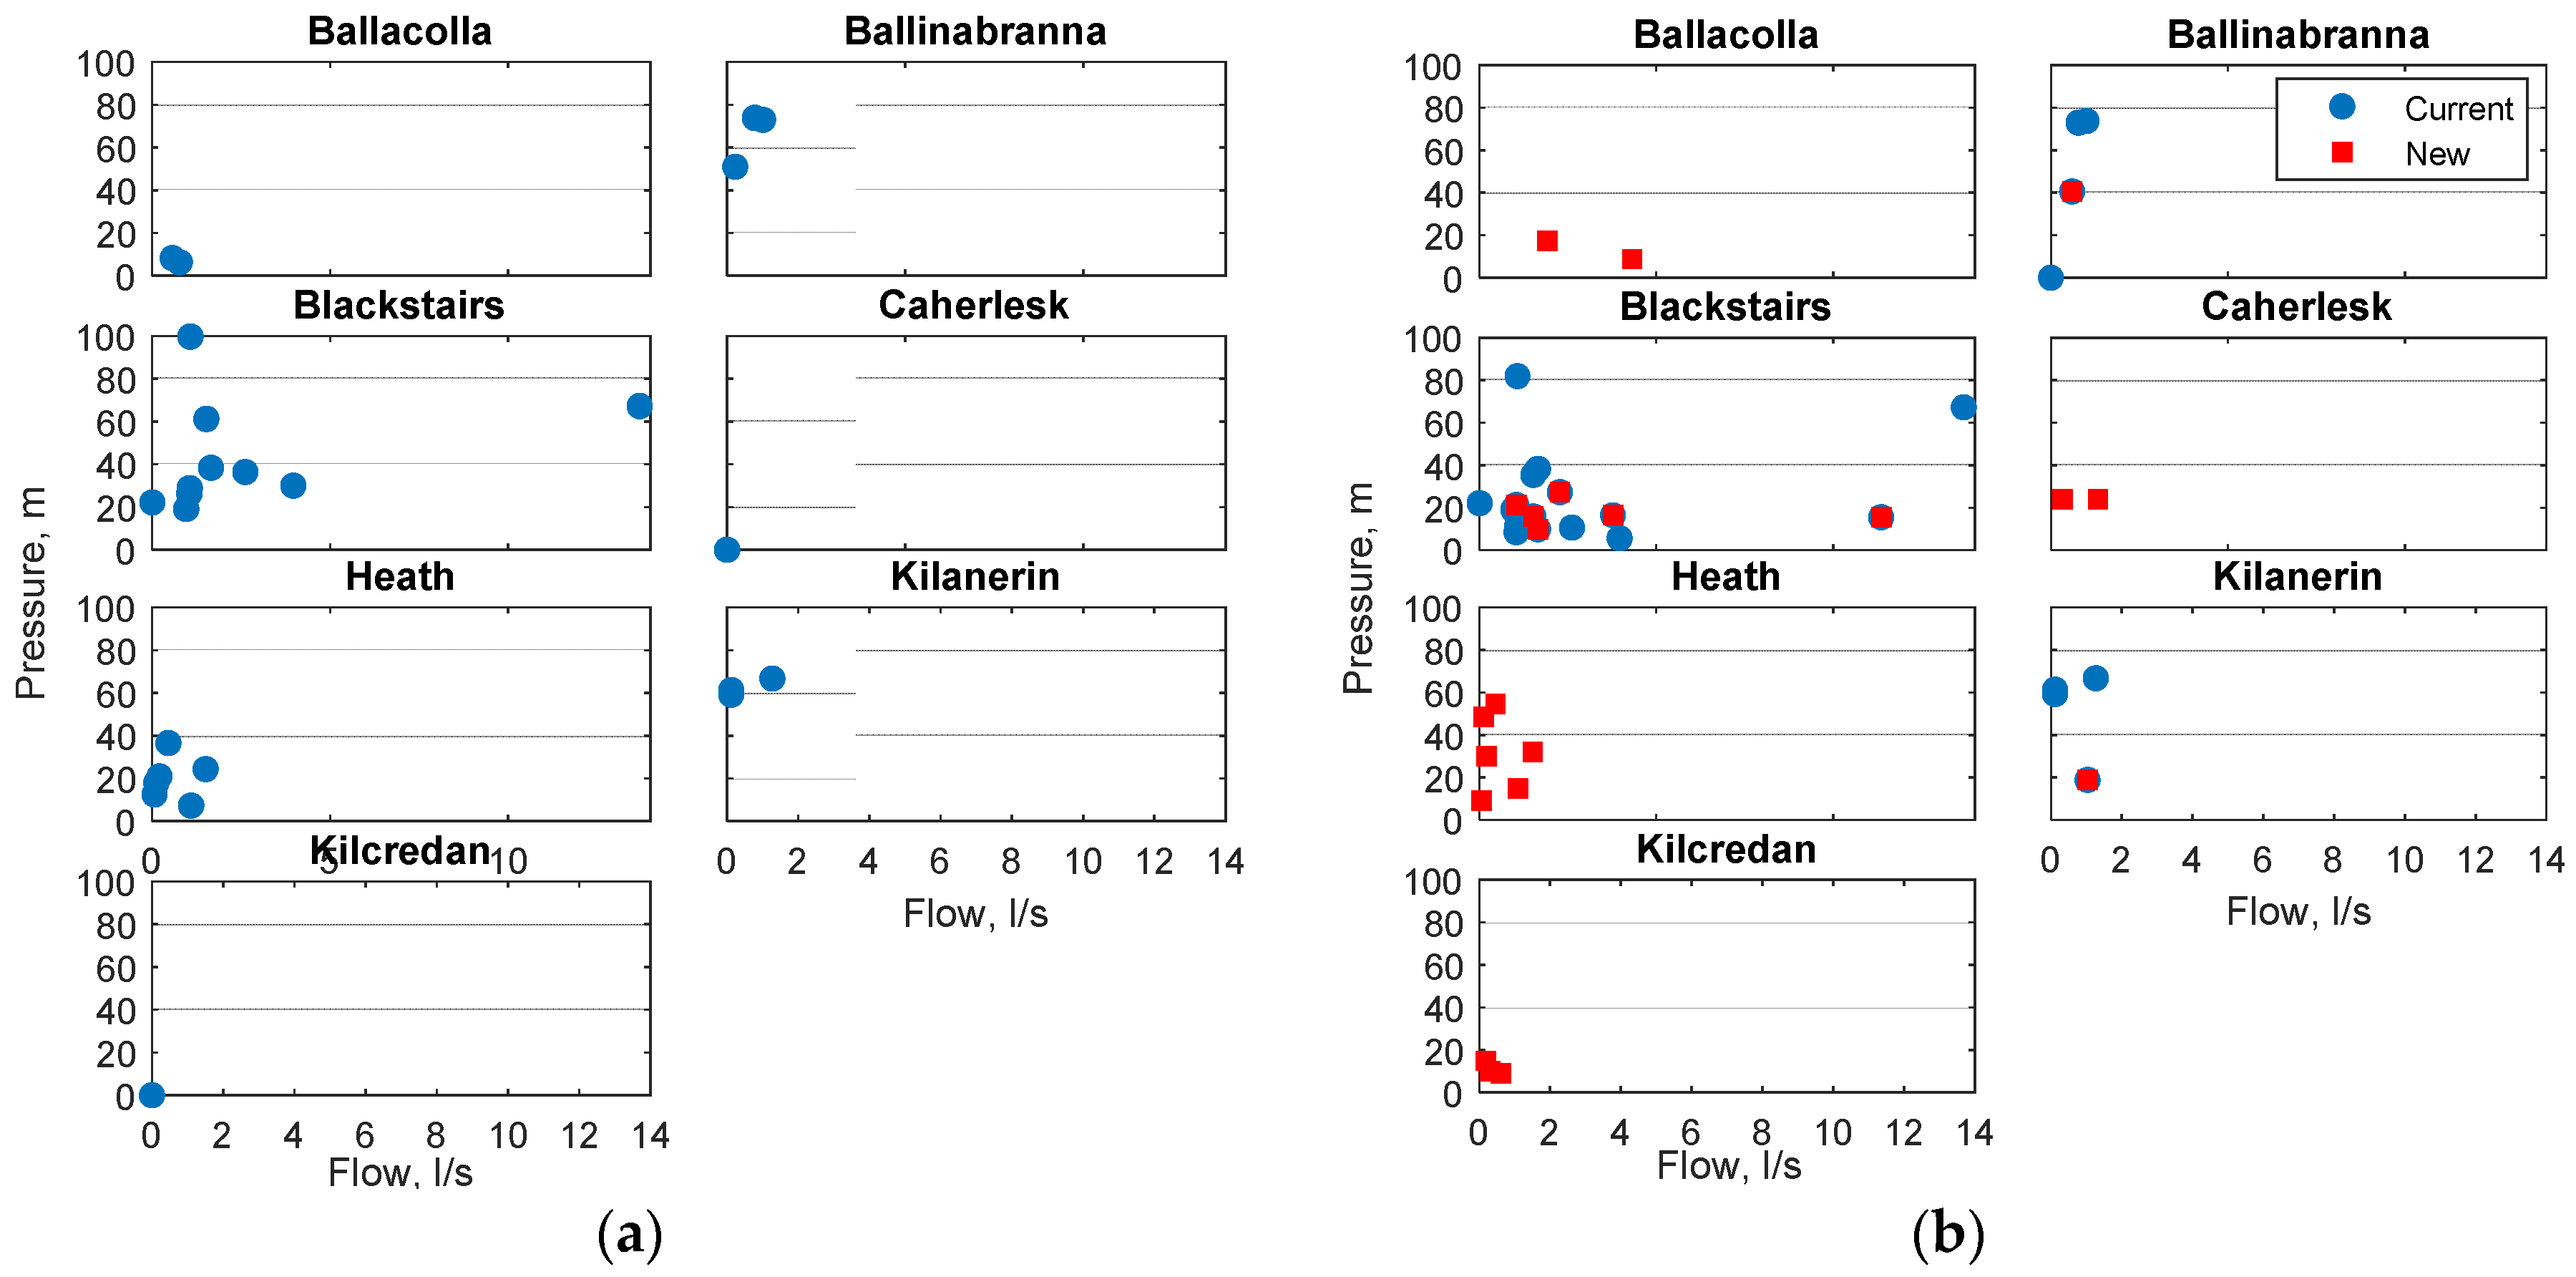
Figure 4.
Hydropower potential indicator at each CORWSN in Scenario 1 and Scenario 2.

Figure 5.
Water saving and water cost saving in each CORWSN in Scenario 2.


Table 1.
Main data of the selected CORWSNs.
| Average Flow (L s−1) | Consumption Nodes | Head (m) | Node Elevation, Min (m a.s.l.) | Node Elevation, Max (m a.s.l.) | PRV (Number) | BPT (Number) | |
|---|---|---|---|---|---|---|---|
| Ballacolla | 7.03 | 49 | 145 | 79 | 145 | 2 | 0 |
| Ballinabranna | 2.02 | 44 | 190 | 47 | 164 | 3 | 0 |
| Blackstairs | 13.76 | 122 | 277 | 51 | 271 | 3 | 8 |
| Caherlesk | 2.40 | 150 | 120 | 66 | 115 | 0 | 0 |
| Heath | 3.07 | 70 | 180 | 81 | 164 | 6 | 0 |
| Kilanerin | 1.76 | 27 | 190 | 60 | 176 | 2 | 1 |
| Kilcredan | 1.70 | 45 | 87 | 29 | 82 | 0 | 0 |
Publisher’s Note: MDPI stays neutral with regard to jurisdictional claims in published maps and institutional affiliations. |
© 2018 by the authors. Licensee MDPI, Basel, Switzerland. This article is an open access article distributed under the terms and conditions of the Creative Commons Attribution (CC BY) license (https://creativecommons.org/licenses/by/4.0/).
Share and Cite
MDPI and ACS Style
García, I.F.; Ferras, D.; McNabola, A. Potential Micro-Hydropower Generation in Community-Owned Rural Water Supply Networks in Ireland. Proceedings 2018, 2, 677. https://doi.org/10.3390/proceedings2110677
AMA Style
García IF, Ferras D, McNabola A. Potential Micro-Hydropower Generation in Community-Owned Rural Water Supply Networks in Ireland. Proceedings. 2018; 2(11):677. https://doi.org/10.3390/proceedings2110677
Chicago/Turabian StyleGarcía, Irene Fernández, David Ferras, and Aonghus McNabola. 2018. "Potential Micro-Hydropower Generation in Community-Owned Rural Water Supply Networks in Ireland" Proceedings 2, no. 11: 677. https://doi.org/10.3390/proceedings2110677