Investigation of Peak Water Consumption Variability at Local Scale in Puglia (Southern Italy) †
by
 , ,
, ,
Gabriella Balacco
1,* ,
,
Antonio Carbonara
2, 
Andrea Gioia
1,
Vito Iacobellis
1 and
Alberto Ferruccio Piccinni
1 1
Dipartimento di Ingegneria Civile, Ambientale, del Territorio, Edile e di Chimica, Politecnico di Bari, 70125 Bari, Italy
2
Acquedotto Pugliese S.p.A., 70121 Bari, Italy
*
Author to whom correspondence should be addressed.
†
Presented at the 3rd EWaS International Conference on “Insights on the Water-Energy-Food Nexus”, Lefkada Island, Greece, 27–30 June 2018.
Proceedings 2018, 2(11), 674; https://doi.org/10.3390/proceedings2110674
Published: 30 July 2018
(This article belongs to the Proceedings of EWaS3 2018)
Abstract
:In this study an analysis of the water supply variability for three towns in Puglia (Southern Italy), Roccaforzata, Palagianello and Palagiano was carried out, based on a time series continuously recorded over three years. The towns’ population ranges between 1800 and 16,000 inhabitants and the flow data, collected with time steps of 10 min, are referred to drinking water in urban environment. In particular the frequency analysis on the series of daily maximum hourly peak coefficients, calculated using the observed dataset, was conducted in order to assess the stochastic behavior of the hourly peak water demand at local scale.
1. Introduction
The peak water demand for drinking water use is the most onerous operating condition for a water distribution system (WDS). The peak water demand is a crucial aspect to be taken into account for the design of WDSs [1]. The maximum water demand during a day is a complex phenomenon influenced by many factors like climate, socioeconomic aspects, cultural habits, water supply policies, pricing policies etc.
The peak coefficient is usually higher in small communities than in large ones while in very large centers water demand tends to be constant in time and close to its average [2].
Several deterministic expressions are available from technical literature for the design of WDSs accounting for the fluctuation in water demand. However, recently studies have demonstrated how most of these relationships, rather dated, overestimate widely the current peak coefficients [2,3,4,5] due to latest social and economic aspects.
Traditionally, water demand is considered as being deterministic. A similar assumption worked relatively well in the past, since the major part of the studies on water demands were conducted only with the objective of quantifying global demands, both on the present and on the long-term [6]. Several studies showed the temporal variability of the water demand in different points of a water distribution network (WDN) e.g., [7,8].
However, taking in consideration all the aforementioned factors that influence water use, it is obvious that the drinking water demand is not a deterministic process, but rather a stochastic one. Nowadays the research is addressed to instantaneous water demands and their stochastic behavior. The technical literature is focused on two different problems concerning the representation of water drinking demand. The former is how to model their time series and consequently the more appropriate level of spatial-temporal aggregation, the latter how transfer the information of water demand collected at certain nodes to the whole WDN [9].
Technical literature proposes several stochastic models describing the water demand. Buchberger and Wu [10] showed how residential water demand can be represented with rectangular pulses which correspond with arrival time over the day, intensity and duration of water demands. A Poisson rectangular pulse (PRP) model can be applied to describe this phenomenon [11,12,13,14].
Alvisi et al. [9] proposed a model analogous to the PRP model based on a Neyman-Scott stochastic process.
However, many measurements are necessary to obtain the PRP parameters and moreover the retrieved PRP parameters lead to mainly short pulses of 1 min or less [15]. Furthermore, it was demonstrated that when the number of the users is greater than two hundred, the water demand can be represented by means of a single random variable that is continuous and positive, because the trend of the daily water demand becomes smooth and the single pulses are barely distinguishable [16].
Starting from this consideration, Vertommen et al. [17] proposed an approach for the establishment of different demand scenarios and the mathematical determination of their probability of occurrence. They modelled water demand as a stochastic variable, with a certain mean and variance, but also considering a certain correlation between demands at different nodes.
Tricarico et al. [18] proposed probabilistic models to obtain a good estimation of the residential peak water demand. They analyzed the drinking water demand for a small town near Frosinone (Italy), concluding that the classic literature expressions for the estimate of the peak coefficient led to a significant overestimation of the real value detected in the network under study; at the same time they proposed to describe the extreme events (the population of peak coefficients) by means of the Log-Normal distribution (LN) and Gumbel distribution. Moreover, Gargano et al. [19] applied the Log-Logistic model to describe the daily maximum water demand.
In this context the proposed research is focused on the analysis of water consumption variability of three towns located in Puglia (Southern Italy), using a continuous series of water consumption flow data collected for two years (2015 and 2016); moreover the daily maximum hourly peak coefficients extracted from the observed dataset were used for investigating and assessing the stochastic behavior of the peak water demand at local scale.
2. Dataset Analysed
In this study instantaneous flow data of water consumption were exploited, collected at time steps of 10 min, for two years (2015 and 2016) for three towns located in Puglia (Southern Italy): Pagiano, Palagianello and Roccaforzata. The towns’ population ranges between approximately 16,000 inhabitants of Palagiano and 1800 for Roccaforzata. The flow data are related only to drinking water demand and to urban water consumption.
The flow data were extracted from the flow meters positioned on feeding pipes of networks and collected by the remote control of the Acquedotto Pugliese (Puglia Aqueduct, AQP in the following lines) which supplies the drinking needs and manages the whole WDN of Puglia.
The instantaneous flow data enabled to carry out a series of thoughts on the daily, weekly and monthly variability of water demand for the above towns.
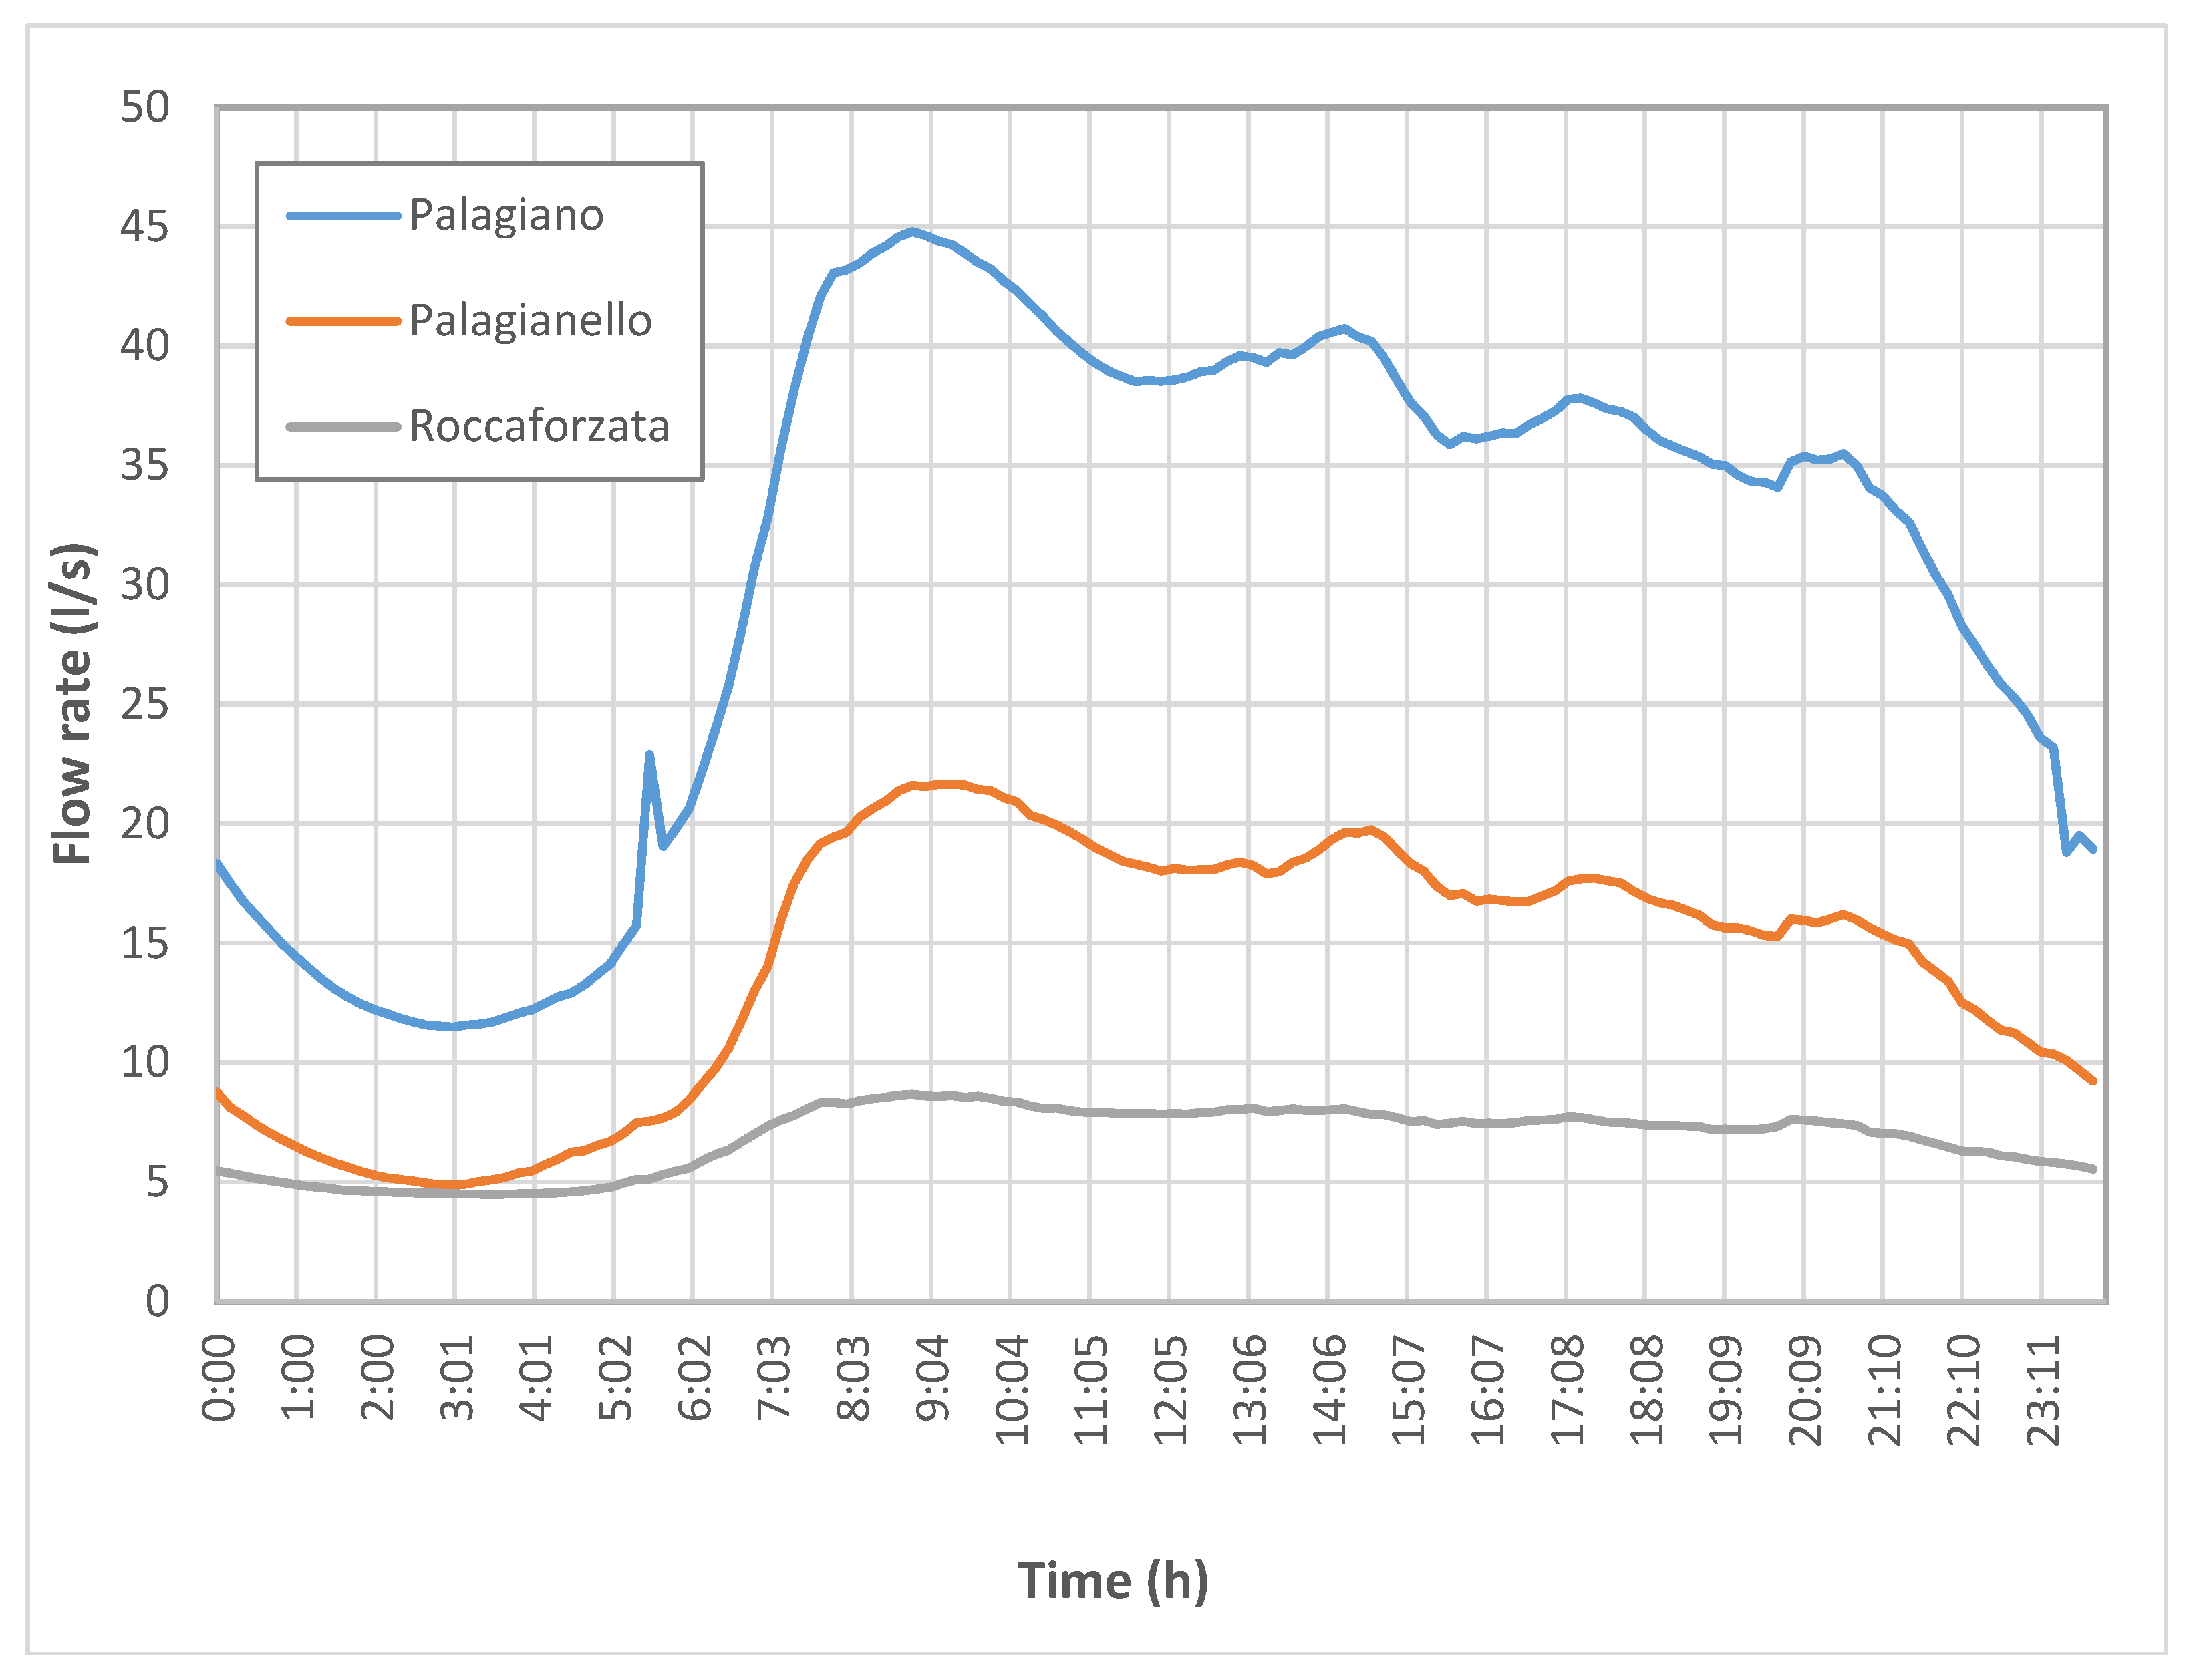
As expected, an analysis of the two years observed data revealed the existence of patterns in which it is possible to identify daily periodicities in hourly water demands as well as weekly periodicities in daily water demands. The daily variability is strongly influenced by the habits of a population, the innumerable activities of the inhabitants lead to define a water demand pattern, function of the different hours of the day, where it is possible to identify several peaks.
Figure 1 shows the typical daily demand pattern for each municipality. An analysis of this graph highlights how the consumption trend is very similar for every town. Minimum consumption is observed during the night (1.00–6.00), a peak of water demand can be observed in the morning (7.30–9.30) and three further peaks are present respectively at the lunch (1.00 p.m.–3.00 p.m.), getting home from work (16.30–18.00) and at the dinner time (19.30–21.30). Very interesting is the singular peak in the morning (5.00–6.00) for Palagiano due probably to the dominant economy activity.
Moreover, it is interesting to observe how in the two investigated years, four of the six days with the maximum water consumption for each municipality, one for each year, occur during the winter months; two, in particular, coincide with the New Year’s Eve and two occur in January. In addition, three of the six days occur on Sunday (Table 1).
Analyzing data, it is possible to observe a moderate variation during the week (Figure 2). This different water demand pattern for the days of a week may be due to the habits and to the economical dominant activities of the inhabitants, which vary depending on the day of the week (working-weekend). Below are the graphs with the weekly consumption variation for the three municipalities.
In particular, it can be observed how the maximum value of water demand is reached at the same time and with the same intensity from Monday to Friday (between 7.30 a.m. and 9.30 a.m.), while during the weekend the maximum value of water demand is slightly delayed (between 8.30 a.m. and 10.30 a.m.). The overall maximum value of water demand occurs on Sunday morning, instead the water demand trend becomes the more uniform during the remains of the day. On the other hand, in terms of average daily water demand, it can be observed how the day with the maximum water needs is the Saturday for every of three investigated towns.
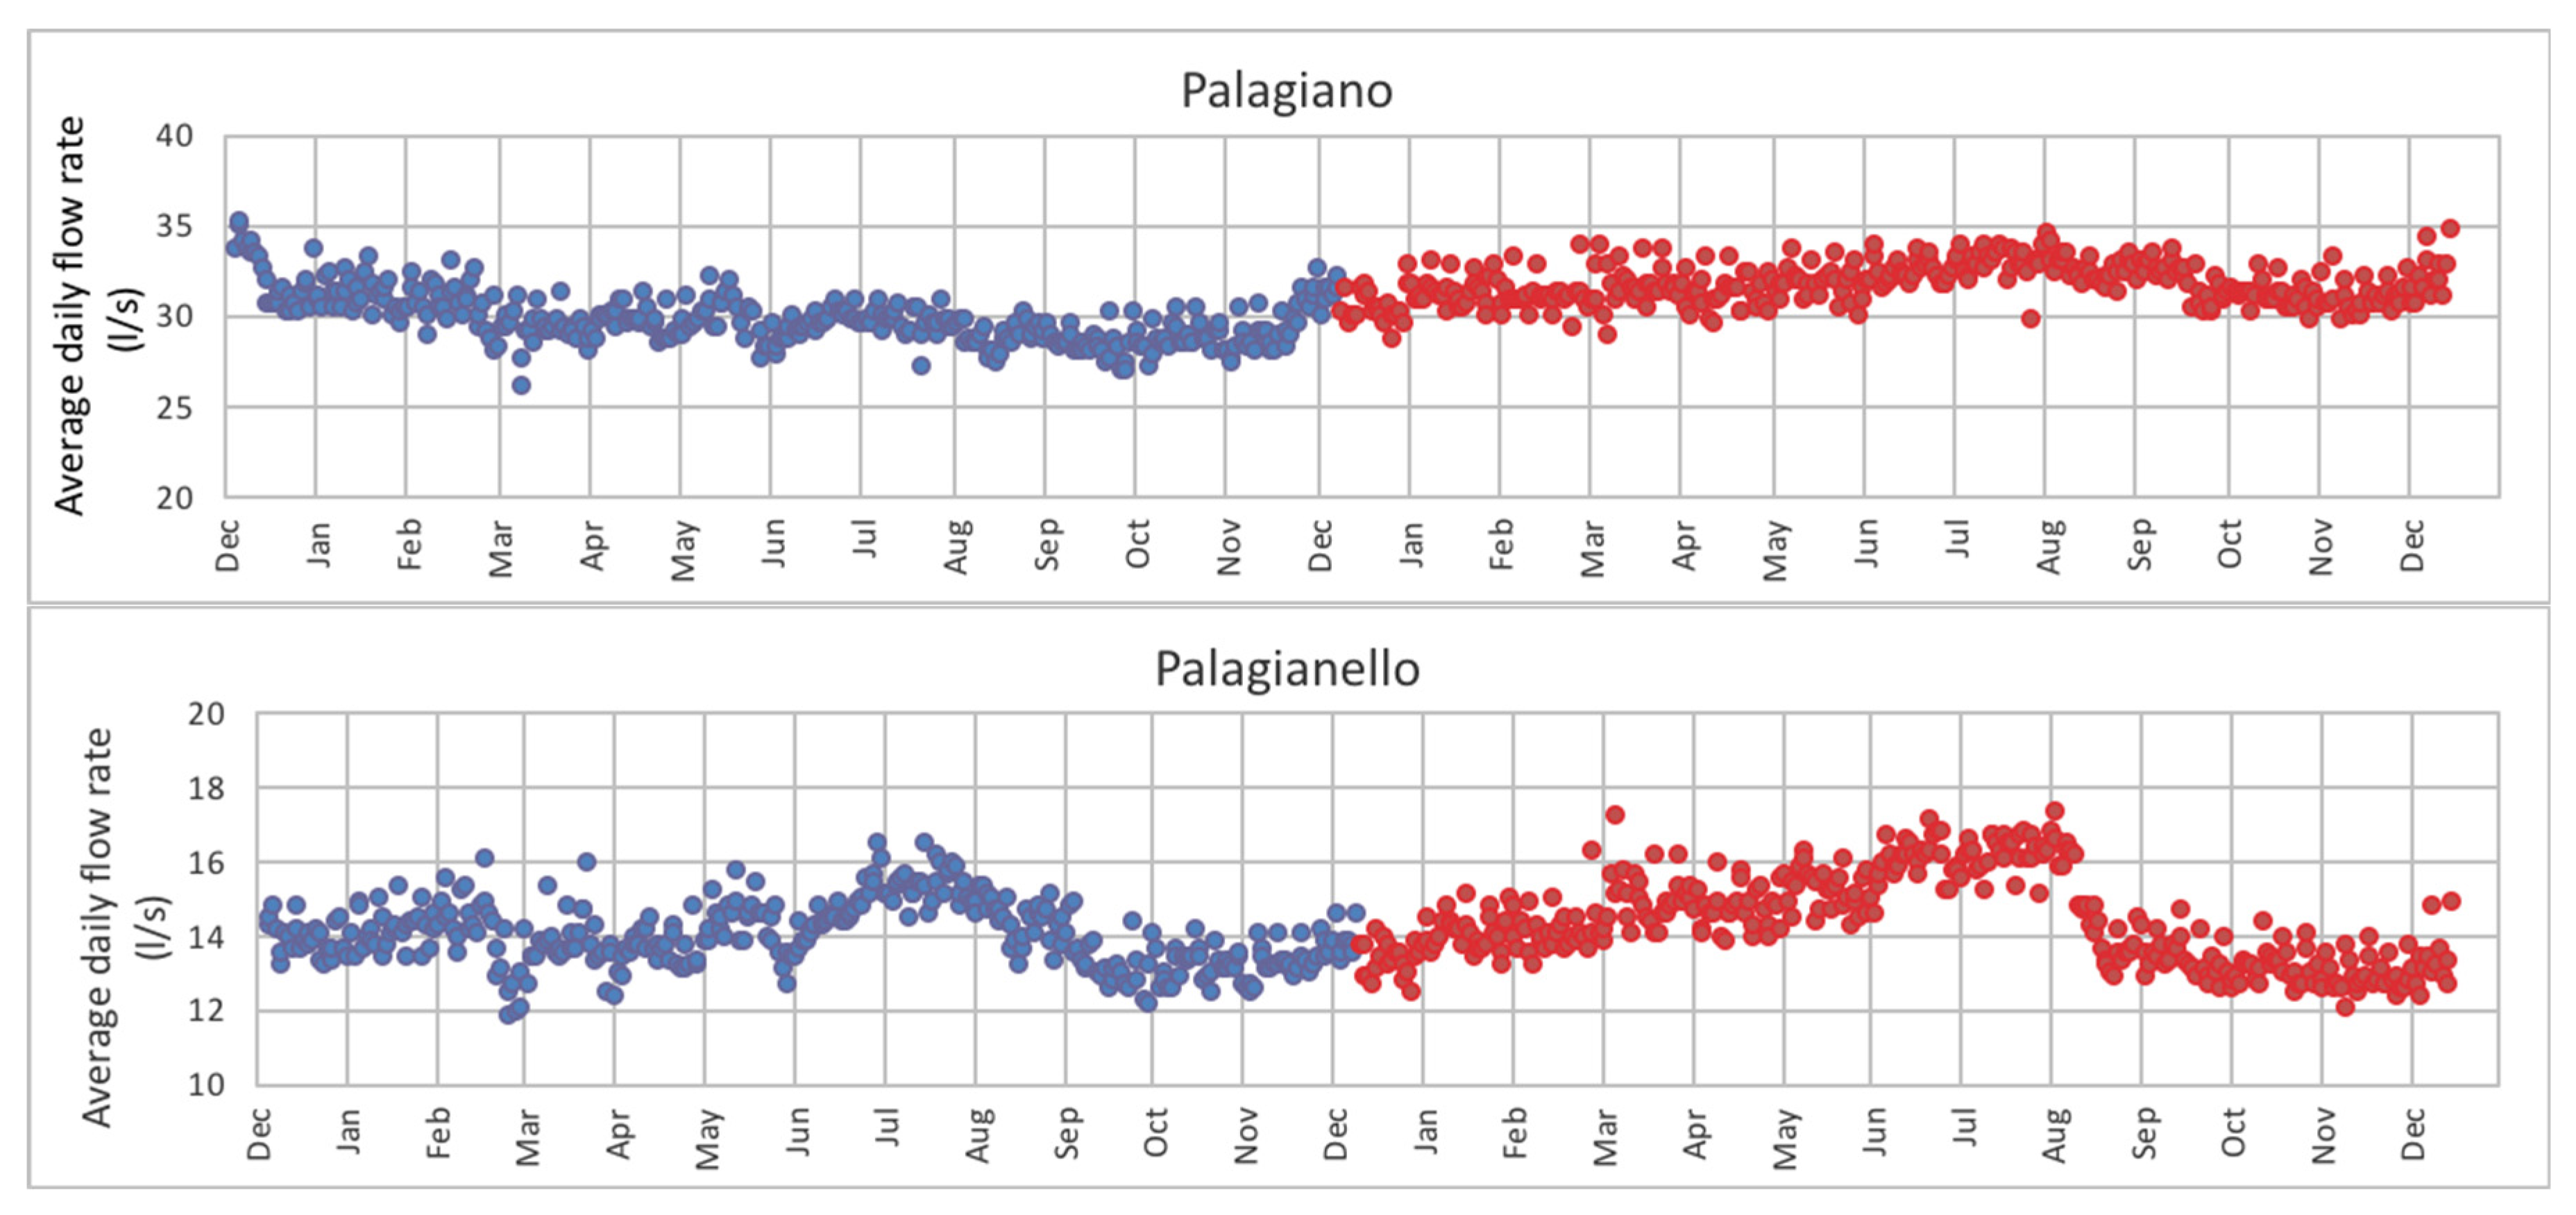
Water demand is also variable during the year, as can be seen from the graphs below, which show respectively the average daily flow rates for the three municipalities, distinguishing them between 2015 and 2016.
In more detail, Palagiano shows a different trend for the two observation years (Figure 3): from January 2015 until October 2015 water needs tend to decrease, and then grow again until August 2016, between September and November 2016 there is another decrease followed by a high increase in December 2016.
For Palagianello the water demand trend is very different from the previous one, as can be seen from the graph below. Analyzing the data for the municipality of Roccaforzata, there is overall a linear increase in consumption, perhaps due to an increase in population between 2015 and 2016, from 1804 to 1827 people. Moreover, there is a considerable increase in consumption between December and January, during the Christmas holidays, evidently due to an increase in users during that period. For both years, between January and February, consumption is almost constant, whereas it increases again, almost linearly, from March to August. There is a new decrease in September which tends to increase going towards December.
3. Data Analysis with a Probabilistic Approach
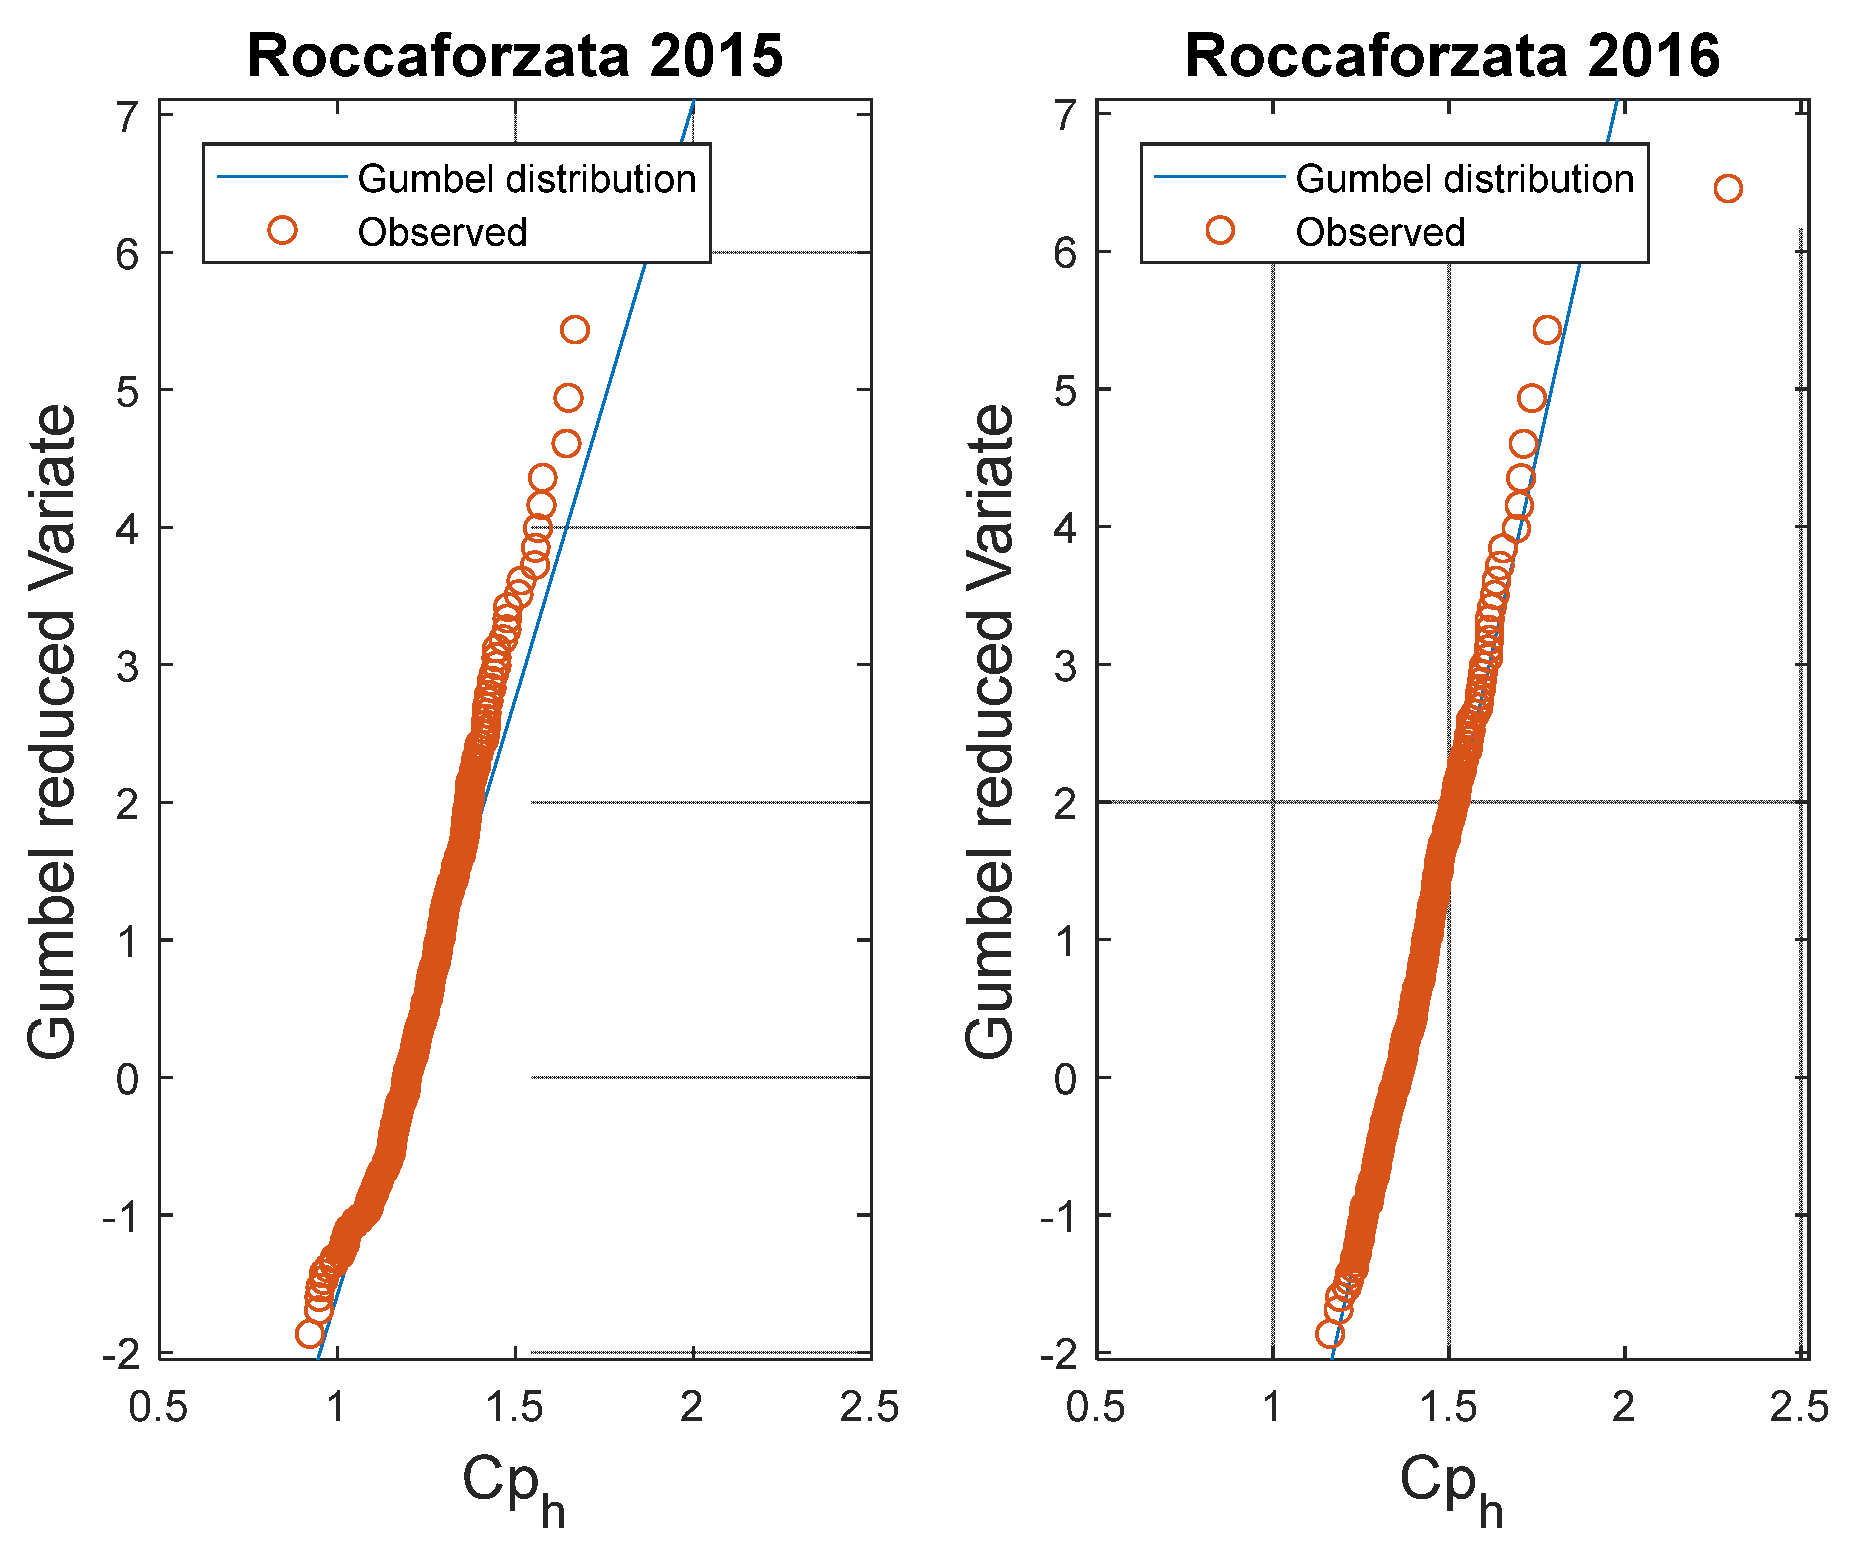
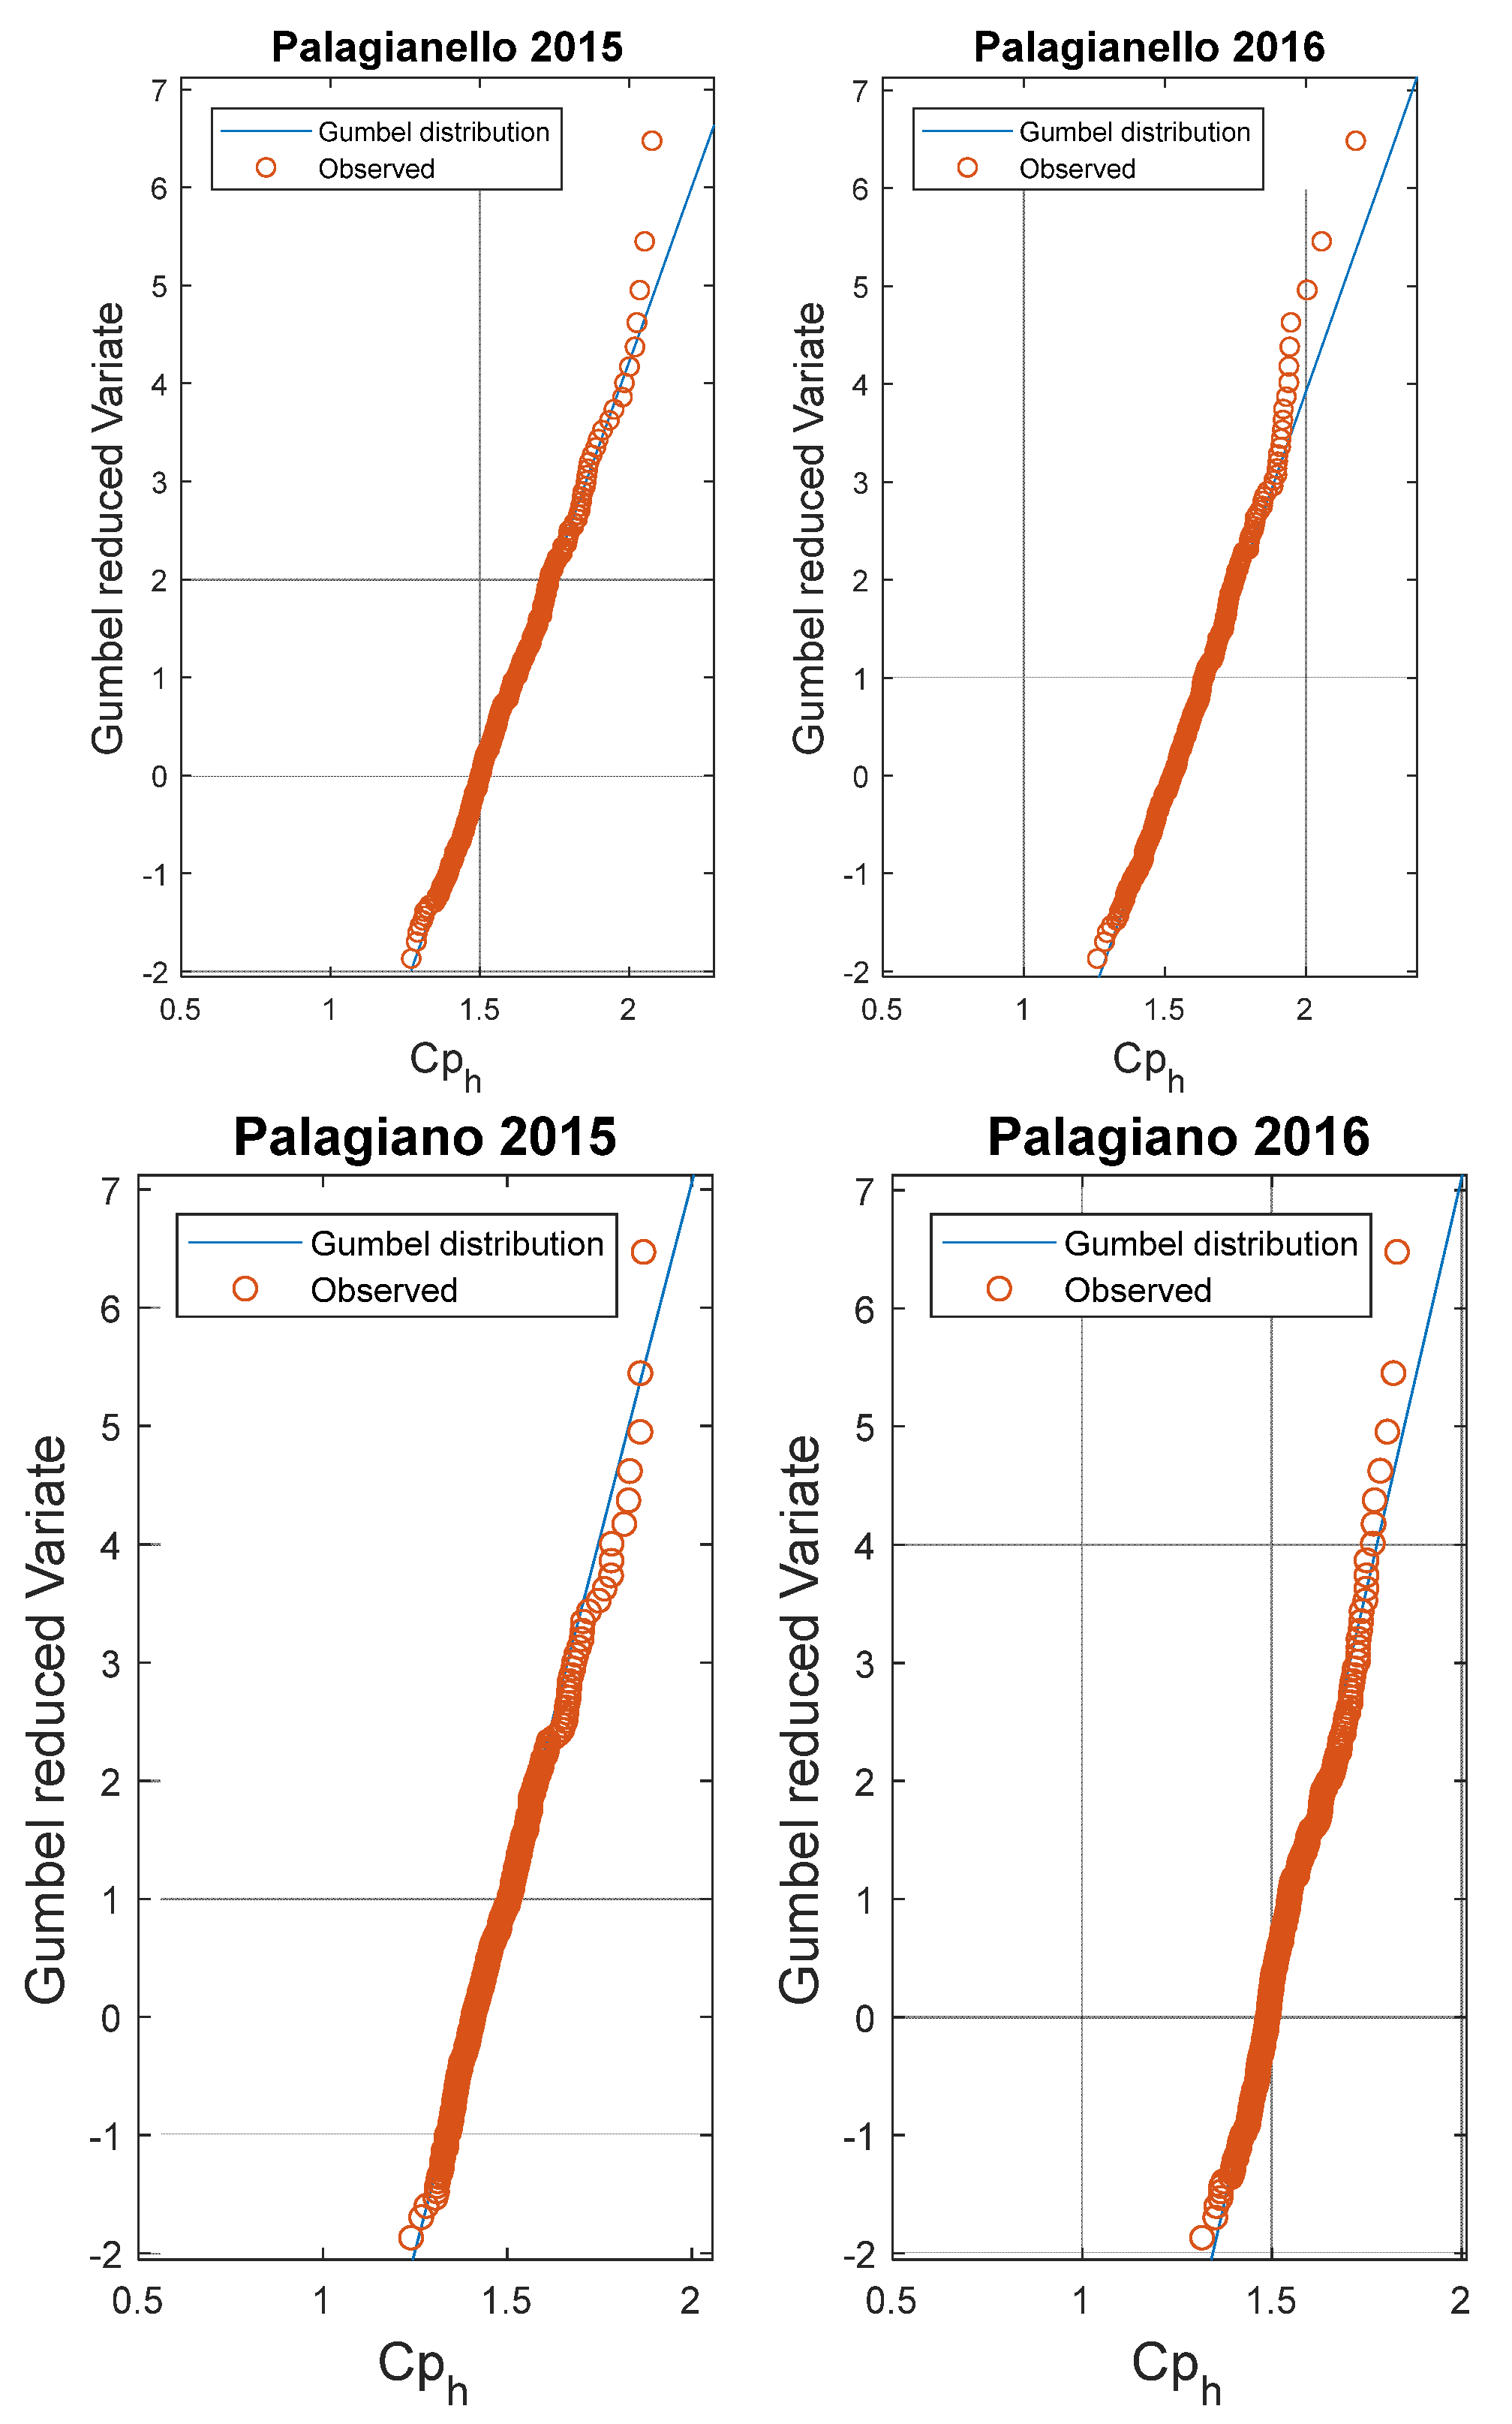
Given the random nature of the factors that influence the peak water demand phenomena, it seems appropriate to consider the peak coefficients as random variables and then to study and to characterize them through a probabilistic approach. Recent scientific studies, aimed at determining new relationships to estimate the peak coefficient, use this type of approach to characterize the peak coefficient [18]. In particular, it has been shown that both the log-normal law and the Gumbel law were able to represent the trend of the peak coefficient for a small town of about 1200 inhabitants.
To this end, for each of the three considered towns, it was estimated the hourly peak coefficient how defined in the following expression:
where Qmax(h) is the daily maximum of the hourly flow rate and Qm is the average annual daily flow and the observed values were compared with each annual series of data available with those deriving from the application of the Gumbel law.
It can be observed how the peak coefficient is distributed according to the Gumbel model. The results of Kolmogorov–Smirnov test, using a level of significance equal to 5%, are positive in every case. The results for each annual series and each town are shown below in Gumbel’s probabilistic map (Figure 4). The parameters required for the presented models are the mean value, μ, and the standard deviation, σ. These have both been estimated from the data collected and their values are shown in Table 2 in relation to the number of users and the year of the observation data.
4. Conclusions
In the last few decades, the demand for freshwater has been increasing significantly in many areas of the world, due to the growth of population, energy demand, changes in lifestyle, eating habits and land use. Freshwater is primarily used for irrigation, which is responsible for 70% of water abstractions worldwide; further increase in water demand is also expected for industrial use and energy production. Improving living standards and urbanization as well as changes in the global food system also contribute to the rising demand. Systems of water supply are also expected to be affected by fluctuations of climate and changes in variability of temperature and precipitation. In this context global or local variations of spatial and temporal dynamics of the water cycle may greatly increase the gaps between water supply and water demand.
In this study instantaneous flow data of water consumption were exploited, collected at time steps of 10 min, for two years (2015 and 2016) for three towns located in Puglia (Southern Italy): Pagiano, Palagianello and Roccaforzata. As expected, an analysis of the two years observed data revealed the existence of patterns in which it is possible to identify daily periodicities in hourly water demands as well as weekly periodicities in daily water demands.
In particular the consumption trend is very similar for the three investigated towns: at hourly scale minimum consumption is observed during the night, a peak of water demand can be observed in the morning and three further peaks are present respectively at the lunch, in the afternoon and at the dinner time; at daily scale it is possible to observe a moderate variation during the week (Figure 2); this may be due to the habits and to the economical dominant activities of the inhabitants, which vary depending on the day of the week (working-weekend); it is interesting to observe the maximum value of water demand on Sunday morning, remaining the water demand trend quite uniform during the rest of the day.
Finally, the frequency analysis conducted on hourly peak coefficient confirmed the Gumbel distribution able to represent the stochastic behavior of the peak water demand; in fact the results of Kolmogorov–Smirnov test, using a level of significance equal to 5%, gave positive results in every case.
Author Contributions
The authors’ contributions are parithetic.
Acknowledgments
The authors thank AQP for providing water demand data. In addition, the authors thank the anonymous Reviewers for their valuable comments.
Conflicts of Interest
The authors declare no conflict of interest.
References
- Tricarico, C.; Morley, M.S.; Gargano, R.; Kapelan, Z.; de Marinis, G.; Savic, D.A. The influence of the existing network layout on water distribution system redesign analysis. J. Hydroinform. 2014, 16, 1375–1389. [Google Scholar] [CrossRef]
- Balacco, G.; Carbonara, A.; Gioia, A.; Iacobellis, V.; Piccinni, A.F. Evaluation of Peak Water Demand Factors in Puglia (Southern Italy). Water 2017, 9, 96. [Google Scholar] [CrossRef]
- Zhang, X.; Buchberger, S.; Van Zyl, J. A theoretical explanation for peaking factors. In Proceedings of the ASCE EWRI Conferences, Anchorage, AK, USA, 15–19 May 2005. [Google Scholar]
- Gargano, R.; Tricarico, C.; de Marinis, G. Residential water demand—Daily trends. In Proceedings of the Annual International Symposium on Water Distribution Systems Analysis, Tucson, Arizona, September 12-15, 2010; pp. 1314–1323. [Google Scholar] [CrossRef]
- Gato-Trinidad, S.; Gan, K. Characterizing maximum residential water demand. Urban Water 2012, 122, 15–24. [Google Scholar]
- Vertommen, I.; Magini, R.; da Cunha, M.C.; Guercio, R. Water Demand Uncertainty: The Scaling Laws Approach. In Water Supply System Analysis—Selected Topics; Ostfeld, A., Ed.; InTech: London, UK, 2012; pp. 105–112. [Google Scholar]
- Imoke, D. Spatio-temporal variability in domestic water demand and supply in Calabar Metropolis. IJRES 2015, 1, 20–29. [Google Scholar]
- Shamir, U. Optimal design and operation of water distribution systems. Water Resour. Res. 1974, 10, 27–36. [Google Scholar] [CrossRef]
- Alvisi, S.; Franchini, M.; Marinelli, A. A Stochastic Model for Representing Drinking Water Demand at Residential Level. Water Resour. Manag. 2003, 17, 197. [Google Scholar] [CrossRef]
- Buchberger, S.G.; Wu, L. Model for instantaneous residential residential water demands. J. Hydraul. Eng. 1995, 121, 232–246. [Google Scholar] [CrossRef]
- Buchberger, S.G.; Wells, G.J. Intensity, duration and frequency of residential water demands. J. Water Resour. Plan. Manag. 1996, 122, 11–19. [Google Scholar] [CrossRef]
- Guercio, R.; Magini, R.; Pallavicini, I. Instantaneous residential water demand as stochastic point process. Water Resour. Manag. 2001, 25–53. [Google Scholar] [CrossRef]
- Alcocer-Yamanaka, V.H.; Tzatchkov, V.G.; Buchberger, S.G. Instantaneous water demand parameter estimation from coarse meter readings. In Proceedings of the Eighth Water Distribution Systems Analysis Symposium, Reston, VA, USA, 27–30 August 2006. [Google Scholar]
- Blokker, E.J.M.; Vreeburg, J.H.G.; Buchberger, S.G.; van Dijk, J.C. Importance of demand modelling in network water quality models: A review. Drink Water Eng. Sci. Dis. 2008, 1, 27–38. [Google Scholar] [CrossRef]
- Blokker, E.J.M.; Vreeburg, J.H.G.; van Dijk, J.C. Simulating Residential Water Demand with a Stochastic End-Use Model. J. Water Resour. Plan. Manag. 2010, 136, 19–26. [Google Scholar] [CrossRef]
- Jankovic-Nisic, B.; Maksimovic, C.; Butler, D.; Graham, N.J.D. Use of Flow Meters for Managing Water Supply Networks. J. Water Resour. Plan. Manag. 2004, 130, 171–179. [Google Scholar] [CrossRef]
- Vertommen, I.; Magini, R.; da Cunha, M.C. Generating Water Demand Scenarios Using Scaling Laws. Procedia Eng. 2014, 70, 1697–1706. [Google Scholar] [CrossRef]
- Tricarico, C.; De Marinis, G.; Gargano, R.; Leopardi, A. Peak residential water demand. Water Manag. 2007, 60, 115–121. [Google Scholar] [CrossRef]
- Gargano, R.; Tricarico, C.; Granata, F.; Santopietro, S.; de Marinis, G. Probabilistic Models for the Peak Residential Water Demand. Water 2017, 9, 417. [Google Scholar] [CrossRef]
Figure 1.
Typical daily patterns in hourly water demand.

Figure 2.
Typical daily patterns in hourly water demand for the seven days of the week.

Figure 3.
Monthly pattern for the average daily flow rate.


Figure 4.
Comparison of experimental data and Gumbel distribution.


Table 1.
Days with the maximum water consumption.
| 2015 | 2016 | |||
|---|---|---|---|---|
| Day | Flow Rate (L/s) | Day | Flow rate (L/s) | |
| Palagiano | 03/01 | 35.07 | 31/12 | 34.49 |
| Palagianello | 24/07 | 16.49 | 20/08 | 17.30 |
| Roccaforzata | 31/12 | 8.48 | 23/01 | 10.06 |
Table 2.
Gumbel parameters for the corresponding observation data.
| 2015 | 2016 | ||||
|---|---|---|---|---|---|
| Inhabitants | μ | α | μ | α | |
| Palagiano | 16,067 | 1.46 | 0.11 | 1.52 | 0.09 |
| Palagianello | 7857 | 1.57 | 0.15 | 1.59 | 0.15 |
| Roccaforzata | 1827 | 1.24 | 0.12 | 1.40 | 0.11 |
Publisher’s Note: MDPI stays neutral with regard to jurisdictional claims in published maps and institutional affiliations. |
© 2018 by the authors. Licensee MDPI, Basel, Switzerland. This article is an open access article distributed under the terms and conditions of the Creative Commons Attribution (CC BY) license (https://creativecommons.org/licenses/by/4.0/).
Share and Cite
MDPI and ACS Style
Balacco, G.; Carbonara, A.; Gioia, A.; Iacobellis, V.; Piccinni, A.F. Investigation of Peak Water Consumption Variability at Local Scale in Puglia (Southern Italy). Proceedings 2018, 2, 674. https://doi.org/10.3390/proceedings2110674
AMA Style
Balacco G, Carbonara A, Gioia A, Iacobellis V, Piccinni AF. Investigation of Peak Water Consumption Variability at Local Scale in Puglia (Southern Italy). Proceedings. 2018; 2(11):674. https://doi.org/10.3390/proceedings2110674
Chicago/Turabian StyleBalacco, Gabriella, Antonio Carbonara, Andrea Gioia, Vito Iacobellis, and Alberto Ferruccio Piccinni. 2018. "Investigation of Peak Water Consumption Variability at Local Scale in Puglia (Southern Italy)" Proceedings 2, no. 11: 674. https://doi.org/10.3390/proceedings2110674