Comparing Air Temperature and Humidity in a Vestibule without and with Green Wall †


Faculty of Civil Engineering, Technical University of Kosice, 040 01 Kosice, Slovakia
*
Author to whom correspondence should be addressed.
†
Presented at the 3rd EWaS International Conference on “Insights on the Water-Energy-Food Nexus”, Lefkada Island, Greece, 27–30 June 2018.
Proceedings 2018, 2(11), 633; https://doi.org/10.3390/proceedings2110633
Published: 30 July 2018
(This article belongs to the Proceedings of EWaS3 2018)
Abstract
:The paper is a part of ongoing doctoral study focusing on interior green walls and their qualities. The paper describes living wall built in entrance hall in the laboratory of Technical University of Košice, its construction, irrigation and vegetation; the most important segments of every living wall. The research deals with effect of green wall on air temperature and humidity in the room and compares it with air temperature and humidity in the room without green wall.
Keywords:
green wall; sustainable construction; interior; climbing plants; humidity; air temperature1. Introduction
The mix of living natural frameworks portrayed by green dividers with the inorganic structures come to rule cutting edge building design hold the guarantee of “living” construction modeling. Living structural engineering is multi-disciplinary, blending the abilities of designers, scene draftsmen, specialists and horticulturalists.
Specialists [1,2] are focused on greening urban communities and structures and perceive that plants are an underutilized asset in the bigger green building development. Green walls for healthy cities are to expand the consciousness of the financial, social, and ecological advantages of living construction modeling crosswise all over the world and concentrate on propelling the improvement of the business sector for green divider items and administrations.
This article presents partial measurement of a dissertation that is a continuation of a dissertation thesis completed in 2017 about green roofs, their retention qualities and their impact on environment in a bigger city scale. This article following the dissertation thesis is focusing on the impact of green walls on environment in a smaller building scale. The principles of blue - green infrastructure are the same [1].
2. Materials and Methods
2.1. Green Wall
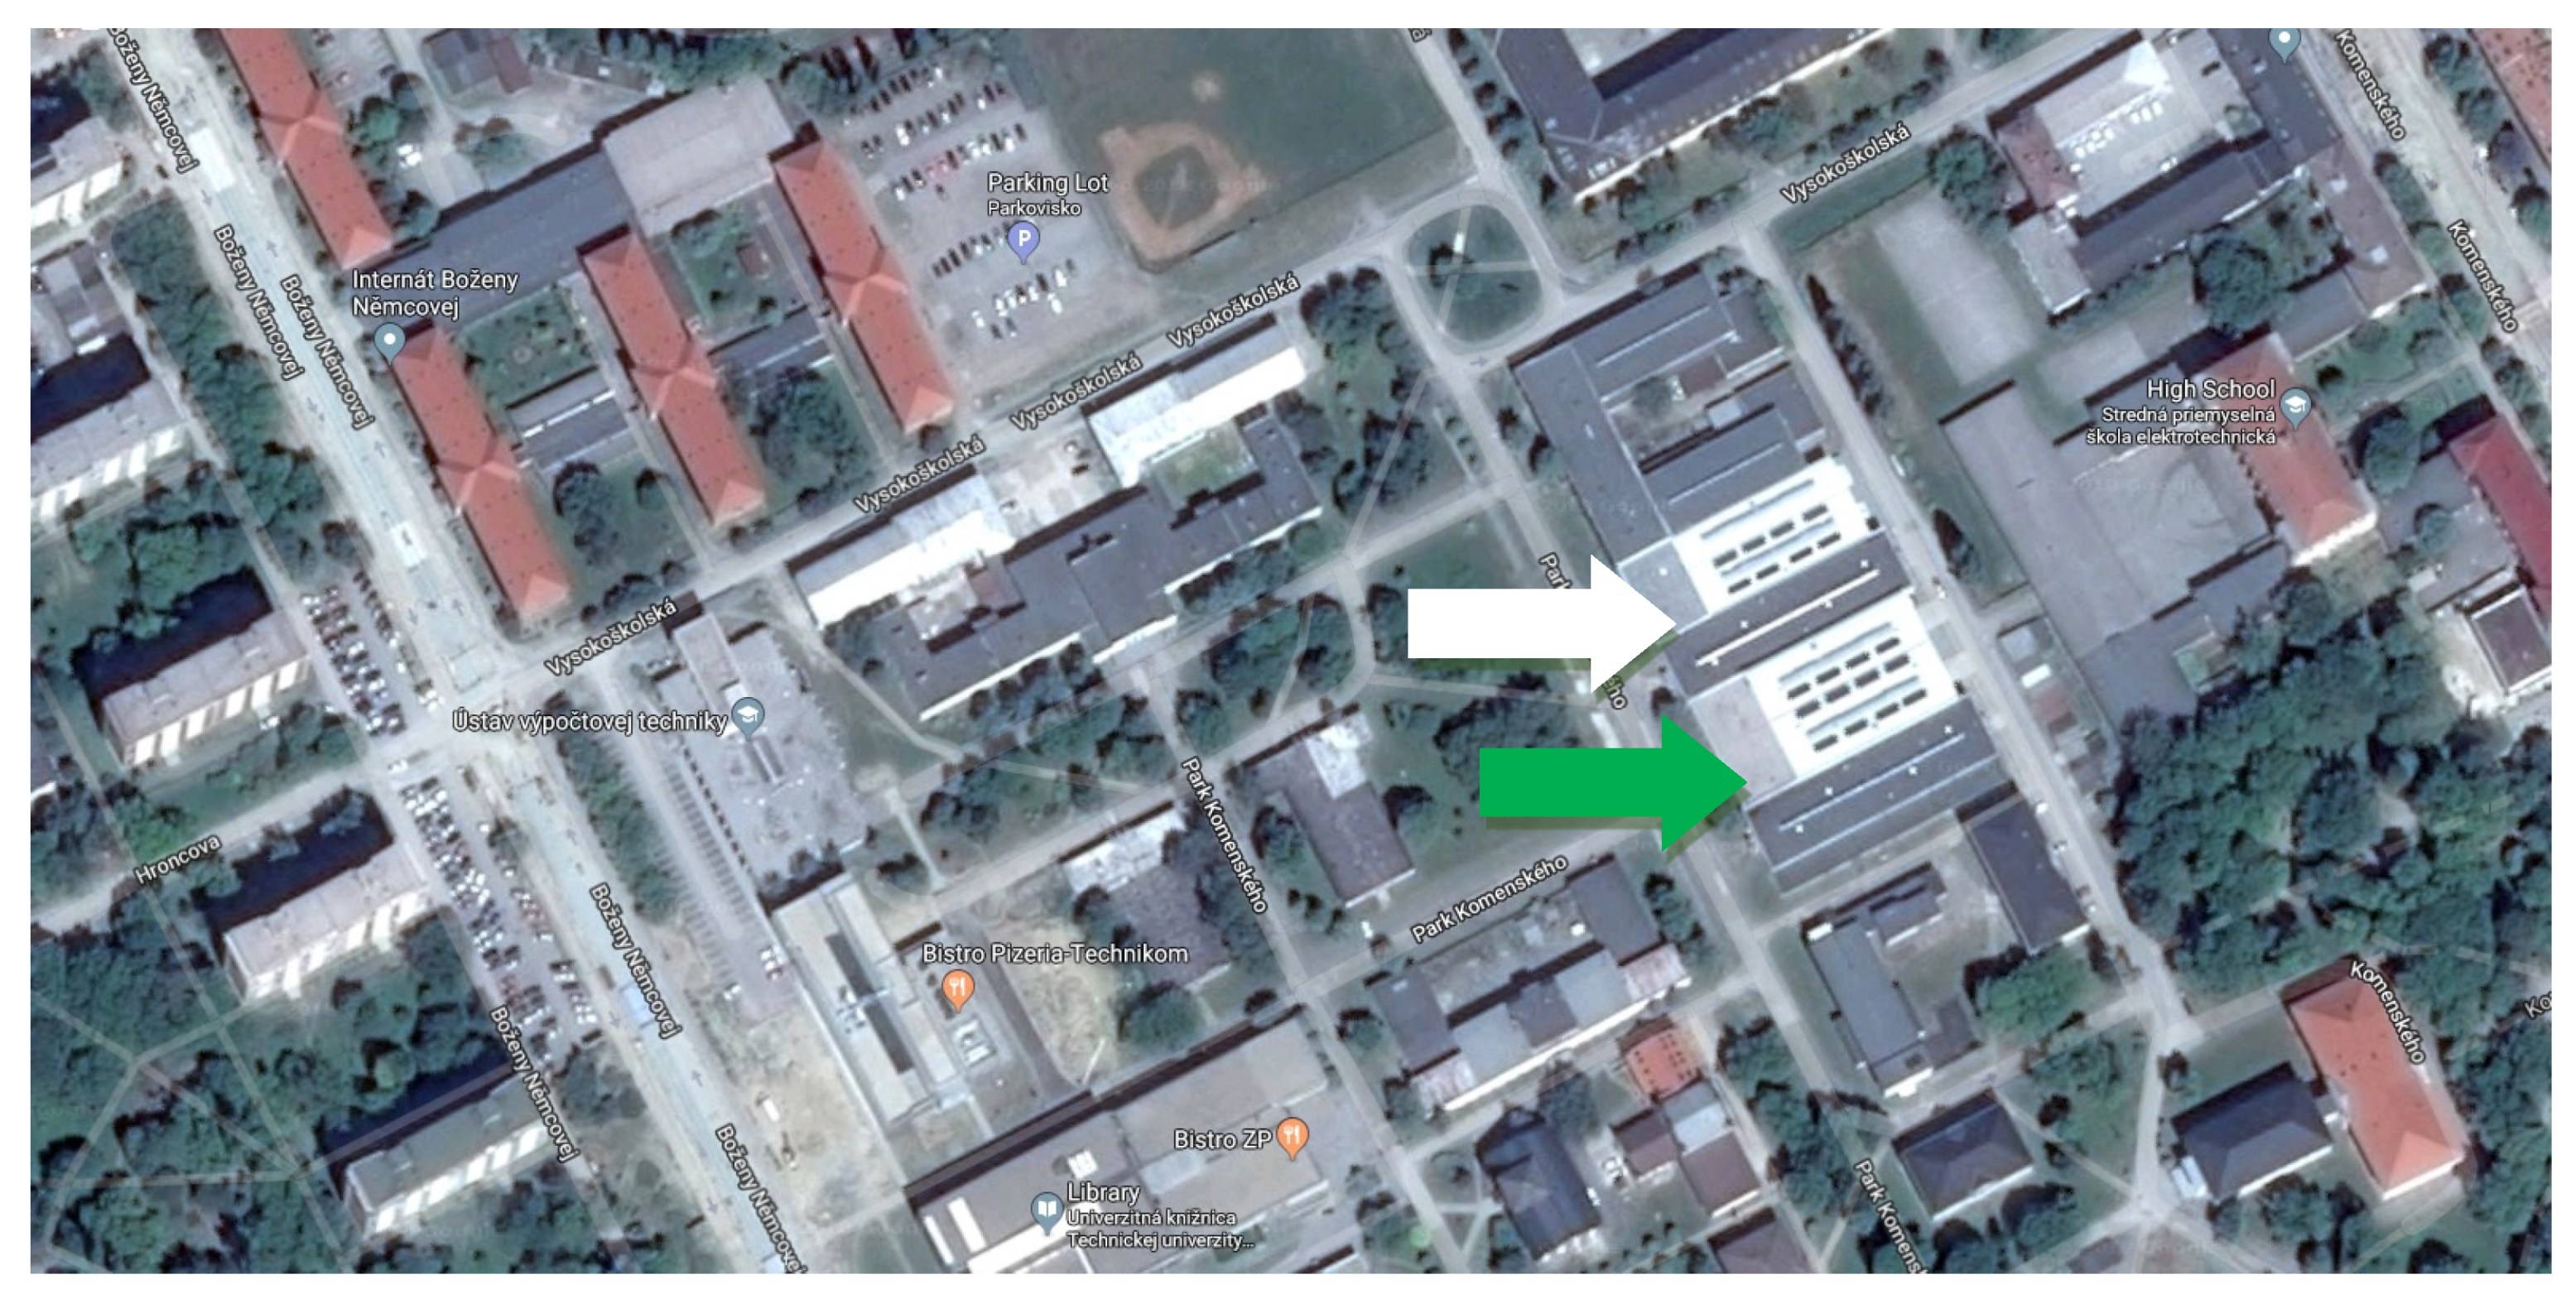
Experimental green wall is in the entrance hall of the laboratory at Technical University of Kosice (TUKE) in Slovakia. Figure 1 specifies the location of the experimental green wall. After entering the vestibule of TUKE laboratory the plants and fresh air remind the visitor a garden or a park, not a regular entrance hall of a building or a laboratory (Figure 2).
In Figure 1, white arrow is pointing at laboratory building at Park Komenského 12 (PK12), there is no green wall. Green arrow is pointing at laboratory building at Park Komenského 10 (PK10), there is a green wall. In Figure 2 the front view on both entrance halls of the laboratories is pictured.
The benefit of living green dividers is a surefire approach to upgrade a building’s visuals [3], enhance air quality [4] and also representative sharpness and vitality levels [5]. Over the past 50 years, a remarkable increment of urban-living searchers has prompted an extensive uptick in air contamination and loss of green spaces [6].
Living green dividers (additionally usually alluded to as vertical gardens or living dividers) are a superb answer for any property keen on enhancing their space with characteristic advantages of nature. They offer a moving and tastefully captivating characteristic lift to worker resolve. Regardless of whether they are introduced on the outside or inside of a building, the structures of absolutely real vegetation make the significant number of inside architects look for while championing manageability. Living green dividers put forth an amazing expression by making appealing and welcoming conditions [7]. They are as similarly great in appearance as they are purveyors of good wellbeing; the plants in the dividers fill in as a characteristic air-filtration framework that building inhabitants can appreciate. Representatives are welcomed by a green lavish condition while relishing the mitigating impacts of being around a wealth of foliage [8,9].
2.2. Green Wall Construction
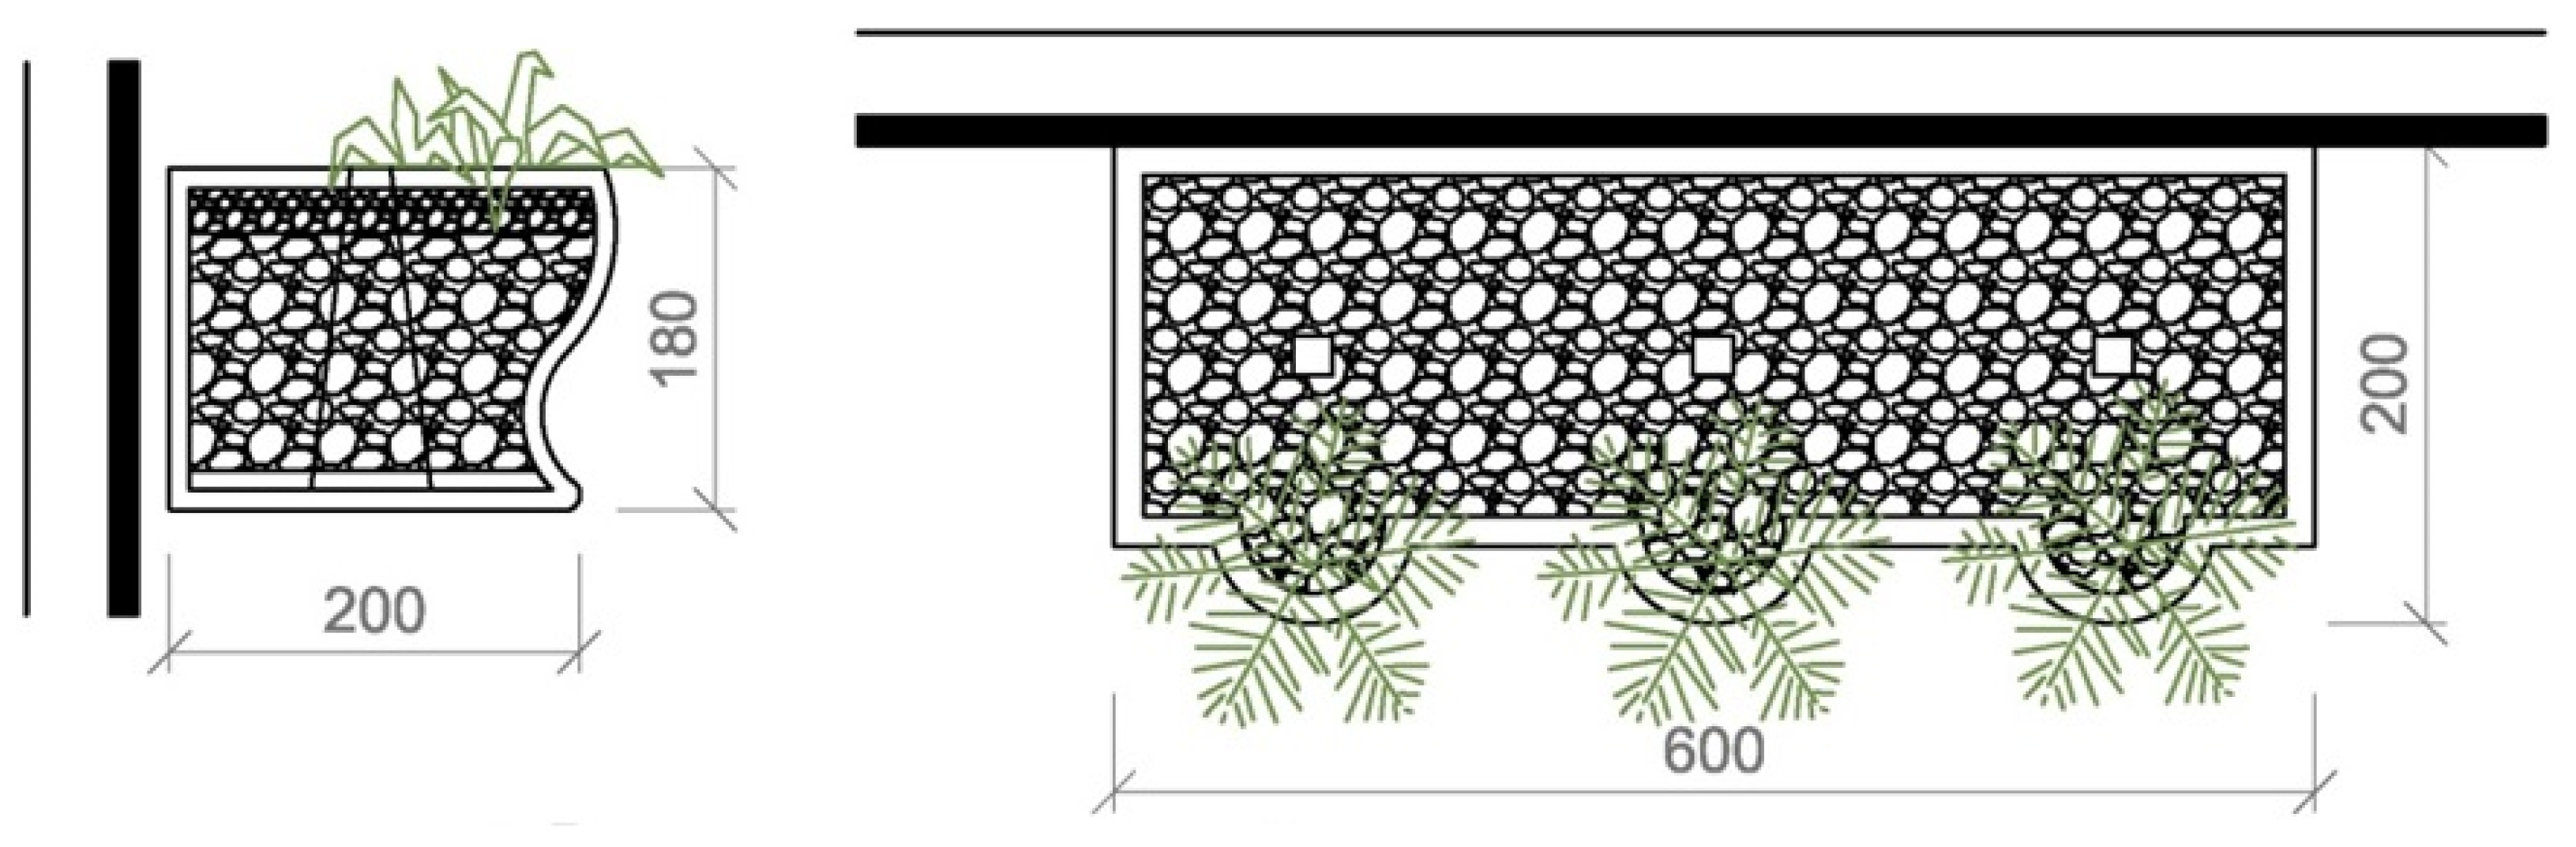
The bearing construction of green wall is made of plastic units. There are two types of plastic units. The direct segment, size 600 × 200 mm, height 180 mm 3 plants are planted there. The corner segment, size 200 × 200 mm height 180 mm 1 plant is planted there. The layers of the green wall construction are: vegetation, ceramsite, soil, filter layer, plastic construction and irrigation system (Figure 3).
2.3. Placing Sensors
In Figure 4, location of sensors used for measurements of green wall is specified. Air temperature and relative humidity sensors were placed (Figure 5) in the entrance hall of the PK10 laboratory at the same height as in the entrance hall of the PK12 laboratory, approximately 1050 mm. The V7 ALMEMO 710 [10] was placed in the adjacent room.
3. Results
Measurements were carried out to compare indoor air quality in a PK10 room with the green wall (Figure 6) and in PK12 room without green wall (Figure 7). On 27 November and 1 December 2017, measurements were taken in these two different rooms. The size of the room, materials (Table 1 and Table 2) used in it and its exposition to the sun are identical (Figure 1 and Figure 2).
Temperature and relative humidity of indoor air were recorded. The same measuring units were used in both rooms. Sensors used for this measurement were: Testo 435-4, Testo 0632, Almemo Device 710, Almemo® Fhad 46-C2 Digital Temperature / Humidity Sensor, Tensiometer FDA 602 TM2 [10]. Air temperature and relative humidity of outdoor air were measured by the weather station. No one was in the room during the measurements. Figure 7 shows the temperature and relative humidity of the indoor air.
The leaves were measured on a 0.5 cm grid. Their outlines were traced. Number of square centimeters was counted. The partial squares were only estimated. If at least half of the square was covered by the leaf, it was counted to the leaf area. If less than half of the square was covered by the leaf, it was not counted to the leaf area. In Table 1 the difference between floor and real area of green wall is shown. The difference of these areas is highlighted with * symbol.
4. Discussion
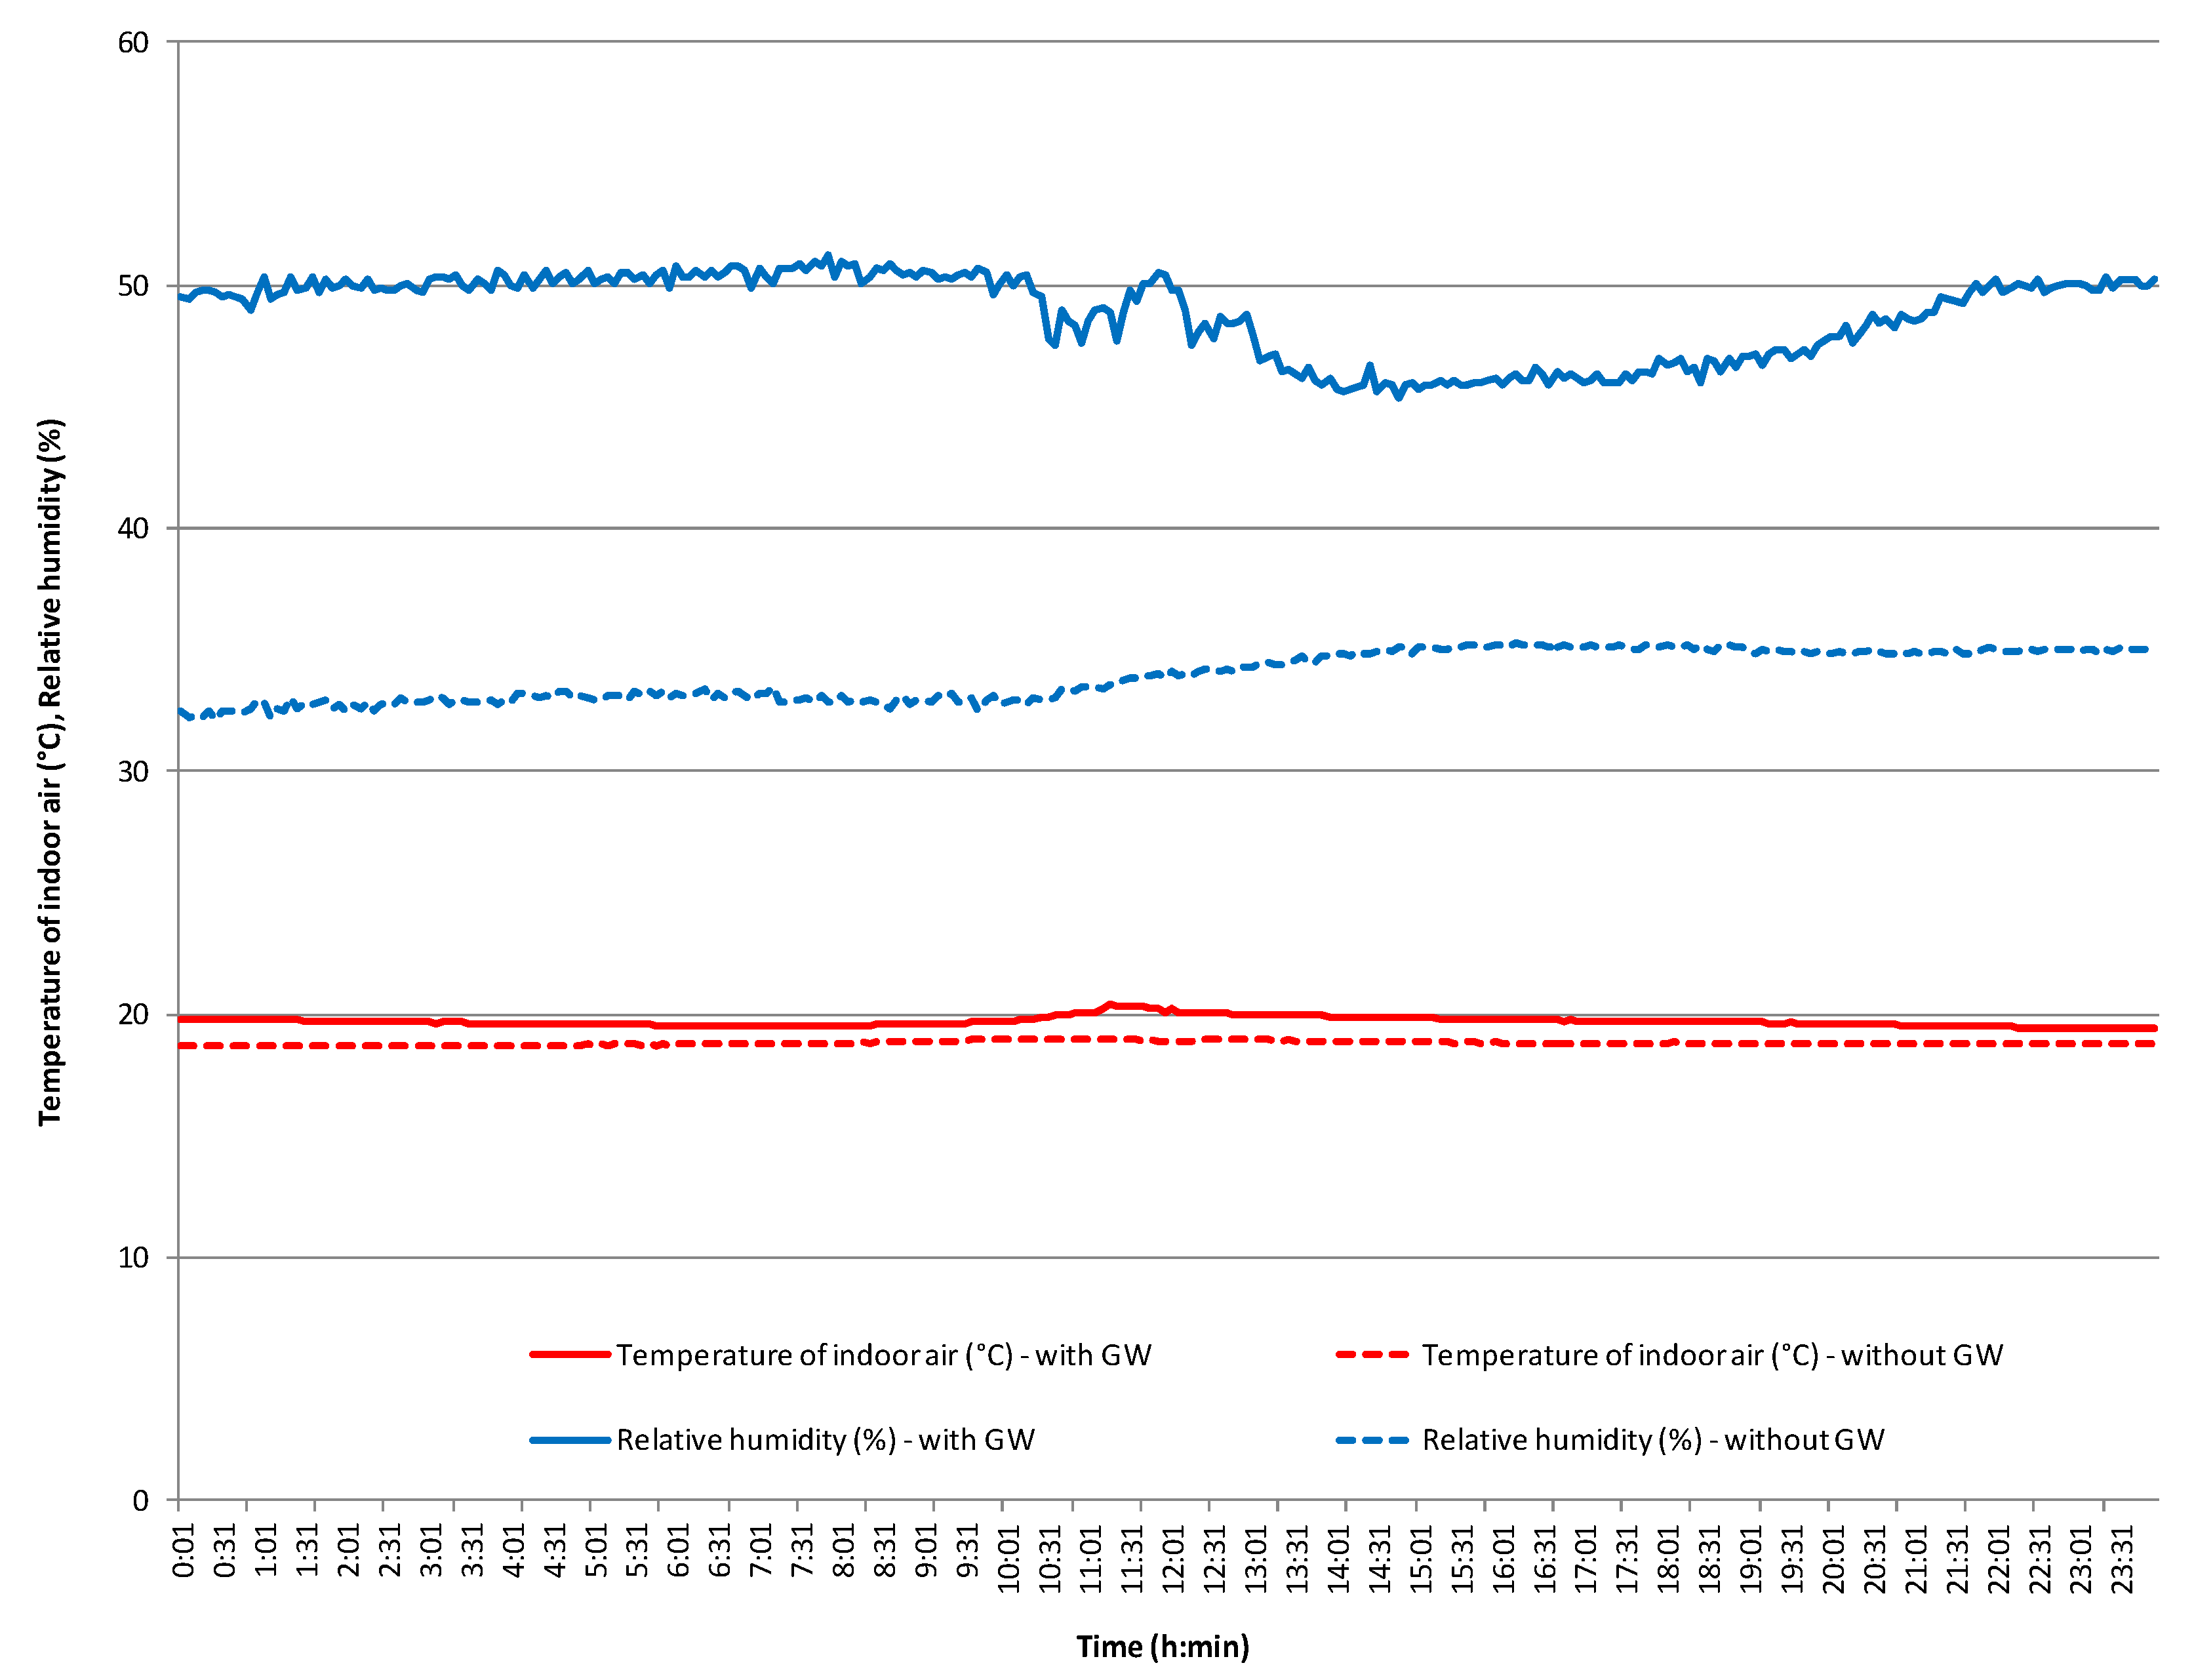
In Figure 8 can be seen the difference of indoor air temperatures is on average 0.9 °C and the difference of relative air humidity in both rooms is from 10.8% to 18.2%. On average the difference is 14.9%. The difference of the outside air temperature was on average 5.2 °C and the relative humidity of the outdoor air was on average 1.1%. On the basis of the measurements made, it can be stated that the green wall significantly influences the internal environment. According to Decree No. 259/2008 Coll. The Decree of the Ministry of Health of the Slovak Republic on the details of the requirements for the indoor environment of buildings and the minimum requirements for apartments of lower standard and accommodation facilities requires [11] the optimum relative air humidity in rooms such as classrooms, hotels, theaters, from 30% to 70%. In winter months, in buildings with central heating, there is often a reduction in relative humidity, even below the 30% threshold. In this respect, green walls appear to be beneficial in building indoor buildings.
Mold
The amount of moisture in one cubic meter of air varies as a function of the air temperature. Warm air can absorb more moisture than cold air. In a room temperature of 20 °C and a relative humidity of 60% one cubic meter of room air holds 10 g of water. If the room temperature is reduced to 8 °C the air in the room can only absorb half the amount of moisture. This means that 50% of the moisture escapes and precipitates as condensation water, mostly on the cooler outside walls. The risk of mold growth therefore increases at these points. Mold can cause health problems that range from itching eyes, sneezing and coughing to serious allergic reactions, asthma attacks and even permanent lung damage.
5. Conclusions
The measurement was performed in November and December 2017. The aim of this article was to show the difference between two identical rooms. They are different in only one specific thing—presence of green wall. The article points at the differences in air temperatures and humidity that are explained in the graph. The article is a segment of dissertation where the rest of the research will be explained.
Author Contributions
Z.P. designed the experimental green wall, responsible for maintaining the green wall, wrote the paper. M.S.A. performed the experiment. P.K. performed the experiment, analyzed the data, and wrote the paper; Z.V. designed the experiment and contributed analysis tools.
Acknowledgments
This work was supported by project VEGA No. 1/0202/15: Sustainable and Safe Water Management in Buildings of the 3rd Millennium.
Conflicts of Interest
The authors declare no conflict of interest.
References
- Yeang, K.; Spector, A. Green Design. from Theory to Practice; Black Dog Publishing: London, UK, 2011; ISBN 978-1-907317-12-5. [Google Scholar]
- Blanc, P. The Vertical Garden. from Nature to the City; W.W. Norton & Company: London, UK, 2012; ISBN 978-0-393-73379-2. [Google Scholar]
- White, E.V.; Gatersleben, B. Greenery on residential buildings: Does it affect preferences and perceptions of beauty? J. Environ. Psychol. 2011, 31, 89–98. [Google Scholar] [CrossRef]
- Malys, L.; Musya, M.; Inard, C. A hydrothermal model to assess the impact of green walls on urban microclimate and building energy consumption. Build. Environ. 2014, 73, 187–197. [Google Scholar] [CrossRef]
- Poórová, Z.; Káposztásová, D.; Vranayová, Z. Natural and artificial green design environment and its effect on people living and working in it. BTHLA Bothalia J. 2015, 45, 23–32. [Google Scholar]
- Ran, J.; Tang, M. Passive cooling of the green roofs combined with night-time ventilation and walls insulation in hot and humid regions. Sustain. Cities Soc. 2018, 38, 466–475. [Google Scholar] [CrossRef]
- Magliocco, A. Vertical Greening Systems: Social and Aesthetic Aspects. Nat. Based Strateg. Urban Build Sustain. 2018, 263–271. [Google Scholar] [CrossRef]
- Fowdar, H.S.; Hatt, B.E.; Breen, P.; Cook, P.L.M.; Deletic, A. Designing living walls for greywater treatment. Water Res. 2017, 110, 218–232. [Google Scholar] [CrossRef] [PubMed]
- Dunnett, N.; Kingsbury, C. Planting Living Walls, Revised and Updated Edition; Timber Press: Portland, OR, USA, 2008. [Google Scholar]
- Testo, S.E. Co. KGaA, 2018. Available online: https://www.testo.com/sk-SK/sonda-iaq-pre-posudzovanie-kvality-vzduchu-v-miestnosti-meranie/p/0632-1535 (accessed on 5 April 2018).
- Decree No. 259/2008 Coll. The Decree of the Ministry of Health of the Slovak Republic on the Details of the Requirements for the Indoor Environment of Buildings and the Minimum Requirements for Apartments of Lower Standard and Accommodation Facilities. Available online: http://www.zakonypreludi.sk/zz/2008-259 (accessed on 14 May 2018).
Figure 1.
Campus of Technical University; Green arrow-building with the green wall in the entrance hall; White arrow-building without the green wall in the entrance hall.
Figure 1.
Campus of Technical University; Green arrow-building with the green wall in the entrance hall; White arrow-building without the green wall in the entrance hall.
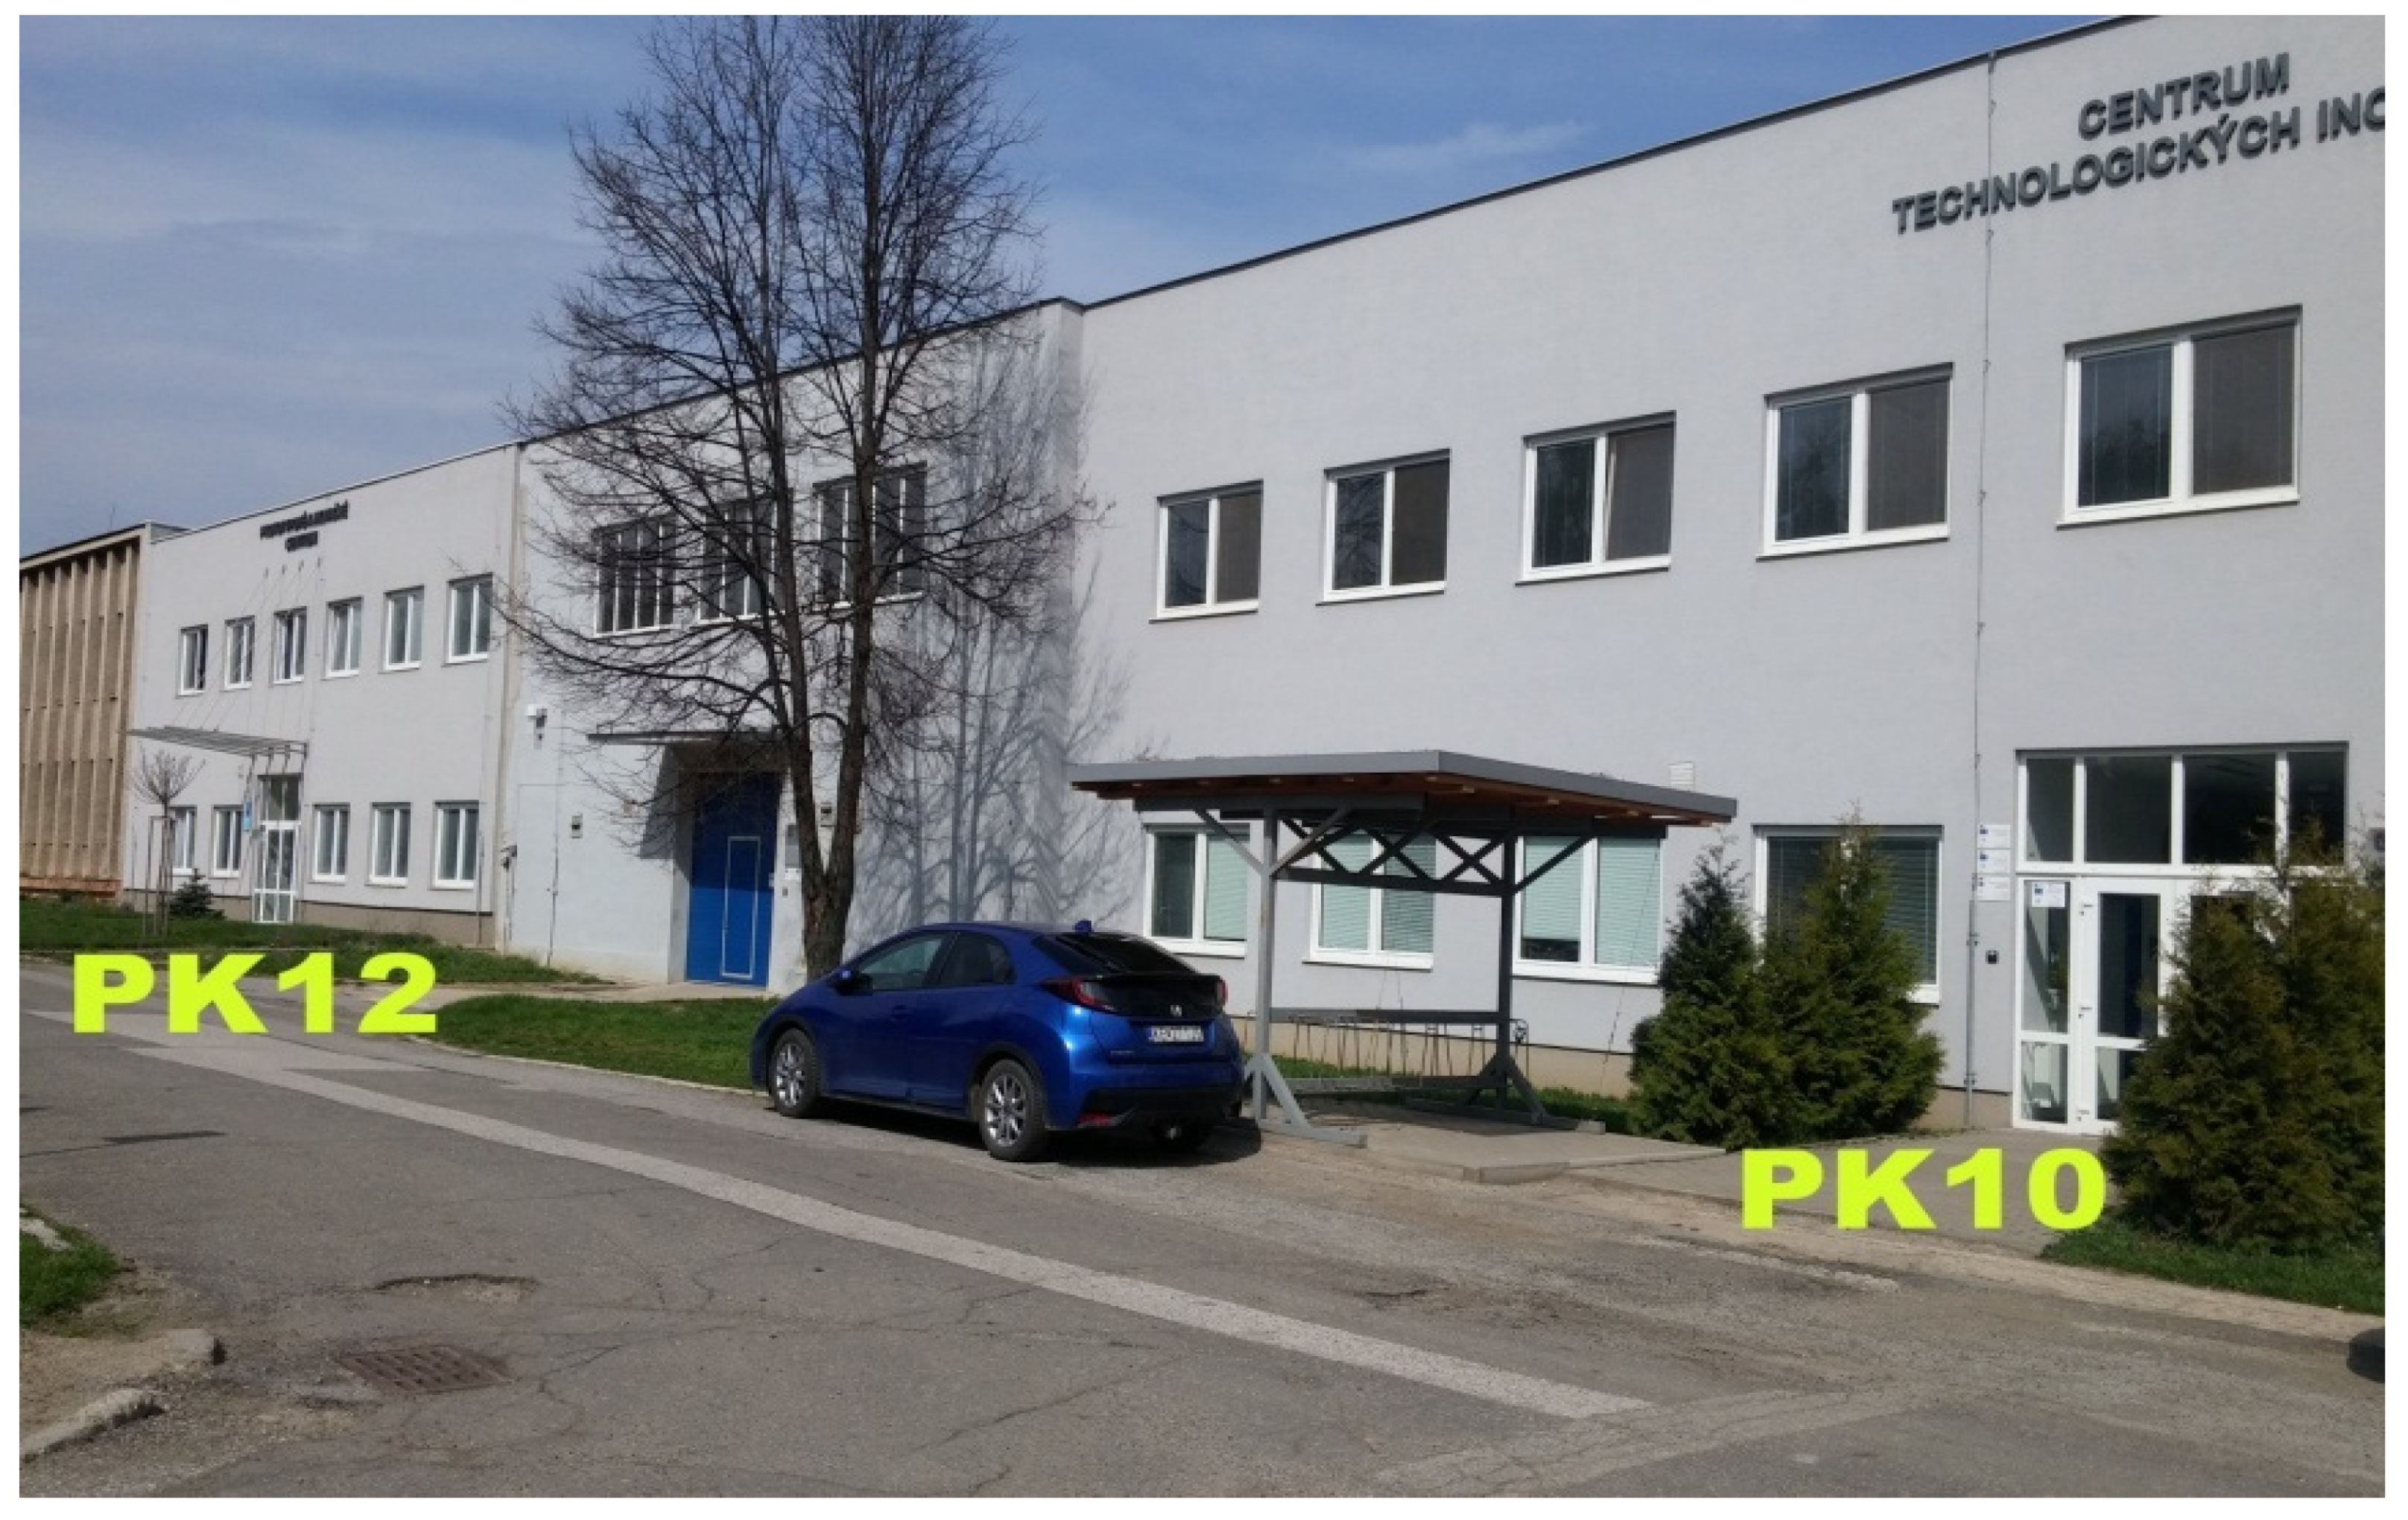
Figure 2.
Front views on entrance halls—PK10 and PK12.

Figure 3.
Look on a green wall after entering the laboratory hall.
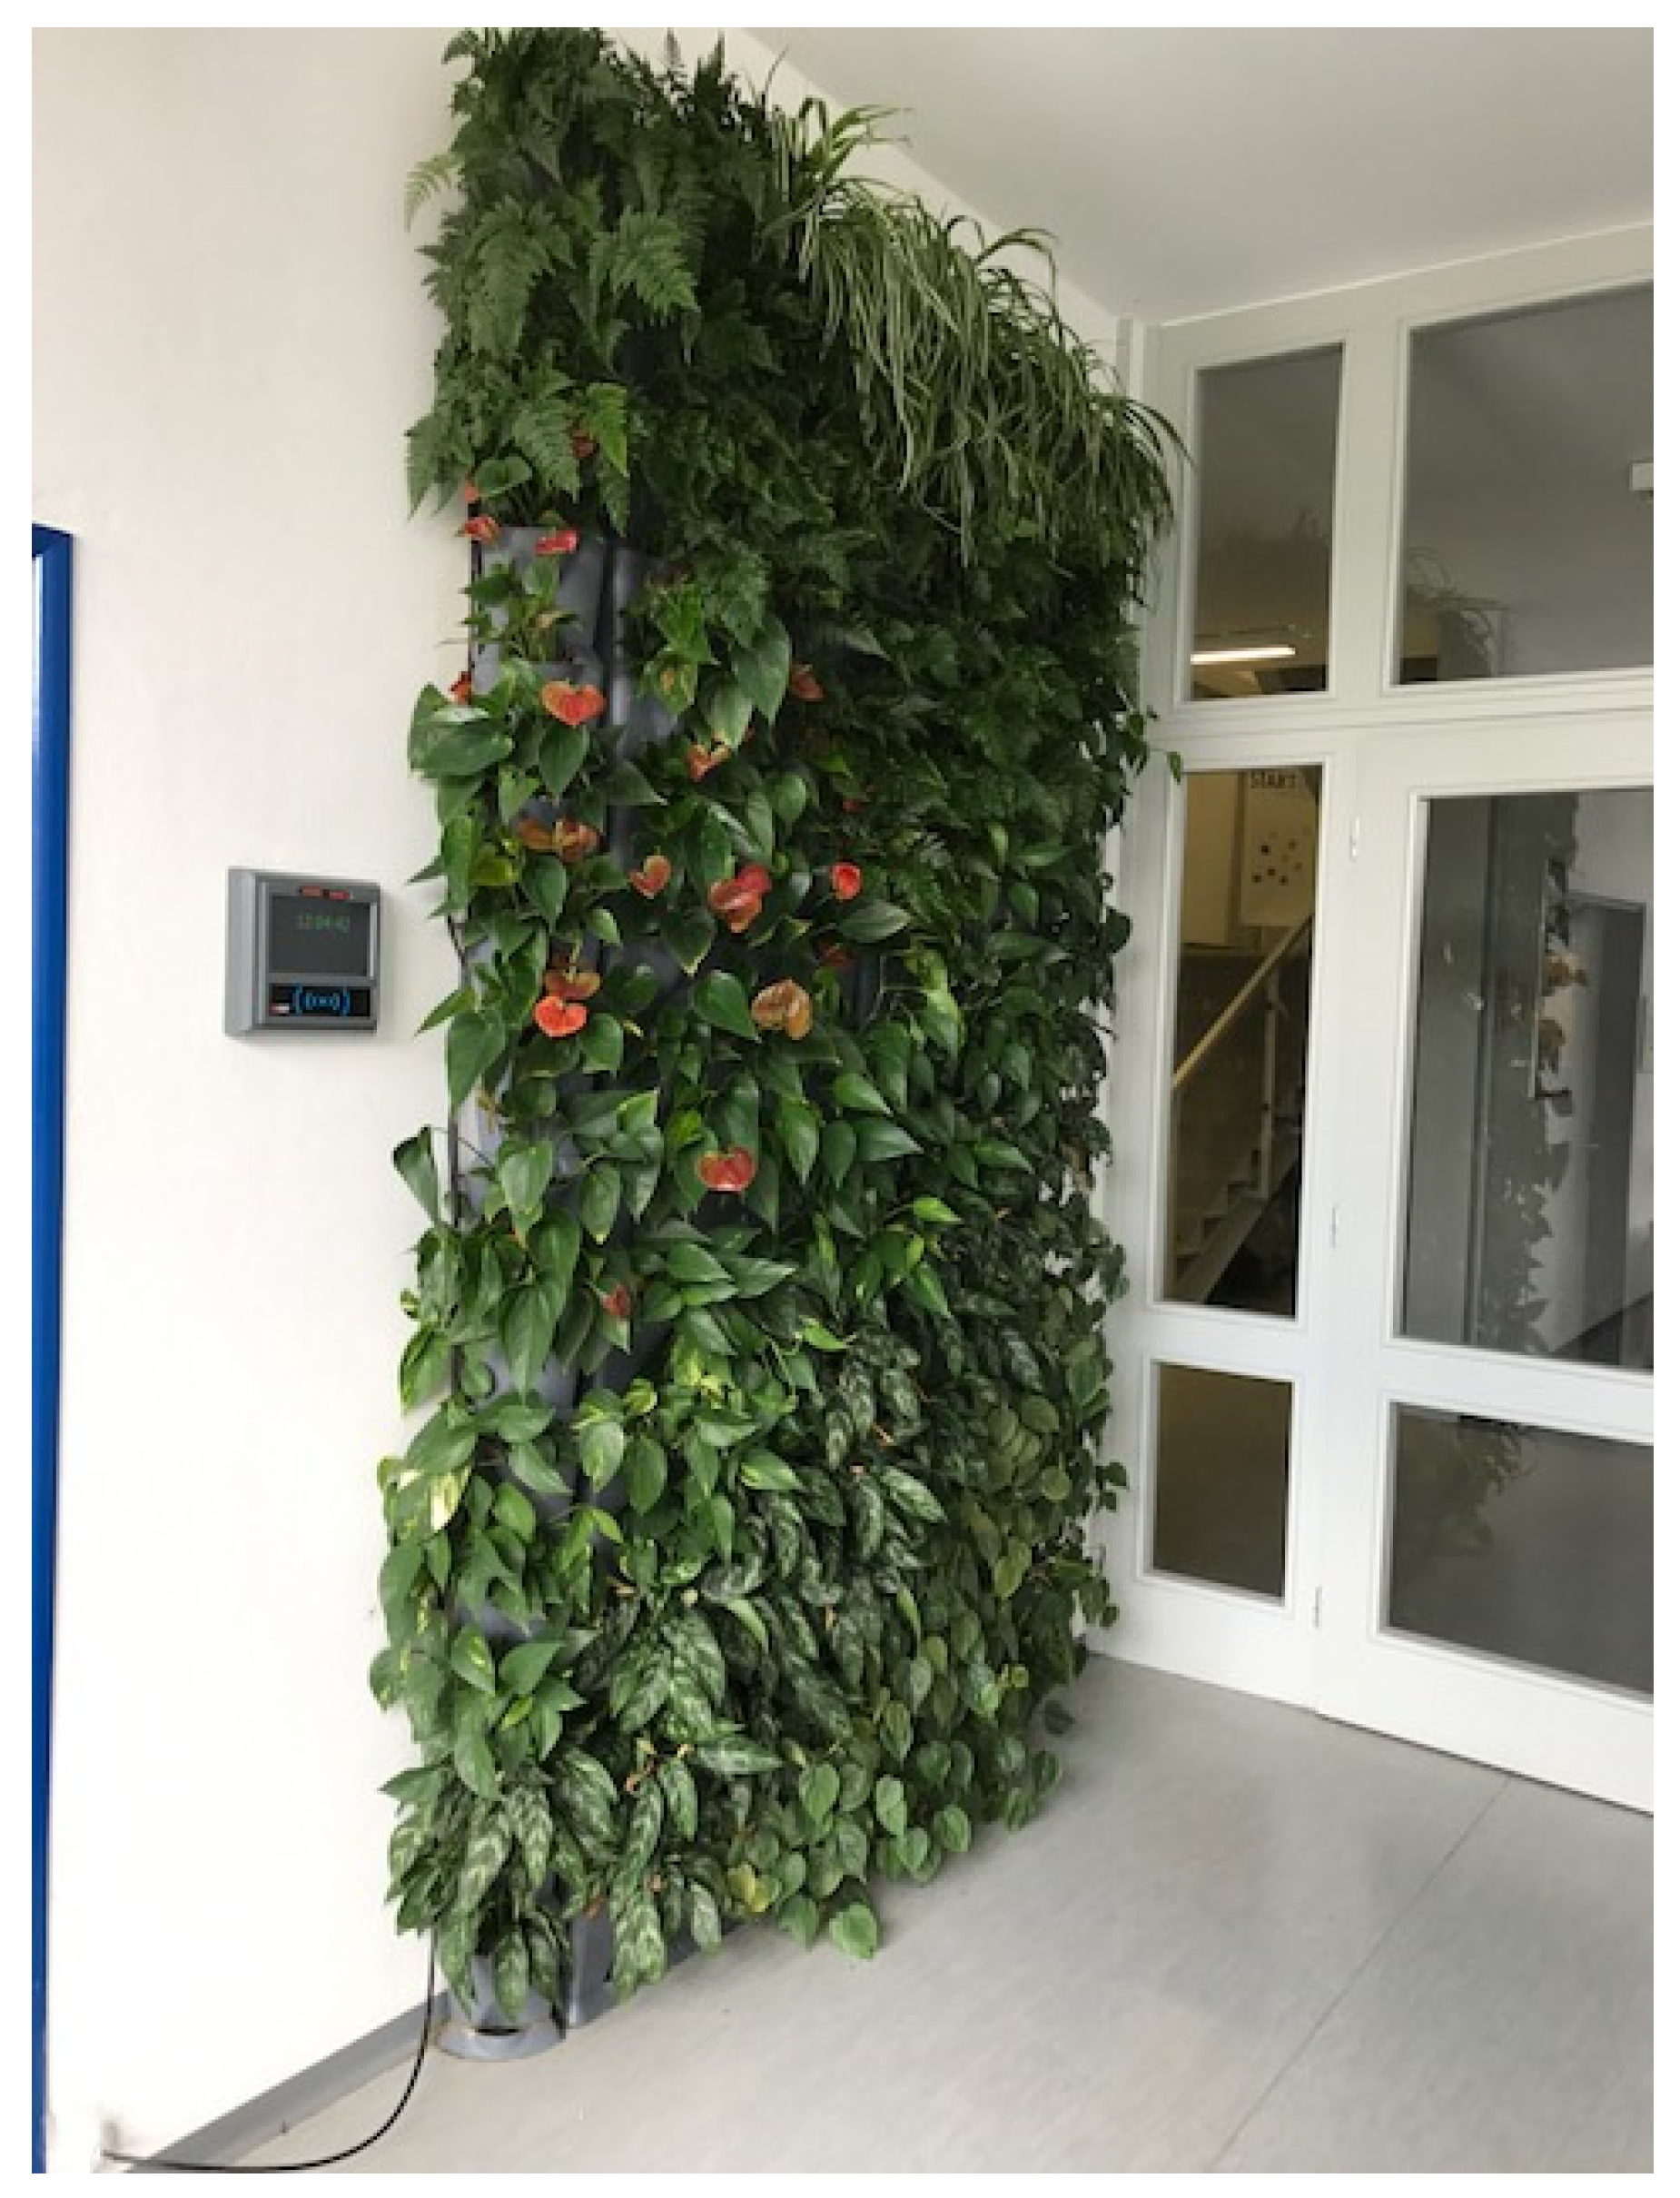
Figure 4.
Detail of a segment of experimental green wall.
Figure 5.
Scheme of locations of sensor used for measurement.

Figure 6.
Floor plan of the entrance hall in PK 10- room with the green wall.
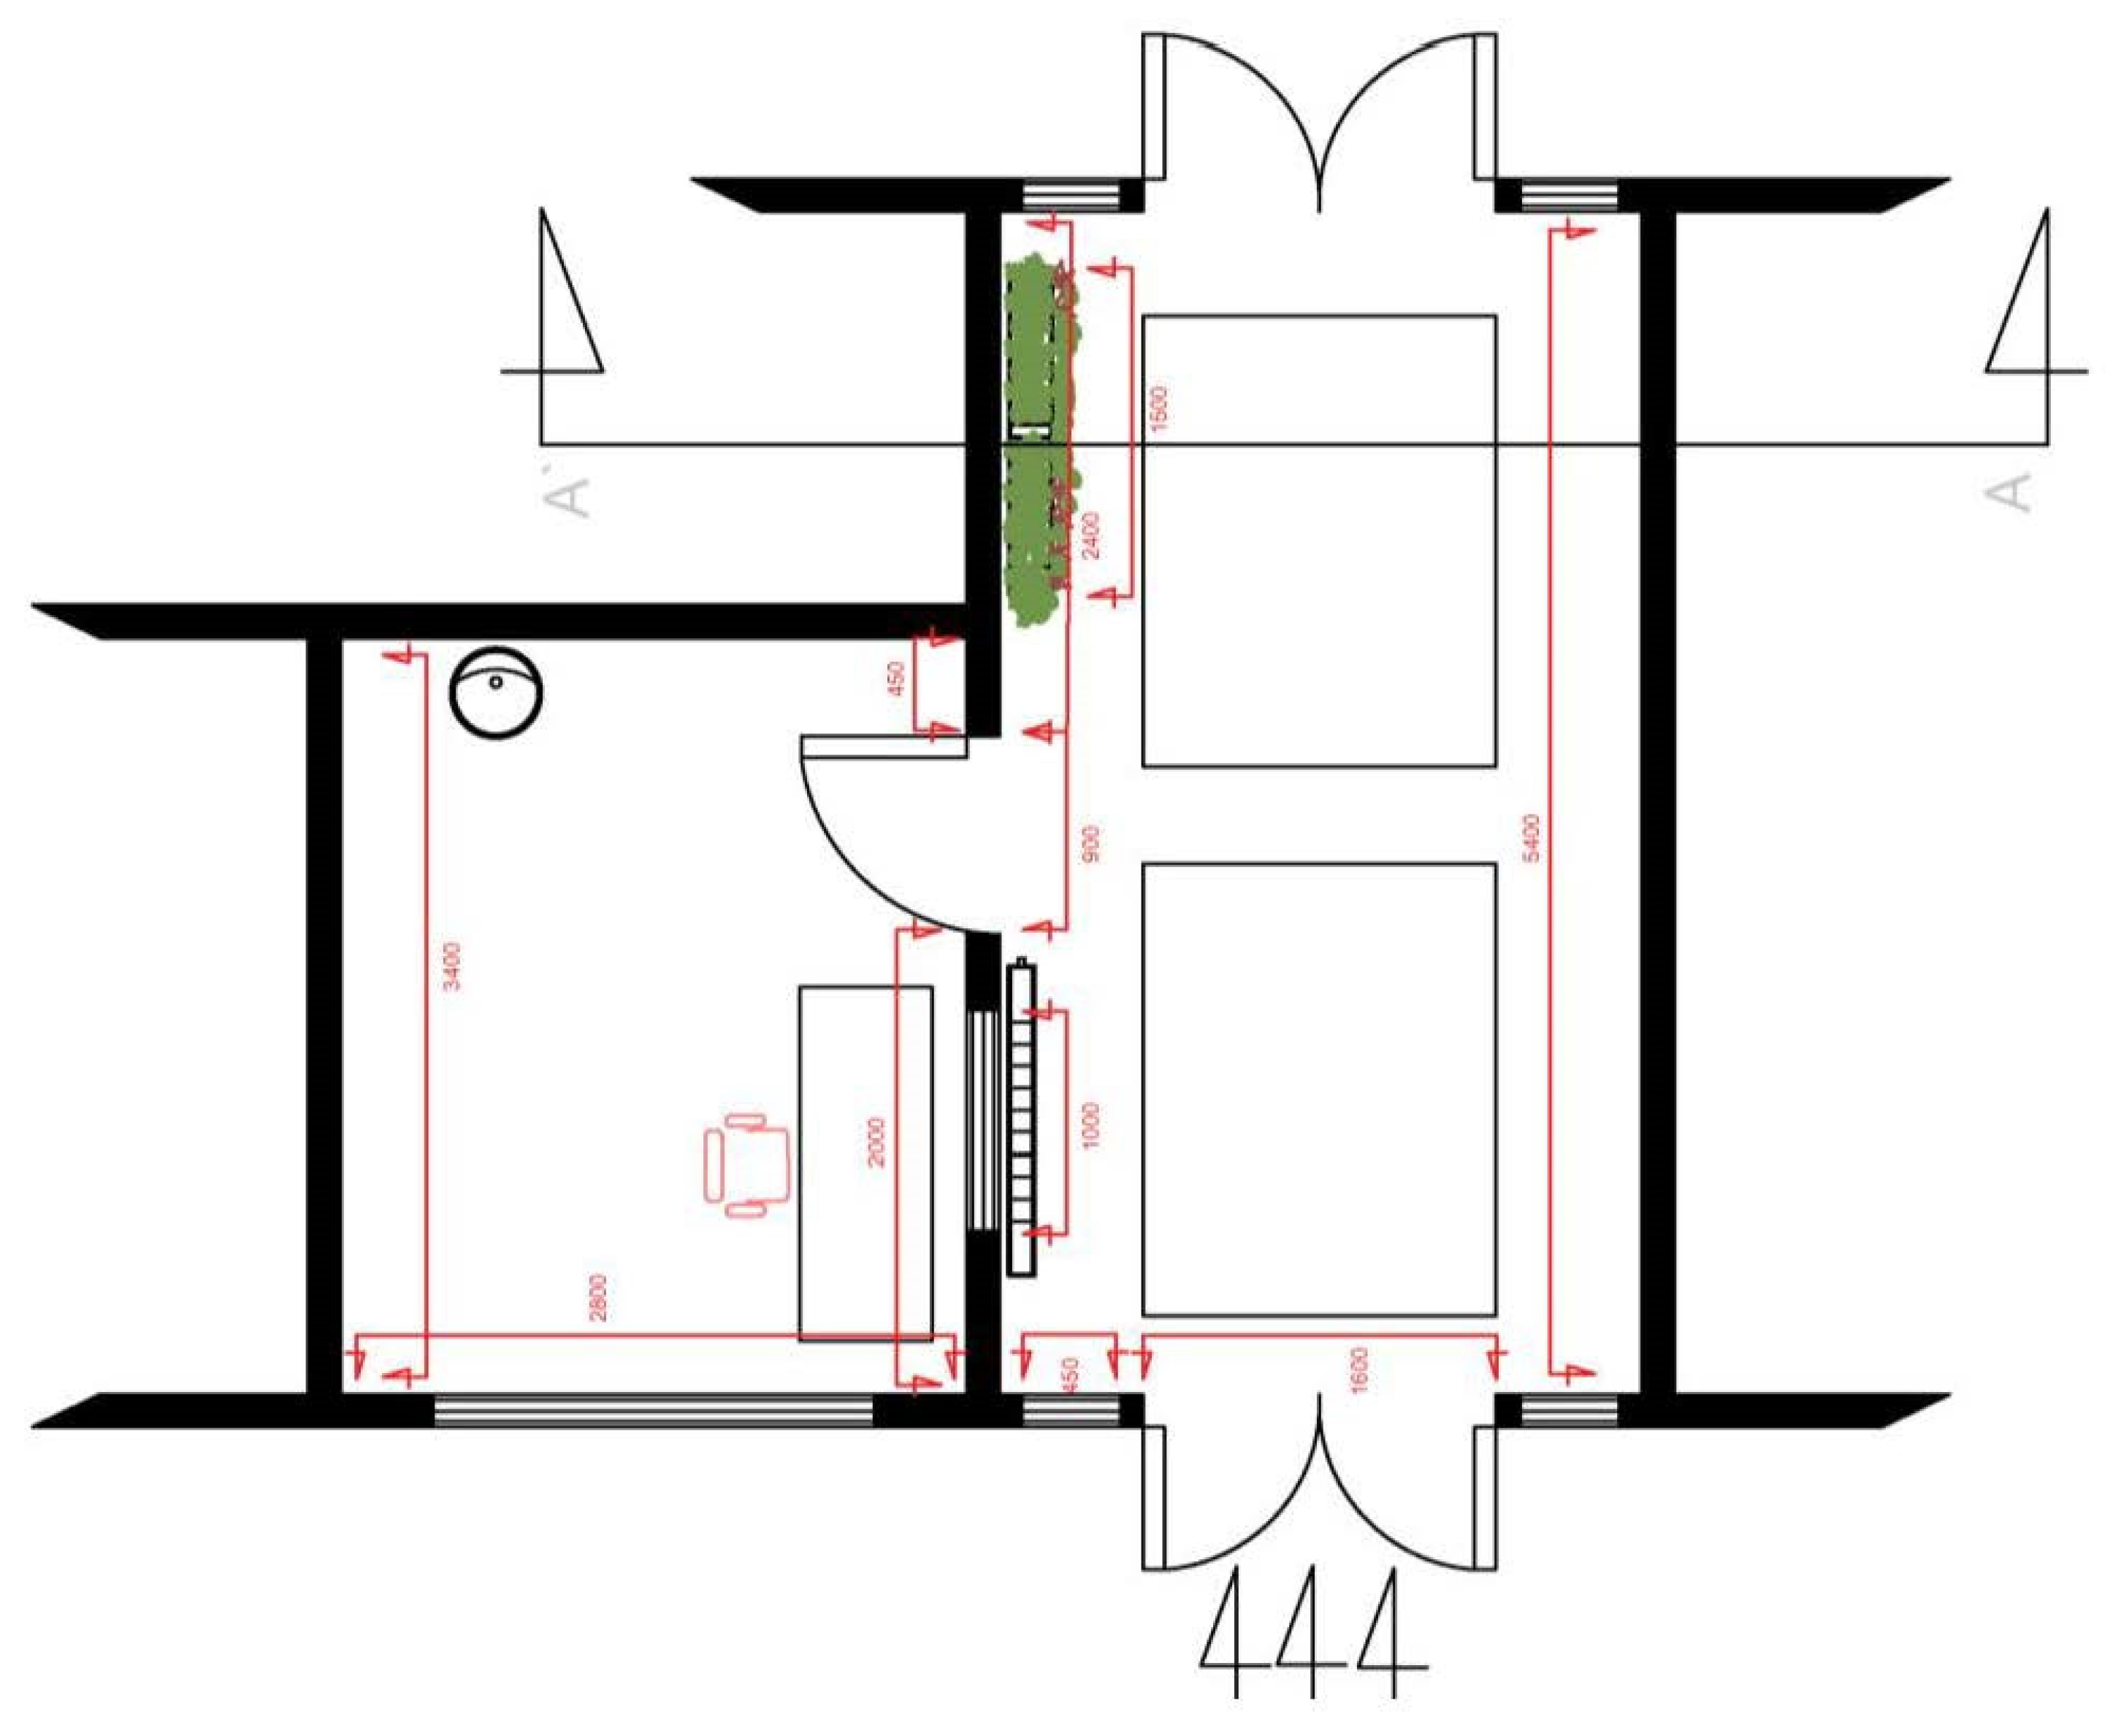
Figure 7.
Floor plan of the entrance hall in PK 12-room without green wall.
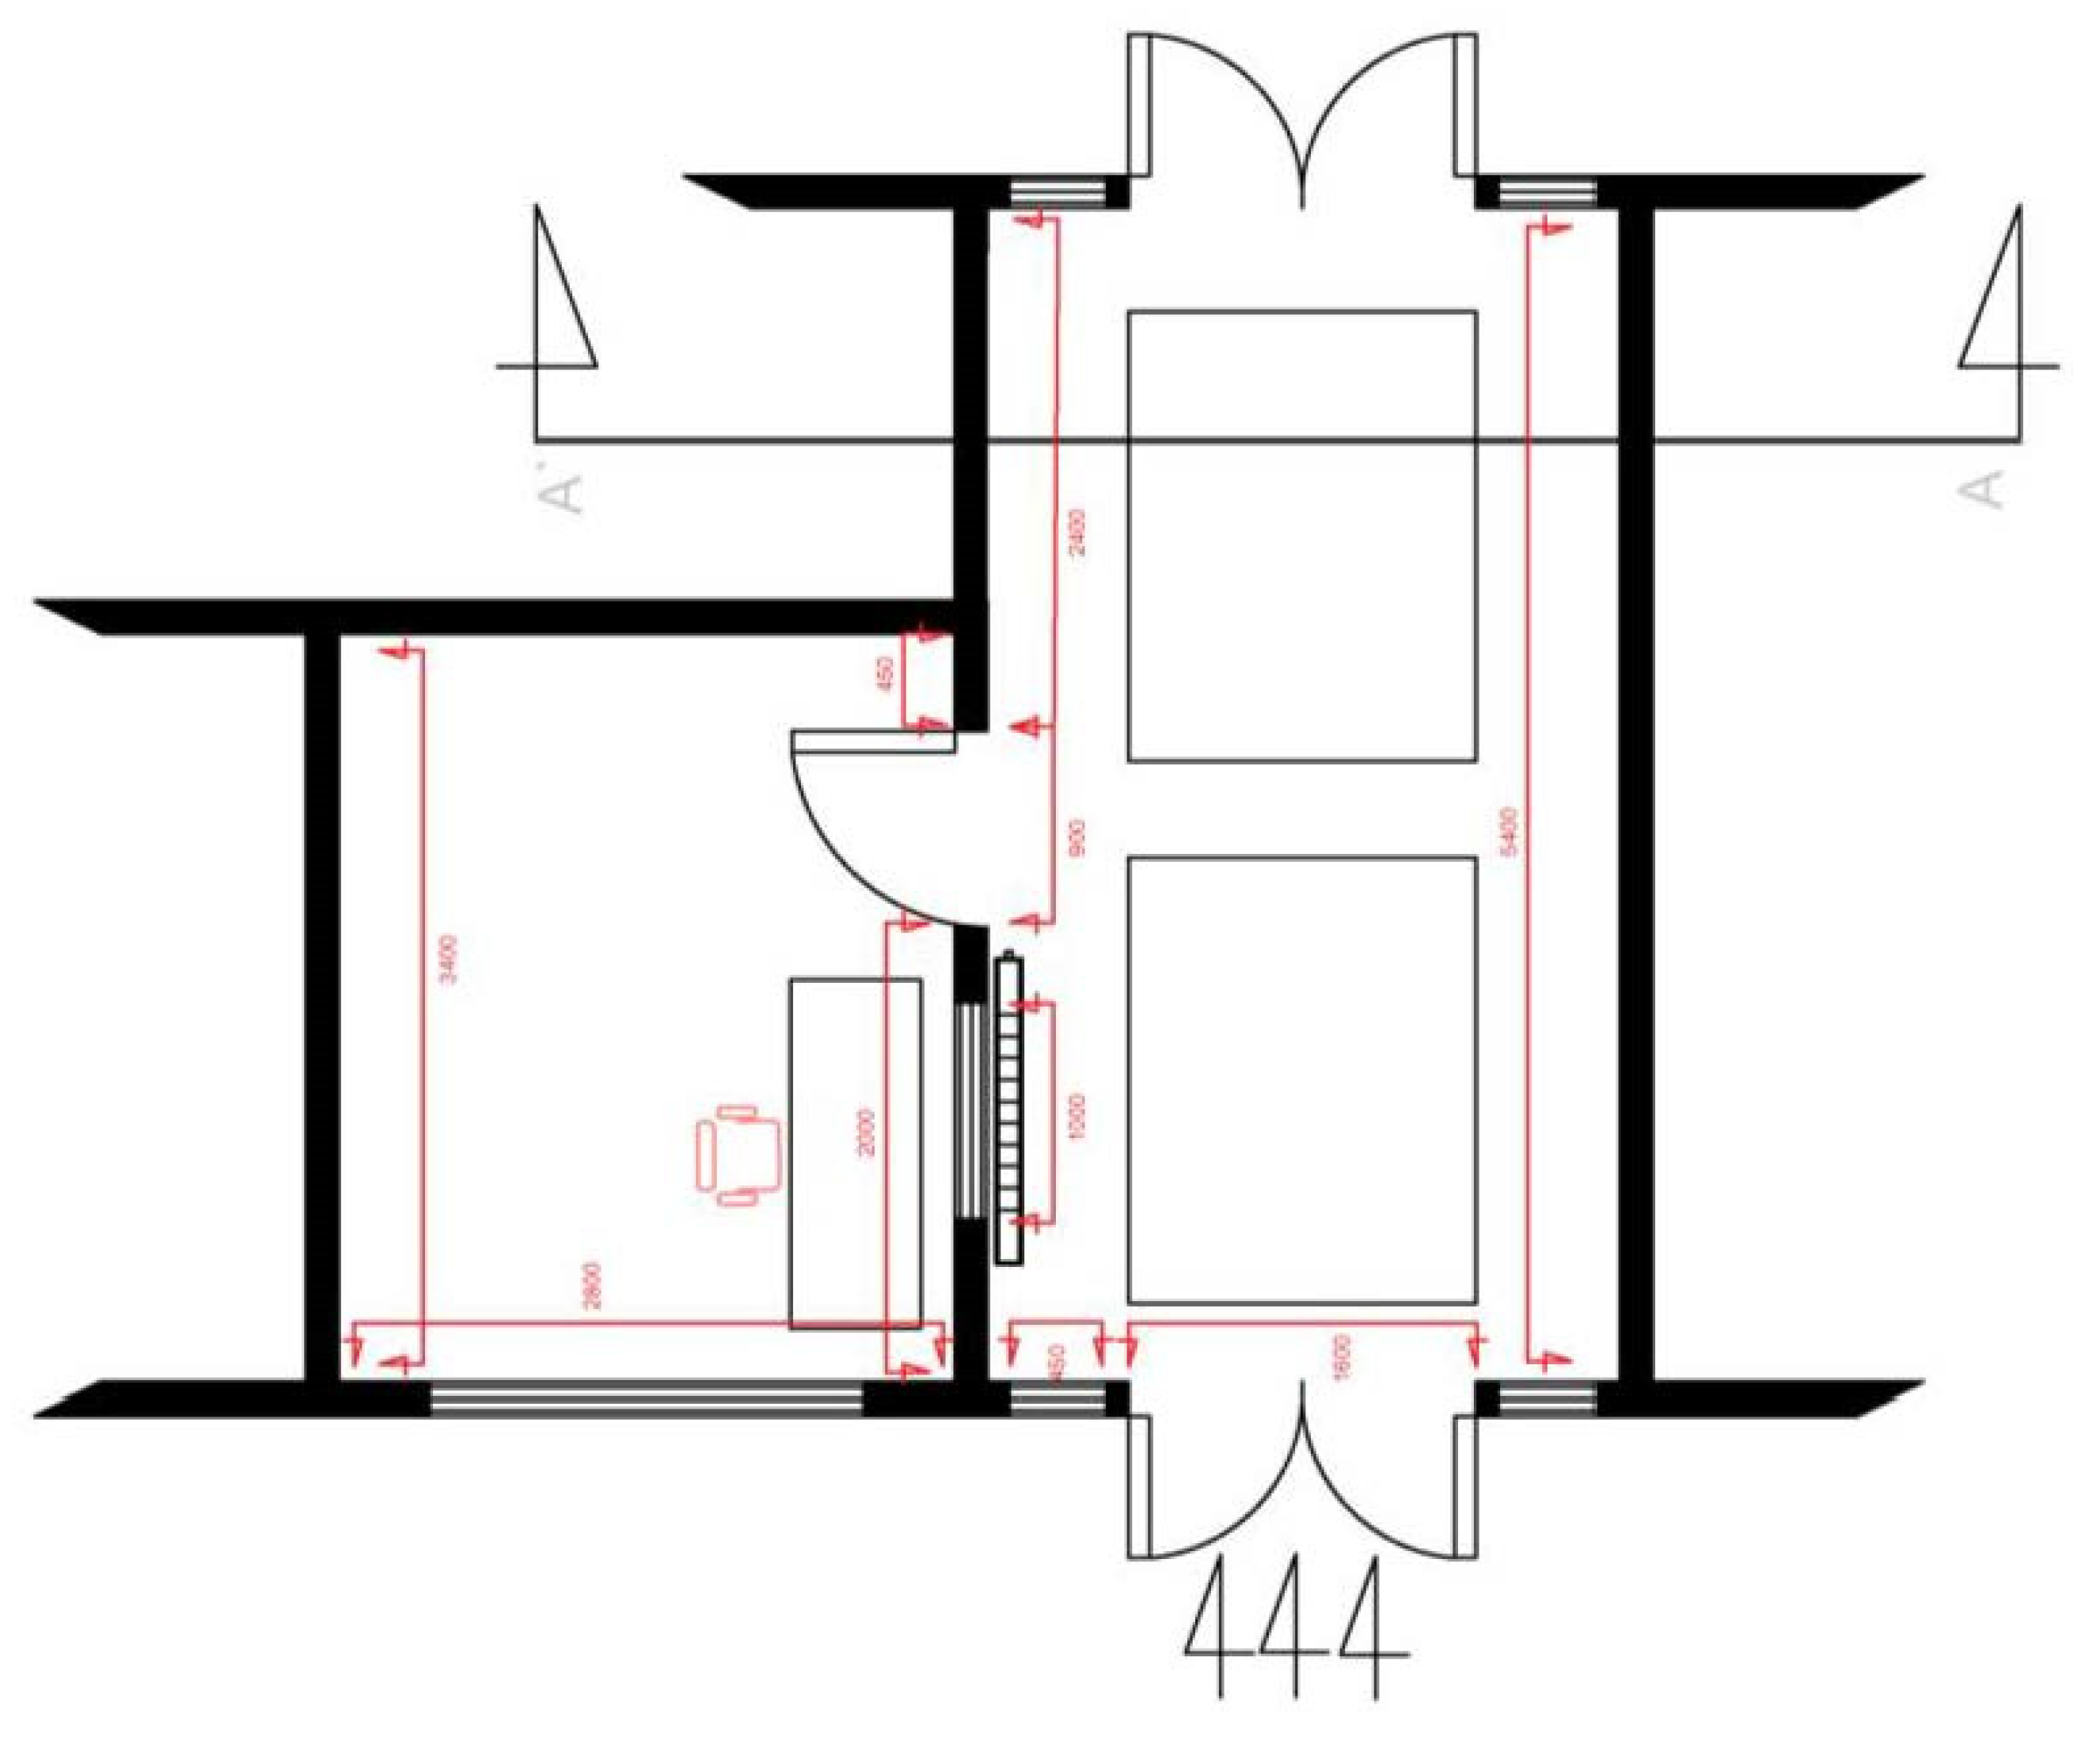
Figure 8.
Comparison of air temperature and humidity between PK10 and PK 12.


Table 1.
List of materials in PK10.
| Area | Object | Material | Ground Area m2 | Real Area m2 | Percentage % |
|---|---|---|---|---|---|
| Floor | Linoleum | Rubber | 12.3 | 12.3 | 12.3 |
| Carpet | Cloth | 3.3 | 3.3 | 3.3 | |
| Ceiling | Wall | Plaster | 15.6 | 15.6 | 15.6 |
| South wall | Wall | Plaster | 20.0 | 20.0 | 19.9 |
| West wall | Entrance door with glass wall | Glass | 9.6 | 9.6 | 9.6 |
| Plastic | 1.1 | 1.1 | 1.1 | ||
| East wall | Door to building with glass wall | Glass | 9.6 | 9.6 | 9.6 |
| Plastic | 1.1 | 1.1 | 1.1 | ||
| North wall | Wall | Plaster | 11.0 | 11.0 | 11.0 |
| Window | Glass | 1.0 | 1.0 | 0.9 | |
| Plastic | 0.1 | 0.1 | 0.1 | ||
| Heater | Steel | 1.0 | 1.0 | 1.0 | |
| Door to room | Wood | 2.3 | 2.3 | 2.3 | |
| Green wall | Plants | 4.6 | 12.2 * | 12.2 | |
| TOTAL | 92.6 | 100.2 | 100 |
Table 2.
List of materials in PK12.
| Area | Object | Material | Ground Area m2 | Real Area m2 | Percentage % |
|---|---|---|---|---|---|
| Floor | Linoleum | Rubber | 12.3 | 12.3 | 12.3 |
| Carpet | Cloth | 3.3 | 3.3 | 3.3 | |
| Ceiling | Wall | Plaster | 15.6 | 15.6 | 15.6 |
| South wall | Wall | Plaster | 20.0 | 20.0 | 19.9 |
| West wall | Entrance door with glass wall | Glass | 9.6 | 9.6 | 9.6 |
| Plastic | 1.1 | 1.1 | 1.1 | ||
| East wall | Door to building with glass wall | Glass | 9.6 | 9.6 | 9.6 |
| Plastic | 1.1 | 1.1 | 1.1 | ||
| North wall | Wall | Plaster | 15.6 | 15.6 | 11.0 |
| Window | Glass | 1.0 | 1.0 | 0.9 | |
| Plastic | 0.1 | 0.1 | 0.1 | ||
| Heater | Steel | 1.0 | 1.0 | 1.0 | |
| Door to room | Wood | 2.3 | 2.3 | 2.3 | |
| TOTAL | 92.6 | 100.2 | 100 |
Publisher’s Note: MDPI stays neutral with regard to jurisdictional claims in published maps and institutional affiliations. |
© 2018 by the authors. Licensee MDPI, Basel, Switzerland. This article is an open access article distributed under the terms and conditions of the Creative Commons Attribution (CC BY) license (https://creativecommons.org/licenses/by/4.0/).
Share and Cite
MDPI and ACS Style
Poorova, Z.; Alhosni, M.S.; Kapalo, P.; Vranayova, Z. Comparing Air Temperature and Humidity in a Vestibule without and with Green Wall. Proceedings 2018, 2, 633. https://doi.org/10.3390/proceedings2110633
AMA Style
Poorova Z, Alhosni MS, Kapalo P, Vranayova Z. Comparing Air Temperature and Humidity in a Vestibule without and with Green Wall. Proceedings. 2018; 2(11):633. https://doi.org/10.3390/proceedings2110633
Chicago/Turabian StylePoorova, Zuzana, Mohammed Salem Alhosni, Peter Kapalo, and Zuzana Vranayova. 2018. "Comparing Air Temperature and Humidity in a Vestibule without and with Green Wall" Proceedings 2, no. 11: 633. https://doi.org/10.3390/proceedings2110633