Parameter Optimization of a Bed Load Transport Formula for Nestos River, Greece †


1
Department of Rural and Surveying Engineering, Aristotle University of Thessaloniki, 54124 Thessaloniki, Greece
2
Department of Civil Engineering, Democritus University of Thrace, Kimmeria Campus, 67100 Xanthi, Greece
*
Author to whom correspondence should be addressed.
†
Presented at the 3rd EWaS International Conference on “Insights on the Water-Energy-Food Nexus”, Lefkada Island, Greece, 27–30 June 2018.
Proceedings 2018, 2(11), 627; https://doi.org/10.3390/proceedings2110627
Published: 28 August 2018
(This article belongs to the Proceedings of EWaS3 2018)
Abstract
:In the Second EWaS International Conference (June 2016, Chania, Crete, Greece), the bed load transport formula of Meyer-Peter and Müller (1948) was calibrated with respect to the bed roughness coefficient for Nestos River. The calibration was manual and incremental, taking five measured values of bed load transport rate at a time. In contrast, the present study carries out a nonlinear optimization of two suitable parameters, while utilizing the average value of the roughness coefficient kst found by the manual calibration. Thus, a uniform calibration is attained, by taking at once the totality of the available 68 measurement points. The results did not show any marked fitting improvement in comparison to the previous study. However, considering moving averages of the measured bed load transport values yields a better adjustment of the model to the measured results.
1. Introduction
No systematic river bed load transport measurements have been conducted and published in Greece to date. An effort to carry out such measurements has been undertaken through diploma projects, by the Division of Hydraulic Engineering, Civil Engineering Department of the Democritus University of Thrace [1,2,3]. The measurements were taken at mountainous outlets of the river basins leading to Kosynthos River and Kimmeria Torrent. Those outlets are located in the area of the city of Xanthi, the seat of the Democritus University Engineering Faculty. Due to the well-known stream flow rate dependence of both bed load and suspended load transport rates, measurements of the first quantity preceded those of the other two.
In the framework of those studies, nonlinear regression equations were presented (a) between bed load transport rate and stream flow rate based on 24 measurements and (b) suspended load transport rate and stream flow rate based on 29 measurements, of both variables in each case [2].
In this paper, 68 pairs of stream flow rate and bed load transport rate measurements of Nestos River are presented. Beside those measurements, the bed load transport rate was calculated by the Meyer-Peter and Müller formula (1948), thus enabling comparisons between measured and computed results.
The above formula was applied in recent years to bed load computations in streams and rivers in various parts of the world, notably in France [4] and Spain [5,6]. This paper represents an attempt for an overall calibration of the Meyer-Peter and Müller formula that covers multiple sets of measurements, in contrast to partial calibrations referred to individual measurement sets.
2. Study Area
The study area is described in [7], and this description is repeated here for reasons of completeness.
The Nestos River basin considered in this study drains an area of 838 km2 and lies downstream of Platanovrysi Dam. The river basin outlet is located at Toxotes. The river basin terrain is covered by forest (48%), bush (20%), cultivated land (24%), urban area (2%) and no significant vegetation (6%). The altitude ranges between 80 m and 1600 m, whereas the length of Nestos River is 55 km. The basin is divided into 20 natural sub-basins with areas between 13 km2 and 80 km2. The mean slope of the sub-basins ranges between 23% and 58%, the mean slope of the main streams of the sub-basins ranges between 2.5% and 20%, whereas the mean slope of Nestos River in the basin is 0.35%.
3. Stream Flow Rate and Bed Load Transport Rate Measurements
The stream flow rate and bed load transport rate measurements concerning Nestos River were conducted at a location between the outlet of Nestos River basin (Toxotes) and the river delta (e.g., [8,9,10,11,12]). The measurement procedures are described in [7]. The average width of the cross sections of all measurements is about 26.7 m. The dates of all measurements as well as the stream flow rates and bed load transport rates of Nestos River are presented in Table A1, which is given in the Appendix A.
4. Bed Load Transport Rate Calculations
mG: bed load transport rate per unit width (kg/(m·s))
g: gravity acceleration (m/s2)
ρF: sediment density (kg/m3)
ρW: water density (kg/m3)
το: actual shear stress (N/m2)
το,cr: critical shear stress (N/m2)
dm: bed load particles mean diameter (m)
Ir: energy line slope due to individual particles
Rs: hydraulic radius of the specific part of the cross section under consideration which affects the bed load transport (m)
I: energy line slope due to individual particles and stream bed forms
kr: coefficient, the value of which depends on the roughness due to individual particles (m1/3/s)
kst: Strickler coefficient, the value of which depends on the roughness due to individual particles as well as to stream bed forms (m1/3/s)
d90: characteristic grain size diameter (m) (in case of taking a sample of stream bed load, the 90% of the sample weight is comprised by grains with size less or equal to d90).
From Equation (1) is evident that bed load transport rate is expressed as a function of the difference between the actual shear stress and the critical shear stress, which is associated with the initiation of movement of the stream bed particles.
As pointed out in [3], the mechanisms involved in the Meyer-Peter and Müller model [13] and the Einstein- Barbarossa method [14] lead to the formula of Equation (7) for the stream cross section A:
where R is the hydraulic radius and U the wetted perimeter. The index s refers to the bed and the index w to the walls. The hydraulic radii Rw and Rs are given by Equations (8) and (9), as derived in [3]:
where um (m/s) is the mean flow velocity through the cross-sectional area A and kw (m1/3/s) a coefficient depending on the roughness of the walls. Also kw = kst, and I is set equal to the longitudinal stream bed slope on the basis of the assumption of uniform flow. As in [3], an equivalent rectangular cross section is considered, and the median particle diameter d50 substitutes the mean particle diameter dm, because grain size distribution curves are available for all the bed load transport rate measurements. The median particle diameter is considered as representative of the different particle diameters of the bed load material.
5. Manual Calibration of the Meyer-Peter and Müller Formula
In the framework of the elaborated diploma theses, the estimation of the Strickler coefficient kst, which refers to the total roughness, due to individual particles as well as to stream bed forms, was performed employing a manual calibration procedure, namely assuming that the bed load transport rate mG is well-known from the measurements. In concrete terms, the measurements conducted by the same students group, were used for the determination of the coefficient kst. If, for example, five measurements, as usually, were conducted by a students group, then five values of kst were determined, and finally, the mean value of the five kst values was taken into account for the calculation of the five bed load transport rates. The mean value of kst for Nestos River, according to the above described manual calibration, amounts to about 18.5 m1/3/s.
The outcomes of the calculations of bed load transport rate for Nestos River are given in Table A1.
6. Calibration of the Bed Load Transport Model for Nestos River
According to the model employed (Equations (1)–(6)), the computed value of the bed load transport rate, denoted as mGci, is equal to:
where
and
In the present work, kst is treated as a parameter of adjustment to be determined through the minimization of the sum of squares of the differences between computed and measured values of sediment transport rate:
An improved fit is achieved if the objective function of Equation (14) is equipped with two further parameters α and β, as follows:
In Equation (15) above, α is a scaling parameter and β replaces the exponent (3/2) in Equations (10) and (11). Both parameters are strictly positive. Thus, Equation (15) expresses the objective function of the problem, which is posed as follows: Minimize f with respect to α and β for a range of values of the physical parameter kst.
The consideration of both parameters α and β simultaneously is the point at which the present study differs from the one presented in [3].
The value of kst, kst = 18.447 m1/3/s, was derived through manual calibration of the Meyer-Peter and Müller model [13] on the basis of the 68 measurements, as described in [7].
The corresponding optimal values of α and β are: α = 0.427401, β = 0.209616.
Figure 1 shows measured (mGmi) versus calibrated computed (mGci) values.
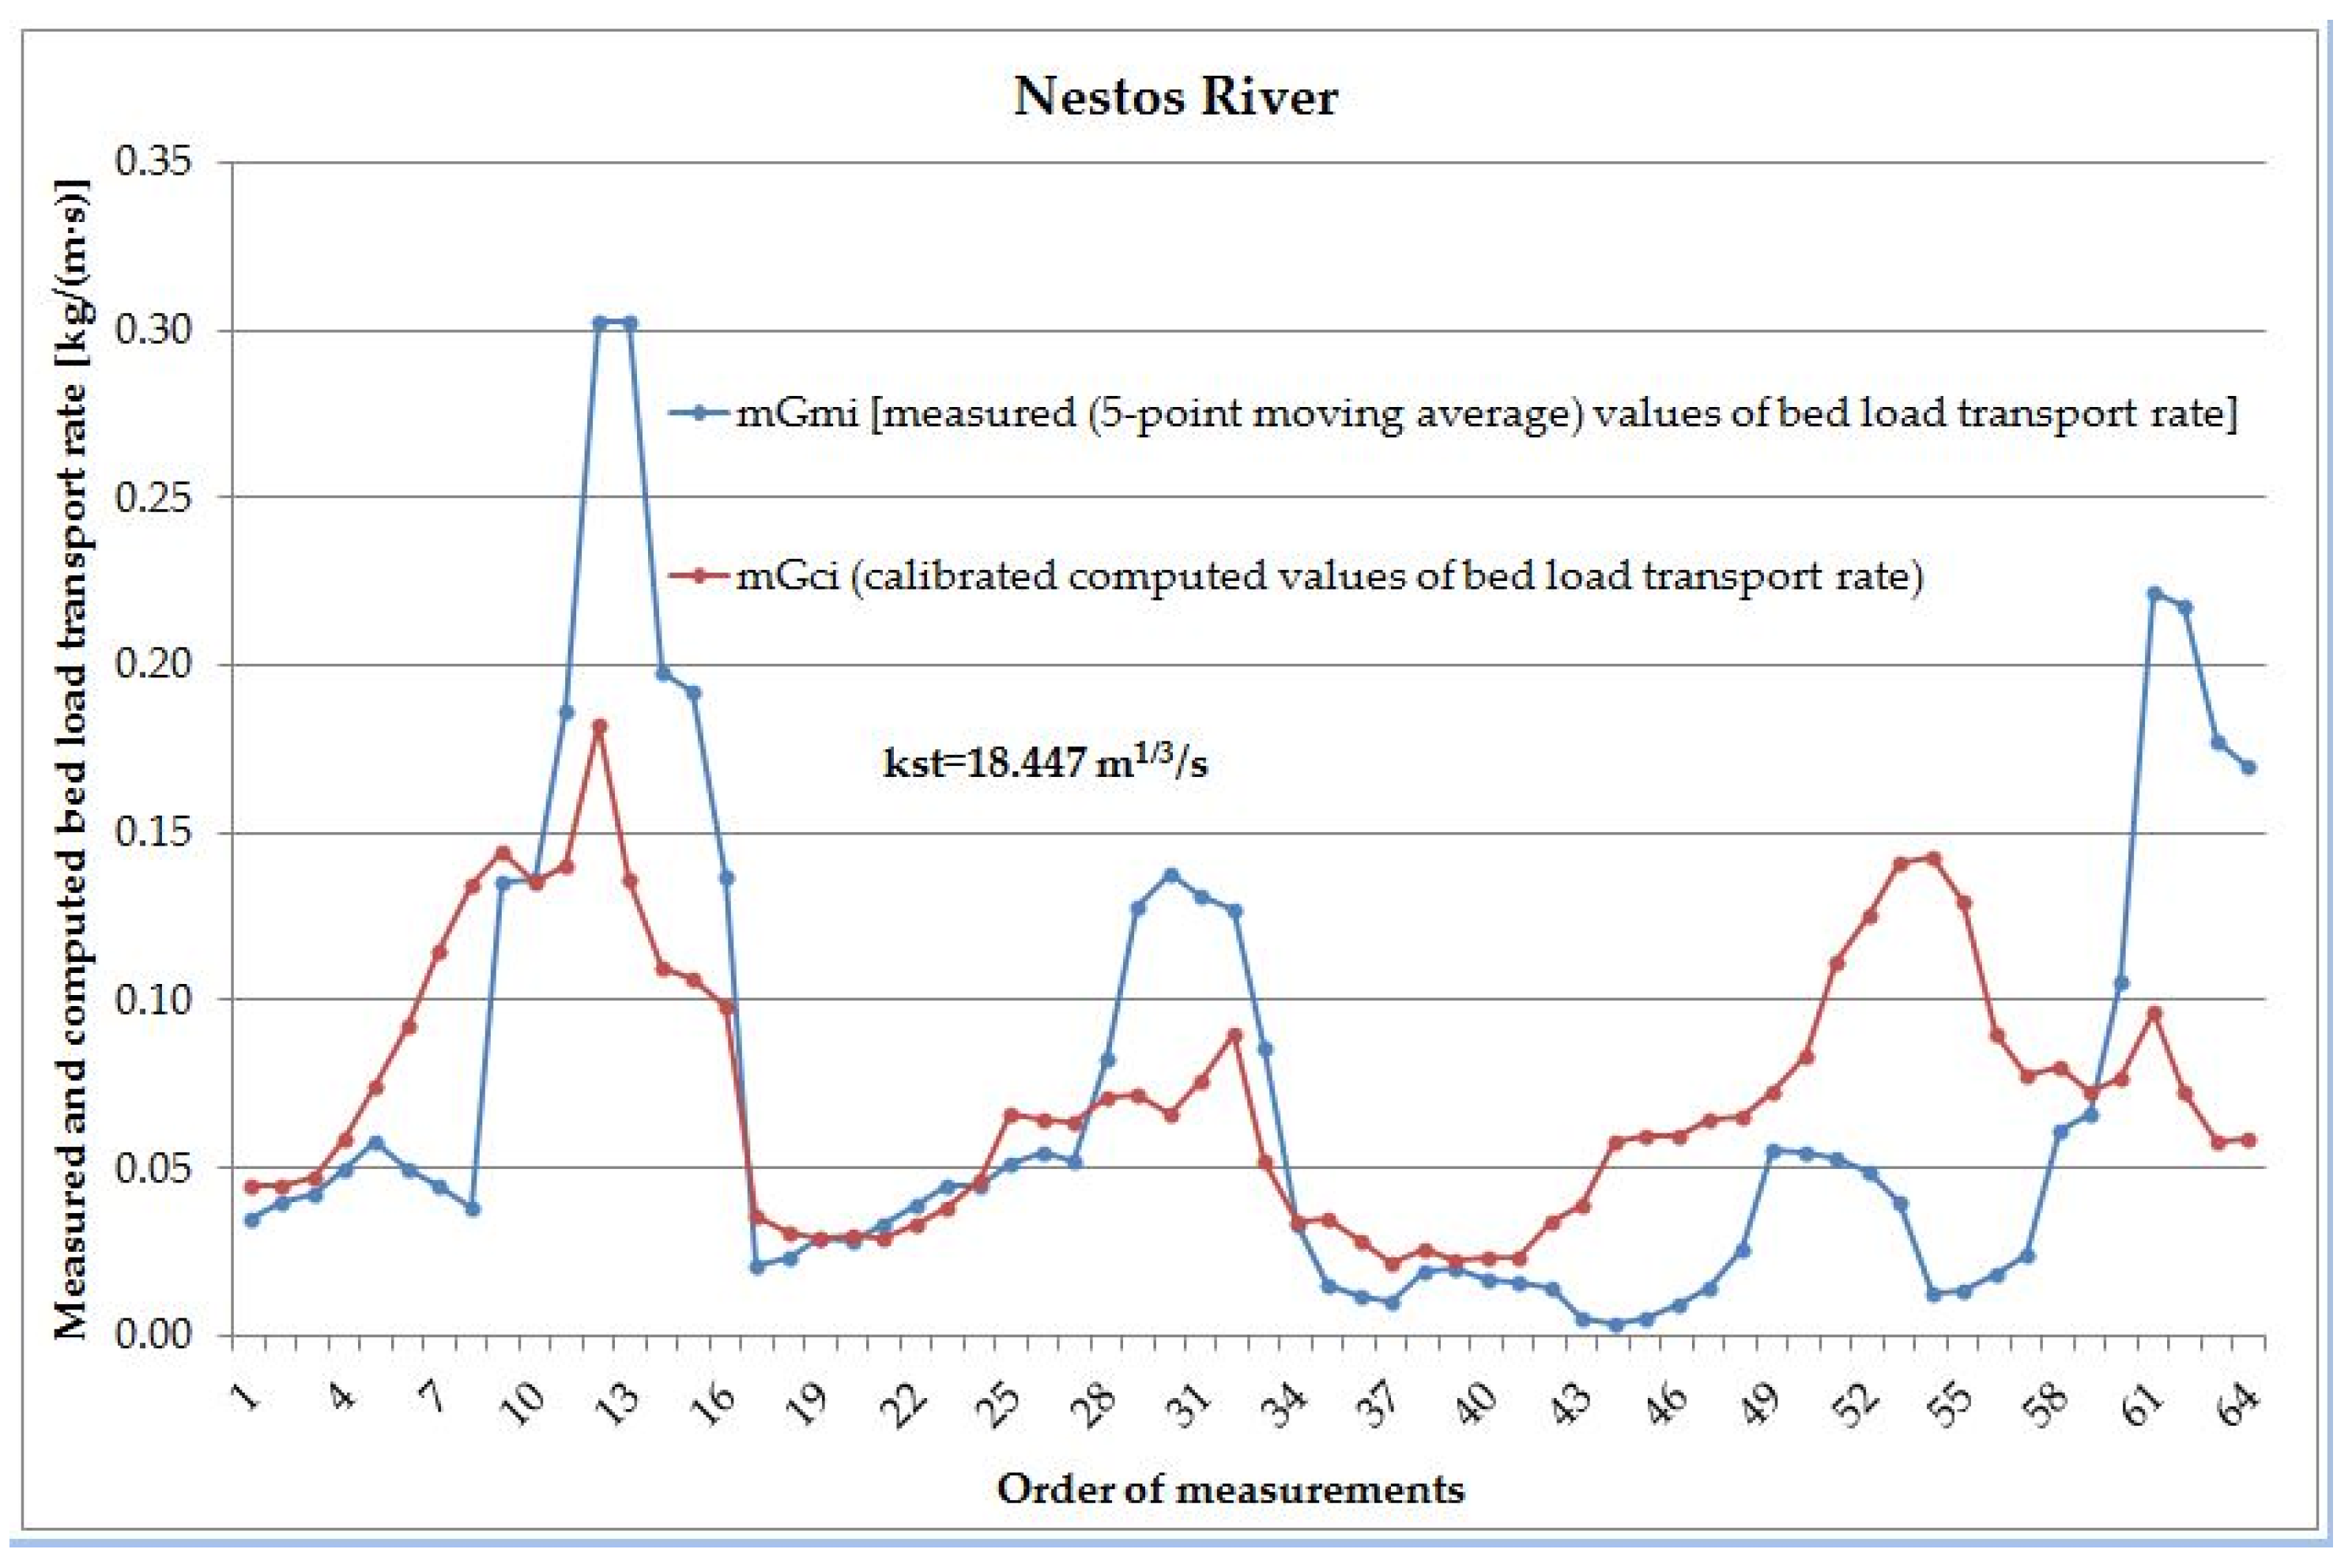
If instead of the measured bed load values themshelves, their 5-point moving average is considered, then these moving averages present a better agreement to the respective values computed on the basis of the same model. The value of kst was again taken equal to kst = 18.447 m1/3/s, but the optimal values of the parameters α and β are in this case α = 0.000325756, β = 2.15642.
Figure 2 shows 5-point moving average measured (mGmi) versus calibrated computed (mGci) values.
7. Comparison between Calculated and Measured Bed Load Transport Rates
The comparison between calculated and site-measured values of stream bed load transport rate is made on the basis of the following statistical criteria [3,15]:
- Root Mean Square Error (RMSE)
- Relative Error (RE) (%)
- Efficiency Coefficient EC (Nash and Sutcliffe, 1970) [16]
- Linear correlation coefficient r
- Determination coefficient r2
- Discrepancy ratio
The above mentioned statistical criteria values concerning Nestos River, for the case of manual calibration, are listed in Table 1. It is noted that the relative error value depicted in Table 1, represents the average value of the relative errors calculated for each pair of calculated and site-measured bed load values.
In general, the obtained values of the statistical criteria RMSE, EC, r and r2 for Nestos River can be considered fairly satisfactory. Additionally, the degree of linear dependence between calculated and measured bed load transport rate is very high.
In Table 2, the values of the statistical criteria used in the present study, for Nestos River and for the case of optimization, are shown.
The values of the statistical criteria for Nestos River, according to Table 2, are not satisfactory in comparison to the corresponding values of Table 1, except for the statistical criterion RE, which, in the case of optimization, obtains a more satisfactory value in comparison to the case of manual calibration.
In Table 3, the values of the statistical criteria used in the present study, for Nestos River and for the case of optimization, are given, where instead of the measured bed load values themselves, their 5-point moving averages are taken into account.
The values of the statistical criteria for Nestos River, according to Table 3, are not satisfactory in comparison to the corresponding values of Table 1, except for the statistical criterion RE, which, in the case of optimization, obtains a more satisfactory value in comparison to the case of manual calibration. However, the values of the statistical criteria, according to Table 3, are more satisfactory in comparison to the corresponding values of Table 2.
8. Discussion—Conclusions
An overall calibration of the Meyer-Peter and Müller formula [13] is presented on the basis of bed load measurements in a specific location of the Nestos River basin. In the present study, the optimization of the bed roughness coefficient is performed in a uniform manner for the whole range of the measured data after including at once all the available measured values of bed load transport rate. This calibration is contrasted to manual calibrations carried out on partial measurement sets. Similar attempts have been presented in relation to measurements in Kosynthos River and Kimmeria Torrent, two other streams of local importance [3]. The present approach is different in the sense of considering both parameters α and β defined above, simultaneously, while kst was given a priori a constant realistic fixed value. This value is the average of the results of the above mentioned manual calibrations.
The differences between computed and measured bed load transport values followed the trend indicated in the literature [5], while consideration of moving averages instead of raw bed load measurements results in a much better adjustment of the Meyer-Peter and Müller model [13]. In this way, a different view of the simulating capacity of the model under study is given.
Conflicts of Interest
The authors declare no conflict of interest.
Appendix A. Bed Load Transport Rate Measurements

Table A1.
Stream flow rate and bed load transport rate measurements of Nestos River—Calculated bed load transport rate.
Table A1.
Stream flow rate and bed load transport rate measurements of Nestos River—Calculated bed load transport rate.
| No of Measurement | Date | Stream Flow Rate (m3/s) | Bed Load Transport Rate | Bed Load Transport Rate | Bed Load Transport Rate |
|---|---|---|---|---|---|
| (kg/(m·s)) | (kg/(m·s)) | (kg/(m·s)) | |||
| Site-Measured | Calculated (Manual Calibration) | Calculated (Parameters) | |||
| 1 | 26 September 2005 | 14.170 | 0.0240 | 0.0193 | 0.0537 |
| 2 | 27 September 2005 | 17.440 | 0.0300 | 0.0232 | 0.0579 |
| 3 | 29 September 2005 | 16.650 | 0.0440 | 0.0323 | 0.0585 |
| 4 | 30 September 2005 | 18.490 | 0.0270 | 0.0313 | 0.0571 |
| 5 | 30 October 2008 | 2.729 | 0.0033 | 0.0031 | 0.0479 |
| 6 | 1 November 2008 | 2.694 | 0.0025 | 0.0017 | 0.0485 |
| 7 | 3 November 2008 | 3.086 | 0.0033 | 0.0044 | 0.0520 |
| 8 | 21 July 2010 | 3.954 | 0.0433 | 0.0501 | 0.0702 |
| 9 | 22 July 2010 | 4.223 | 0.0499 | 0.0408 | 0.0690 |
| 10 | 22 July 2010 | 4.129 | 0.0594 | 0.0339 | 0.0682 |
| 11 | 26 July 2010 | 6.198 | 0.0425 | 0.0671 | 0.0680 |
| 12 | 27 July 2010 | 4.798 | 0.0599 | 0.0629 | 0.0688 |
| 13 | 29 July 2010 | 3.763 | 0.0638 | 0.0391 | 0.0682 |
| 14 | 3 August 2010 | 3.161 | 0.0349 | 0.0276 | 0.0709 |
| 15 | 5 August 2010 | 9.951 | 0.0143 | 0.0275 | 0.0513 |
| 16 | 15 September 2010 | 4.217 | 0.0226 | 0.0210 | 0.0509 |
| 17 | 30 September 2010 | 4.802 | 0.0283 | 0.0253 | 0.0503 |
| 18 | 2 November 2010 | 2.055 | 0.0515 | 0.0393 | 0.0484 |
| 19 | 3 November 2010 | 1.882 | 0.0499 | 0.0465 | 0.0462 |
| 20 | 5 November 2010 | 1.489 | 0.0594 | 0.0422 | 0.0503 |
| 21 | 5 November 2010 | 1.747 | 0.0425 | 0.0404 | 0.0535 |
| 22 | 18 November 2010 | 1.661 | 0.0068 | 0.0083 | 0.0546 |
| 23 | 25 November 2010 | 1.546 | 0.0173 | 0.0179 | 0.0537 |
| 24 | 26 November 2010 | 1.651 | 0.0160 | 0.0096 | 0.0499 |
| 25 | 3 December 2010 | 2.029 | 0.0038 | 0.0047 | 0.0472 |
| 26 | 3 December 2010 | 0.800 | 0.0046 | 0.0062 | 0.0486 |
| 27 | 24 March 2011 | 3.269 | 0.0189 | 0.0185 | 0.0552 |
| 28 | 25 March 2011 | 2.234 | 0.0465 | 0.0454 | 0.0480 |
| 29 | 29 March 2011 | 2.831 | 0.0151 | 0.0253 | 0.0547 |
| 30 | 2 April 2011 | 3.399 | 0.0304 | 0.0274 | 0.0547 |
| 31 | 2 April 2011 | 3.285 | 0.0177 | 0.0349 | 0.0492 |
| 32 | 7 April 2011 | 1.772 | 0.0202 | 0.0307 | 0.0528 |
| 33 | 9 April 2011 | 1.055 | 0.0101 | 0.0180 | 0.0523 |
| 34 | 27 April 2011 | 3.676 | 0.0152 | 0.0301 | 0.0543 |
| 35 | 20 November 2011 | 1.813 | 0.0292 | 0.0316 | 0.0510 |
| 36 | 22 November 2011 | 0.586 | 0.0175 | 0.0088 | 0.0564 |
| 37 | 14 March 2012 | 1.061 | 0.0246 | 0.0291 | 0.0510 |
| 38 | 15 March 2012 | 1.428 | 0.0389 | 0.0750 | 0.0488 |
| 39 | 16 September 2012 | 0.507 | 0.0020 | 0.0035 | 0.0495 |
| 40 | 23 September 2012 | 0.882 | 0.0062 | 0.0066 | 0.0487 |
| 41 | 11 November 2012 | 1.360 | 0.0143 | 0.0107 | 0.0457 |
| 42 | 26 November 2012 | 0.796 | 0.0128 | 0.0199 | 0.0541 |
| 43 | 26 November 2012 | 0.837 | 0.0183 | 0.0224 | 0.0530 |
| 44 | 26 November 2012 | 0.927 | 0.0120 | 0.0099 | 0.0523 |
| 45 | 27 November 2012 | 1.593 | 0.0816 | 0.0421 | 0.0464 |
| 46 | 27 November 2012 | 0.875 | 0.0038 | 0.0023 | 0.0595 |
| 47 | 27 November 2012 | 2.048 | 0.0468 | 0.0399 | 0.0532 |
| 48 | 28 November 2012 | 1.059 | 0.0062 | 0.0087 | 0.0514 |
| 49 | 28 November 2012 | 0.851 | 0.0115 | 0.0058 | 0.0462 |
| 50 | 16 July 2013 | 0.493 | 0.0339 | 0.0535 | 0.0525 |
| 51 | 14 May 2014 | 5.450 | 0.0193 | 0.0174 | 0.0500 |
| 52 | 14 May 2014 | 6.605 | 0.0102 | 0.0134 | 0.0508 |
| 53 | 15 June 2014 | 9.750 | 0.0204 | 0.0342 | 0.0480 |
| 54 | 15 June 2014 | 12.980 | 0.0139 | 0.0185 | 0.0503 |
| 55 | 16 June 2014 | 9.833 | 0.0385 | 0.0313 | 0.0558 |
| 56 | 18 October 2014 | 6.538 | 0.2127 | 0.2020 | 0.0697 |
| 57 | 18 October 2014 | 4.317 | 0.2692 | 0.1808 | 0.0527 |
| 58 | 18 October 2014 | 6.110 | 0.2022 | 0.2105 | 0.0551 |
| 59 | 19 October 2014 | 9.660 | 0.5370 | 0.3523 | 0.0452 |
| 60 | 19 October 2014 | 2.256 | 0.1087 | 0.0656 | 0.0573 |
| 61 | 19 October 2014 | 2.225 | 0.0625 | 0.0718 | 0.0525 |
| 62 | 19 October 2014 | 5.743 | 0.1511 | 0.2086 | 0.0527 |
| 63 | 19 October 2014 | 2.379 | 0.0421 | 0.0805 | 0.0524 |
| 64 | 19 October 2014 | 6.153 | 0.2120 | 0.2000 | 0.0509 |
| 65 | 20 October 2014 | 2.930 | 0.0616 | 0.0851 | 0.0422 |
| 66 | 20 October 2014 | 6.930 | 0.2920 | 0.2222 | 0.0549 |
| 67 | 20 October 2014 | 9.760 | 0.6173 | 0.6173 | 0.0441 |
| 68 | 21 October 2014 | 13.410 | 0.6030 | 0.4366 | 0.0550 |
References
- Kaffas, K.; Hrissanthou, V. Estimate of continuous sediment graphs in a basin, using a composite mathematical model. Environ. Process. 2015, 2, 361–378. [Google Scholar] [CrossRef]
- Metallinos, A.; Hrissanthou, V. Regression relationships between sediment yield and hydraulic and rainfall characteristics for two basins in northeastern Greece. In Proceedings of the 6th International Symposium on Environmental Hydraulics, Athens, Greece, 1–5 July 2010; Volume II; pp. 899–904. [Google Scholar]
- Papalaskaris, T.; Hrissanthou, V.; Sidiropoulos, E. Calibration of bed load transport rate model in streams of NE Greece. Eur. Water 2016, 55, 125–139. [Google Scholar]
- Claude, N.; Rodrigues, S.; Bustillo, V.; Bréhéret, J.-G.; Macaire, J.-J.; Jugé, P. Estimating bedload transport in a large sand-gravel bed river from direct sampling, dune tracking and empirical formulas. Geomorphology 2012, 179, 40–57. [Google Scholar] [CrossRef]
- López, R.; Vericat, D.; Batalla, R.J. Evaluation of bed load transport formulae in a large regulated gravel bed river: The lower Ebro (NE Iberian Peninsula). J. Hydrol. 2014, 510, 164–181. [Google Scholar] [CrossRef]
- Vázquez-Tarrío, D.; Menéndez-Duarte, R. Assessment of bed load equations using data obtained with tracers in two coarse-bed mountain streams (Narcea River basin, NW Spain). Geomorphology 2015, 238, 78–93. [Google Scholar] [CrossRef]
- Papalaskaris, T.; Dimitriadou, P.; Hrissanthou, V. Comparison between computations and measurements of bed load transport rate in Nestos River, Greece. In Proceedings of the 2nd EWaS International Conference, Chania, Crete, Greece, 1–4 June 2016. [Google Scholar]
- Aresti, I.; Kardasis, A.; Filiadis, D. Measurements of Stream Discharge and Bed Load Transport Rate in Nestos River (November 2012). Diploma Thesis, Department of Civil Engineering, Democritus University of Thrace, Xanthi, Greece, 2013. (In Greek). [Google Scholar]
- Konstantinopoulou-Pesiou, C.; Sfyris, D. Measurements of Stream Discharge and Sediment Discharge of Nestos River (November 2012). Diploma Thesis, Department of Civil Engineering, Democritus University of Thrace, Xanthi, Greece, 2013. (In Greek). [Google Scholar]
- Mpenekos, K.; Kassotakis, E. Measurements of Stream Discharge and Sediment Discharge in Nestos River during May and June 2014. Diploma Thesis, Department of Civil Engineering, Democritus University of Thrace, Xanthi, Greece, 2015. (In Greek). [Google Scholar]
- Angelis, Ι.; Metallinos, A.; Hrissanthou, V. Regression analysis between sediment transport rates and stream discharge for the Nestos River, Greece. Glob. NEST J. 2012, 14, 362–370. [Google Scholar]
- Metallinos, A.; Hrissanthou, V. Regression relationships between sediment transport rate and water discharge for Nestos River, Greece. In Proceedings of the 12th International Conference on Environmental Science and Technology, Rhodes Island, Greece, 8–10 September 2011; Volume 2, pp. 1235–1242. [Google Scholar]
- Meyer-Peter, E.; Müller, R. Formulas for bed load transport. In Proceedings of the 2nd Meeting of the International Association of Hydraulic Research, Stockholm, Sweden, 7–9 June 1948; pp. 39–64. [Google Scholar]
- Hrissanthou, V.; Tsakiris, G. Sediment Transport (16). In Water Resources: I. Engineering Hydrology; Tsakiris, G., Ed.; Symmetria: Athens, Greece, 1995; pp. 537–577. (In Greek) [Google Scholar]
- Krause, P.; Boyle, D.P.; Bäse, F. Comparison of different efficiency criteria for hydrological model assessment. Adv. Geosci. 2005, 5, 89–97. [Google Scholar] [CrossRef]
- Nash, J.E.; Sutcliffe, J.V. River flow forecasting through conceptual models, Part I—A discussion of principles. J. Hydrol. 1970, 10, 282–290. [Google Scholar] [CrossRef]
Figure 1.
Measured and calibrated computed values of bed load transport rate of Nestos River.
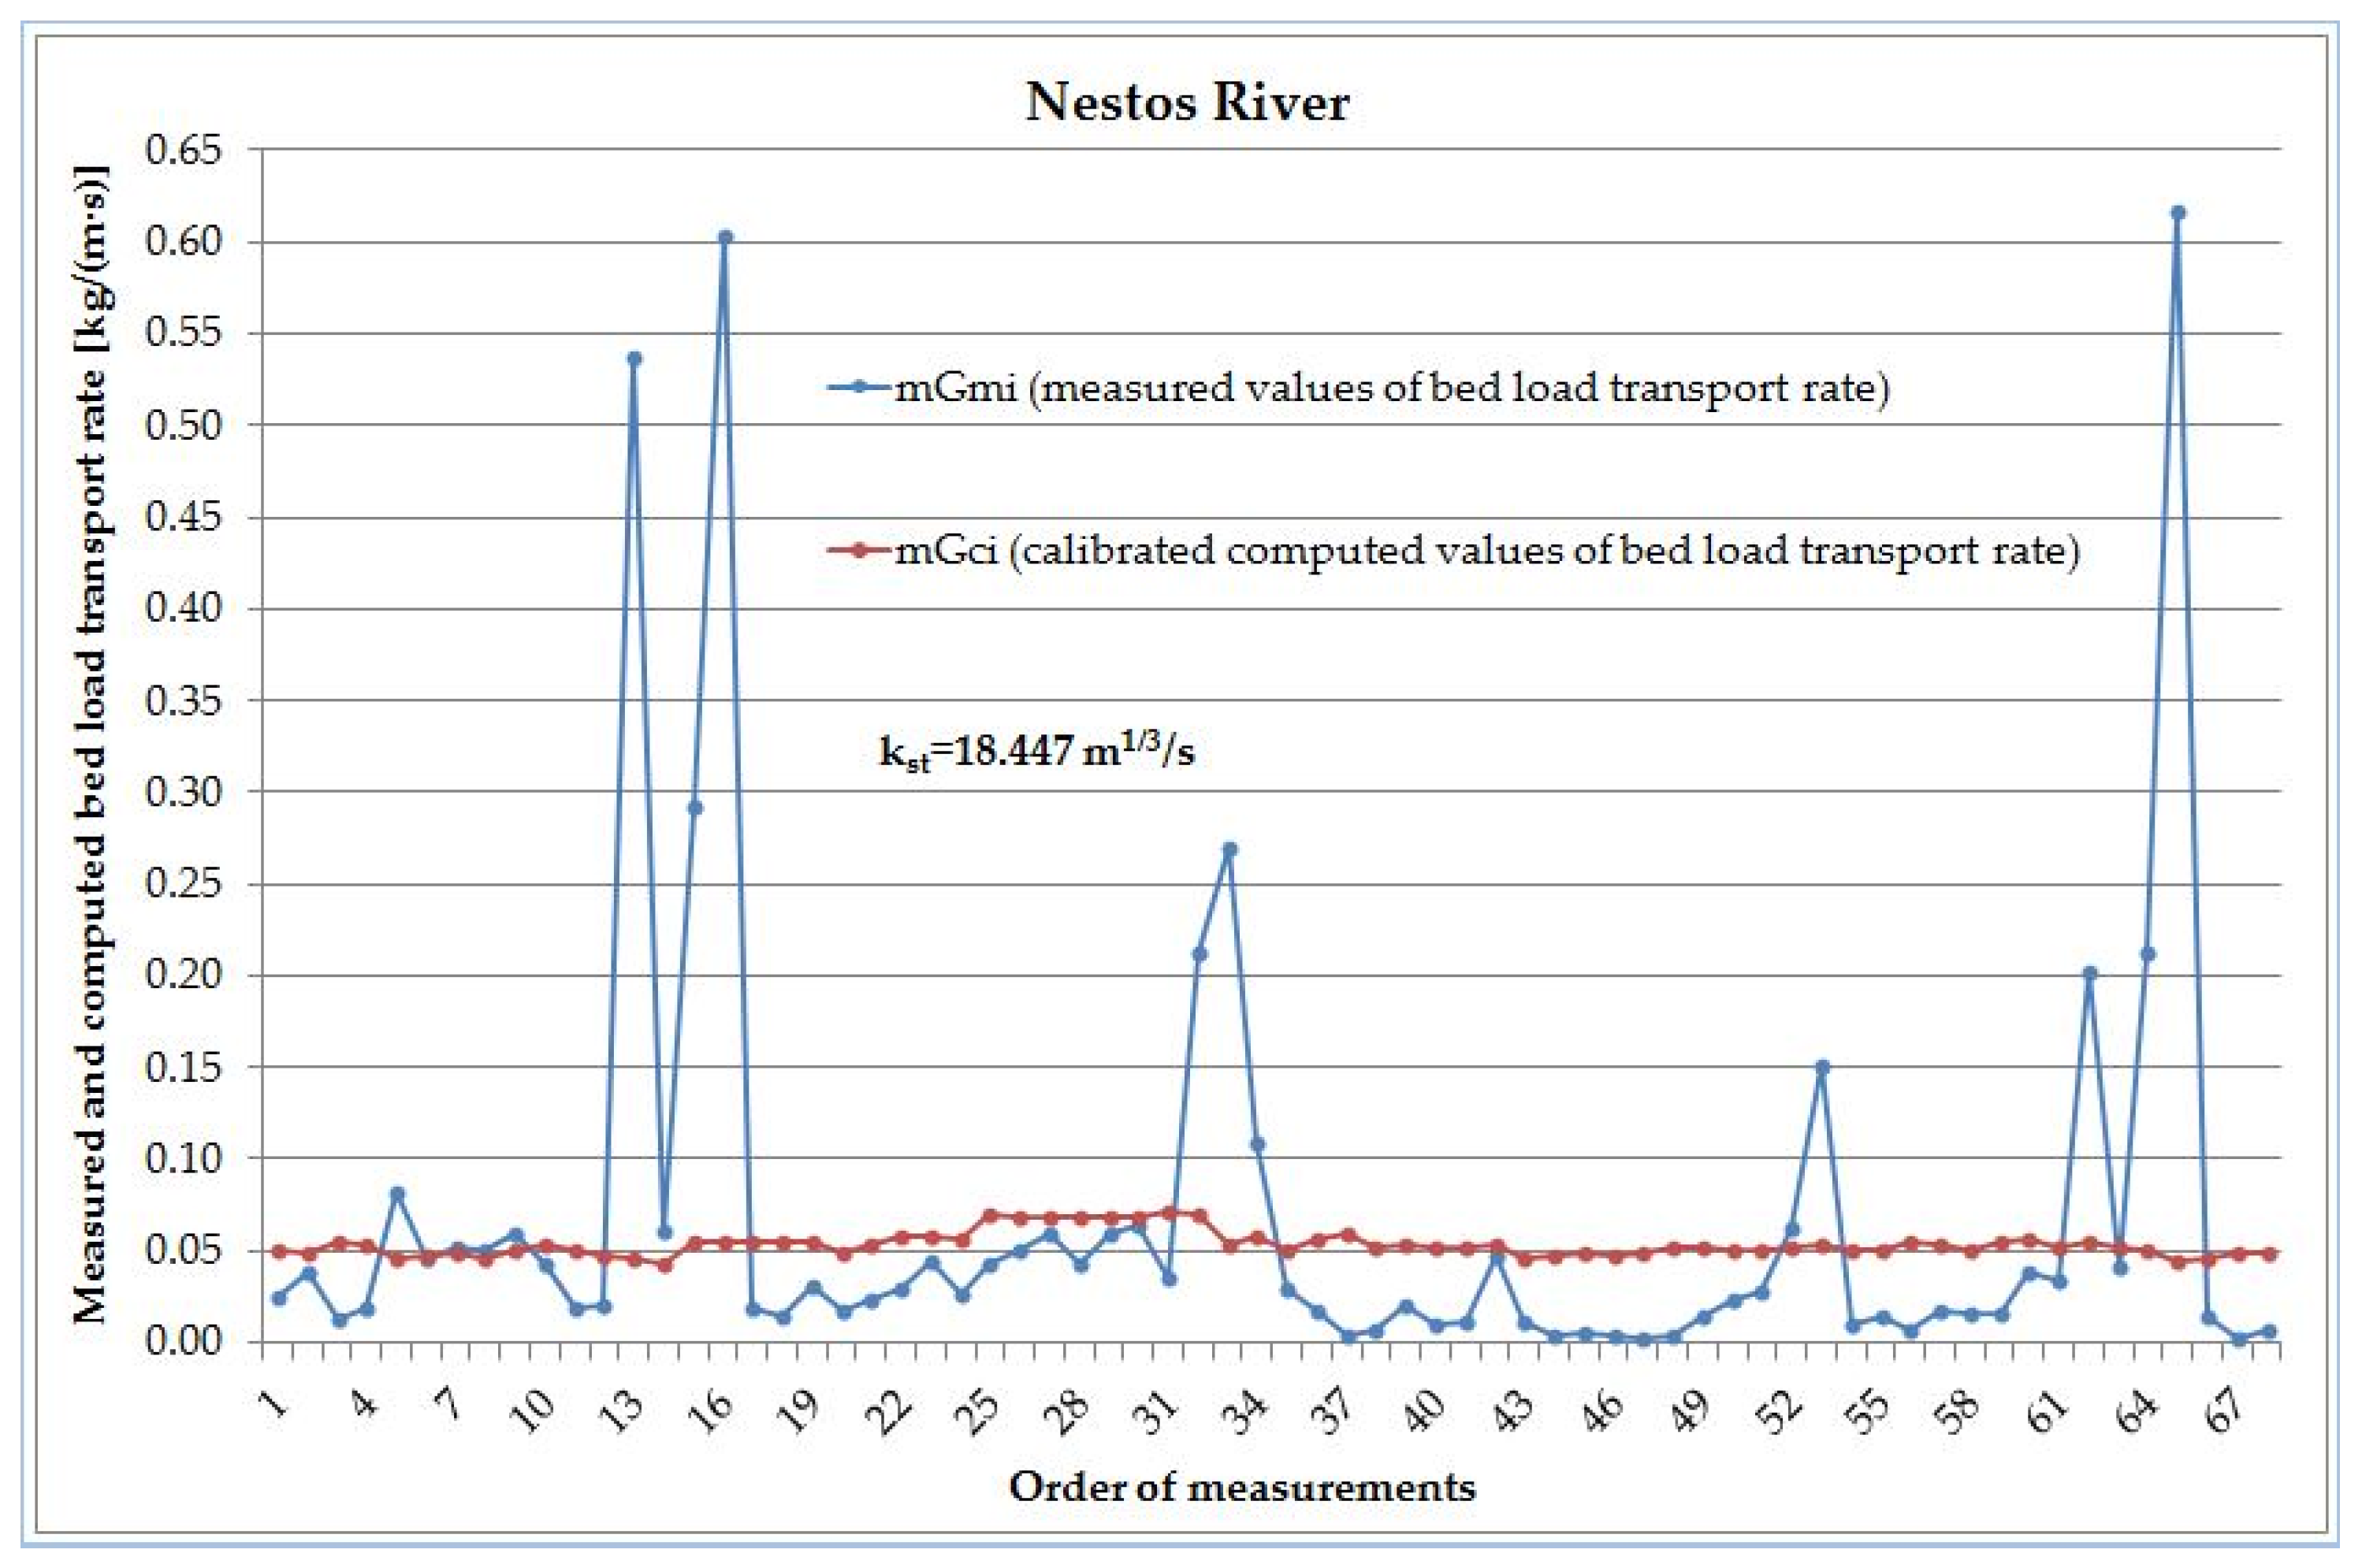
Figure 2.
Measured (5-point moving average) and calibrated computed values of bed load transport rate of Nestos River.
Figure 2.
Measured (5-point moving average) and calibrated computed values of bed load transport rate of Nestos River.
Table 1.
Statistical criteria values of Nestos River (manual calibration).
| Number of Paired Values | RMSE | RE | EC | r | r2 | Discrepancy Ratio |
|---|---|---|---|---|---|---|
| (kg/(m·s)) | (%) | |||||
| 68 | 0.0363 | −8.6613 | 0.9171 | 0.9694 | 0.9397 | 1.0000 |
Table 2.
Statistical criteria values of Nestos River (optimization).
| Number of Paired Values | RMSE | RE | EC | r | r2 | Discrepancy Ratio |
|---|---|---|---|---|---|---|
| (kg/(m·s)) | (%) | |||||
| 68 | 0.1279 | −2.6298 | −0.0282 | −0.0658 | 0.0043 | 0.3676 |
Table 3.
Statistical criteria values of Nestos River (5-point moving average measured values, optimization).
Table 3.
Statistical criteria values of Nestos River (5-point moving average measured values, optimization).
| Number of Paired Values | RMSE | RE | EC | r | r2 | Discrepancy Ratio |
|---|---|---|---|---|---|---|
| (kg/(m·s)) | (%) | |||||
| 64 | 0.0600 | −1.2486 | 0.2957 | 0.5438 | 0.2957 | 0.6094 |
Publisher’s Note: MDPI stays neutral with regard to jurisdictional claims in published maps and institutional affiliations. |
© 2018 by the authors. Licensee MDPI, Basel, Switzerland. This article is an open access article distributed under the terms and conditions of the Creative Commons Attribution (CC BY) license (https://creativecommons.org/licenses/by/4.0/).
Share and Cite
MDPI and ACS Style
Sidiropoulos, E.; Papalaskaris, T.; Hrissanthou, V. Parameter Optimization of a Bed Load Transport Formula for Nestos River, Greece. Proceedings 2018, 2, 627. https://doi.org/10.3390/proceedings2110627
AMA Style
Sidiropoulos E, Papalaskaris T, Hrissanthou V. Parameter Optimization of a Bed Load Transport Formula for Nestos River, Greece. Proceedings. 2018; 2(11):627. https://doi.org/10.3390/proceedings2110627
Chicago/Turabian StyleSidiropoulos, Epameinondas, Thomas Papalaskaris, and Vlassios Hrissanthou. 2018. "Parameter Optimization of a Bed Load Transport Formula for Nestos River, Greece" Proceedings 2, no. 11: 627. https://doi.org/10.3390/proceedings2110627