Modelling of the Effect of Drained Peat Soils to Water Quality Using MACRO and SOILN Models †


Department of Civil Engineering and Architecture, Tallinn University of Technology, 19086 Tallinn, Estonia
*
Author to whom correspondence should be addressed.
†
Presented at the 3rd EWaS International Conference on “Insights on the Water-Energy-Food Nexus”, Lefkada Island, Greece, 27–30 June 2018.
Proceedings 2018, 2(11), 619; https://doi.org/10.3390/proceedings2110619
Published: 1 August 2018
(This article belongs to the Proceedings of EWaS3 2018)
Abstract
:Investigations have indicated that in addition to traditional sources, drained peat soils can be considered as a significant source of nitrogen in Estonia. This changes the measures to improve water quality in rivers. At present modelling of nitrogen in rivers has been concentrated on influence of agricultural activity. However, drained peat can increase nitrogen concentrations even without fertilization and farming activities. This investigation describes the attempt to model water quality in the watershed with large share of drained peat soils. A good alignment between measured and modelled nitrate concentrations using the MACRO and the SOILN for MACRO models was shown.
1. Introduction
Reduction of riverine nutrient loads is one of the major environmental management goals in the Baltic Sea region and thus also in Estonia. However, recent data analyzes of Estonian rivers show that nitrogen concentrations have increased in some rivers [1] despite the decrease of fertilizer usage [2]. An increase in nitrogen (N) concentrations has even been detected in watersheds with very low human activity [1]. Hoffmann et al. [3] assumed that increases of pollution by nutrients may also be caused by wide-scale melioration. Some authors [4,5,6] have reported that drainage of peat soils leads to decomposition of peat and increases fluxes of nutrients to watercourses. Drainage of peatlands results in peat oxidation and significantly changes their physical and chemical properties [7,8]. This can result in high nitrate-nitrogen (NO3_N) concentrations in the pore water of drained peatlands that is caused by the aeration of peat and subsequent mineralization and nitrification of organic N [9]. In [2] an increase of nitrogen concentrations in some Estonian river basins with high percentage of drained peat soils was observed. Mineralization of nitrogen from peat soils is regarded as another possible source of nutrients in Europe [10]. In [11] a statistical model MESAW showed that unit-area loads from drained peat areas can be up to 2.3 times higher than from arable lands. The main objective of this paper was to try to model water quality in the watershed with large share of drained peat soils. A good fit between measured and modelled nitrate nitrogen concentrations using MACRO and SOILN for MACRO models was shown. In addition, it was concluded that nitrate concentrations depend on weather conditions that may lead to positive trend of nitrates in rivers with very low human activity.
2. Models and Study Area
Usually the modelling of nitrogen leaching comprises of two main tasks. The first is to model water fluxes because water is a carrier of nitrogen. The second task is to model the chemical behavior and leaching of nitrogen in soils. Most conceptual hydrological models cannot provide the data needed to calculate nitrogen transformations in soils, and it is difficult to couple them with the nitrogen-leaching models. The MACRO model used in this study was developed to simulate data needed for this type of models but it can be used only for field-scales. The model is one-dimensional, developed for use in small homogeneous areas at the field or plot scale.
The MACRO model considers the division of the soil profile into the micro- and macropores. Soil macropores (e.g., root and worm holes, structural shrinkage cracks) allow rapid non-equilibrium fluxes of water in soil [12], and consequently influence the leaching of nitrogen. Larsson & Jarvis [13] showed that such influence might be quite significant. Hydrological models developed for watersheds usually ignore the exchange of water and nutrients between micro- and macropores. In this study, the MACRO model was used as some authors [7] have indicated the presence of macropores in peat soils.
The SOILN model simulates major carbon (C) and nitrogen (N) flows and corresponding processes in soils and plants. The model has a daily time step and simulates flow and state variables at a field level. Input variables like daily data on the air temperature, solar radiation, evaporation, soil heat and water conditions etc. are gained from MACRO model. The soil vertical profile is divided into layers. In each layer, mineral N is represented by one pool for ammonium N and one for nitrate N. Ammonium N is usually regarded as immobile, whereas nitrate form is transported with the water fluxes (a special option can also make ammonium mobile). The ammonium pool might be increased by the nitrogen supplied from manure application, mineralization of organic material and by atmospheric deposition, and it is decreased by immobilization to an organic material, nitrification to the nitrate pool and plant uptake. The nitrate store increases through the nitrification of the ammonium pool, fertilization and atmospheric deposition. The leaching, denitrification and plant uptake reduce the amount of nitrate N in the soils. Water flows that transport nitrate N between the layers are responsible for nitrogen leaching. The rate of the decomposition of organic matter depends on soil moisture and temperature conditions. Nitrogen dynamics of the organic matter is governed by C flows and mineralization or immobilization depends on the C/N ratio of the decomposed material and availability of mineral N [14]. SOILN for MACRO takes into account the nitrate exchange between the macro- and micropores [13,15]. The models were adapted according to the scheme described in [16]. The scheme includes calculations for the different soil profiles and simulation of water movement in the river system.
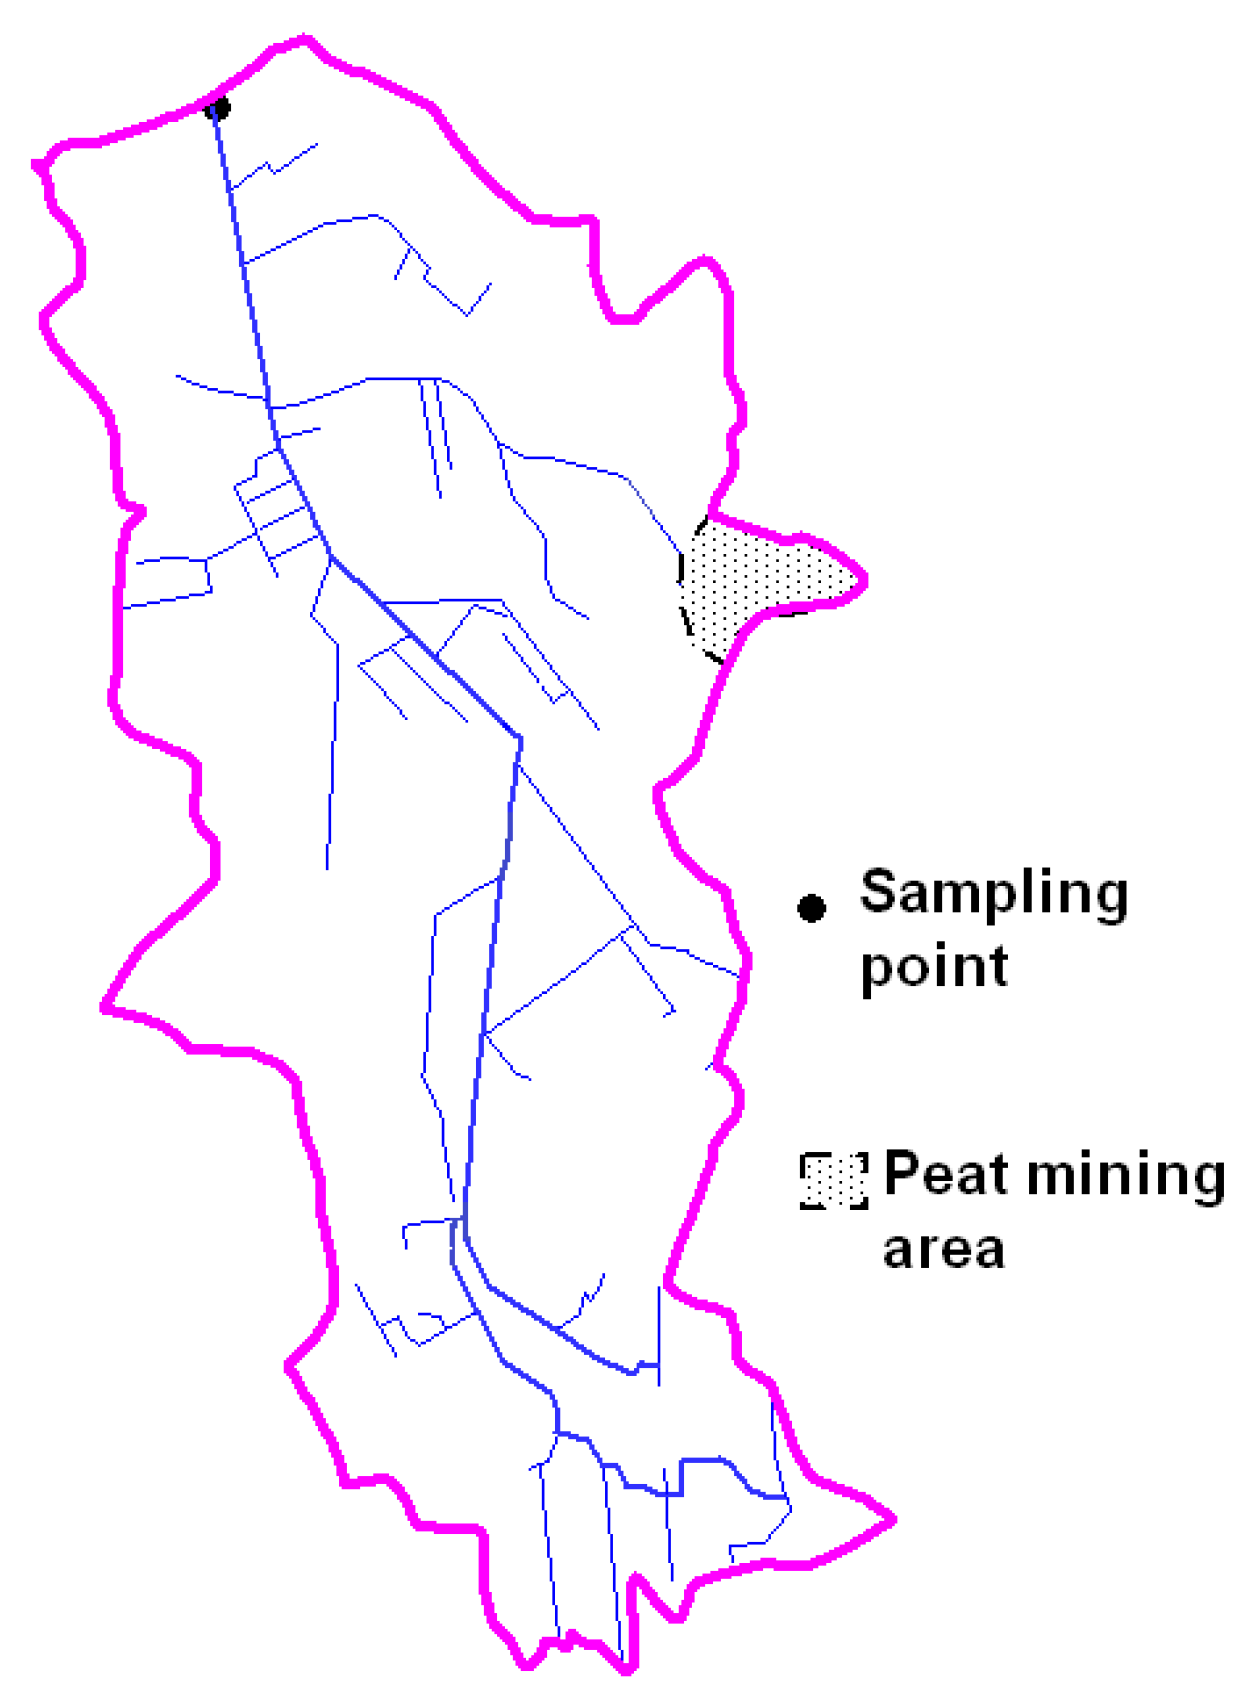
Water quantity and quality of the watershed with large percentage of peat soils were modelled. Figure 1 contains a map of the watershed. Area of the watershed is 79 km2. River length is 17 km, average discharge is 0.77 m3/s. Annual average precipitation is 704 mm and temperature 5.9 °C. Table 1 contains characteristics of the watershed. As can be seen, the watershed contains quite large areas of peat soils and low arable and farming activity. The main soil types in the watershed are peat (45.6%) and clay loam (35.2%). Wetlands in Table 1 are the areas covered with water (rivers, lakes, bogs etc.). The percentage of soil types in the watershed was estimated on the basis of digital soil map obtained from Estonian Land Board. Digital CORINE land cover map was used to derive land use statistics. Water flow was measured daily and grab samples of water were collected 12 times per year during the national monitoring program 2001–2011 according to national legislation. In Leivajõgi River the state monitoring sampling rate changed after 2010 from 12 to 6 times per year. The data presented in this study were gathered from the monitoring program database. The measurement point was at the outlets of the watershed under investigation. The measurement points of discharge and water quality do not overlap exactly but are close to each other. Water samples were analyzed in accredited laboratory.
3. Results
The scheme described in [16] was used to simulate the water flow and nitrate N concentrations in Leivajõgi River. The content of organic matter in peat soils is usually very high (>90%). Experience of the authors shows that most of the hydrological models fail to perform with soils containing high rate of organic matter. For this reason, only the MACRO and the SOILN for MACRO models were used in this study.
Three types of soils (clay loam, peat and sand) and five different profiles with a total depth of 60, 90, 120, 170, 340 cm were arbitrarily selected and used for modelling. Selected profiles cover the typical range of depths of zone of aeration in the studied watershed. All profiles were divided into 10 layers of different thickness. Parallel calculations using the farming algorithm (each processor executes code in isolation from all other processors except for a master or root processor) [17,18] were used in order to decrease the computing time. The total water inflow into the river system is the sum of runoffs from the areas with these soil profiles. Coefficients for each profile were found through the optimization procedure.
Part of precipitation falls onto the river and wetlands, but the MACRO model does not model such areas. Therefore, the water flow from rivers and wetlands in a warm season was found as the difference between the precipitation and evaporation. For a cold period when the water flow depends on the temperature, a more complex approach was used. For instance, water coming onto the wetland areas during snow melting was assumed to be equal to water coming onto the surface of the watershed.
Daily water flow and concentrations of nitrate nitrogen were modelled for 11 years. Five years were used for calibration and six for validation. Efficiency of modelling was estimated by the Nash-Sutcliffe efficiency (NSE) [19] for validation period. The NSE is a normalized statistic that determines the relative magnitude of the residual variance (“noise”) compared to the measured data variance (“information”) [20]. It indicates how well the plot of the observed versus the simulated data fits the 1:1 line. The NSE was computed using the equation:
where is the ith observation for the constituent being evaluated, is the ith simulated value for the constituent being evaluated, is the mean of observed data for the constituent being evaluated, and n is the total number of observations. NSE values between 0.0 and 1.0 are generally viewed as acceptable levels of performance, whereas values smaller than 0.0 indicate that the mean observed value is a better predictor than the simulated value, which implies unacceptable performance. In this study NSE is 0.63 for water flow and 0.33 for nitrate nitrogen.
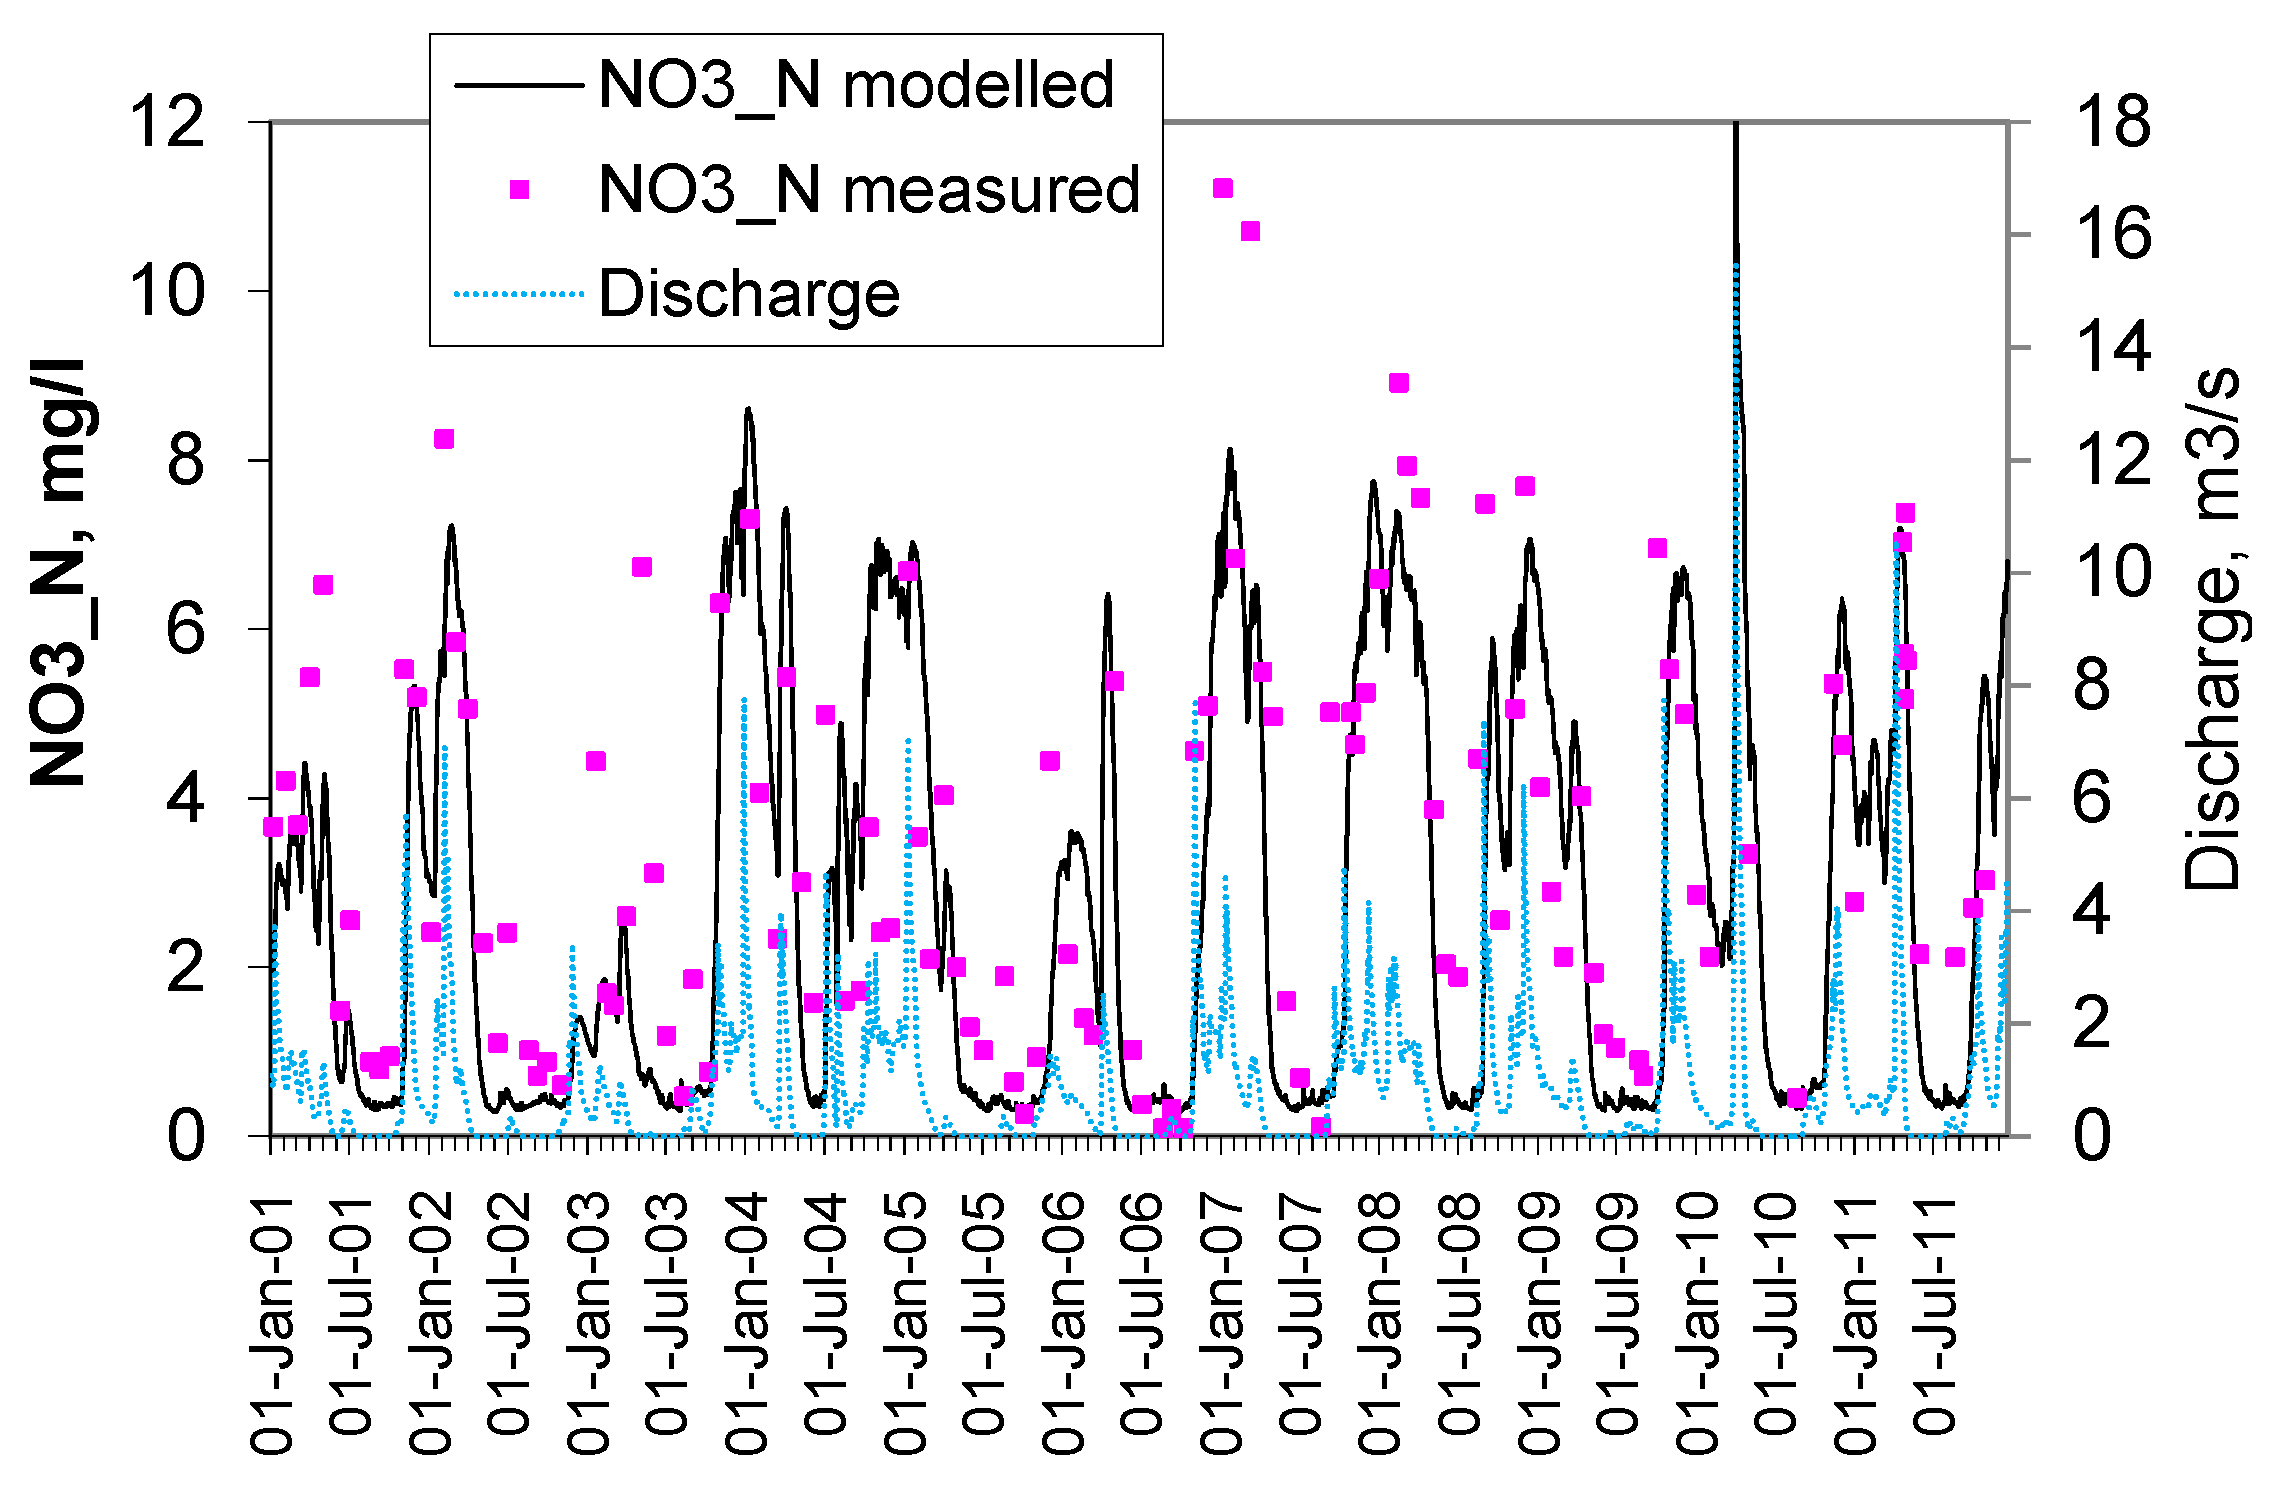
Figure 2 shows modelling results for a period of 11 years. It can be seen that the MACRO and the SOILN for MACRO models predict concentrations at a sufficient accuracy. Analysis showed that the concentrations increase with the increase of water flow but the dependence between them is non-linear. Such behavior is typical for diffuse pollution of nitrogen [2,21].
From Figure 3 the increasing trend in average annual concentrations of nitrate in years 2005–2008 can be seen. The NO3_N concentrations decrease rapidly in 2009 and remain the same for 2010. This annual change is linked with the changes in meteorological conditions because other factors e.g., fertilizer usage during the period was practically the same [22]. The annual average runoff increased in 2005–2008 and decreased to a steady level in 2009–2010 resulting similar behavior in NO3_N average annual concentration changes. Therefore, meteorological conditions have to be taken into account while analyzing the trends in nitrate concentrations in the watershed.
4. Discussion
This study showed that the field-scale model is applicable at the watershed scale. This enables modelling of the influence of different water protection measures to improve water quality. In addition to traditional sources of nutrients (e.g., arable lands), it is possible to analyze the influence of peat soils as an additional source, e.g., to model the influence of the density and depth of drainage systems or flooding of peatlands on the water quality at the watershed scale. The analysis of the average nitrogen loads from three types of soils (clay loam, peat and sand) over the 11 year study period showed that, the average nitrogen loads from peat soils were 1.5 times higher than those from clay loam (arable lands) (Table 2). The area covered with sandy soils is very small. Therefore, the average nitrogen loads from sandy soils were insignificant. This corresponds to the results of [11] where the export coefficients for areas with drained peat soils were found to be up to 2.3 times higher compared with arable lands.
The MACRO model, suitable for modelling water runoff from the soils with high content of organic matter (almost 100%), was tested in the watershed with high percentage of drained peat soils. As compared with other hydrological models, this model provides all necessary information to the respective SOILN model to calculate the concentration of NO3_N in a river. In addition, the MACRO models also exchange of water and nitrogen between micro and macro pores.
5. Conclusions
In this study, water quantity and quality of the watershed with high percentage of peat soils were modelled using models initially developed for field-scale. Three types of soils (clay loam, peat and sand) and five different profiles were used for modelling. Daily water flow and concentrations of nitrate nitrogen were modelled for 11 years. The reliability of modelling was estimated by the Nash-Sutcliffe efficiency equation. The investigation showed that the field-scale MACRO and SOILN for MACRO models may be successfully applied at the watershed scale.
This result is significant for Estonia where the main sources of diffuse nutrient loads are expected to come from agriculture and forestry [23]; however, studies have shown that nitrogen loads from drained peat soils can be larger than from arable lands [11,24]. Models used in this study allow modelling of water quantity and quality at the watersheds with a high content of peat soils and therefore are applicable for River Basin Management planning activities. According to the opinion of official authorities, the increase in nitrogen concentrations in rivers is linked with agricultural activities, but the results of modelling show that in this case, changes in the NO3_N level may depend on the meteorological conditions rather than on human activity. Therefore, River Basin Management needs additional measures focusing on areas with drained peat soils.
Author Contributions
All authors contributed in collection and analysis of the data and in the modelling.
Acknowledgments
The research was supported by the Institutional Research Funding IUT19-17 at Tallinn University of Technology, and by the Interreg Central Baltic Programme Waterchain Project.
Conflicts of Interest
The authors declare no conflict of interest.
References
- Iital, A.; Pachel, K.; Loigu, E.; Pihlak, M.; Leisk, U. Recent trends in nutrient concentrations in Estonian rivers as a response to large-scale changes in land-use intensity and lifestyles. J. Environ. Monit. 2010, 12, 178–188. [Google Scholar] [CrossRef] [PubMed]
- Vassiljev, A.; Blinova, I. The influence of drained peat soils on diffuse nitrogen pollution of surface water. Hydrol. Res. 2012, 43, 352–358. [Google Scholar] [CrossRef]
- Hoffmann, M.; Johnsson, H.; Gustavson, A.; Grimvall, A. Leaching of nitrogen in Swedish agriculture—A historical perspective. Agric. Ecosyst. Environ. 2000, 80, 277–290. [Google Scholar] [CrossRef]
- Heikkinen, K. Organic matter, iron and nutrient transport and nature of dissolved organic matter in the drainage of a boreal humic river in northern Finland. Sci. Total Environ. 1994, 152, 81–89. [Google Scholar] [CrossRef]
- Kløve, B. Characteristics of nitrogen and phosphorus loads in peat mining wastewater. Water Res. 2001, 35, 2353–2362. [Google Scholar] [CrossRef]
- Kløve, B.; Sveistrup, T.E.; Hauge, A. Leaching of nutrients and emission of greenhouse gases from peatland cultivation at Bodin, Northern Norway. Geoderma 2010, 154, 219–232. [Google Scholar] [CrossRef]
- Litaor, M.I.; Eshel, G.; Sade, R.; Rimmer, A.; Shenker, M. Hydrogeological characterization of an altered wetland. J. Hydrol. 2008, 349, 333–349. [Google Scholar] [CrossRef]
- Verhoeven, J.T.A.; Setter, T.L. Agricultural use of wetlands: Opportunities and limitations. Ann. Bot. 2010, 105, 155–163. [Google Scholar] [CrossRef] [PubMed]
- Tiemeyer, B.; Frings, J.; Kahle, P.; Kohne, S.; Lennartz, B. A comprehensive study of nutrient losses, soil properties and groundwater concentrations in a degraded peatland used as an intensive meadow—Implications for re-wetting. J. Hydrol. 2007, 345, 80–101. [Google Scholar] [CrossRef]
- EC Eurostat. Data Requirements, Availability and Gaps in Agri-Environment Indicators (AEIs) in Europe, 2011th ed.; EC Eurostat: Luxembourg, 2011. [Google Scholar]
- Kaur, K.; Vassiljev, A.; Annus, I.; Stalnacke, P. Source apportionment of nitrogen in Estonian rivers. J. Water Supply Res. Technol. 2016, 162, 188–195. [Google Scholar] [CrossRef]
- Beven, K.; Germann, P.F. Macropores and water flow in soils. Water Resour. Res. 1982, 18, 1311–1325. [Google Scholar] [CrossRef]
- Larsson, M.H.; Jarvis, J. A dual-porosity model to quantify macropore flow effects on nitrate leaching. J. Environ. Qual. 1999, 28, 1298–1307. [Google Scholar] [CrossRef]
- Johnsson, H.; Bergström, L.; Jansson, P.E.; Paustian, K. Simulated nitrogen dynamics and losses in a layered agricultural soil. Agric. Ecosyst. Environ. 1987, 18, 333–356. [Google Scholar] [CrossRef]
- Jarvis, N. The MACRO Model (Version 3.1). Technical Description and Sample Simulations; Rep and Diss SLU: Uppsla, Sweden, 1994. [Google Scholar]
- Vassiljev, A.; Grimvall, A.; Larsson, M. A dual-porosity model for nitrogen leaching from a watershed. Hydrol. Sci. J. 2004, 49, 313–322. [Google Scholar] [CrossRef]
- Vassiljev, A. Modelling of the influence of drained areas on the environment. In Proceedings of the 15th International Conference on Civil, Structural and Environmental Engineering Computing, Prague, Czech Republic, 1–4 September 2015; Kruis, J., Tsompanakis, Y., Topping, B.H.V., Eds.; Civil-Comp Press: Stirlingshire, UK, 2015; p. 280. [Google Scholar] [CrossRef]
- Topping, B.H.V.; Sziveri, J.; Bahreinejad, A.; Leite, J.P.B.; Cheng, B. Parallel processing, neural networks and genetic algorithms. Adv. Eng. Softw. 1998, 29, 763–786. [Google Scholar] [CrossRef]
- Nash, J.E.; Sutcliffe, J.V. River flow forecasting through conceptual models, Part I—A discussion of principles. J. Hydrol. 1970, 10, 282–290. [Google Scholar] [CrossRef]
- Moriasi, D.N.; Arnold, J.G.; Van Liew, M.W.; Binger, R.L.; Harmel, R.D.; Veith, T.L. Model evaluation guidelines for systematic quantification of accuracy in watershed simulations. Trans. ASABE 2007, 50, 885–900. [Google Scholar] [CrossRef]
- Hanslík, E.; Marešová, D.; Juranová, E.; Vlnas, R. Dependence of selected water quality parameters on flow rates at river sites in the Czech Republic. J. Sustain. Dev. Energy Water Environ. Syst. 2016, 4, 127–140. [Google Scholar] [CrossRef]
- Statistics Estonia. Statistical Yearbook of Estonia; Statistics Estonia: Tallinn, Estonia, 2015; Available online: http://www.stat.ee/publication-2015_statistical-yearbook-of-estonia-2015 (accessed on 7 May 2018).
- Vassiljev, A.; Blinova, I.; Ennet, P. Source apportionment of nutrients in Estonian rivers. Desalination 2008, 226, 222–230. [Google Scholar] [CrossRef]
- Vassiljev, A.; Margus, G.; Annus, I.; Stålnacke, P. Investigation of Possible Nutrient Sources in Estonian Rivers. Proc. Eng. 2016, 162, 188–195. [Google Scholar] [CrossRef]
Figure 1.
Map of River Leivajõgi watershed.

Figure 2.
Measured and modelled nitrate nitrogen and water discharge.

Figure 3.
Measured and modelled nitrate nitrogen and water discharge.


Table 1.
Soil areas (%) of different land use types for the Leivajõgi watershed.
| Land Use/Soil | Sandy Loam | Clay | Sand | Clay Loam | Peat | Sum |
|---|---|---|---|---|---|---|
| Arable | 0.9 | 0.0 | 0.3 | 16.4 | 2.3 | 19.9 |
| Pasture | 0.4 | 0.0 | 0.2 | 1.7 | 13.4 | 15.8 |
| Forest | 1.5 | 0.0 | 3.7 | 16.5 | 29.7 | 51.4 |
| Natural grass | 0.0 | 0.0 | 0.0 | 0.6 | 0.2 | 0.8 |
| Wetland | 9.9 | |||||
| Others | 2.2 | |||||
| Total | 100 |
Table 2.
Annual nitrogen load from different soil types for the Leivajõgi watershed.
| Year | Clay Loam (kg/ha) | Peat (kg/ha) |
|---|---|---|
| 2000 | 9.23 | 6.94 |
| 2001 | 13.97 | 14.89 |
| 2002 | 12.62 | 15.01 |
| 2003 | 7.50 | 4.11 |
| 2004 | 31.23 | 43.88 |
| 2005 | 21.57 | 30.40 |
| 2006 | 11.99 | 4.44 |
| 2007 | 28.66 | 30.86 |
| 2008 | 39.63 | 112.16 |
| 2009 | 26.86 | 71.40 |
| 2010 | 15.91 | 11.80 |
| 2011 | 24.62 | 32.75 |
| Total | 243.80 | 378.66 |
Publisher’s Note: MDPI stays neutral with regard to jurisdictional claims in published maps and institutional affiliations. |
© 2018 by the authors. Licensee MDPI, Basel, Switzerland. This article is an open access article distributed under the terms and conditions of the Creative Commons Attribution (CC BY) license (https://creativecommons.org/licenses/by/4.0/).
Share and Cite
MDPI and ACS Style
Vassiljev, A.; Annus, I.; Kändler, N.; Kaur, K. Modelling of the Effect of Drained Peat Soils to Water Quality Using MACRO and SOILN Models. Proceedings 2018, 2, 619. https://doi.org/10.3390/proceedings2110619
AMA Style
Vassiljev A, Annus I, Kändler N, Kaur K. Modelling of the Effect of Drained Peat Soils to Water Quality Using MACRO and SOILN Models. Proceedings. 2018; 2(11):619. https://doi.org/10.3390/proceedings2110619
Chicago/Turabian StyleVassiljev, Anatoli, Ivar Annus, Nils Kändler, and Katrin Kaur. 2018. "Modelling of the Effect of Drained Peat Soils to Water Quality Using MACRO and SOILN Models" Proceedings 2, no. 11: 619. https://doi.org/10.3390/proceedings2110619