Observed Climate and Hydrologic Changes in Serbia—What Has Changed in the Last Ten Years †

Jaroslav Černi Institute for the Development of Water Resources, 11226 Belgrade, Serbia
†
Presented at the 3rd EWaS International Conference on “Insights on the Water-Energy-Food Nexus”, Lefkada Island, Greece, 27–30 June 2018.
Proceedings 2018, 2(11), 616; https://doi.org/10.3390/proceedings2110616
Published: 31 July 2018
(This article belongs to the Proceedings of EWaS3 2018)
Abstract
:Detection of changes in observed meteorological and hydrological changes are of the great interest for water sector. This paper presents the most recent findings relevant for trend examination in observed datasets for precipitation (P), temperature (T) and river discharge (Q) for selected stations across the Republic of Serbia. In addition, correlations of the observed variations in average Q with detected changes in observed average T are comprehensively evaluated. Similar study were done for period 1949–2006, which was the most convenient period due to data availability during the first research step (2008–2010), and these finding were presented at the EWAS2. The new research phase that includes last 10 years (2007–2016), for annual data sets for T, P and Q is ongoing based on methodology developed in the First step of research. This paper presents the most recent results and discuss does earlier registered T, P and Q trends have the same pattern or some new phenomenon has been observed across Serbia in the last 10 years.
1. Introduction
Great majority of Serbia’s domestic rivers registered a downward trend in 20th and first decade of 21st century. Like in many parts of the world [1,2,3,4,5,6,7,8,9], important decrease in river discharge is influence of three factors: climate change (CC), changes in human use of water (HU), and land use changes (LU). Selected monitoring Q stations for analysis are those with acceptable degree of human impact in Catchment area(s)—C.A.(s). Rivers with high degree of HU factor in C.A. are excluded from analyses. It has been found in the first researching step that annual average T trend in Serbia was about 0.6 °C/100 years, while the average P trend was very slightly negative. In the same period (1949–2006) average hydrologic trend of domestic rivers was about −30%/100 years.
This paper, which considers just mean annual values for temperature (T), precipitation (P) and river discharge (Q), additionally include data of the last ten years (2007–2016). The aim is to compare previous results (period 1949–2006), with results for period 1959–2016, and for whole period with available data (1949–2016), as well. The question is what we could expect in the near future (next app. 20–25 years) and which the reliability of such forecasting is. Analyses of observed T, P and Q changes and correlation between air temperature and river discharge, presented here for different periods, could provide better insights in this topic and help to clarify some of the open questions, despite the number of studies that address climate change and water sector.
To assess climate and hydrologic trends for period 1949–2006, 26 temperature, 34 precipitation and 18 hydrologic stations were selected. Due to different reasons, availability of data for periods 2007–2016 is not the same as for period 1949–2006. Perfect situation is just regarding the data availability for T stations—so the same 26 stations have been chosen again. Data availability regarding Q stations is quite satisfactory—for 15 of 18 monitoring stations data exist for period 2007–2016. For the remaining three rivers, data exist for the downstream stations on the same river. Finally, 6 more Q stations, with suitable data reliability for whole period (1949–2016), were added in analyses. The worst situation is regarding data availability of P stations. Just 14 of 34 earlier analyzed P stations have data for period 2007–2016. So, need for new P stations have existed, and 24 were found with acceptable data reliability and they were included in analyses.
Applied Methodology and Results are related to Serbia, and the same could be done elsewhere. To be clearly, Methodology and Results sections are divided in two parts:
- Observed climate and hydrologic changes in Serbia
- Correlation between air temperature and river discharge
2. Methodology
2.1. Observed Climate and Hydrologic Changes in Serbia
All the trend charts shown in this paper were generated using Surfer software, based on upgraded data recorded at analyzed stations. Additionally, before preparing charts, T and P trends were adjusted by regional averaging. The reason is to minimize the stochastic (random) component. Trends for hydrologic stations are not adjusted, they are used as they are. This Methodology is described in details in paper of the previous EWAS2 Conference [10]. Small difference from previous research is just regarding the number of stations: 26 temperature (as in the 1st researching step), 38 precipitation (34 in the 1st researching step) and 24 hydrologic stations (18 in the 1st researching step) were selected for these analyses.
2.2. Correlation between Air Temperature and River Discharge
The same Methodology, described in details in some previous papers [10,11,12], has been used to find correlation between air temperature and river discharge. The Methodology is based on statistical analyses of observed links between relative annual values for the pairs of Q–T stations. The only difference is regarding the number of analyzed C.A.s: 24 Q and the closest T stations (18 in the 1st researching step) were selected for these analyses.
3. Results
3.1. Observed Climate and Hydrologic Changes in Serbia
3.1.1. Observed Temperature Changes
3.1.2. Observed Precipitation Changes
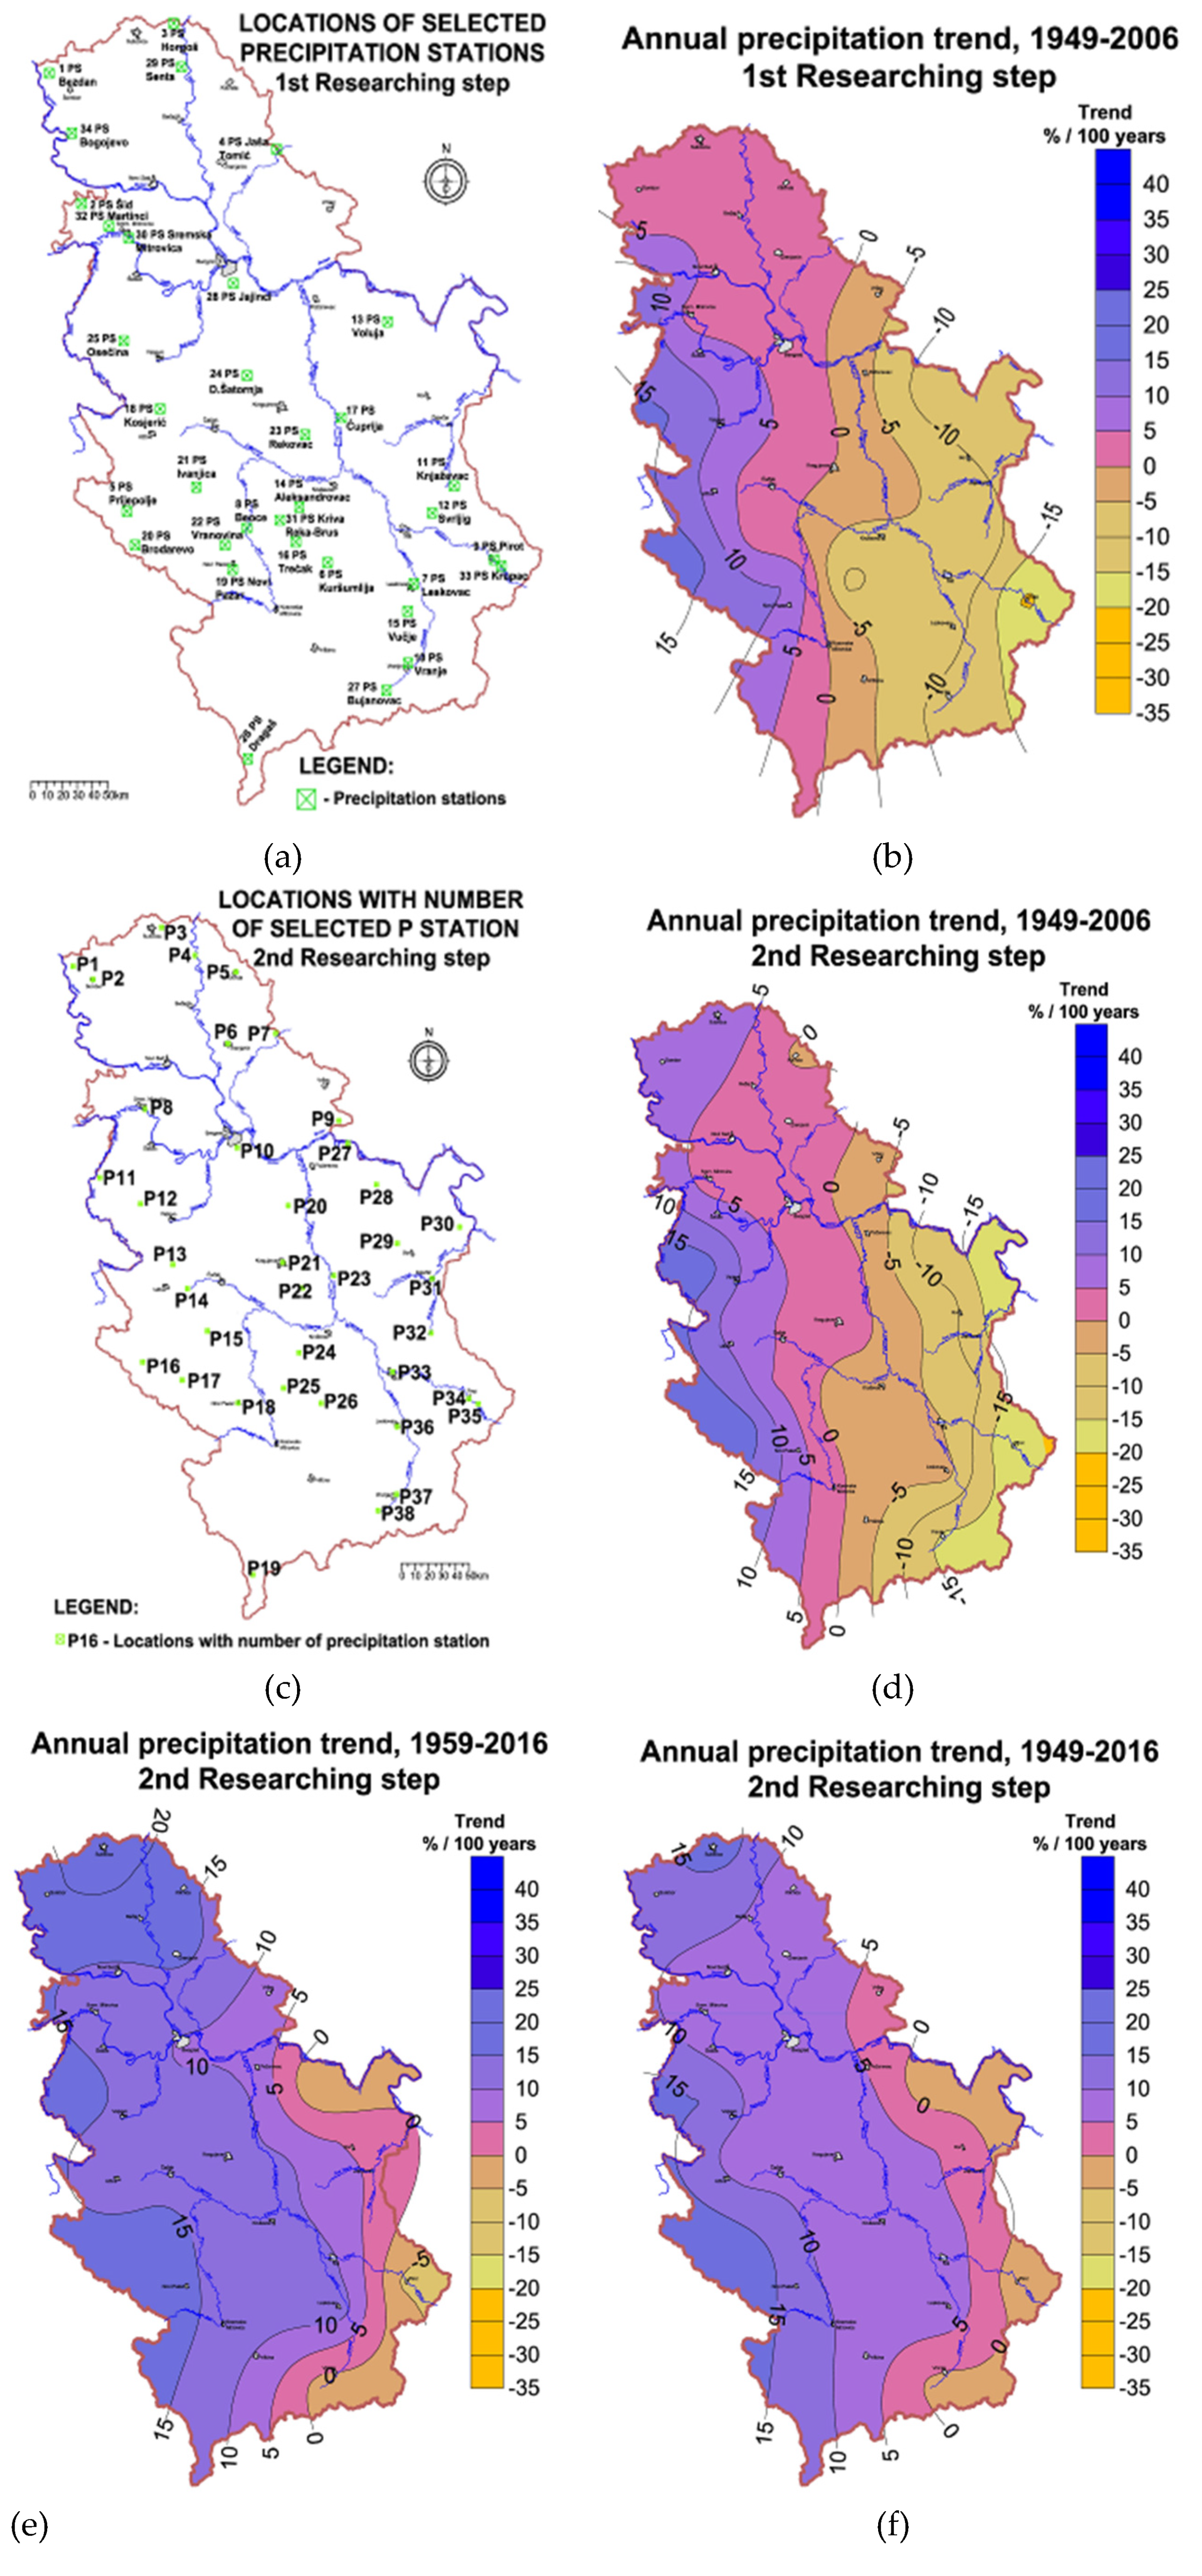
Selected P stations with observed and adjusted trends for periods 1949–2006, 1959–2016 and 1949–2016 are shown in Table 2. Differences between observed and adjusted P trends for the same station and same period exist due to wish to minimize the stochastic component in trend data by regional averaging [5,10]. The spatial trend distribution is shown on Figure 2 for all three periods, with the earlier obtained chart of P trends for period 1949–2006.
3.1.3. Observed Hydrologic Changes
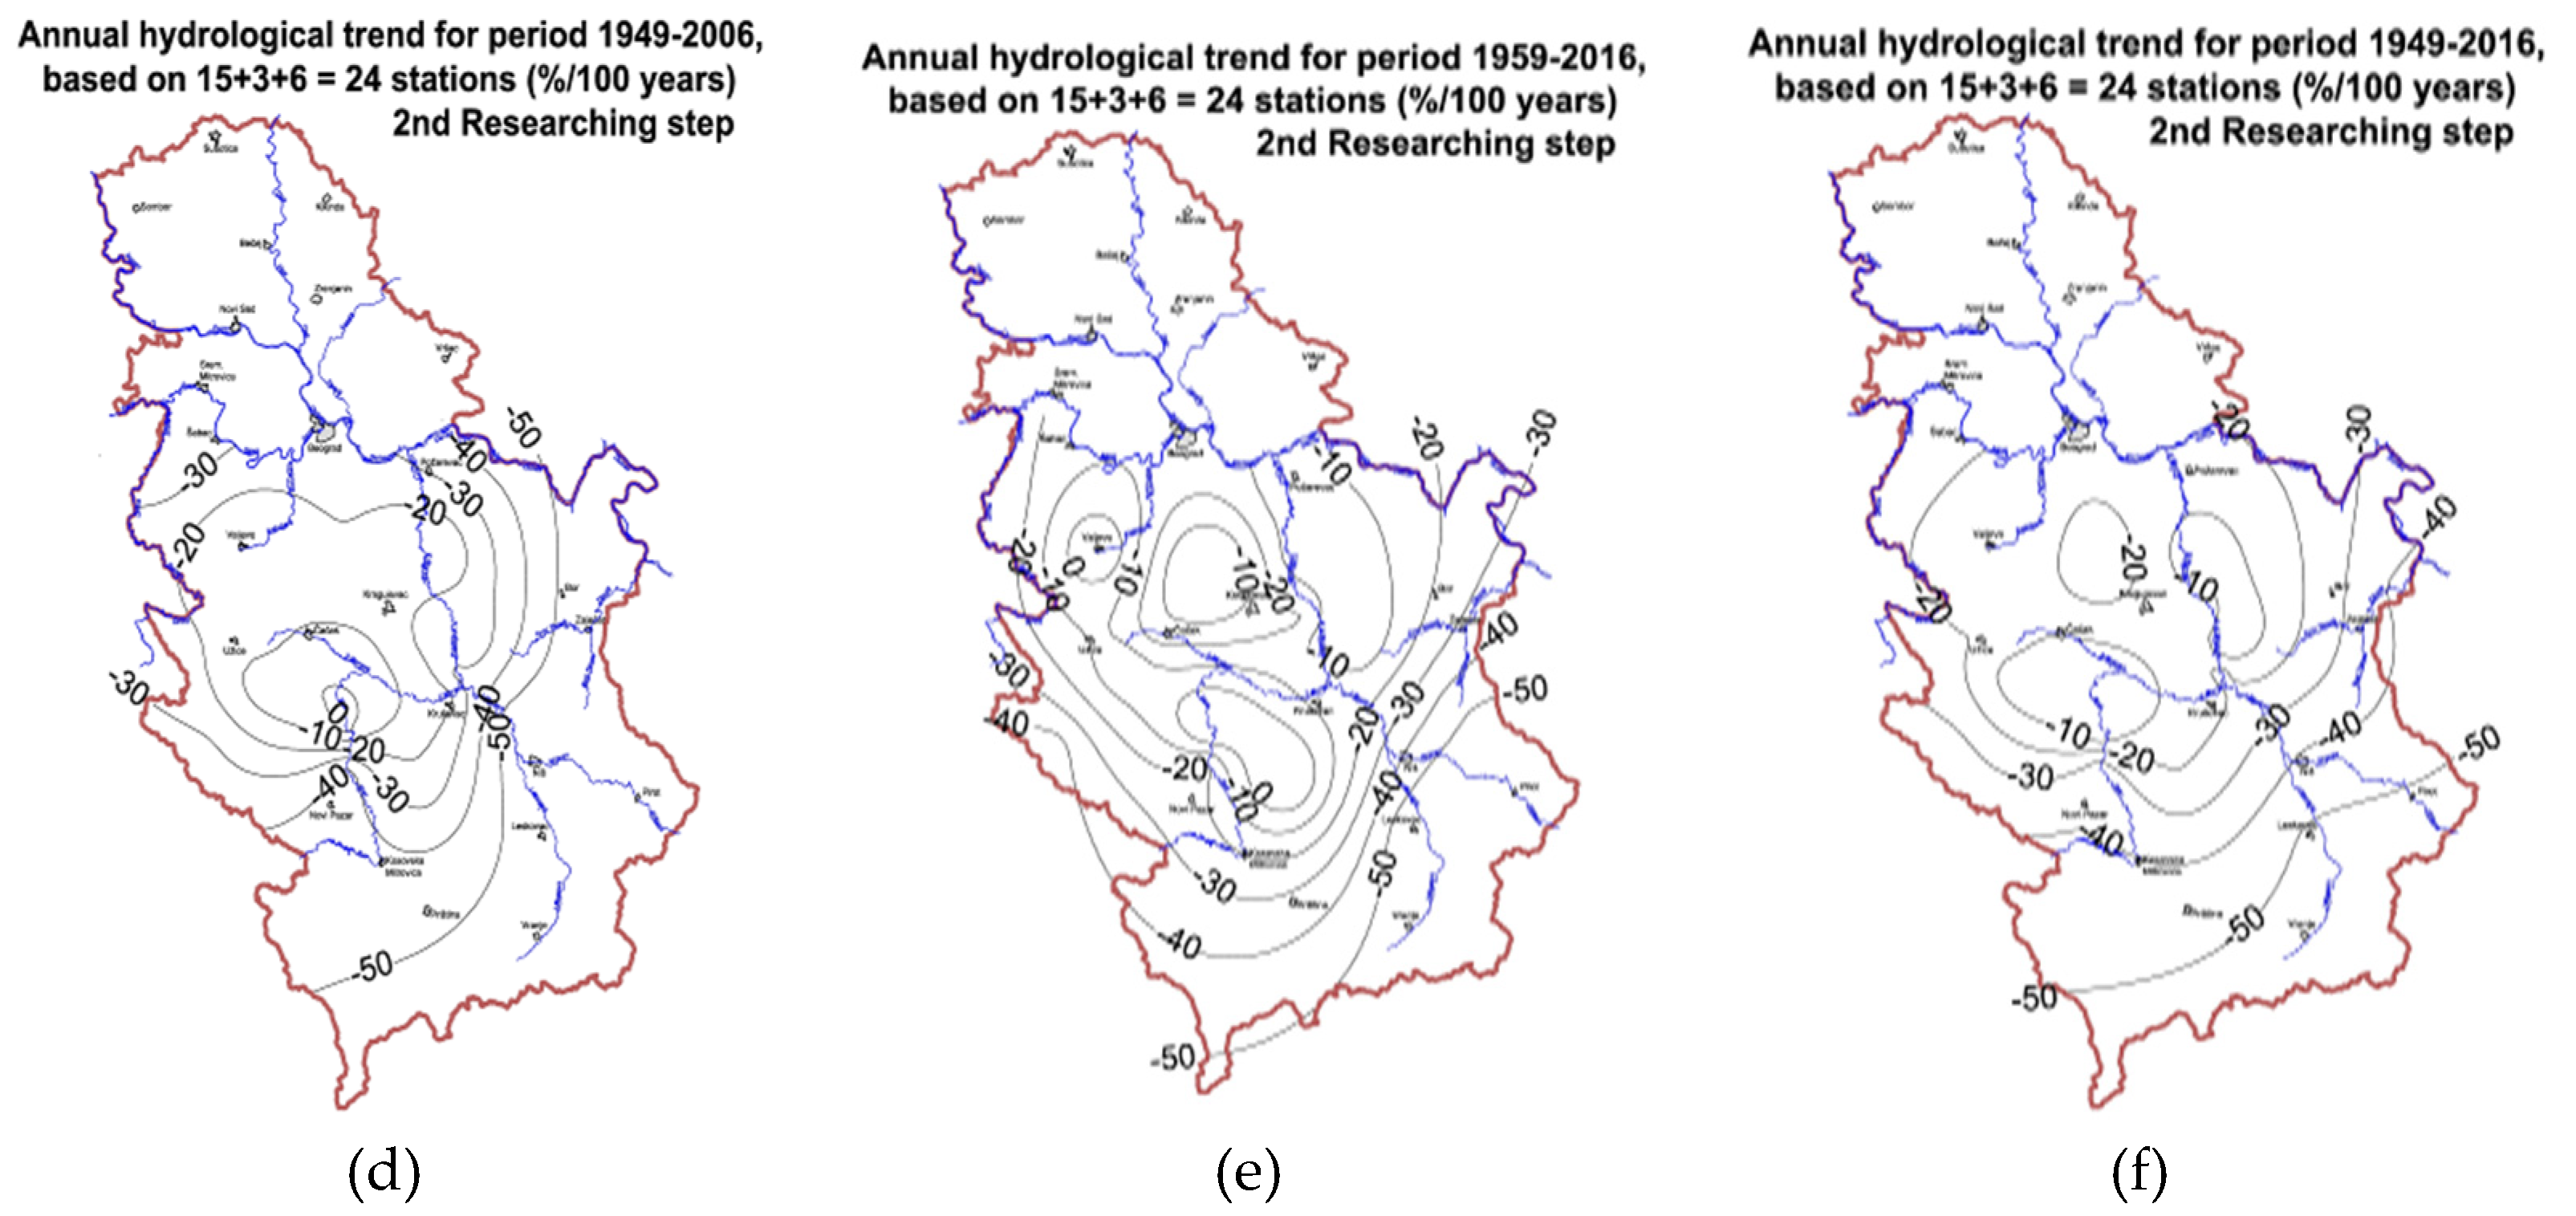
An approximate spatial trend distribution for central Serbia, based on the trends observed at 24 selected stations from Table 3, is shown in Figure 3 for all three periods, together with the earlier obtained chart for period 1949–2006. It should be noted that within all Q trend isolines there are rivers and Q stations that often exhibit significant trend variations (both up and down), primary as a result of HU factor. Large international rivers on the north of the country (the Danube, the Sava and the Tisa) have been analyzed (trends about zero or slightly decreasing), but they are not presented here, due that they do not adequately reflect what happens within one country or region.
3.2. Correlation between Air Temperature and River Discharge
Observed hydrologic changes told us that there is a downward average annual river discharge trend in Serbia (part 3.1). If temperature continues to increase, what is to be expected with regard to hydrologic changes? Common approach (with Regional models) try to give us answer using different scenarios and base assumptions [1,2,13,14]. In addition to common approach, the good way of arriving at the answer to this question, particularly for the near future, is to analyze what has happened in the past with average annual temperature vs. river discharge.
To arrive at relationships, relative parameters were calculated for each C.A.s, data were than synthesis and grouped into categories according to deviations of average annual temperatures from the mean values, at intervals of 0.5 °C [5,10,11,12]. Average values were than calculated for each T category (Table 4). Results of correlation between relative T and Q for 24 analyzed C.A.s are shown on Table 4 and Figure 4, displaying also the linear and 3rd degree polynomial fit to the composite data shown and the associated coefficient of determination R2.
So, obtained average Q decreasing linear trend in years with T higher 1 °C from average of analyzed period are presented in Table 5. The coefficient of determination is very high in all graphs on Figure 4, which lead to the conclusion that a deviation of the average annual temperature by +1 °C has an inversely proportional effect on the average annual river discharge between 10 and 20%, likely about 15%. If these trends are extrapolated to +2 °C, values derived for relative river discharge are between −30 and −40%/100 years. Higher and stronger correlation have been registered in eastern part, where decreasing P trend is recorded, in comparison to western part of the country.
This methodology could be basis for the most probable average river discharge assessment (decline) for the near future (up to 20–30 years) in Serbia, in dependence of the average yearly temperature increasing. The same methodology could be applied for many countries and regions.
4. Discussion
First remark is regarding the selection of data (stations) for the same periods: The selection of stations, if their number is significant (more than app. 12), don’t have influence to final results (just to some, not to much important, details)—that could be seen on Figure 2 (comparison of pictures b and d), Figure 3 (comparison of pictures b and d) and Figure 4 (comparison of pictures a and b) and results in Table 5 and Table 6 (first and second row).
Second remark is regarding the selection of analyzed periods: The selection of period (if series comprise app. 60 years or more) don’t play crucial, but do play important role in obtaining final results (comparison of pictures b, c and d on Figure 1 and Figure 4, and comparison of pictures d, e and f on Figure 2 and Figure 3). It can be seen from Table 6 that the longest period, 68 years (1949–2016), has trends for all three parameters (T, P and Q) between trends of other two periods, which could be declared as expected. Author’s opinion, support by research in 1st step, is that most probable trends, relevant for near future, are those between obtained trends for 1949–2006 and 1949–2016 periods [10,11]. The same is valid for the correlation between air temperature and river discharge (Table 5).
It should be said that Serbia recorded last ten years (2007–2016) much higher annual T than average from earlier periods (what is in line with observed T in the world). For the same period (last 10 years) average annual P in Serbia were also a little bit higher than average from earlier periods—what is not expected to much, but could be explained as a part of natural variations, and one very wet year (2014), in which enormous floods registered in large part of Serbia [15].
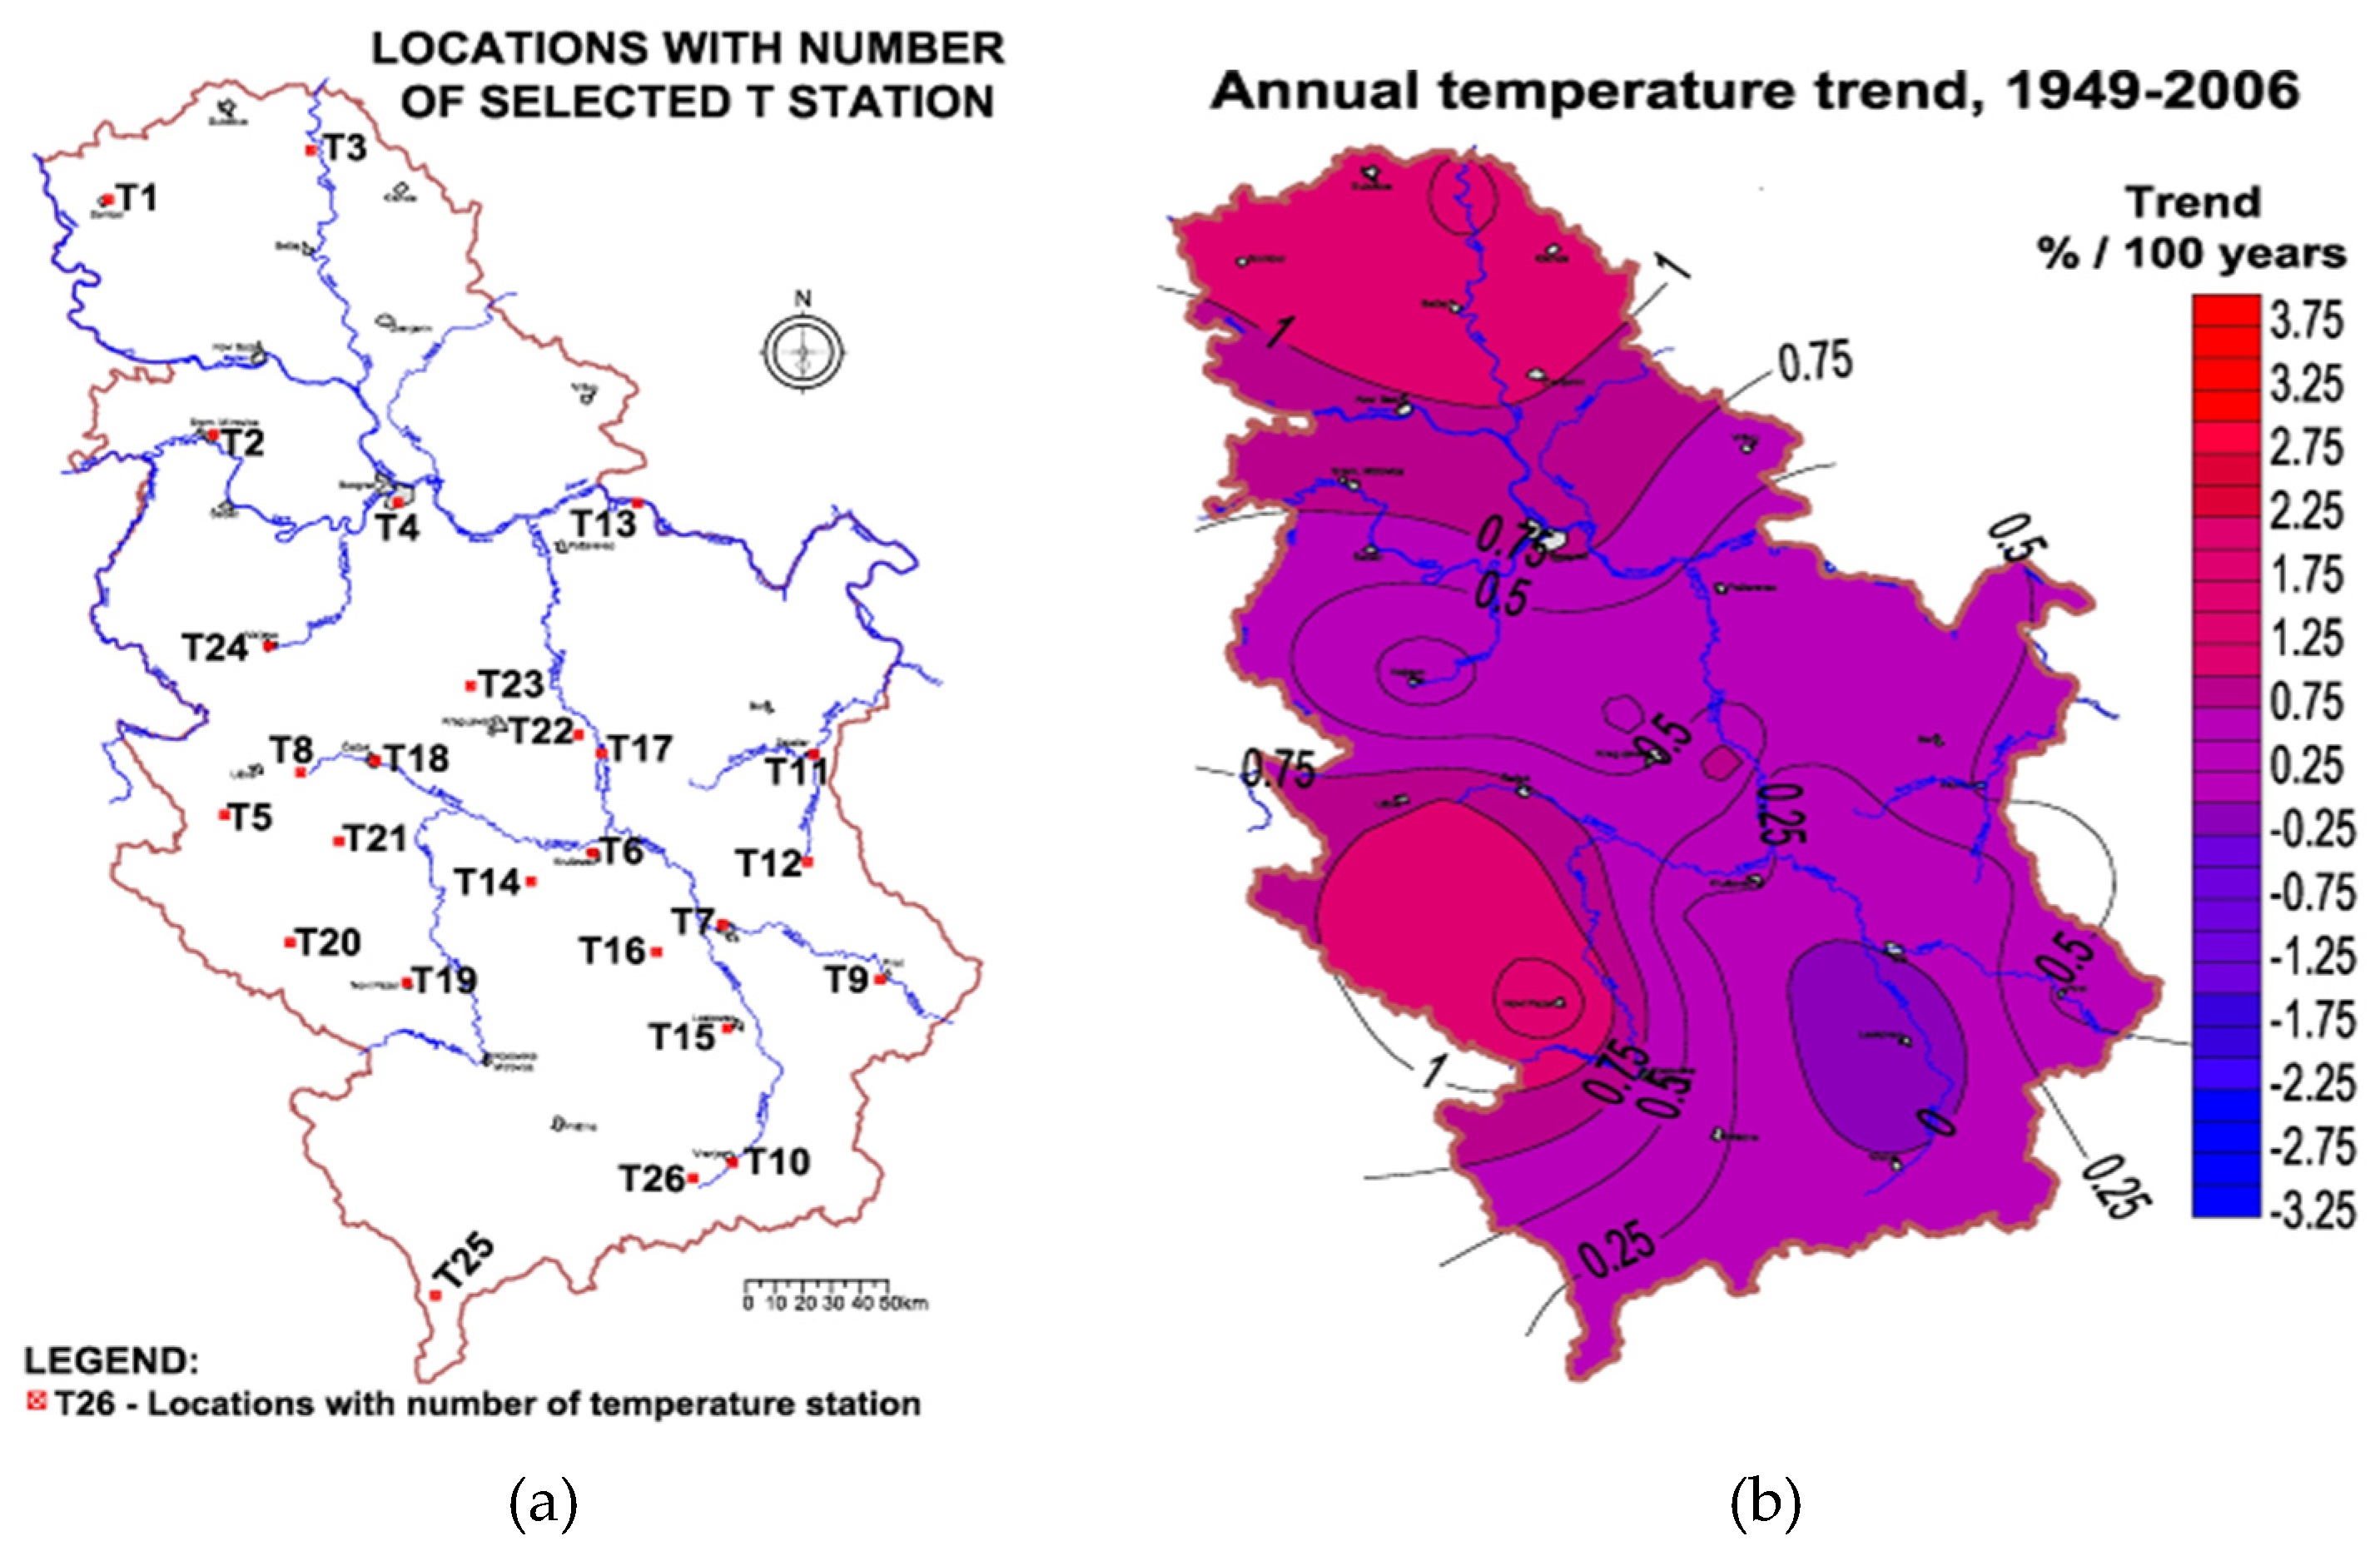
Third remark is regarding the description of changes, in the view of selected period: For all three parameters, description of changes are same or very similar for all three periods. Higher T trends have been registered in north-west part of the country compare to south-east (pictures b, c and d on Figure 1). Higher P trends have been registered in west part of the country compare to eastern part (pictures d, e and f on Figure 2). And similar as for precipitation, the most favorable Q trends are in the south-west part of central Serbia, and decreasing trend is observed with going to the east (pictures d, e and f on Figure 3), where many rivers have registered important annual decreasing trend (−40%/100 years, and less). Just the amplitude of changes vary to some extent due to selected period, as pointed in second remark.
Fourth remark is regarding the physical description of Q changes: Even the fact that HU and LU changes are very important for river discharge changes [2,6,7,8,9,10], it is obvious that correlation between P and Q trends exist in all periods – the highest decreasing Q trend have been registered in rivers of eastern and south-eastern part of the country, where the less favorable P trend is always present (Figure 2 and Figure 3).
5. Conclusions
The most significant difference in results of the research presented in this paper, which include data of the last 10 years, in comparison to previous results are related to temperature (Table 1). An increasing T trend of 1.7 °C/100 years on average was derived from 26 analyzed T stations (0.6 °C/100 years in the 1st researching step from the same 26 stations). As in the 1st researching step, higher trend was noted in west and north part of the country. Southeastern Serbia exhibits the lowest trend, what could be explain, maybe, as influence of Aegean sea through Axios valley.
The overall average observed precipitation change in Serbia (Table 2) is slightly positive (between zero and +5%/100 years), what is small difference from results in the 1st researching step (about zero). But the same conclusion as in the 1st researching step is regarding the spatial P trend distribution: A distinct upward trend exists in the western part of the country and a downward trend in the eastern part of the country.
The recorded average Q trends are app. (−20% to −25%)/100 years, and depend on a three factors (CC, HU and LU). The impact of CC has been noted at all gauging stations, but its significance varies. In eastern Serbia, based on P trend distributions, it is generally dominant. In some parts of the country it is often not of primary concern, and elsewhere it is minor given the magnitude of other impacts [5]. The direction of annual Q changes in Serbia (Figure 3) is generally in line with the forecasts based on the IPCC scenario A1B [1], and the observed T and P trends [5,10,11,12].
Which are the most probable average annual T, P and Q changes in 20–25 years in Serbia? If forecast should be given based on this research, obtained results told us: increase in temperature of 0.2 to 0.3 °C, negligible precipitation changes, and decrease in river discharge of about 5%.
Who can perhaps benefit from the outcomes of this research? Apart from Serbia, it is believed that the presented results will be of interest to the entire region of Southeast Europe, particularly eastern and southern part of Balkan peninsula. Further, the proposed methodology for the assessment of average temperature impact on average river discharge could certainly be applied in many parts of the world.
Acknowledgments
This paper is an outcome of the National scientific project “Assessment of Climate Change Impact on Water Resources in Serbia” (TR37005), funded by the Ministry of Education and Science of the Republic of Serbia.
Conflicts of Interest
The author declares no conflict of interest
References
- Synthesis Report of the IPCC. Available online: www.ipcc.ch (accessed on 30 July 2018).
- Climate Change and Impacts on Water Supply (CC-WaterS)—International Project for SE Europe, 18 Institutions from SE Europe, 2009–2012. Available online: http://www.ccwaters.eu (accessed on 30 July 2018).
- International Project for Adriatic-Ionian Region: Networking for Drinking Water Supply in Adriatic Ionian Region (Drinkaria), 16 Institutions from the Region, 2013–2016. Available online: http://www.drinkadria.eu (accessed on 30 July 2018).
- Kanakoudis, V.; Papadopoulou, A.; Tsitsifli, S.; Banovec, P. Drinkadria Project: from an idea to policy recommendation—A common approach development, towards water resources management and supply, across Adriatic Sea countries. In Proceedings of the International Conference: 9th World Congress, EWRA 2015 Water Resources Management in a Changing World: Challenges and Opportunities, Istanbul, Turkey, 10–13 June 2015. [Google Scholar]
- Climate change impacts on the river hydrology in Serbia—National Study; Institute for the Development of Water Resources “Jaroslav Černi”: Belgrade, Serbia, 2012.
- De Roo, A.; Bisselink, B.; Beck, H.; Jeroen, B.; Burek, P.A.; Reynaud, A.; Pastori, M.; Lavalle, C.; Jacobs, C.; Baranzelli, C.; et al. Modelling Water Demand and Availability Scenarios for Current and Future Land Use and Climate in the Sava River Basin. JRC Technical Reports; 2016. Available online: https://ec.europa.eu/jrc/en/publication/modelling-water-demand-and-availability-scenarios-current-and-future-land-use-and-climate-sava-river (accessed on 30 July 2018).
- Gavrilović, Z.; Dimkić, D.; Stefanović, M. The effects of Forest on Runoff Regimes in Serbia. In Proceedings—International Conference Climate Change Impacts on Water Resources, 17–18 October 2013, Belgrade, Serbia; Jaroslav Černi Institute for the Development of Water Resources: Belgrade, Serbia, 2013; pp. 203–210. ISBN 978-86-82565-41-3. [Google Scholar]
- Nachtnebel, H.P. Water Resources under Pressure: Direct Human Interventions and Climate Change. In Proceedings—International Conference Climate Change Impacts on Water Resources, 17–18 October 2013, Belgrade, Serbia; Jaroslav Černi Institute for the Development of Water Resources: Belgrade, Serbia, 2013; p. 31. ISBN 978-86-82565-41-3. [Google Scholar]
- Juckem, P.F.; Hunt, R.J.; Anderson, M.P.; Robertson, D.M. Effects of climate and land management change on stream flow in the drift less area of Wisconsin. J. Hydrol. 2008, 355, 123–130. [Google Scholar] [CrossRef]
- Dimkić, D. New Method for Estimation Mean Hydrological Changes and Question of Reliability in Forecasting Future Hydrological Regimes. Procedia Eng. 2016, 162, 145–152. [Google Scholar] [CrossRef]
- Dimkić, D. Present and future mean hydrologic trends in Serbia as a function of climate trends. Desalin. Water Treat. J. 2017, 99. [Google Scholar] [CrossRef]
- Dimkić, D.; Despotović, J. Climate Change—Anthology, Inferences from Paleoclimate and Regional Aspects; Berger, A., Mesinger, F., Šijački, D., Eds.; 2012; pp. 167–180. ISBN 978-3-7091-0972-4. [Google Scholar]
- Arnell, N.W. Effects of IPCC SRES emissions scenarios on river runoff: A global perspective. Hydrol. Earth Syst. Sci. 2003, 7, 619–641. [Google Scholar] [CrossRef]
- Donnelly, C.; Greuell, W.; Andersson, J.; Gerten, D.; Pisacane, G.; Roudier, P.; Ludwig, F. Impacts of climate change on European hydrology at 1.5, 2 and 3 degrees mean global warming above preindustrial level. Clim. Chang. 2017, 143, 13–26. [Google Scholar] [CrossRef]
- UN Serbia and World Bank Group. Serbia Floods 2014. Available online: http://www.sepa.gov.rs/download/SerbiaRNAreport_2014.pdf (accessed on 30 July 2018).
Figure 1.
The locations of selected T stations (Figure 1a) and spatial T trend distribution (°C/100 years) for periods 1949–2006; 1959–2016 and 1949–2016 (Figure 1b–d).


Figure 2.
Figure 2a presents the locations of selected P stations and Figure 2b presents the spatial P trend distribution for period 1949–2006 in the 1st researching step. Figure 2c-f present the same (the locations and the spatial P trend distribution for three periods) in the 2nd researching step.

Figure 3.
Figure 3a presents the locations of selected Q stations and Figure 3b presents the spatial Q trend distribution for period 1949–2006 in the 1st researching step. Figure 3d–f present the same (the locations and the spatial Q trend distribution for three periods) in the 2nd researching step.


Figure 4.
Average relative annual river discharge, as a function of temperature deviation. Figure 4a presents obtained correlation for period 1949–2006 in the 1st researching step (all 18 C.A.s). Figure 4b–d present the same correlation for three analyzed periods (all 24 C.A.s) in 2nd researching step.


Table 1.
Selected T stations with observed and adjusted annual trends for analyzed periods.
| Temperature Station | Linear Trends for Period (°C/100 Years) | ||||||
|---|---|---|---|---|---|---|---|
| 1949–2006 | 1959–2016 | 1949–2016 | |||||
| Observed | Adjusted | Observed | Adjusted | Observed | Adjusted | ||
| 1 | TS Sombor | 1.0 | 1.0 | 3.1 | 2.9 | 2.0 | 2.0 |
| 2 | TS Sr. Mitrovica | 0.6 | 0.8 | 2.4 | 2.8 | 1.7 | 2.0 |
| 3 | TS Senta | 1.6 | 1.3 | 2.8 | 2.9 | 2.2 | 2.1 |
| 4 | TS Beograd | 1.3 | 0.9 | 3.7 | 3.1 | 2.6 | 2.2 |
| 5 | TS Zlatibor | 0.8 | 1.0 | 3.2 | 2.9 | 2.0 | 2.0 |
| 6 | TS Kruševac | 0.5 | 0.3 | 2.7 | 2.6 | 1.6 | 1.5 |
| 7 | TS Niš | 0.1 | 0.0 | 2.6 | 2.6 | 1.5 | 1.3 |
| 8 | TS Požega | 1.2 | 1.0 | 2.2 | 2.6 | 2.0 | 1.9 |
| 9 | TS Pirot | 1.5 | 0.6 | 4.1 | 3.2 | 2.9 | 2.0 |
| 10 | TS Vranje | −0.3 | 0.0 | 2.1 | 2.3 | 1.1 | 1.2 |
| 11 | TS Zaječar | 1.0 | 0.5 | 2.7 | 2.8 | 1.7 | 1.6 |
| 12 | TS Knjaževac | −0.1 | 0.1 | 3.3 | 2.9 | 1.6 | 1.5 |
| 13 | TS Vel. Gradište | 0.0 | 0.3 | 2.3 | 2.6 | 1.3 | 1.5 |
| 14 | TS Aleksandrovac | −0.5 | 0.2 | 2.6 | 2.6 | 1.0 | 1.4 |
| 15 | TS Leskovac | −0.8 | −0.3 | 1.8 | 2.3 | 0.6 | 1.1 |
| 16 | TS Prokuplje | −0.7 | −0.1 | 1.8 | 2.4 | 0.5 | 1.2 |
| 17 | TS Ćuprija | −0.4 | 0.2 | 2.2 | 2.5 | 0.9 | 1.4 |
| 18 | TS Čačak | 0.6 | 0.8 | 2.3 | 2.6 | 1.4 | 1.8 |
| 19 | TS Novi Pazar | 2.8 | 1.5 | 4.6 | 3.4 | 3.6 | 2.4 |
| 20 | TS Sjenica | 0.9 | 1.0 | 3.1 | 2.9 | 2.0 | 2.0 |
| 21 | TS Ivanjica | 1.7 | 1.2 | 2.0 | 2.6 | 2.2 | 2.0 |
| 22 | TS Jagodina | 0.7 | 0.3 | 2.8 | 2.5 | 1.9 | 1.5 |
| 23 | TS Čumić | 0.6 | 0.6 | 2.7 | 2.7 | 1.7 | 1.7 |
| 24 | TS Valjevo | 0.9 | 0.9 | 3.2 | 2.9 | 2.2 | 2.0 |
| 25 | TS Dragaš | −1.0 | 0.2 | 1.5 | 2.4 | 0.4 | 1.3 |
| 26 | TS Bujanovac | 0.7 | 0.1 | 2.8 | 2.3 | 1.6 | 1.2 |
| Average for 26 stations | 0.6 | 0.6 | 2.7 | 2.7 | 1.7 | 1.7 | |
Table 2.
Selected P stations with observed and adjusted annual trends for analyzed periods.
| Precipitation Station | Linear Trends for Period (°C/100 Years) | ||||||
|---|---|---|---|---|---|---|---|
| 1949–2006 | 1959–2016 | 1949–2016 | |||||
| Observed | Adjusted | Observed | Adjusted | Observed | Adjusted | ||
| 1 | PS Bezdan | −1.7 | 5.3 | 3.1 | 15.4 | 1.8 | 10.8 |
| 2 | PS Sombor | 15.9 | 8.1 | 28.7 | 19.4 | 23.2 | 14.0 |
| 3 | PS Palilić | 20.3 | 9.8 | 35.8 | 24.7 | 28.6 | 17.5 |
| 4 | PS Senta | 1.0 | 3.2 | 17.6 | 18.7 | 11.3 | 11.4 |
| 5 | PS Kikinda | −7.4 | −0.9 | 13.6 | 15.5 | 1.7 | 6.7 |
| 6 | PS Zrenjanin | −1.7 | 1.5 | 21.5 | 16.3 | 7.9 | 8.0 |
| 7 | PS Jasa Tomić | 9.4 | 3.0 | 15.2 | 13.8 | 9.2 | 7.4 |
| 8 | PS Sr. Mitrovica | −8.1 | 2.2 | 2.4 | 10.9 | −6.0 | 4.9 |
| 9 | PS Bela Crkva | −7.2 | −5.8 | 6.2 | 5.2 | 2.5 | 2.1 |
| 10 | PS Jajinci | 1.5 | 1.6 | 6.4 | 9.2 | 4.5 | 6.1 |
| 11 | PS Loznica | 24.9 | 15.9 | 27.2 | 19.2 | 21.4 | 15.2 |
| 12 | PS Osečina | 29.3 | 17.1 | 24.1 | 17.2 | 21.8 | 15.0 |
| 13 | PS Kosjerić | −2.9 | 6.0 | −6.0 | 7.7 | −2.1 | 7.7 |
| 14 | PS Požega | 10.6 | 7.7 | −0.4 | 8.8 | 6.4 | 9.2 |
| 15 | PS Ivanjica | −5.9 | 5.3 | 26.7 | 17.9 | 11.1 | 12.6 |
| 16 | PS Prijepolje | 30.4 | 18.4 | 19.1 | 17.5 | 27.7 | 19.4 |
| 17 | PS Sjenica | 36.2 | 17.8 | 30.6 | 20.7 | 32.7 | 19.9 |
| 18 | PS Novi Pazar | 13.7 | 6.8 | 21.6 | 16.4 | 15.0 | 12.5 |
| 19 | PS Dragaš | 7.4 | 3.7 | 14.3 | 13.0 | 16.8 | 12.7 |
| 20 | PS Smed. Palanka | 12.5 | 2.7 | 23.8 | 12.7 | 18.8 | 9.4 |
| 21 | PS Kragujevac | 7.0 | 2.3 | 15.1 | 11.2 | 14.1 | 9.1 |
| 22 | PS Rekovac | −0.7 | 0.5 | −5.2 | 9.1 | −0.4 | 7.4 |
| 23 | PS Ćuprija | 7.4 | −1.2 | 28.4 | 11.6 | 16.8 | 7.9 |
| 24 | PS Aleksandrovac | −24.2 | −6.3 | 10.4 | 10.0 | 1.4 | 6.1 |
| 25 | PS Blaževo | 2.2 | −0.7 | 9.2 | 11.7 | 6.3 | 8.3 |
| 26 | PS Kuršumlija | −7.4 | −3.3 | 19.8 | 13.0 | 7.7 | 8.1 |
| 27 | PS Vel. Gradište | −3.8 | −6.0 | 2.7 | 3.5 | 0.6 | 1.5 |
| 28 | PS Voluja | −31.0 | −13.7 | −33.9 | −6.1 | −22.5 | −4.3 |
| 29 | PS Crni Vrh | 0.3 | −7.4 | 6.4 | 4.7 | 10.8 | 4.3 |
| 30 | PS Negotin | −34.0 | −19.1 | −2.7 | 0.9 | −11.3 | −2.7 |
| 31 | PS Zaječar | −26.7 | −14.5 | 3.7 | 4.3 | −4.4 | 0.9 |
| 32 | PS Knjaževac | −6.2 | −8.9 | 0.2 | 3.8 | 4.0 | 3.6 |
| 33 | PS Niš | 4.1 | −4.9 | 19.4 | 10.4 | 15.9 | 7.6 |
| 34 | PS Pirot | −2.4 | −20.9 | −1.8 | −6.9 | 9.2 | −3.2 |
| 35 | PS Krupac | −50.3 | −18.6 | −28.6 | −5.7 | −22.6 | −1.5 |
| 36 | PS Leskovac | 11.9 | −3.3 | 31.0 | 13.1 | 19.9 | 8.7 |
| 37 | PS Vranje | −25.9 | −15.6 | −3.2 | 0.2 | −4.5 | −0.1 |
| 38 | PS Bujanovac | −18.8 | −14.6 | −14.7 | −2.1 | −8.1 | −0.9 |
| Average for 38 stations | −0.6 | −0.6 | 10.2 | 10.2 | 7.5 | 7.5 | |
Table 3.
Selected Q stations with observed annual trends for analyzed periods.
| Hydrologic Station | Linear Trends for Period (°C/100 Years) | |||
|---|---|---|---|---|
| 1949–2006 | 1959–2016 | 1949–2016 | ||
| 1 | Ibar–Raška | −44.1 | −22.0 | −37.0 |
| 2 | Lim–Prijepolje | −33.5 | −43.7 | −35.9 |
| 3 | Moravica–Arilje | −0.1 | −4.4 | 0.3 |
| 4 | Studenica–Ušće | 3.1 | 15.5 | 2.4 |
| 5 | Drina–Radalj | −28.3 | −37.2 | −26.3 |
| 6 | V. Morava–Varvarin | −33.0 | −18.8 | −23.4 |
| 7 | Z. Morava–Jasika | −16.0 | −13.4 | −14.9 |
| 8 | J. Morava–Aleksinac | −51.7 | −21.7 | −28.8 |
| 9 | Nišava–Niš | −64.3 | −44.1 | −42.8 |
| 10 | Lugomir–Majur | −33.9 | −20.8 | −17.7 |
| 11 | Timok–Tamnič | −69.1 | −34.6 | −41.9 |
| 12 | Beli Timok–Knjaževac | −58.4 | −47.7 | −37.0 |
| 13 | Pek–Kusići | −43.5 | −14.3 | −19.6 |
| 14 | Jasenica–D. Šatornja | −20.7 | −54.0 | −31.0 |
| 15 | Veternica–Leskovac | −56.4 | −62.2 | −52.0 |
| 16 | Toplica–D. Selova | −22.8 | 16.7 | −21.7 |
| 17 | Crnica–Paraćin | −16.0 | 14.7 | 4.1 |
| 18 | Jadar–Lešnica | −43.1 | −25.9 | −32.2 |
| 19 | Resava–Svilajnac | −2.6 | −3.2 | −3.9 |
| 20 | Kamenica–Prijevor | −10.7 | −26.7 | −12.2 |
| 21 | Skrapež–Požega | −22.4 | −9.5 | −23.6 |
| 22 | Kolubara–Valjevo | −6.1 | 13.4 | −2.6 |
| 23 | V. Morava–Ljubičev. Most | −28.4 | −2.1 | −13.2 |
| 24 | Veliki Rzav–Radobuđa | 1.6 | −1.3 | −1.8 |
| Average for 24 stations | −29.2 | −18.6 | −21.4 | |
Table 4.
Average relative values for T and Q for all T deviation categories and all three periods.
| Period → | 1949–2006 | 1959–2016 | 1949–2016 | ||||||
|---|---|---|---|---|---|---|---|---|---|
| T Deviation Category (∆ °C) | T Difference (Average) (∆ °C) | Relative Discharge-Average (-) | Number of Pair Data Points | T Difference (Average) (∆ °C) | Relative Discharge-Average (-) | Number of Pair Data Points | T Difference (Average) (∆ °C) | Relative Discharge-Average (-) | Number of Pair Data Points |
| ∆T < -1.0 °C | −1.259 | 1.251 | 103 | −1.278 | 1.184 | 115 | −1.341 | 1.215 | 150 |
| −1.0 < ∆T < −0.5 | −0.705 | 1.110 | 199 | −0.702 | 1.111 | 255 | −0.703 | 1.095 | 303 |
| −0.5 < ∆T < −0.0 | −0.239 | 1.045 | 427 | −0.258 | 0.994 | 408 | −0.248 | 1.002 | 444 |
| All 24 C.A.s data | 0.000 | 1.000 | 1392 | 0.000 | 1.000 | 1392 | 0.000 | 1.000 | 1632 |
| 0.0 < ∆T < 0.5 | 0.223 | 0.958 | 368 | 0.227 | 0.908 | 273 | 0.233 | 0.935 | 319 |
| 0.5 < ∆T < 1.0 | 0.694 | 0.902 | 167 | 0.747 | 0.985 | 139 | 0.753 | 0.963 | 181 |
| 1.0 °C < ∆T | 1.359 | 0.728 | 128 | 1.308 | 0.902 | 202 | 1.328 | 0.851 | 235 |
Table 5.
Q linear trend slope (%/1 °C) and most probable relative Q for the years with T higher 1 °C from average of analyzed period
Table 5.
Q linear trend slope (%/1 °C) and most probable relative Q for the years with T higher 1 °C from average of analyzed period
| Period | Researching Step and No. of Stations | Q Linear Trend Slope (%/1 °C) | Most Probable Relative Q (-) |
|---|---|---|---|
| 1949–2006 | 1st (18 pair of Q and T stations) | −20.0 | 0.80 |
| 1949–2006 | 2nd (24 pair of Q and T stations) | −18.9 | 0.81 |
| 1959–2016 | 2nd (24 pair of Q and T stations) | −10.5 | 0.89 |
| 1949–2016 | 2nd (24 pair of Q and T stations) | −12.6 | 0.87 |
Table 6.
Dependence of average T, P and Q trends from the selected period.
| Researching Step | Analyzed Period | Average T Trend (°C/100 Years) | Average P Trend (%/100 Years) | Average Q Trend (%/100 Years) |
|---|---|---|---|---|
| 1st | 1949–2006 | +0.6 | −0.3 | −36.7 |
| 2nd | 1949–2006 | +0.6 | −0.6 | −29.2 |
| 2nd | 1959–2016 | +2.7 | +10.2 | −18.6 |
| 2nd | 1949–2016 | +1.7 | +7.5 | −21.4 |
Publisher’s Note: MDPI stays neutral with regard to jurisdictional claims in published maps and institutional affiliations. |
© 2018 by the author. Licensee MDPI, Basel, Switzerland. This article is an open access article distributed under the terms and conditions of the Creative Commons Attribution (CC BY) license (https://creativecommons.org/licenses/by/4.0/).
Share and Cite
MDPI and ACS Style
Dimkić, D. Observed Climate and Hydrologic Changes in Serbia—What Has Changed in the Last Ten Years. Proceedings 2018, 2, 616. https://doi.org/10.3390/proceedings2110616
AMA Style
Dimkić D. Observed Climate and Hydrologic Changes in Serbia—What Has Changed in the Last Ten Years. Proceedings. 2018; 2(11):616. https://doi.org/10.3390/proceedings2110616
Chicago/Turabian StyleDimkić, Dejan. 2018. "Observed Climate and Hydrologic Changes in Serbia—What Has Changed in the Last Ten Years" Proceedings 2, no. 11: 616. https://doi.org/10.3390/proceedings2110616