Proceeding Paper

Optimizing the Formation of DMAs in a Water Distribution Network Applying Geometric Partitioning (GP) and Gaussian Mixture Models (GMMs) †

by
Stavroula Chatzivasili
1,
Katerina Papadimitriou
2,
Vasilis Kanakoudis
1,* and
Menelaos Patelis
1
1
Department of Civil Engineer, University of Thessaly, 38221 Volos, Greece
2
Department of Electrical and Computer Engineering, University of Thessaly, 38221 Volos, Greece
*
Author to whom correspondence should be addressed.
Presented at the 3rd EWaS International Conference on "Insights on the Water-Energy-Food Nexus", Lefkada Island, Greece, 27–30 June 2018.
Proceedings 2018, 2(11), 601; https://doi.org/10.3390/proceedings2110601
Published: 3 August 2018
(This article belongs to the Proceedings of EWaS3 2018)

Abstract

:
In the last three decades, the need of achieving a reliable water distribution system has become more eminent for both the consumer’s satisfaction and the efficient management of water sources. The purpose of this paper is to provide an optimal separation of a water distribution network (WDN) into District Metered Areas (DMAs) in order to ensure that the delivered water is of proper age and pressure. At first, the water distribution network is divided into smaller areas via the method of Geometric Partitioning, which is based on Recursive Coordinate Bisection (RCB). Subsequently, Gaussian Mixture Modelling (GMM) solution is applied, obtaining an optimal placement of isolation valves and separation of the WDN into DMAs. The performance of the proposed system is evaluated on two different networks and is compared against the Genetic Algorithm (GA) tool, constituting a very promising approach, especially for sizeable water distribution networks due to the diminished running time and the noteworthy reduction of pressure and water age.

1. Introduction

A reliable Water Distribution Network (WDN) plays a vital role in providing a desirable life quality to the public. Reliability lies upon two main pillars, proper pressure and water age to the system. The optimization of WDNs is a complicated task, which has been a challenge for engineers and researchers throughout the last decades, due to the need of solving many non-linear equations and the complexity of parameters characterizing the system. Therefore, they have focused on stochastic or so-called heuristic methods and various artificial intelligence-based algorithms. Farmani and Walters [1] examined the reduction of the cost and water quality through a Genetic Algorithm. Additionally, Creaco and Pezzinga [2] applied the same method to optimize the amount of leakage in the water distribution network. Apart from Genetic algorithms, many other methods have been proposed for the optimization and modelling of the WDNs. Campolo [3] and Kumar [4] used Artificial Neural Networks for the rainfall-rainoff modelling and Nagy et al. [5] and Abrahart et al. [6] for sediment prediction. Maier [7] was the first who used an Ant Colony algorithm- ACOA to optimize a WDN. Also, Kumar et al. [8] proposed an ACOA to adjust the tank level and Lopez-Ibanez [9] used this for the optimization of the pumps’ operation in the system. Ostfeld et al. [10] conflated the latter works to optimize the modelling and operation of the network in conjunction with the commission of pumps and tanks. The combination of two or more optimization methods consists a hybrid approach. Many other metaheuristic methods have been applied to solve the problem of designing the optimal water distribution network, as Simulation Annealing (SA) [11], Iterated Local Search [12] and Shuffle Frog Leaping [13].
However, when dealing with large WDNs, most heuristic methods are inefficient and time-consuming, due to the wide search space that must be explored. Thus, strategies for diminish the search space are of greatest need. The purpose of this paper introduces a new hybrid approach of optimization, to guarantee more accurate results in reduced running time. The proposed method is based on abbreviating the search space by dividing the WDN in smaller areas and work out each one of them in a parallel manner. The following algorithms have been applied to optimize the water age and calibrate the pressure of the network by dividing it into District Metered Areas—DMAs. The performance of the approach presented in the paper is evaluated on two different networks and compared against the Genetic Algorithm.

2. Proposed Model

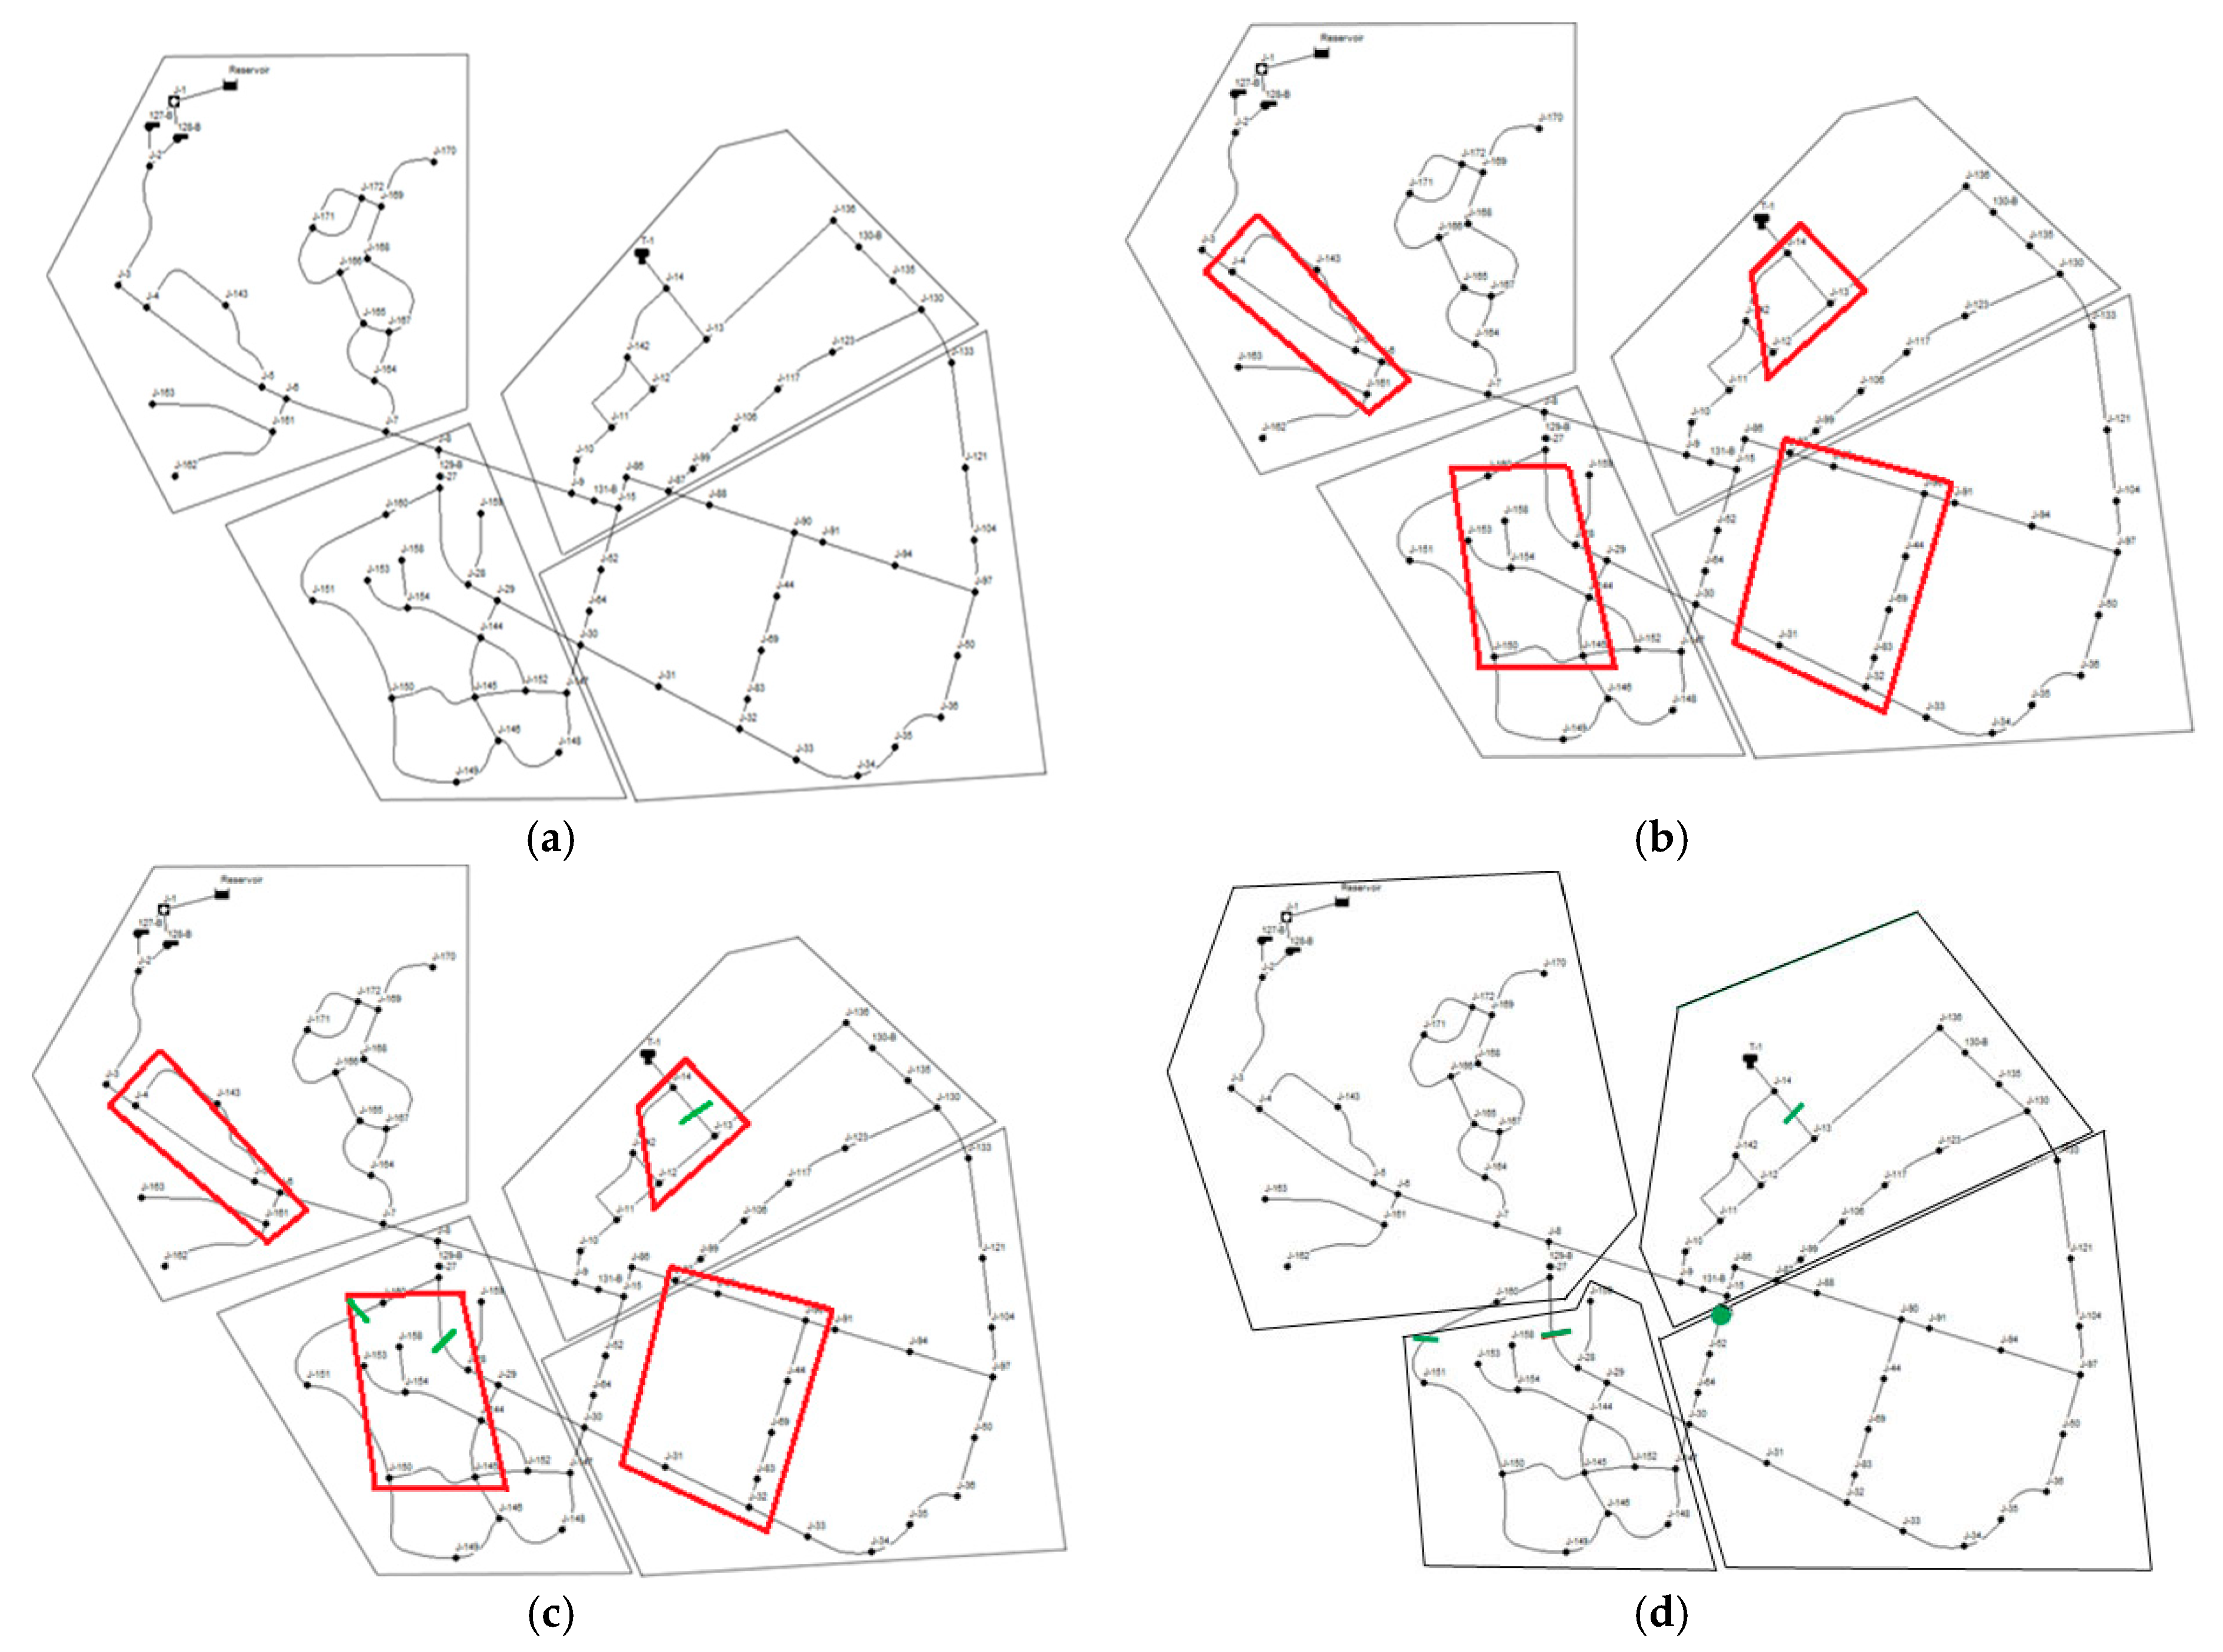
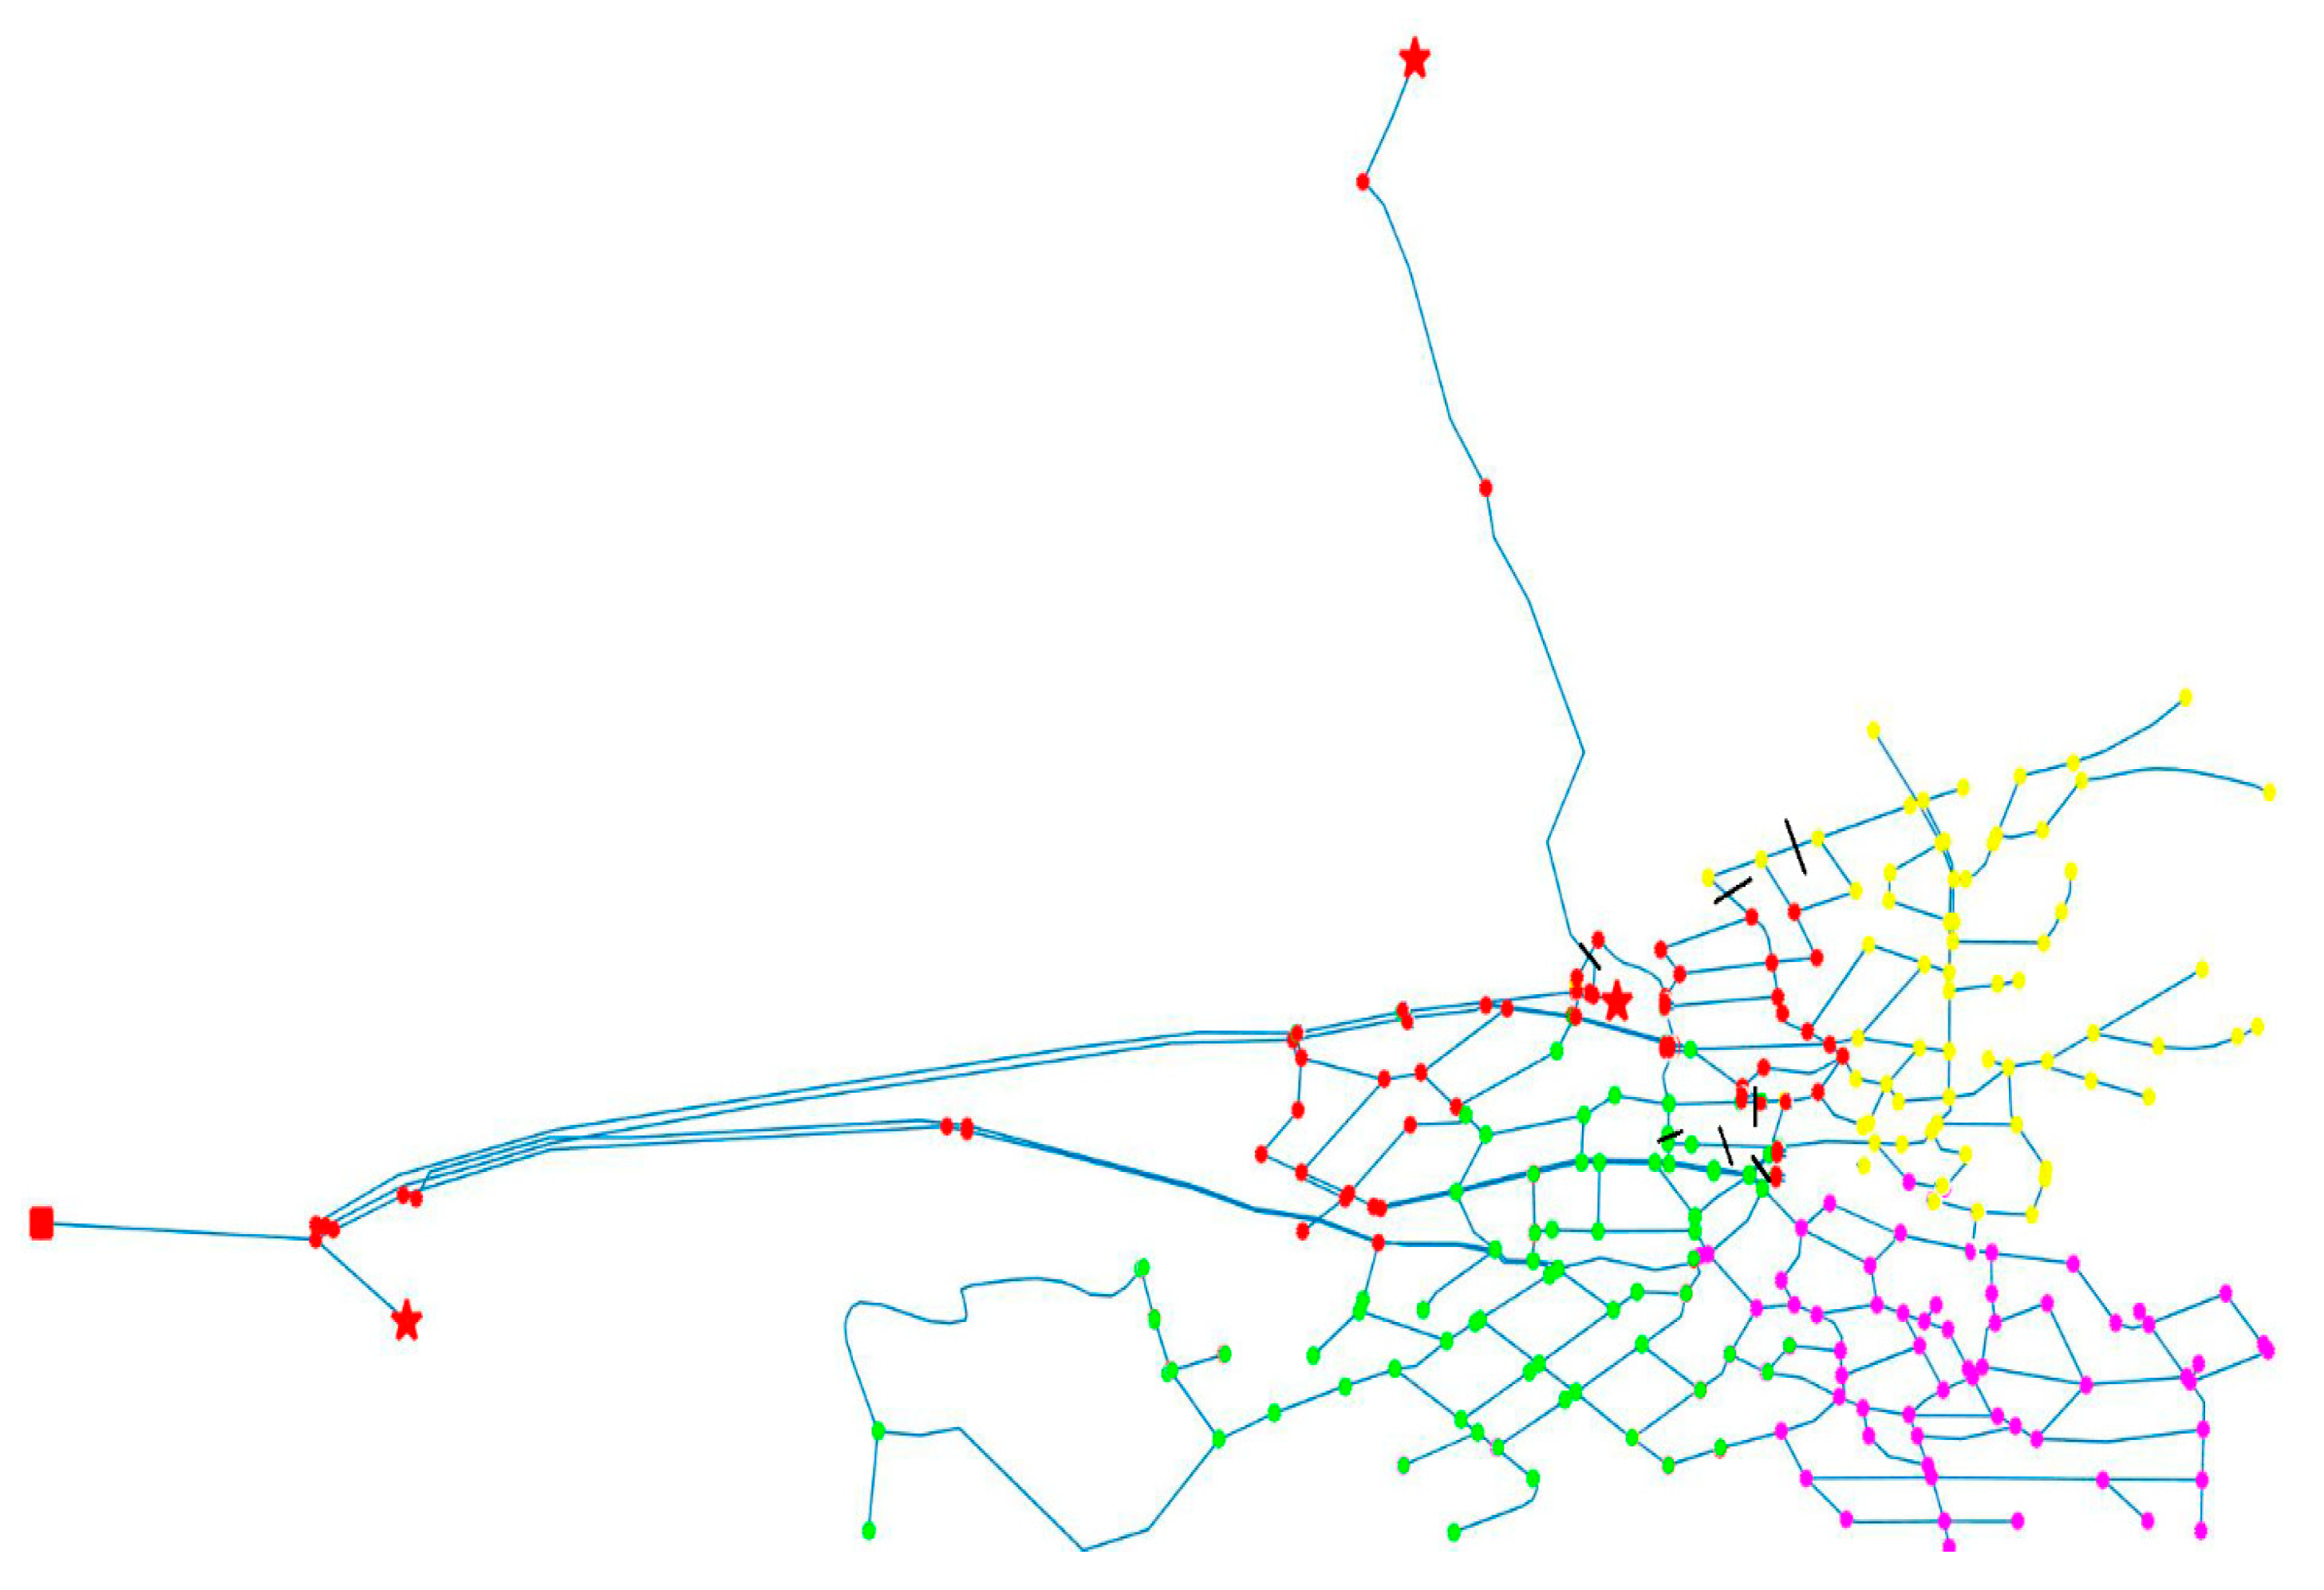
2.1. Geometric Partitioning

Dividing a region into smaller sub-areas is an issue we come across in many graph data structure problems. Such a problem is the separation of large WDN, which is critical due to the need of running time reduction and computational requirements restriction. The algorithm is based on Recursive Coordinate Bisection (RCB) [9]. RCB is a technique for dividing a list of coordinates into approximately equal sized partitions of spatially close elements. The general idea is to find the most expanded dimension of Geometric coordinates and find a layer that will split the graph into two roughly equal parts. Then the separation continues recursively in each part, until the intended number of areas is created. It stands to reason, that if we want, for example, to divide the domain into eight subdomains, we have to apply RCB algorithm three times to the dual. Also, the domains have a few isolated outlying vertices and none connectivity information enters the RCB. More precisely, assuming that the set of vertices V = [v1, v2, …, vi], with i being the number of water distribution network nodes, corresponds to the two-dimensional coordinates of each node, vi = (xi, yi), we apply a bisection operation selecting one of the two coordinate directions randomly [10]. Specifically, selecting the x-coordinate direction, for example, all vertices are sorted according to the x-coordinate and, thus, the set of nodes are split into two subsets assigning half of the nodes to each subdomain. Furthermore, the partition into r subdomains is performed by applying r times the latter procedure to the set of vertices.

2.2. Gaussian Mixture Modelling

Viewing the problem of water distribution network optimization as a clustering problem, we assume that, each node is represented by a variable xn, with n = 1, ..., N being the number of nodes in each partition generated by the Geometric Partitioning algorithm. Our goal is to separate the nodes of each partition individually into K clusters, with K given. Intuitively, we could see a cluster as a group of nodes where inter-cluster distances are smaller than those outside the cluster. Specifically, the value of xn emerges in accordance with the value of the objective function for the node n and has a distinct vector πnj, j = 1, ..., K which denotes the probability of the n-th node to belong to the j-th cluster. Supposing that the independently distributed random variables X are a realization of a Gaussian mixture model (GMM) [11,12], the probability of a single node is expressed by:
p ( x ) = k = 1 K π k   N   ( x | μ k   , Σ k )
where, Π is constrained to be positive, 0 <   π k   < 1, and summing to unity, κ = 1 κ Π κ = 1. Furthermore, N   ( x | μ k   , Σ k ) is a Gaussian distribution with μκ denoting the Gaussian kernel mean vector and Σk representing the Gaussian kernel covariance matrices.
Similarly, the conditional distribution of x, given an explicit hidden variable Z which leads to significant simplifications for the model, is a Gaussian:
p ( x | z ) = k = 1 K N ( x | μ k   , Σ k ) zk
while the prior distribution for the latent variable is distributed multinomially:
p ( z ) = k = 1 K π k zk
with zk being a binary vector having a single component equal to 1, znk = 1, and all others equal to 0.
To perform our formula inference, we exploit MAP estimation through EM algorithm [13]. Thus, for the calculation of the parameters πκ, μκ and Σκ we use the GMM-EM (Expectation-Maximization) algorithm [14], which is a repetitive algorithm and a powerful method for finding solutions concerning models with hidden variables. The algorithm starts with an initial estimate of the parameter values randomly and continues with a calculation of the values until convergence. Each iteration consists of two steps the E-step and the M-step. The equations resulting from the E-step and M-step steps of the algorithm are as follows:
p nk   = N ( x n | μ k , Σ k ) P ( k ) P ( x n )
N k = n = 1 N p nk  
π k ( new ) = N k N
μ k ( new ) = ( 1 N k ) i = 1 N p nk   x n
k ( new ) = ( 1 N k ) n = 1 N p nk   ( x n - μ k ( new ) ) ( x n - μ k ( new ) ) T

3. Optimization and Experimental Results
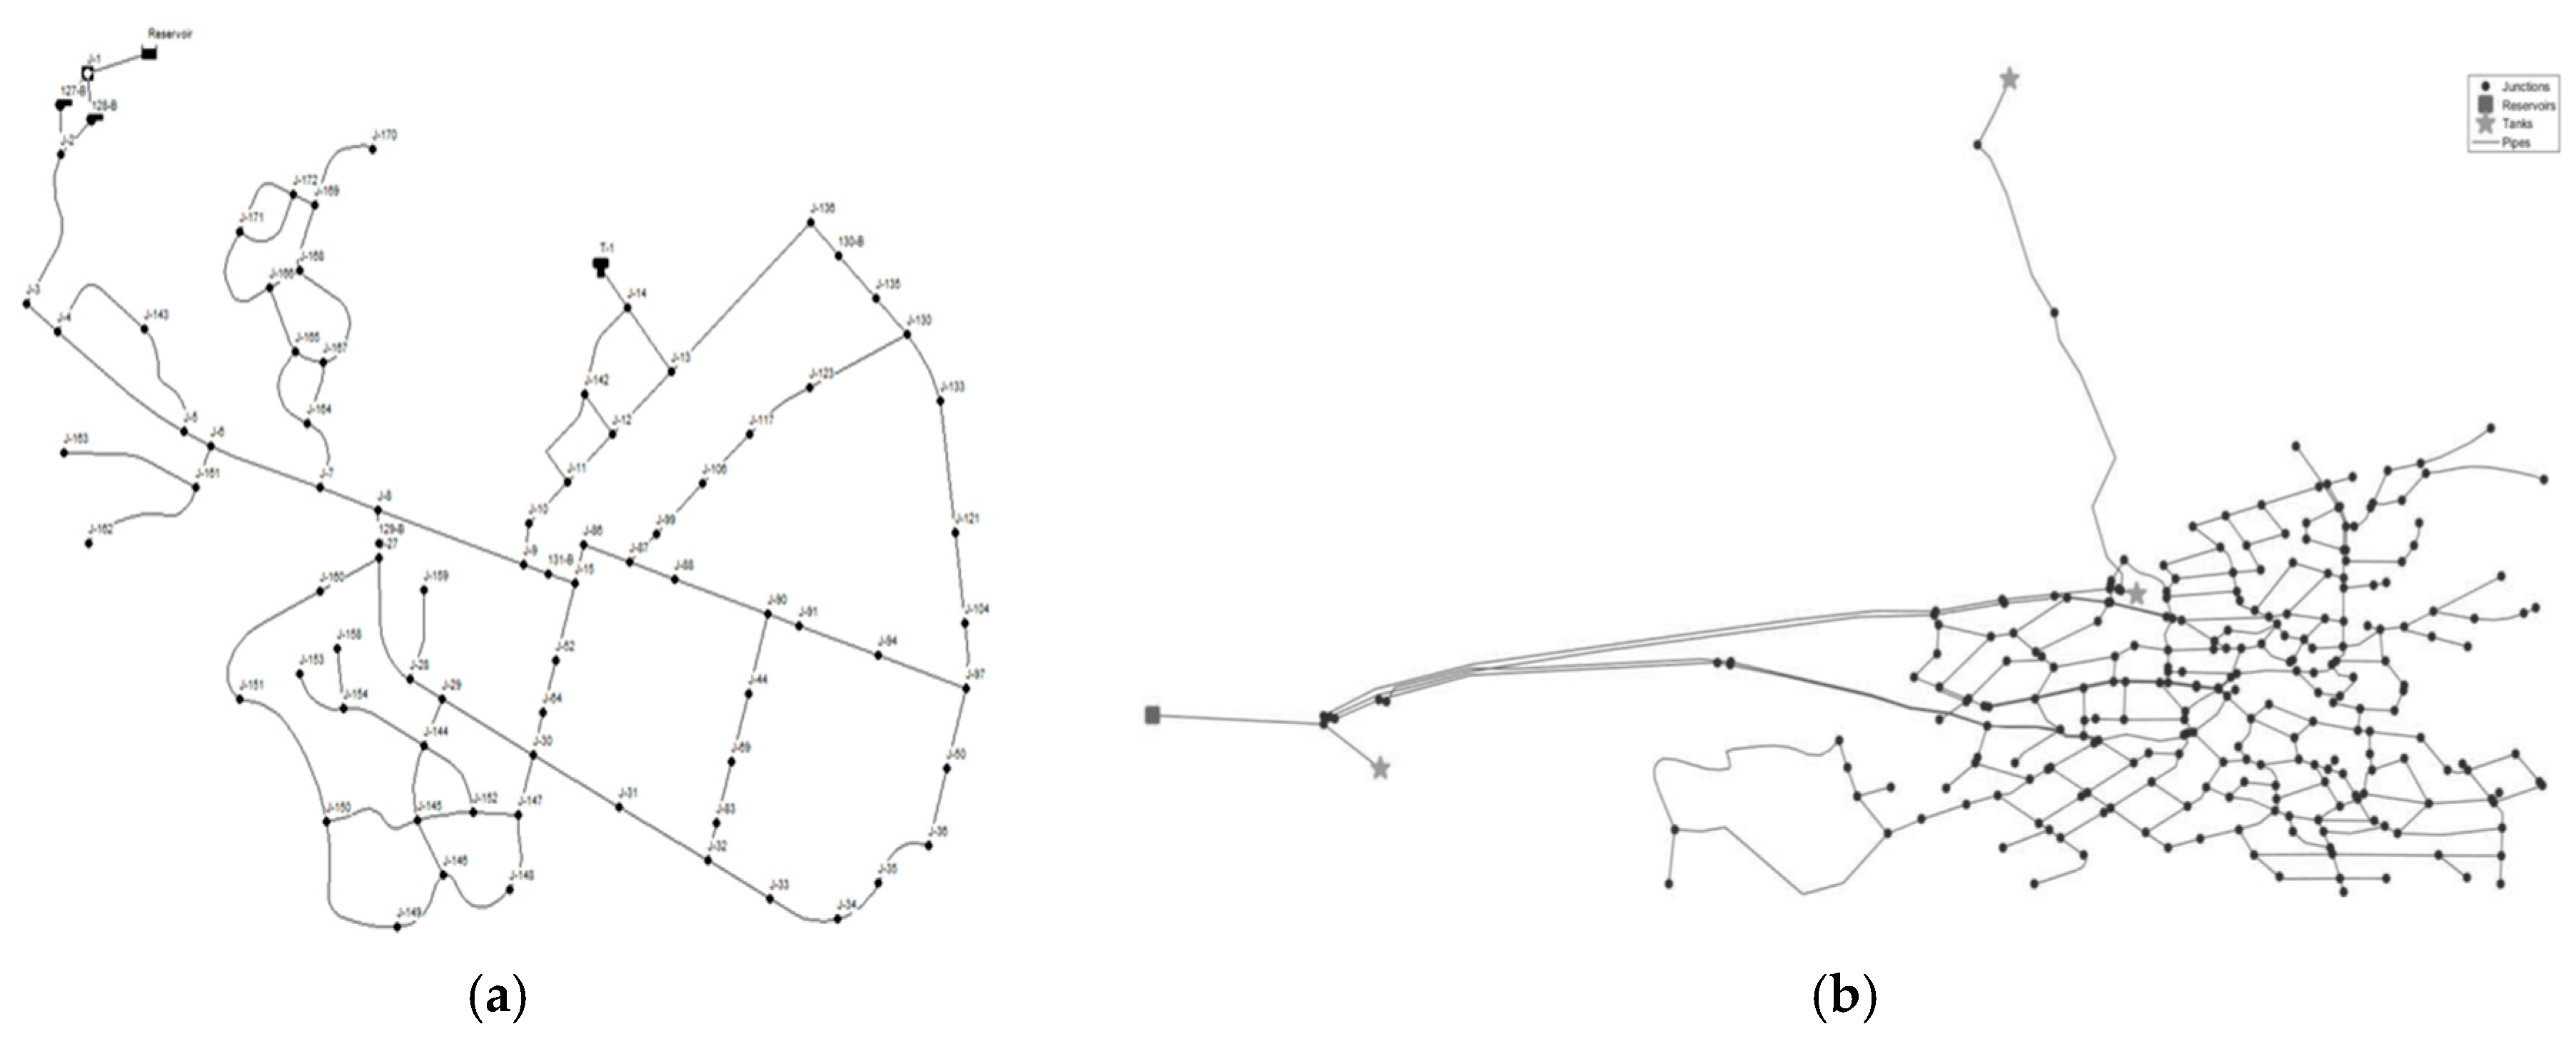
3.1. Networks

For the experiments a realistic network (Net22) is used, which has one reservoir, two pumps (boosters PMP1 and PMP2) with which the water acquires the speed needed to serve all the nodes of the network, tank (tank T-1) where water is stored and 100 pipelines with start and end nodes. This network is shown in Figure 1a and has been generated by the Watergems program.
The second network is the Aiani’s network, with Aiani being a town in the prefecture of Kozani in Greece (Figure 1b) and belongs to the region of Western Macedonia with an area of 152.9 square kilometers. The altitude of the area is 460 m and the lowest point of the network is 432 m while the highest point is 547 m. Due to the altitude difference in the area and the gravity effect, water pressure and water quality are significantly affected. It consists of 329 pipelines with a total length of 28,846 m, 140 valves and two tanks.

3.2. Forming of the Objective Functions

Applying the GMM-EM algorithm to each partition that emerged through the Geometric Partitioning described earlier, k different clusters are created within each sub-region. The number k of the cluster has to be set in such a way that it leads to greater optimization of the objective function. The value for each node i is derived, initially, from the equation:
x i = t = 1 T D it × P it
where, Dit is the demand of node i at each time step t [lt/sec] and Pit represents the pressure of node i at each time step t [kPa]. Additionally, we examined the influence of the algorithm using as objective the age of water using the function:
x i = max i ( Age ) | t = 1 T
Considering the average μκ of each cluster, clusters from each partition were selected with the highest mean average so that the isolation valves are located there.

3.3. Performing the Proposed Model for Both Networks

By performing the Geometric Separation algorithm in a Matlab environment for Net22 with κ = 4 number of sub-regions, the resulting separation is shown in Figure 2a, where the network is divided into well-defined, equivalent-sized areas. During the implementation of the GMM-EM algorithm in the network, approximately 5 iterations until convergence were needed for each sub-region and 0.006 s of the total time was required. It should be noted that the parameters initial values were set iteratively, and we chose those that optimize the result. In Figure 2b the results obtained through the GMM are shown, where the clusters with the highest average are those of interest and are depicted in red contour shapes. More precisely, by comparing the mean average value of each generated cluster, we get the one with the highest μκ value and after placing an isolation valve on each pipe or a combination of them within the specific cluster, we check the total product Pressure*Demand for a period of the 24-h (PD). The basic constraints for the selection of the closing pipes are that, firstly, the terminal nodes are not included in those that can be selected, and additionally, nodes with negative pressures and pressures below 200 kPa (29 psi) are rejected. The latter process is repeated for all remaining clusters and at each time we hold the isolation valves that have already been placed in previous clusters.
The candidate pipes for closing are shown in Figure 2c marked with green color. The selected pipes are 3: P-17, P-33, and P-126. The initial value of the product before closing the pipes is 1,597,700 (psi*gpm) and after closing using isolation valves is 771,360 (psi*gpm). Therefore, the total Pressure *Demand product is minimized by 52.72%. Finally, the maximum age of water is calculated before and after performing the proposed model, resulting in a 5% reduction. Finally, considering the proposed pipes through the proposed algorithm, a new separation of the network into isolated DMAs is shown Figure 2d. As shown in the Figure 2d, the partition is slightly altered in contrast with the one produced by the Geometric Partitioning algorithm. The green circle indicates the pipe recommended for PRV valve placement. Finally, the most critical junction is ‘J-64′ with a total pressure drop at 76.63%. The initial average pressure value for the critical node is 109.1023 psi and the final is 26.4402 psi.
Performing the latter procedure for the Aiani network the pipes selected to be closed are 171, 134, 144, 138, 169 and 142. This resulted in a decrease of Pressure*Demand product by 31.60% and of the corresponding maximum water age by 5%. The optimum result, using the second objective function, obtained by placing a closed valve at node 98 with the average water age being reduced by 14.95%. Figure 3 below shows the Aiani network divided into DMAs with the pipes proposed by the model to be closed marked with black color. In Figure 4 the experimental results corresponding to the Pressure*Demand product and water age reduction for both networks are shown.

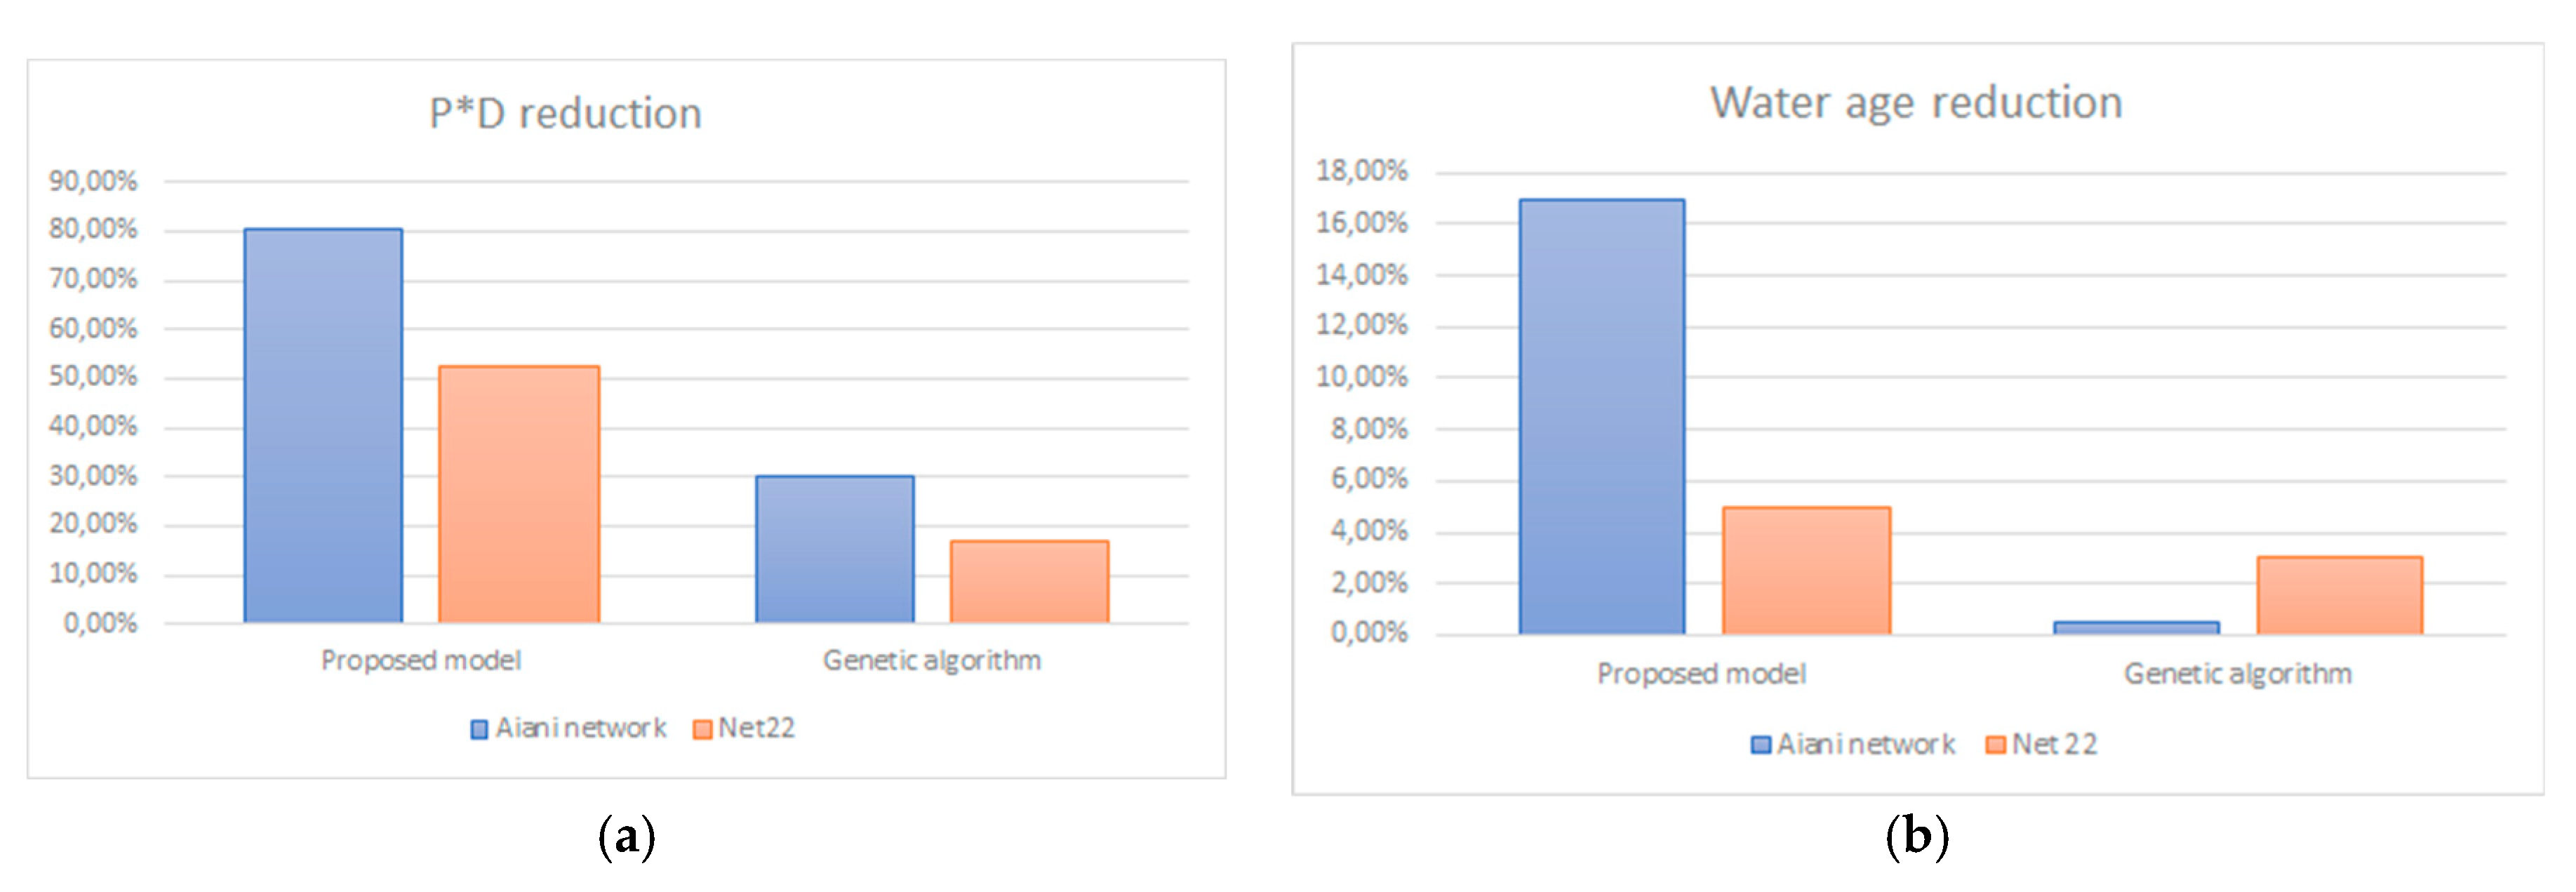
3.4. Comparison with Genetic Algorithm

Applying the Genetic algorithm to the Net22, 8 different pipes to be closed are proposed: P-151, P-249, P-263, P-146, P-212, P-143, P-240 and P-35. This leads to a total reduction of the objective by 16.69% and the maximum water age by 3%. The result is 11% smaller than that of the proposed model and the main issue focuses in the number of valves to be placed which are almost twice as high as those previously proposed. This is a significant drawback due to the huge installation cost.
Then, the Genetic algorithm was performed for the Aiani network proposing the optimal scenario of 8 closed pipes, with IDs: 216, 171, 165, 155, 106, 332, 319, 287. This resulted in a water age reduction of 0.5% and a Pressure*Demand product decrease of 11.2%.

4. Conclusions

Initially, via the method of Geometric Partitioning the networks are divided into sub-regions. The main contribution of this separation method is that each region borders are distinguishable and there is no coverage between regions. Among others, equivalent areas are created, reducing the complexity of the network, which implies its better control. Then, the GMM algorithm is performed in parallel for every region and the computational time is reduced dramatically in comparison with the Genetic Algorithm. More specifically, by comparing the proposed algorithm with the Genetic algorithm, it has been proven that the GMM algorithm leads to more remarkable results in accordance with the optimization of both pressure and water age. Furthermore, the hybrid approach ensures the placement of fewer PRV valves. In conclusion, the proposed method is suitable for sizeable networks due to the limited computational time of the proposed model.

References

  1. Senthil Kumar, A.R.; Sudheer, K.P.; Jain, S.K.; Agarwal, P.K. Rainfall-runoff modelling using artificial neural networks: Comparison of network types. Hydrol. Process. 2005, 19, 1277–1291. [Google Scholar] [CrossRef]
  2. Nagy, H.M.; Watanabe, K.; Hirano, M. Prediction of Sediment Load Concentration in Rivers using Artificial Neural Network Model. J. Hydraul. Eng. 2002, 128, 588–595. [Google Scholar] [CrossRef]
  3. Maier, H.R.; Dandy, G.C. Neural networks for the prediction and forecasting of water 20 resources variables: A review of modelling issues and applications. Environ. Model. Softw. 2000, 15, 101–124. [Google Scholar] [CrossRef]
  4. Campolo, M.; Soldati, A.; Andreussi, P. Artificial neural network approach to flood forecasting in the River Arno. Hydrol. Sci. J. 2003, 48, 381–398. [Google Scholar] [CrossRef]
  5. Abrahart, R.J.; White, S. Modelling Sediment Transfer in Malawi: Comparing Backpropagation Neural Network Solutions against a Multiple Linear Regression Benchmark Using Small Data Sets. Phys. Chem. Earth B Hydrol. Oceans Atmos. 2001, 26, 19–24. [Google Scholar] [CrossRef]
  6. Cunha, M.D.; Sousa, J. Water distribution network design optimization: Simulated annealing approach. J. Water Resour. Plan. Manag. 1999, 125, 215–221. [Google Scholar] [CrossRef]
  7. Lansey, K.E.; Eusuff, M.M. Optimization of water distribution network design using the Shuffled Frog Leaping Algorithm. J. Water Resour. Plan. Manag. 2003, 129, 10–25. [Google Scholar]
  8. De Corte, A.; Sörensen, K. An Iterated Local Search Algorithm for multi-period water distribution network design optimization. Water 2016, 8, 359. [Google Scholar] [CrossRef]
  9. Williams, R.D. Performance of dynamic load balancing algorithms for unstructured mesh calculations. Concurr. Pract. Exp. 1991, 3, 457–481. [Google Scholar] [CrossRef]
  10. Simon, H.D. Partitioning of unstructured problems for parallel processing. Comput. Syst. Eng. 1991, 2, 135–148. [Google Scholar] [CrossRef]
  11. Andrieu, C.; Freitas, N.D.; Doucet, A.; Jordan, M.I. An Introduction to MCMC for Machine Learning. J. Mach. Learn. 2003, 50, 5–43. [Google Scholar] [CrossRef]
  12. Bernardo, J.M.; Smith, A.F.M. Bayesian Theory; John Wiley & Sons: New York, NY, USA, 2000. [Google Scholar]
  13. Xu, L.; Jordan, M.I. On Convergence Properties of the EM Algorithm for Gaussian Mixture. Neural Comput. 1996, 8, 129–151. [Google Scholar] [CrossRef]
  14. Figueiredo, M.A.T. Bayesian Image Segmentation Using Gaussian Field Priors. In Proceedings of the 5th International Workshop EMMCVPR 2005, St. Augustine, FL, USA, 9–11 November 2005; LNCS Volume 3757, pp. 74–89. [Google Scholar]
Figure 1. (a) The demo network Net22; (b) the Aiani network.
Proceedings 02 00601 g001
Figure 2. (a) Separation of Net22 into sub-regions using Geometric Partitioning; (b) the clusters with the highest average value for each sub-region using GMM-EM (red contour); (c) the pipes in which isolating valves are installed are colored in green; (d) splitting of Net22 into DMAs and the pipes with the green circle denote the selected pipes for PRV installation.
Proceedings 02 00601 g002
Figure 3. Separation of the Aiani’s network into DMAs with the proposed pipes for closing by the model being marked with black color.
Proceedings 02 00601 g003
Figure 4. (a) Pressure*Demand product reduction; (b) water age reduction for both networks.
Proceedings 02 00601 g004
Publisher’s Note: MDPI stays neutral with regard to jurisdictional claims in published maps and institutional affiliations.

