Optimal Design of and Transition towards Water Distribution Network Blueprints †
by
 ,
,
Ina Vertommen
1,*, 
Karel van Laarhoven
1,
Peter van Thienen
1,
Claudia Agudelo-Vera
1,
Tjakko Haaijer
2 and
Roel Diemel
2 1
KWR Watercycle Research Institute, 3433 PE Nieuwegein, The Netherlands
2
Brabant Water, 5223 MA ‘s-Hertogenbosch, The Netherlands
*
Author to whom correspondence should be addressed.
†
Presented at the 3rd EWaS International Conference on "Insights on the Water-Energy-Food Nexus", Lefkada Island, Greece, 27–30 June 2018.
Proceedings 2018, 2(11), 584; https://doi.org/10.3390/proceedings2110584
Published: 3 August 2018
(This article belongs to the Proceedings of EWaS3 2018)
Abstract
:The design of network blueprints (ideal design of water distribution networks taking into account the existing infrastructure) is optimized considering the minimization of costs while satisfying the required pressure and flow velocities. The optimal transition from the existing infrastructure towards the blueprint is described by the minimization of pipe failures or maximization of hydraulic performance and the number of construction sites, where old pipes are replaced by new ones, in each transition phase. Both problems are solved with Gondwana. An application to the network of Helmond-Mierlo (The Netherlands) shows that the costs for the optimized blueprint are only 64% of those from the currently existing infrastructure, while the hydraulic performance is improved. The optimized transition shows that a larger number of intervention sites allows for a higher reduction of pipe failures and a better hydraulic performance of the network.
1. Introduction
Dutch water companies are facing challenges regarding the maintenance of their distribution networks, such as the timely replacement of old pipes to reduce the risk of pipe failures. The design and construction of entirely new networks is relatively rare, while adding and replacing pipes in existing networks is the common practice. Renovation allows for not just pipe-for-pipe replacements, but for an overall improvement of the network, which is often outdated and over dimensioned. The design of network blueprints is therefore currently a hot topic in the Netherlands. Network blueprints depict an ideal design of water distribution networks and is based on company-specific objectives and constraints, as well as the currently existing infrastructure. These blueprints are used by water companies as guidelines when rehabilitating their networks and replacing old or broken pipes. Once a blueprint is designed, the question arises on how to best proactively transition from the current infrastructure to the blueprint over time. Hydraulics, asset management and the continuously changing environment play an important role in this question.
The design of blueprints is a challenging task. It involves large and complex networks, and multiple constraints and objectives. So far, most companies solve these problems by hand, supported by geographical information systems and hydraulic modelling. This is a time consuming process and leads to the attainment of only one feasible (and “sufficiently good”) design. The same applies to the estimation of the best transition from the current infrastructure to the blueprint, which is difficult to do by hand: for instance, at which time should each pipe be replaced in order to reduce the pipe failure rates or to improve network performance as much as possible? Numerical optimization techniques can therefore be useful in solving these problems. To this end, KWR has developed Gondwana: a generic software platform for the optimization of drinking water distribution networks [1], which uses EPANET [2] for the hydraulic simulations. The Inspyred library provides metaheuristic optimization methods [3] (a modified genetic algorithm is used). The performance of Gondwana has already been demonstrated on small scale benchmark problems and real-life large networks [1,4,5].
In this paper, the design of network blueprints is described by an optimization problem considering the minimization of costs of new pipes while satisfying the minimum required pressure and flow velocities. The transition from the existing infrastructure to the blueprint is described by the minimization of pipe failures or maximization of hydraulic performance and the number of construction sites. Construction sites are the locations (cluster of isolation sections) where old pipes are replaced by new ones, in each transition phase. The constraints consider the number of transition phases and the minimum pipe length to be replaced in each transition phase. Gondwana was extended to be able to tackle both problems.
The approach was applied to the network of Helmond-Mierlo (The Netherlands), serving 105,000 inhabitants. In this contribution, we show results of the combined optimization processes, including the pipe diameters that lead to the least cost design of the network, as well as the transition phase in which each old pipe should be replaced by a new one, i.e., the rehabilitation timeline. These results can be used by the water company as guidelines when planning the rehabilitation of their network.
2. Materials and Methods
2.1. Approach
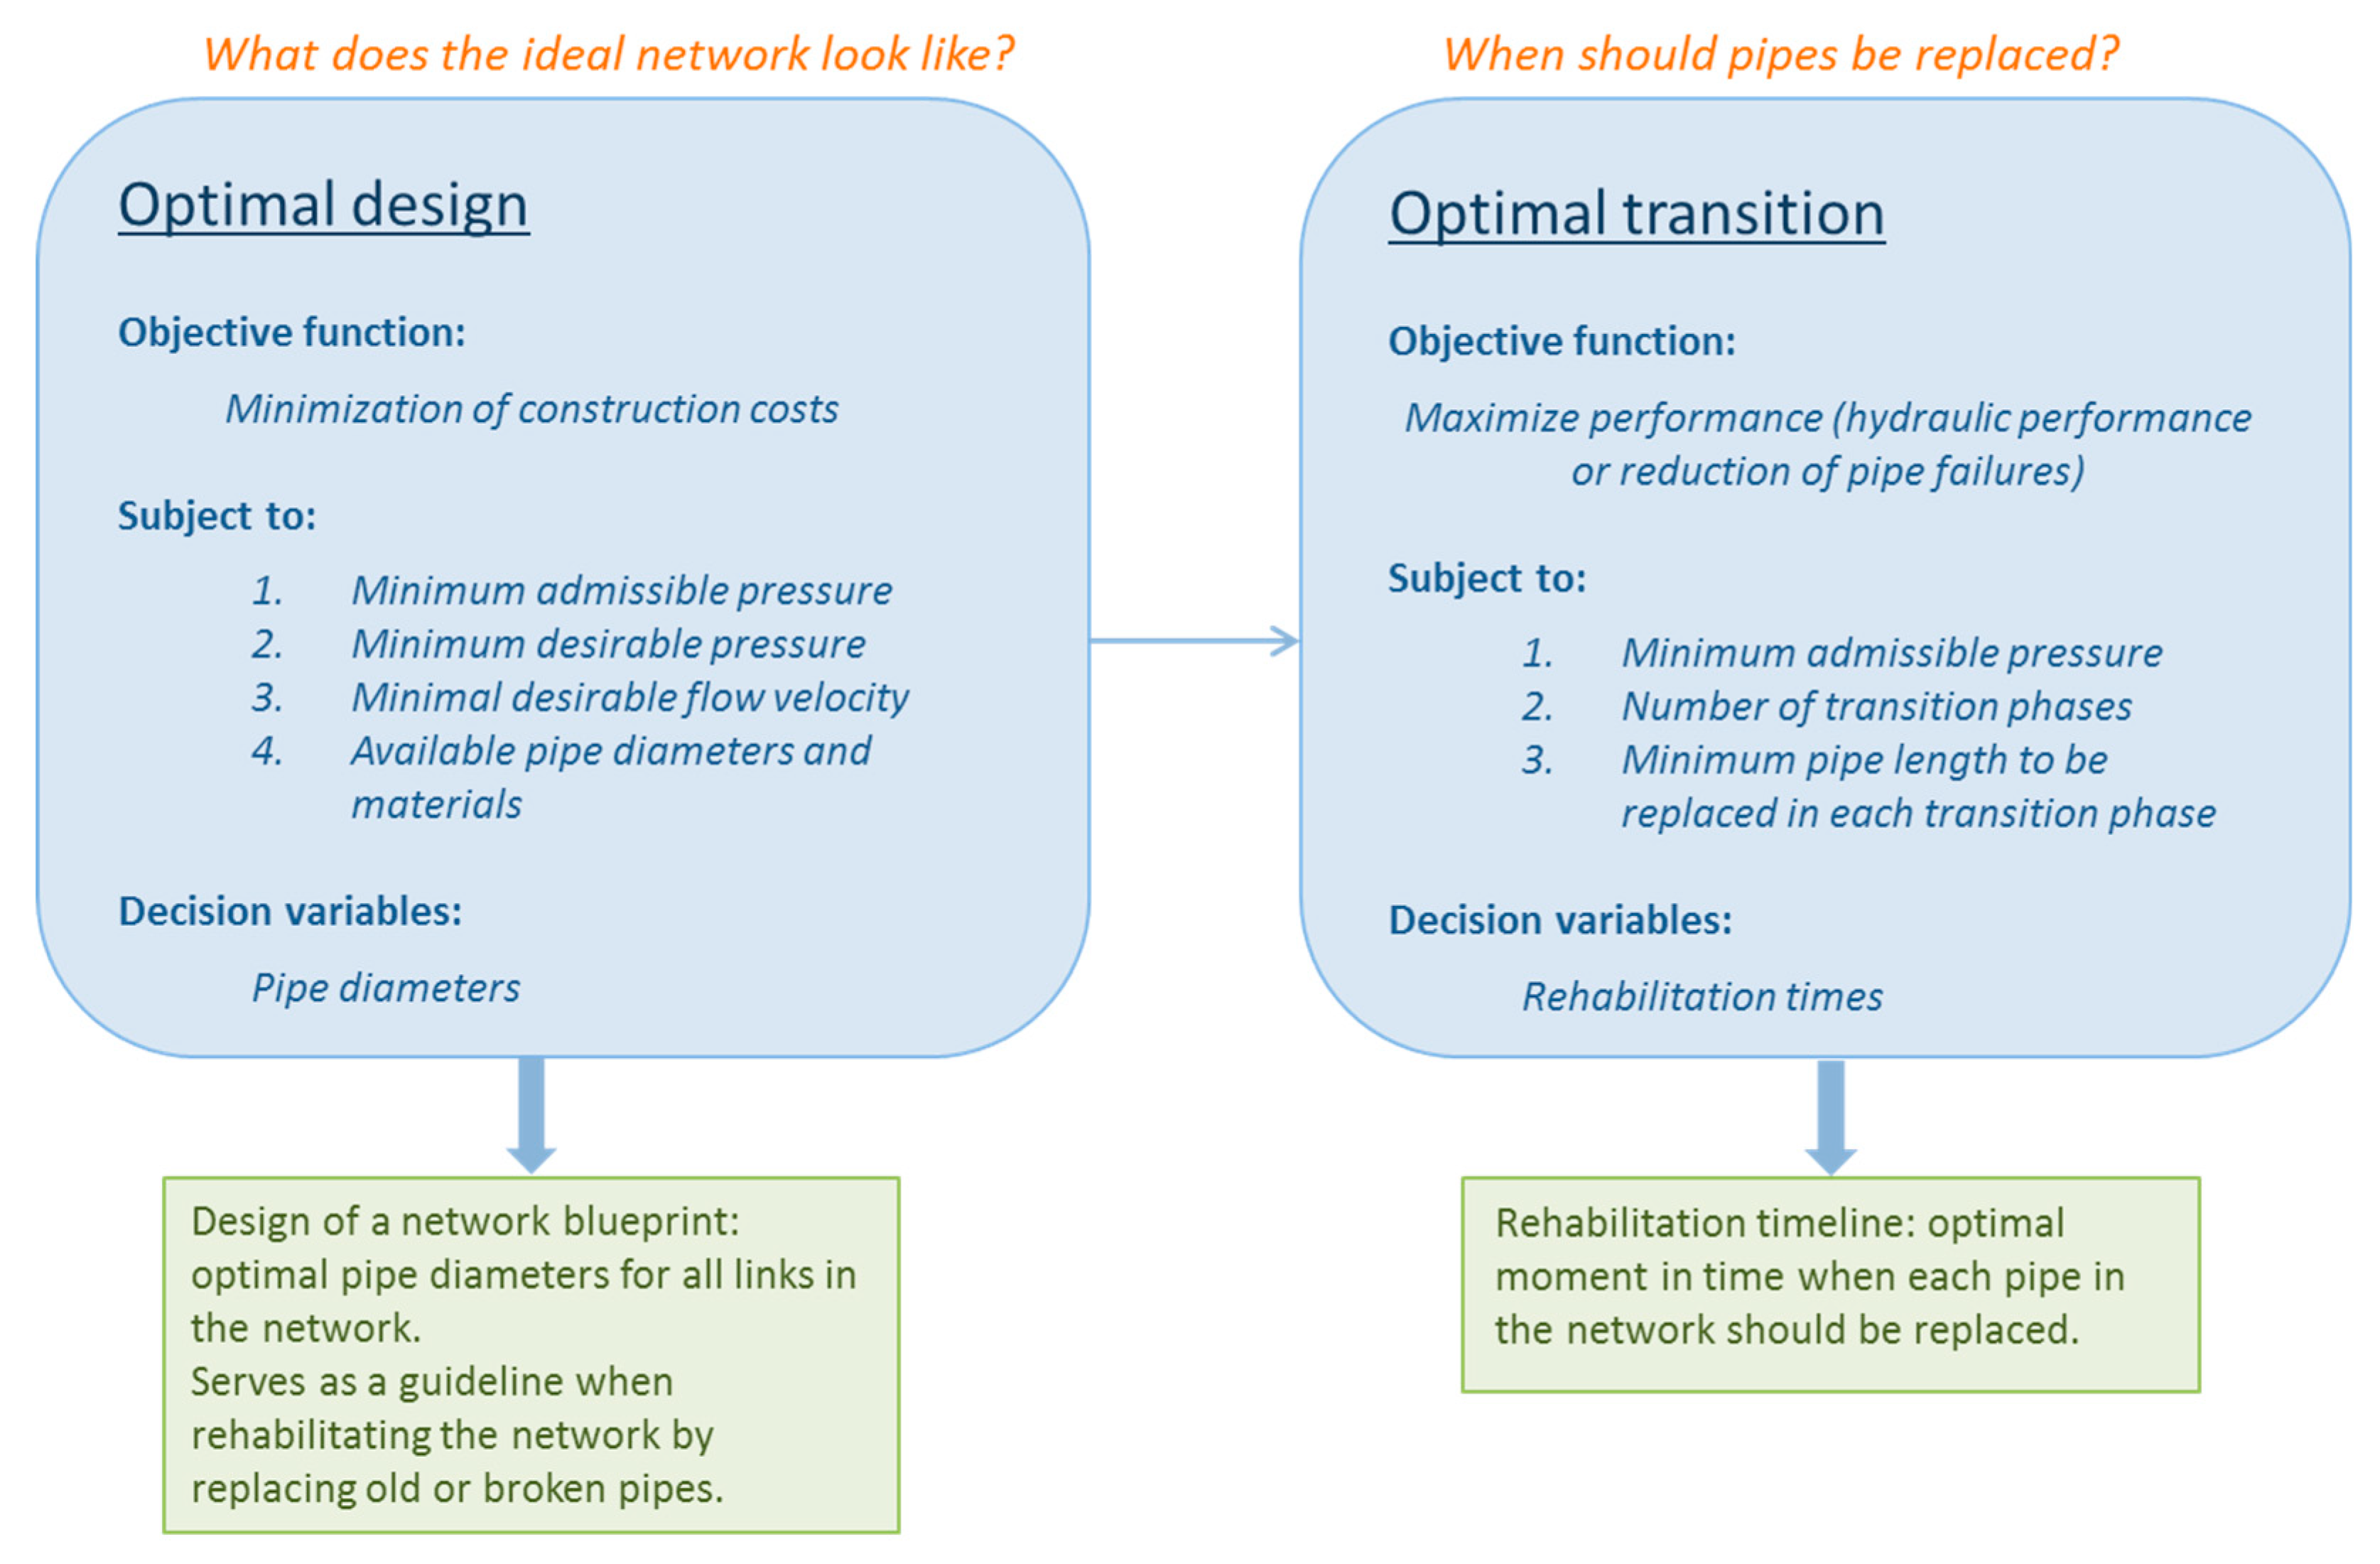
Figure 1 summarizes the developed approach for the design of and transition to network blueprints.
The developed approach consists of two steps. The first step tackles the design of the network blueprint, through the following question: what are the pipe diameters that minimize the construction cost of the network while also guaranteeing an adequate network performance? To answer this question an optimization problem was formulated, with the following objective function:
where are the number of pipes in the network, is the length of pipe , is the cost for pipe as a function of its diameter , is a penalty coefficient applied when the desired pressure is not met at a node, are the number of nodes in the network, and is the difference between the minimum desired pressure, , and the minimum simulated pressure at node , , summed over the entire simulation period. This function reflects the objective of the water company: minimize costs and avoid not satisfying the desired pressure. Solutions wherein the minimum desired pressure is not met are accepted but penalized according to a penalty coefficient. In this way, the optimization process encourages the satisfaction of the desired pressure.
Besides the traditional hydraulic equilibrium constraints and constraints to ensure that only commercially available diameters are used and only one diameter is assigned to each pipe, the following minimum pressure constraints are considered:
where is the minimum simulated pressure at each node of the network, and is the minimum admissible pressure at nodes. This is the pressure that has to be met at all times. Solutions that do not meet the admissible pressure are discarded. The decision variables of this problem are the pipe diameters for all pipes in the network.
The second step tackles the transition from the currently existing infrastructure to the optimized design for the network blueprint. Dutch water companies replace old pipes in their networks to proactively reduce the risk of failures and improve network performance. The question herein is: when in time should each pipe be replaced to maximize the reduction of pipe failures in the transition period or to maximize hydraulic performance? To answer this question two multi-objective optimization problems were formulated: transition problem one (TP1) and transition problem two (TP2). The objective functions for TP1 are:
where , and are the pipe failure rates (failures per year and km pipe length) respectively for the old and new pipes, is the transition phase (year), is the total number of years considered in the transition, and is the number of construction sites in each transition phase. The pipe failure rates for each pipe are a function of the pipe diameter, material and age. Since old existing pipes (often iron or cement), with higher failure rates, will be replaced by new (often PVC or PE) pipes, with lower failure rates, . Equation (3) aims at reducing the pipe failure rate as effectively as possible over the transition period, replacing pipes with higher failure rates first. A construction site is constituted by a cluster of pipes that are replaced in the same transition phase and that are directly connected to each other. In Equation (4) the mean number of construction sites (over all transition phases) is multiplied by the maximum number of construction sites (between all transition phases) to avoid concentrating the number of construction sites in only one transition phase. By minimizing the measure for the number of construction sites, the optimizer favors solutions with a few larger pipe clusters over solutions with many small clusters, which means that water companies can work on fewer locations and replace pipes more effectively.
The hydraulic performance of the network in TP2 is translated into the following objective function:
The TP2 also considers Equation (4) as an objective function.
Besides the traditional hydraulic equilibrium constraints, and the minimum pressure constraints given by Equation (2), evaluated at each transition phase, both TP1 and TP2 consider the following constraints:
where is the minimum pipe length to be replaced (by the new pipes) in each transition phase.
2.2. Case Study
The proposed approach is applied to water distribution network of Helmond-Mierlo, belonging to the water company Brabant Water, in the Netherlands. The network supplies water to approx. 105 thousand inhabitants, and it is represented by a network model consisting of 14,775 nodes, 11,975 pipes, 5 reservoirs and 3877 valves. The costs for rebuilding entirely the currently existing network would be 41.1 M€. At the peak demand conditions (day with maximum demand of the last 10 years), the desired pressure (30 m) is not met at several nodes of the network. For the design of the network blueprint the available diameters and materials summarized in Table 1 were considered. The costs were assumed to be 1 euro per mm diameter and m length.
For the transition from the current infrastructure to the blueprint the pipe failure rates summarized in Table 2 were considered. The pipe failure rates are a function of the pipe diameter and material and were assumed to be constant over the transition period (in reality the failure rate is a function of time). A more accurate estimation of the failure frequencies should also consider pipe age. It was however not possible to integrate information on the age of pipes since it was not available at the time the case-study was developed. This means that in this case it is possible for the failure rate of the old pipe to be equal to the failure rate of the new pipe, if an old pipe is replaced by a new pipe within the same diameter class and material, or even smaller, if an old pipe is replaced by a new pipe whose diameter falls in a smaller diameter class. Since it doesn’t make much sense for this to happen, it highlights the importance of considering pipe age when estimating pipe failure rates.
3. Results
3.1. Design of the Network Blueprint
The optimization problem for the design of the network blueprint for Helmond-Mierlo was solved in Gondwana. A total of 400,000 function evaluations were performed to find a solution to the problem. The considered penalty coefficient for not meeting the desired pressure at nodes is 1000. Table 3 summarizes the obtained results. With 11,975 pipes and 32 possible diameters for the new pipes the solution space of this problem is very large. By starting the optimization at the currently existing diameters and with a modified genetic algorithm it is possible to explore this solution space effectively. For more information on the modified genetic algorithm the reader is referred to [7].
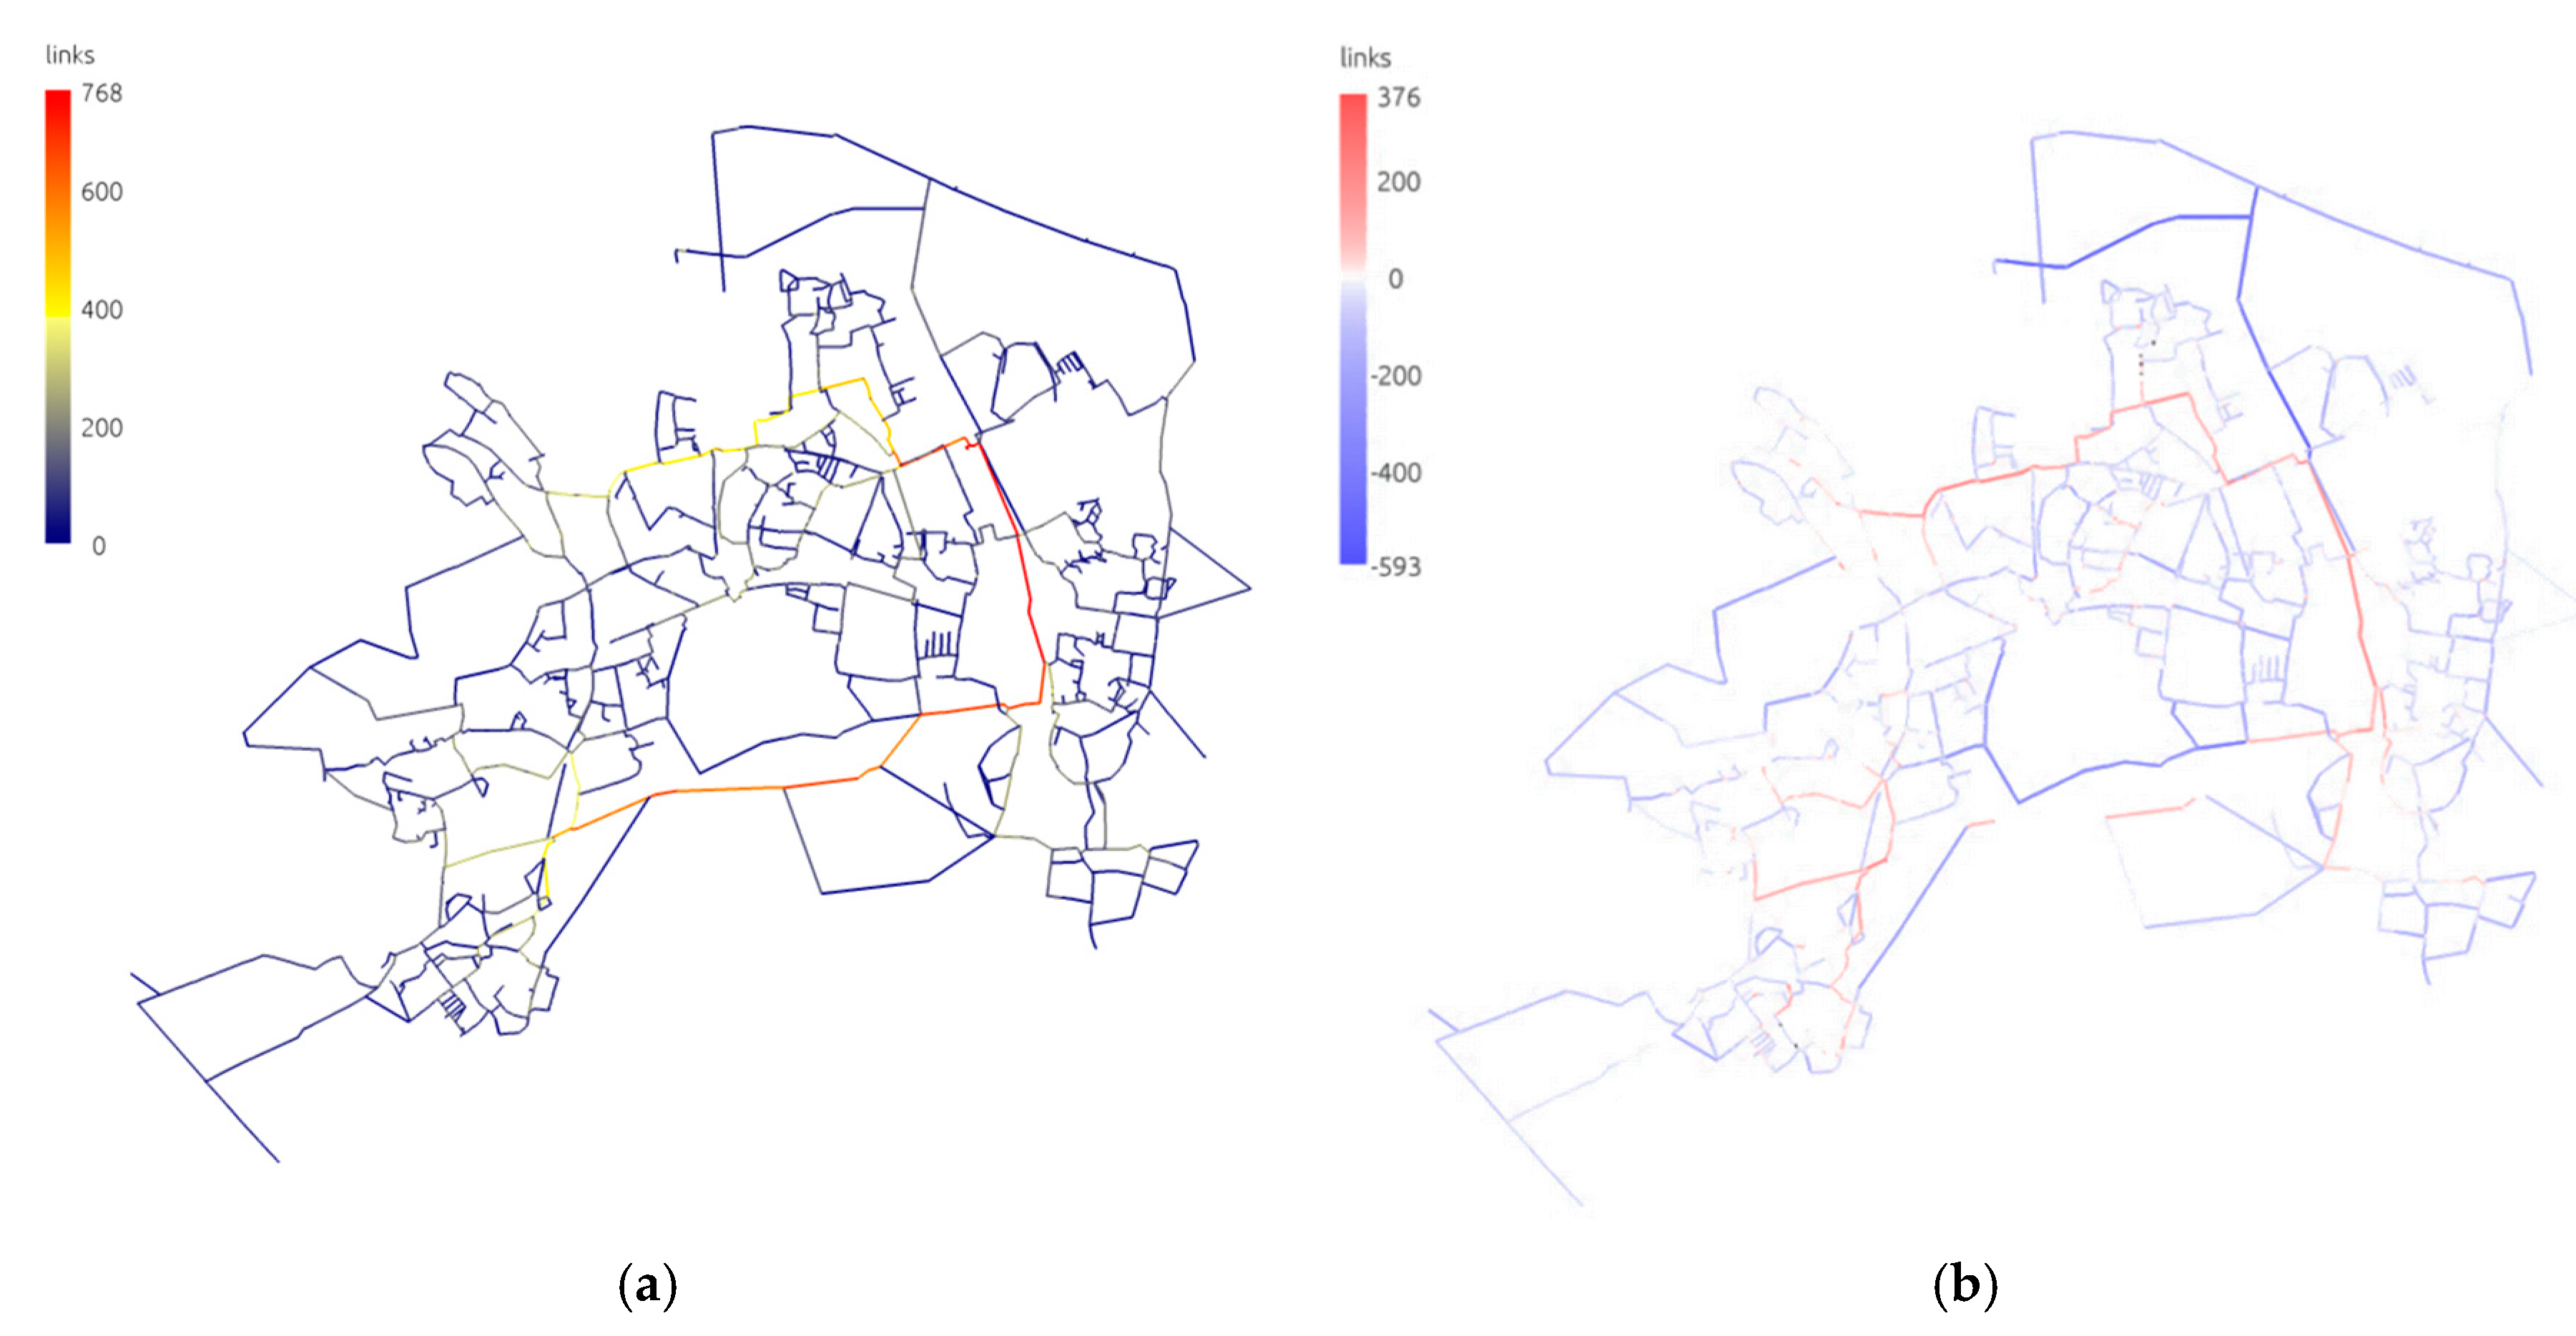
Figure 2 illustrates the obtained diameters for the network blueprint. As can be seen the diameters for the majority of the pipes are decreased in the network blueprint, while a main structure is identified where pipe diameters are increased. The costs of the network blueprint are significantly lower than the original network. At the same time, these changes significantly improve the hydraulic performance of the network in terms of meeting the desirable pressure at all nodes. Figure 3 illustrates the maximum pressure violation computed in the simulation period.
3.2. Transition from the Current Infrastructure to the Blueprint
3.2.1. Trade-Off between the Number of Construction Sites and the Reduction of Pipe Failures
The optimization problem TP1 for the transition from the current network to the network blueprint was solved in Gondwana. A transition period of 30 years and a minimum of 4.5 km pipe length to be replaced each year were considered. A total of 100,000 function evaluations were performed to find a solution to the problem. Based on the assumptions made a total of 115 pipe failures could be avoided if the existing network would be replaced at once by the blueprint. Replacing an entire network at once is obviously not realistic. With a gradual replacement of the pipes it is possible to prevent between 51 (blue circle in Figure 4) and 59 pipe failures (green circle in Figure 4). The reduction of the pipe failure rate lies mostly in the change of used materials. If pipe age would also be considered the reduction of the pipe failure rate would be more significant.
3.2.2. Trade-Off between the Number of Construction Sites and the Hydraulic Performance
The optimization problem TP2 for the transition from the current network to the network blueprint was solved in Gondwana. A transition period of 10 years and a minimum of 4.5 km pipe length to be replaced each year were considered. A total of 45,000 function evaluations were performed to find a solution to the problem. The considered penalty coefficient for not meeting the desired pressure at nodes is 1. An hydraulic simulation of the network is performed for each year, after pipes are replaced. Summed over 10 years, and based on the made assumptions, the total penalties would be 3200 if the existing network would be replaced at once by the blueprint. Maintaining the current network would lead to a total 98,000 penalty points in 10 years. With a gradual replacement of the pipes over 10 years the penalties for not meeting the minimum desirable pressure are between 8490 (green circle in Figure 6) and 40,000 (blue circle in Figure 6).
This requires working between, respectively, a maximum of 26 (green circle) and 18 (blue circle) construction sites each year of the transition period. Figure 7 illustrates the transition phase wherein each pipe is replaced for the solutions identified with a blue and a green circle on the Pareto front in Figure 6.
4. Discussion and Conclusion
The use of numerical optimization methods, as implemented in Gondwana, for the design of real-life network blueprints and the transition from the current infrastructure to the blueprint are challenging tasks. On the one hand company-specific objectives and constraints need to be translated into optimization problems. Often objectives, constraints and penalty coefficients are not explicitly defined by water companies. Within this study, the assessment of preliminary results of the optimization process together with the water company was proven to be helpful in fine-tuning the optimization problem, by for instance, changing penalty coefficients and considering hydraulic performance as an objective in the transition problem. On the other hand, the size of real-life networks leads to huge solution spaces and long computation times. Adequately searching the solution space and simulating hydraulic performance over several transition phases is a considerable challenge for solving these problems with numerical optimization methods. The results presented in this paper considered only a limited number of function evaluations, and are not yet the optimal solutions. However, they are an improvement with regard to the computation of one feasible solution obtained “by hand” as currently done in practice. Moreover, the achievement of Pareto fronts between objective for the transition to a network blueprint allows managers of water companies to investigate trade-offs between criteria and make more informed decisions. Solving these problems with Gondwana also makes it easier to compute updated design solutions when new information becomes available, or to investigate the effect of various future scenarios (for instance changing water demand).
Future developments of this work will consider uncertainty in future water demands, assessment of reliability of supply under section failure, optimization of network configurations besides pipe diameters, pipe age and failure prediction, and how the proposed approach for the optimal transition to a network blueprint can be combined with the asset management decision support tools used by water companies.
Author Contributions
I.V. developed the approach, executed the case-study for the design of the network blueprint and wrote the paper; P.v.T. and K.v.L. implemented new functionality in Gondwana; K.v.L. executed the case-study for the transition to the network blueprint; C.A.-V. prepared the EPANET network model; T.H. and R.D. provided data and validated the results.
Funding
This research was funded by BTO project number 400554/159.
Acknowledgments
This research was funded by BTO project number 400554/159.
Conflicts of Interest
The authors declare no conflict of interest.
References
- Van Thienen, P.; Vertommen, I. Gondwana: A Generic Optimization Tool for Drinking Water Distribution Systems Design and Operation. Procedia Eng. 2015, 119, 1212–1220. [Google Scholar] [CrossRef]
- Rossman, L.A. EPANET 2 Users Manual; U.S. Environtmental Protection Agency: Cincinnati, OH, USA, 2000. [Google Scholar]
- Garrett, A.L. Inspyred 1.0 Documentation. Available online: https://pythonhosted.org/inspyred/overview.html (accessed on 5 January 2015).
- Vertommen, I.; van Thienen, P.; Klein Arfman, M. Optimization of network blueprints: Application of Gondwana to a real-life network. In Proceedings of the Leading Edge Sustainable Asset Management of Water and Wastewater Infrastructure Conference (LESAM) 2017, Trondheim, Norway, 20–22 June 2017. [Google Scholar]
- Van Laarhoven, K.; Vertommen, I.; van Thienen, P.; de Kater, H.; Schaap, P.G.; Gardien, D.; van den Boom, M.; de Groot, R. Optimal design of virtual DMA’s with Gondwana. In Proceedings of the Leading Edge Sustainable Asset Management of Water and Wastewater Infrastructure Conference (LESAM) 2017, Trondheim, Norway, 20–22 June 2017. [Google Scholar]
- KWR Watercycle Research Institute. USTORE Database. Available online: https://www.kwrwater.nl/en/tools-producten/ustore/ (accessed on 30 May 2017).
- Van Thienen, P.; Vertommen, I.; van Laarhoven, K. Practical application of optimization techniques to drinking water distribution problems. In Proceedings of the 13th International Conference on Hydroinformatics (HIC) 2018, Palermo, Italy, 1–6 July 2018. [Google Scholar]
Figure 1.
Schematic representation of the proposed approach for the design of and transition to network blueprints.
Figure 1.
Schematic representation of the proposed approach for the design of and transition to network blueprints.

Figure 2.
(a) Pipe diameters for the optimized network blueprint of Helmond-Mierlo. The color scale indicates the diameter values in mm. (b) Difference in pipe diameters between the current infrastructure and the network blueprint. The color scale indicates a decrease in diameters (blue) or increase (red). The darker the color, the larger the difference.

Figure 3.
Maximum pressure violation in the simulation period for (a) the currently existing infrastructure and (b) the network blueprint.
Figure 3.
Maximum pressure violation in the simulation period for (a) the currently existing infrastructure and (b) the network blueprint.

Figure 4.
Obtained Pareto front: trade-off between the maximum number of construction sites and the reduction of pipe failures (red). The grey dots represent previous solutions obtained during the optimization process.
Figure 4.
Obtained Pareto front: trade-off between the maximum number of construction sites and the reduction of pipe failures (red). The grey dots represent previous solutions obtained during the optimization process.

Figure 5.
Transition phase wherein each pipe of the network should be replaced for (a) the solution identified with a blue circle on the Pareto front (Figure 4) and (b) the solution identified with a green circle on the Pareto front (Figure 4).

Figure 6.
Obtained Pareto front: trade-off between the maximum number of construction sites and the penalties for the violation of the minimum desirable pressure (red). The grey dots represent previous solutions obtained during the optimization process.
Figure 6.
Obtained Pareto front: trade-off between the maximum number of construction sites and the penalties for the violation of the minimum desirable pressure (red). The grey dots represent previous solutions obtained during the optimization process.

Figure 7.
Transition phase wherein each pipe of the network should be replaced for (a) the solution identified with a blue circle on the Pareto front (Figure 6) and (b) the solution identified with a green circle on the Pareto front (Figure 6).


Table 1.
Available internal pipe diameters (mm) and materials.
| Diameter | Material | Diameter | Material | Diameter | Material | Diameter | Material |
|---|---|---|---|---|---|---|---|
| 13.2 | PVC | 66 | PE | 190.2 | PVC | 376.6 | PVC |
| 16.8 | PVC | 72.8 | PVC | 204.4 | PE | 409 | PE |
| 21.2 | PVC | 87.3 | PVC | 237.6 | PVC | 458 | PE |
| 27.2 | PVC | 100.6 | PVC | 257.6 | PE | 470.8 | PVC |
| 36.0 | PVC | 104.6 | PVC | 290 | PVC | 515 | PE |
| 48.0 | PVC | 130.8 | PE | 299.6 | PVC | 593.3 | PVC |
| 55 | PE | 152.0 | PVC | 327 | PE | 672.2 | Steel |
| 59 | PVC | 163.6 | PE | 368 | PE | 767.8 | Steel |
Table 2.
Pipe failure rates (FR: number of failures/(km·year)) based on pipe diameter and material (asbestos cement [AC], grey cast iron [GG], nodular cast iron [NG]) [6].
Table 2.
Pipe failure rates (FR: number of failures/(km·year)) based on pipe diameter and material (asbestos cement [AC], grey cast iron [GG], nodular cast iron [NG]) [6].
| Diameter | Material | FR | Diameter | Material | FR | Diameter | Material | FR |
|---|---|---|---|---|---|---|---|---|
| [40, 100] | AC | 0.0886 | [320, 600] | GG | 0.0176 | [100, 170] | PE | 0.0252 |
| [100, 170] | AC | 0.0726 | [600, 1500] | GG | 0.0205 | [170, 320] | PE | 0.0195 |
| [170, 320] | AC | 0.0601 | [40, 100] | NG | 0.0291 | [320, 600] | PE | 0.0079 |
| [320, 600] | AC | 0.0062 | [100, 170] | NG | 0.0102 | [40, 100] | PVC | 0.0164 |
| [600, 1500] | AC | 0.0017 | [170, 320] | NG | 0.0137 | [100, 170] | PVC | 0.0309 |
| [40, 100] | GG | 0.1068 | [320, 600] | NG | 0.0049 | [320, 600] | PVC | 0.0228 |
| [100, 170] | GG | 0.0605 | [600, 1500] | NG | 0.0015 | [600, 1500] | PVC | 0.0057 |
| [170, 320] | GG | 0.0361 | [40, 100] | PE | 0.0107 |
Table 3.
Obtained results for the current design and the optimized blueprint.
| Current Design | Optimized Blueprint | |
|---|---|---|
| Objective function | 5.09 × 10⁷ | 2.67 × 10⁷ |
| Penalties | 9.8 × 10⁶ | 3.2 × 10⁵ |
| Costs (M€) | 41.1 | 26.4 |
Publisher’s Note: MDPI stays neutral with regard to jurisdictional claims in published maps and institutional affiliations. |
© 2018 by the authors. Licensee MDPI, Basel, Switzerland. This article is an open access article distributed under the terms and conditions of the Creative Commons Attribution (CC BY) license (https://creativecommons.org/licenses/by/4.0/).
Share and Cite
MDPI and ACS Style
Vertommen, I.; Laarhoven, K.v.; Thienen, P.v.; Agudelo-Vera, C.; Haaijer, T.; Diemel, R. Optimal Design of and Transition towards Water Distribution Network Blueprints. Proceedings 2018, 2, 584. https://doi.org/10.3390/proceedings2110584
AMA Style
Vertommen I, Laarhoven Kv, Thienen Pv, Agudelo-Vera C, Haaijer T, Diemel R. Optimal Design of and Transition towards Water Distribution Network Blueprints. Proceedings. 2018; 2(11):584. https://doi.org/10.3390/proceedings2110584
Chicago/Turabian StyleVertommen, Ina, Karel van Laarhoven, Peter van Thienen, Claudia Agudelo-Vera, Tjakko Haaijer, and Roel Diemel. 2018. "Optimal Design of and Transition towards Water Distribution Network Blueprints" Proceedings 2, no. 11: 584. https://doi.org/10.3390/proceedings2110584