River Color Monitoring Using Optical Satellite Data †


Independent Scientist, Via Michelangelo Tamburini 8, 00154 Roma, Italy
†
Presented at the 1st International Electronic Conference on Geosciences (IECG 2018), 15–30 June 2018.
Proceedings 2018, 2(10), 569; https://doi.org/10.3390/IECG_2018-05336
Published: 13 June 2018
(This article belongs to the Proceedings of IECG 2018)
Abstract
:Knowledge of inland water quality and riverine inputs to oceans is fundamental for water management, environmental monitoring, and the definition of policies and planning strategies related to the sustainable use of rivers. While European Union directives aim at the conservation of inland water resources, the ground operational monitoring network is often inadequate. River monitoring using Remote Sensing may complement in-situ measurements, supplying continuous, spatially explicit representation of parameters related to water quality and solid transport, even if the high-frequency dynamics of water parameters may not be caught due to limited satellite revisit time. Sentinel-2 and Landsat-8 satellites, equipped with MSI and OLI optical sensors whose spectral bands perform a more accurate atmospheric correction, allow for the development of methodologies for monitoring river color from space, thanks to high spatial resolution and short revisit times. This study presents a processing chain, developed to monitor water constituents in rivers using high-resolution satellite images. Multi-temporal analysis of chlorophyll-a (Chl-a) and total suspended matter (TSM) bio-geophysical variables was performed for the case study of the Po River (Italy) for the year 2017. Quantitative estimations of water constituents were retrieved from Sentinel-2 optical multispectral satellite data using the C2RCC algorithm, and the main outcomes are discussed. The developed processing chain can be used to create operational services for river monitoring, and represent a major improvement in the identification of spatio-temporal dynamics (like solid transport) in riverine systems.
1. Introduction
With the EU Water Framework Directive and Marine Strategy Framework Directive, the European Union (EU) establishes that member states monitor the environmental status of their inland and coastal waters. An operational monitoring of water constituents in river channels and river plumes is required, in order to provide quantitative measurements of biogeochemical cycles, explain long-term morphodynamic trends related to sediment transport, and to evaluate the related ecosystem services.
Fluxes of water constituents at river channels, confluences, and mouths are spatially and temporally highly variable, with periods of high flooding events corresponding to high sediment supply, alternated with periods of low discharge. Variations in discharge rates, solid transport, and nutrient pathways are often only roughly estimated, due to the lack of available in-situ measurements. When available, field measurements are expensive, and specific to a time or geographical location; as a result, they are not fully representative of the spatial and temporal dynamics of water constituents in river systems [1].
Monitoring the temporal dynamics of sediment transport in river channels allows one to characterize processes like the modification of river morphology due to erosion and sedimentation, river bed sediment washout, and mudflat and sandbar moves. Channel length and width, braiding and sinuosity indexes, and channel lateral shifting are proved to be the most effective morphometric parameters for a quantitative analysis of river changes [2].
Remote sensing may complement in-situ measurements and morphometric indices analysis in river monitoring by supplying a continuous, spatially explicit representation of parameters related to water quality and solid transport, even if the high-frequency dynamics of water parameters cannot be caught due to limited satellite revisit time. Satellite multispectral and hyperspectral optical sensors can be used to retrieve inherent optical properties (IOPs) of river waters, representing parameters that depend only on the dissolved and suspended substances in water. The existing relationship between the spectral response and the absorption and backscattering of water constituents at different concentrations allows for the calibration of algorithms for the accurate estimation of bio-geophysical variables, like chlorophyll-a (Chl) and total suspended matter (TSM), using in-situ measurements.
Satellite optical multispectral data have been already analyzed in conjunction with automated in-situ turbidity measurements, in order to evaluate the accuracy of the TSM algorithms and to systematically monitor changes in TSM distribution [3] at different spatial resolutions [4].
Proper atmospheric correction procedure plays a key role in the accurate estimation of IOPs, especially for very turbid waters. Sentinel-2 and Landsat-8 satellites, equipped with MultiSpectral Instrument (MSI) and Operational Land Imager (OLI) optical sensors—whose spectral bands perform a more accurate atmospheric correction—allow for the development of methodologies for monitoring river color from space, thanks to high spatial resolution and a short revisit time.
More recently, SWIR bands have been used to extend the existing turbid water atmospheric correction of the ACOLITE algorithm to extremely turbid waters. Atmospheric correction based on SWIR bands has been demonstrated to retrieve more accurate water-leaving reflectances over extremely turbid waters, and improve the algorithm for detecting black suspended sediments from dredging and dumping operations [5]. The ACOLITE algorithm, initially developed to perform atmospheric correction over water from Landsat-8 OLI optical multispectral data, and to estimate water constituents from water-leaving reflectances, has been extended for the use of Sentinel-2 MSI data.
The C2RCC algorithm [6], developed to estimate water constituents from optical multispectral data acquired by many different satellite sensors, relies on a large database (derived from in-situ measurements) of radiative transfer simulations inverted by neural networks. C2RCC has been validated for different sensors, with good results for optically complex waters, and additional neural nets have been trained for extreme IOP ranges [6].
Time series analysis of TSM retrievals can be used to characterize the TSM dynamics, and thus solid transport, as demonstrated by a recent study conducted across a wide range of Australian lakes [7]. The use of a multi-temporal series of TSM estimates to compute discharge-based indicators in rivers, like the turbidity maximum zone that can migrate upstream in large rivers under strong tidal forcing, may provide a powerful tool to assess future scenarios of morphodynamic trends under climate change conditions [8].
The objectives of this study are to (i) present a processing chain developed to monitor water constituents in rivers, using high-resolution satellite images; and (ii) provide an example of multi-temporal analysis of Chl-a and TSM bio-geophysical variables for the case study of the Po River (Italy) for the year 2017.
2. Materials and Methods
The study area (Figure 1) is located in Italy, and is represented by the last 400 km of the Po River, which collects the runoff of a large drainage basin (about 71,000 km2) that has a resident population of 16 million inhabitants. Po River discharge has an annual average rate of 1500 m3 s−1; the minimum flow rate of the river is 275 m3 s−1, and the largest is 11,000 m3 s−1. Anthropic influence affects river discharge, because of the filling of reservoirs from snowmelt and rainfall and during hydroelectric power generation for heating. Further, the Po River plain is characterized by extensive agriculture activities that influence groundwater and river water levels.
While recent works have estimated Po River discharge from satellite radar altimetry data [9] and Po river plume dispersion patterns from satellite optical multispectral data [10,11,12,13], analysis of the Po River’s color must still be produced. A ground operational monitoring network exists for the Po River and its tributaries, which measures the water level from many gauging stations. On the other hand, no measurements of turbidity levels or TSM and Chl-a concentrations are systematically acquired.
A processing chain has been developed in order to systematically generate maps and multi-temporal statistics of water constituents from Sentinel-2 MSI and Landsat-8 OLI. The processing chain can make use of both the C2RCC and ACOLITE algorithms [5,6] for the atmospheric correction and IOPs estimation.
An essential step in the processing chain is the definition of a water mask formula, based on different rules applied to input Top Of Atmosphere (TOA) reflectance spectral bands. A proper water mask should be adopted, in order to remove from the analysis those pixels whose spectral contamination of land or terrestrial targets can lead to incorrect estimation of bio-geophysical parameters. For this reason, the default expression for the generation of the water mask available in the C2RCC algorithm was refined, using the following formula for Sentinel-2 MSI data:
Similarly, the following formula was used to perform water masking in C2RCC with Landsat-8 OLI data:
Formulas (1) and (2) are reported as having been implemented in the SNAP processor. Later, bio-geophysical variables of interest were extracted from the resulting algorithm outputs, and an optional image sieve filter was applied in order to remove spurious pixels. Multi-temporal statistics were finally computed from the multi-temporal estimates.
3. Results and Discussion
With the increasing availability of broadband high-resolution optical multispectral satellite data, it is time to speak more broadly about the concept of “water color”, introduced by [14], extending the range of applications to inland water monitoring, with special concern to rivers.
The present work shows an application example for “river color” monitoring using satellite optical multispectral data, carried out using multi-temporal analysis of freshwater water constituents for medium to large rivers, using high revisit time and high spatial resolution optical satellite data, such as those from Sentinel-2 MSI and Landsat-8 OLI.
The spatial representation of Chl-a and the average TSM concentration computed from all the 326 available cloud-free Sentinel-2A and Sentinel-2B MSI granules acquired during the year 2017 (for a total of 166 observed days) is shown in Figure 2. The spatial variability shows how the concentration of suspended sediments is not homogeneous along the river channel, indicating that resuspension and sedimentation processes occur at different discharge regimes.
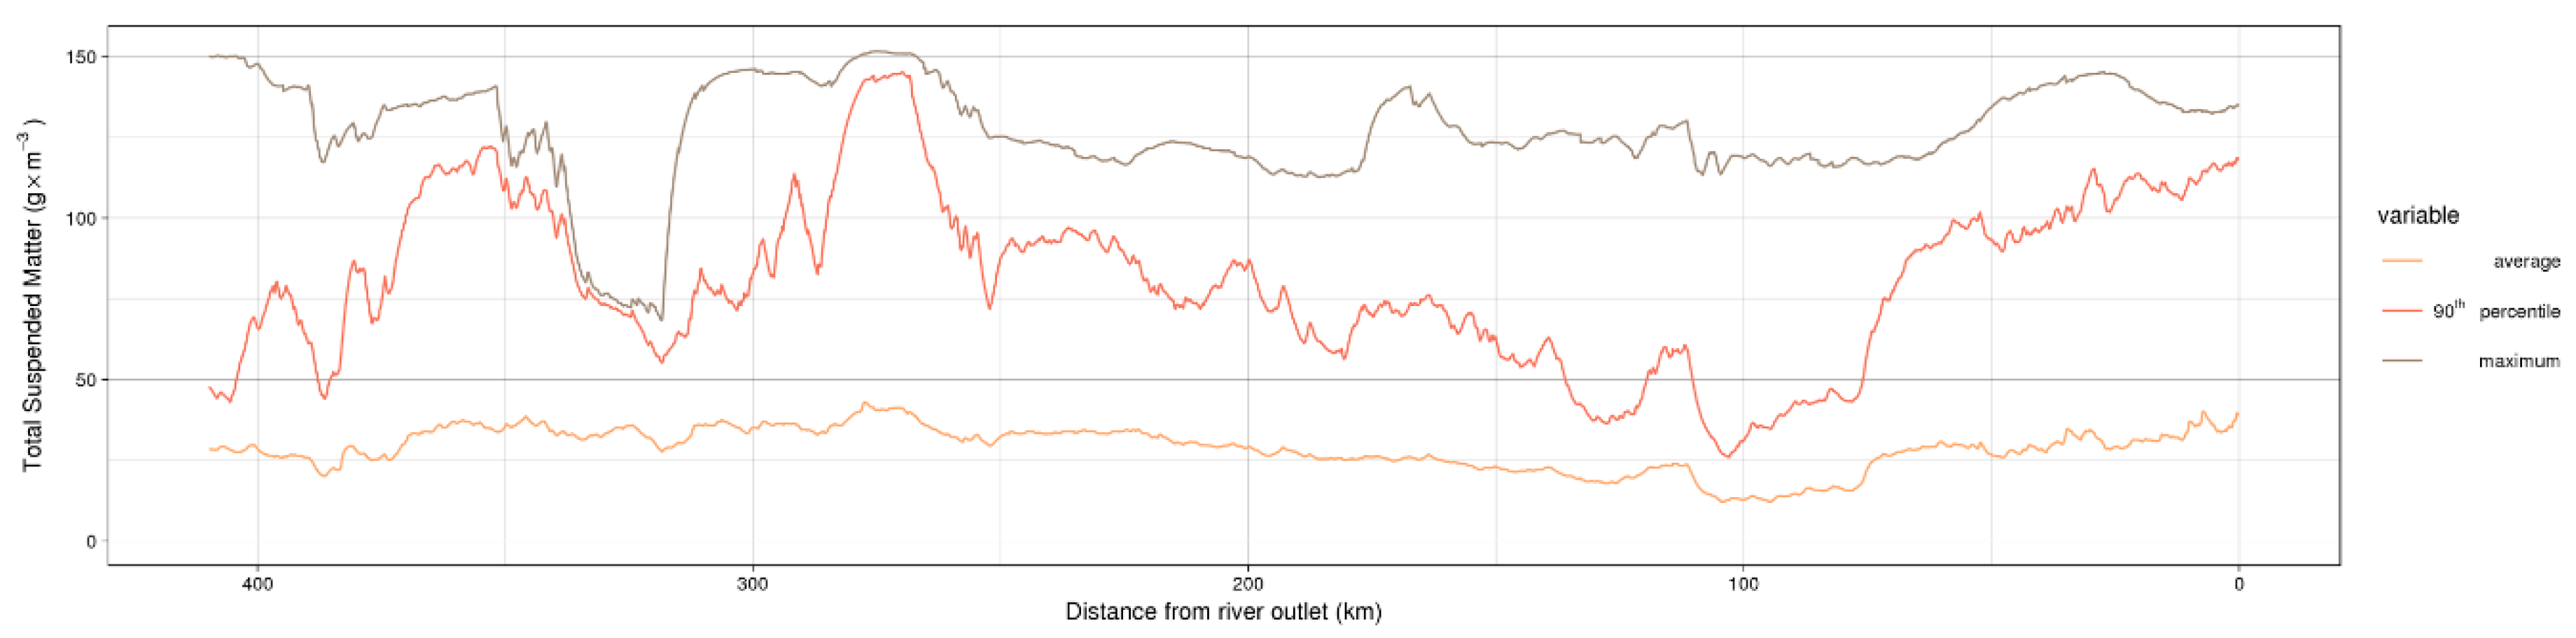
Multi-temporal statistics report Chl-a ranges between 13 and 20 mg × m−3 on average, and TSM ranges between 15 and 50 g × m−3 (Figure 3). The maximum and 90th percentile values calculated from the time series of TSM reveal a strong heterogeneity along the river channel in terms of suspended solid transport.
This evidence is partly due to the influence of high TSM concentrations in the river tributary during flood regimes joining the Po River. After mixing, the river reduced turbulent flow is not any more capable of keeping the particles in motion and transporting them, resulting in a subsequent sediment deposition on riverbed and river bars. The fingerprint of such a process is visible as a gradient of decreasing TSM concentration along the river channel (e.g., visible from Sentinel-2 acquired on 5 March 2017 and 2 January 2018 where the Po River confluences with the Trebbia and Taro rivers). From a comparison between Chl-a and TSM concentrations and Po River discharge (Figure 4), it is possible to notice a weaker correlation between physical forcing and system response after the month of June 2017.
A processing chain has been developed, in order to generate a time series analysis of TSM and Chl-a estimates in river channels. The processing chain needs a proper water mask formula to be defined prior to the analysis, in order to avoid the estimation of water constituents in pixels not representing pure water (e.g., river banks and river bars). The default water masking formulas available in the C2RCC and ACOLITE algorithms have been refined, in order to better account for the removal of impure water pixels. The pixels used for water constituent retrieval and multi-temporal series analysis should be located as far as possible from the shore, to minimize the impact of adjacency effects [7] and to avoid pixel contamination with land or terrestrial targets.
The C2RCC and ACOLITE algorithms, compared to previously developed algorithms for water constituent retrieval, offer the possibility of specific coefficient customization to be applied in the retrieval formulas, in order to better account for regional water cases. The unavailability of in-situ data for the analyzed study area made coefficient customization and assessment of estimation accuracy impossible, and stimulated the need for the establishment of a measurement network for turbidity levels and other bio-geophysical parameters of the Po River. Continuous measurement networks—for instance, the MAGEST and SYVEL in the Gironde and Loire estuaries—allow the monitoring of high-frequency dynamics of the temperature, salinity, oxygenation, and turbidity of the water, besides supplying data to calibrate regional algorithms. The insufficient in-situ data-to-imagery match-ups available for evaluating the IOPs’ retrieval accuracy from multispectral optical data acquired by recent satellites (like Landsat-8 OLI and Sentinel-2 MSI) has been already highlighted in research work [7].
It is generally acknowledged that the accuracy of satellite match-ups is affected not only by uncertainties in bio-optical algorithms, but also by errors in field measurements, spatial and temporal differences between sampling and satellite overpass, and atmospheric correction uncertainties [3].
High revisit time and high spatial resolution of Sentinel-2 MSI and Landsat-8 OLI can be seen as a virtual constellation for observing the rapidly varying aquatic systems [15], even if a proper comparison and intercalibration of algorithms is required to generate a consistent virtual constellation of bio-geophysical variables. A comparison of the results from the C2RCC and ACOLITE algorithms, done for a total of 10 acquisition dates between 2016 and 2018 in the study area, revealed a weak correlation for estimated bio-geophysical variables. Further analyses are underway, even if proper uncertainty estimation is not possible due to the unavailability of simultaneous satellite in-situ measurements. On the one hand, the Sentinel-2 MSI 10 m spatial resolution of VNIR bands allows the extension of water color observation to medium rivers and other small water bodies. On the other hand, Landsat-8 is significantly less affected by sun-glint effects, and has the advantage of higher SNR in its 30 m bands, resulting in a less noisy signal for low reflectances characterizing liquid water.
Sun-glint significantly affects Sentinel-2 MSI data at specific viewing azimuth angles, especially when approaching the summer solstice. In Figure 4, it is possible to notice a biased estimation of both Chl-a and TSM during the period from June to September 2017, probably due to the sun-glint effect on liquid water surfaces. Considering that Sentinel-2 acquisition mode adopt sub-swaths with different viewing azimuth angles, the sun-glint is also inhomogeneous in the spatial domain, and therefore the observed scene is not affected the same way.
Using Sentinel-2 MSI, it is possible to map at least one pure water pixel in a river channel with a width of 50 m, instead using Landsat-8 OLI; it is possible to map at least one pure water pixel in a river channel with a width of 75 m. The minimum river channel width required for the estimation may vary, due to the presence of river bars and riparian vegetation on the river shores, which, due to the likely presence of trees with great canopy height, can generate large shadows over the river channel, especially at high latitudes and for temporal frames characterized by large solar zenith angles. Furthermore, there is the need for defining low concentration thresholds, in order to avoid invalid concentration estimates due to the influence of the riverbed spectral response in the detected spectrum.
4. Conclusions
In this study, a processing chain has been developed in order to systematically generate water constituents for the analysis of identification of spatio-temporal dynamics, in order to facilitate the analytical procedures and stimulate the development of operational services for river monitoring. The multi-temporal analysis of the Po River for the year 2017 allowed for the characterization of the spatio-temporal dynamics of the TSM and Chl-a bio-geophysical variables. Finally, key points related to technical feasibility of river color monitoring using satellite optical multispectral data are discussed, and directions for future development are provided.
Acknowledgments
Water discharge data at Pontelagoscuro were available from the Environmental Protection Agency of Region of Emilia Romagna. Landsat-8 OLI data were available at no cost from the U.S. Geological Survey. Sentinel-2 MSI data used were available at no cost from ESA Copernicus Open Access Hub. This work contains modified Copernicus Sentinel data and Copernicus Service information (2018). The author is grateful to the many individuals working on the development of free and open-source software for supporting the sharing of knowledge.
Conflicts of Interest
The author declares no conflict of interest.
References
- Ody, A.; Doxaran, D.; Vanhellemont, Q.; Nechad, B.; Novoa, S.; Many, G.; Bourrin, F.; Verney, R.; Pairaud, I.; Gentili, B. Potential of High Spatial and Temporal Ocean Color Satellite Data to Study the Dynamics of Suspended Particles in a Micro-Tidal River Plume. Remote Sens. 2016, 8, 245. [Google Scholar] [CrossRef]
- Clerici, A.; Perego, S. 2016. A Set of GRASS GIS-Based Shell Scripts for the Calculation and Graphical Display of the Main Morphometric Parameters of a River Channel. Int. J. Geosci. 2016, 7, 135–143. [Google Scholar] [CrossRef]
- Gernez, P.; Lafon, V.; Lerouxel, A.; Curti, C.; Lubac, B.; Cerisier, S.; Barillé, L. Toward Sentinel-2 high resolution remote sensing of suspended particulate matter in very turbid waters: SPOT4 (Take5) Experiment in the Loire and Gironde Estuaries. Remote Sens. 2015, 7, 9507–9528. [Google Scholar] [CrossRef]
- Dorji, P.; Fearns, P. Impact of the spatial resolution of satellite remote sensing sensors in the quantification of total suspended sediment concentration: A case study in turbid waters of Northern Western Australia. PLoS ONE 2017, 12, e0175042. [Google Scholar] [CrossRef] [PubMed]
- Vanhellemont, Q.; Ruddik, K. Advantages of high quality SWIR bands for ocean colour processing: Examples from Landsat-8. Remote Sens. Environ. 2015, 161, 89–106. [Google Scholar] [CrossRef]
- Brockmann, C.; Doerffer, R.; Peters, M.; Kerstin, S.; Embacher, S.; Ruescas, A. Evolution of the C2RCC neural network for Sentinel 2 and 3 for the retrieval of ocean colour products in normal and extreme optically complex waters. In Proceedings of the “ESA Living Planet Symposium 2016”, Prague, Czech Republic, 9–13 May 2016. [Google Scholar]
- Lymburner, L.; Botha, E.; Hestir, E.; Anstee, J.; Sagar, S.; Dekker, A.; Malthus, T. Landsat 8: Providing continuity and increased precision for measuring multi-decadal time series of total suspended matter. Remote Sens. Environ. 2016, 185, 108–118. [Google Scholar] [CrossRef]
- Jalón-Rojas, I.; Schmidt, S.; Sottolichio, A.; Bertier, C. Tracking the turbidity maximum zone in the Loire Estuary (France) based on a long-term, high-resolution and high-frequency monitoring network. Cont. Shelf Res. 2016, 117, 1–11. [Google Scholar] [CrossRef]
- Tarpanelli, A.; Brocca, L.; Barbetta, S.; Faruolo, M.; Lacava, T.; Moramarco, T. Coupling MODIS and radar altimetry data for discharge estimation in poorly gauged river basins. IEEE J. Sel. Top. Appl. Earth Obs. Remote Sens. 2015, 8, 141–148. [Google Scholar] [CrossRef]
- Filipponi, F.; Taramelli, A.; Zucca, F.; Valentini, E.; El Serafy, G.Y. Ten years sediment dynamics in northern Adriatic Sea investigated through optical Remote Sensing observations. In Proceedings of the International Geoscience and Remote Sensing Symposium (IGARSS), Milan, Italy, 26–31 July 2015; pp. 2265–2268. [Google Scholar]
- Brando, V.E.; Braga, F.; Zaggia, L.; Giardino, C.; Bresciani, M.; Matta, E.; Bellafiore, D.; Ferrarin, C.; Maicu, F.; Benetazzo, A.; et al. High-resolution satellite turbidity and sea surface temperature observations of river plume interactions during a significant flood event. Ocean Sci. 2015, 11, 909. [Google Scholar] [CrossRef]
- Braga, F.; Zaggia, L.; Bellafiore, D.; Bresciani, M.; Giardino, C.; Lorenzetti, G.; Maicu, F.; Manzo, C.; Riminucci, F.; Ravaioli, M.; et al. Mapping turbidity patterns in the Po river prodelta using multi-temporal Landsat 8 imagery. Estuarine, Coast. Shelf Sci. 2017, 198, 555–567. [Google Scholar] [CrossRef]
- Manzo, C.; Braga, F.; Zaggia, L.; Brando, V.E.; Giardino, C.; Bresciani, M.; Bassani, C. Spatio-temporal analysis of prodelta dynamics by means of new satellite generation: The case of Po river by Landsat-8 data. Int. J. Appl. Earth Obs. Geoinf. 2018, 66, 210–225. [Google Scholar] [CrossRef]
- Ruddick, K.; Vanhellemont, Q.; Dogliotti, A.; Nechad, B.; Pringle, N.; Van der Zande, D. New opportunities and challenges for high resolution remote sensing of water colour. In Proceedings of the Ocean Optics XXIII, Victoria, BC, Canada, 23–28 October 2016; pp. 23–28. [Google Scholar]
- Vanhellemont, Q.; Ruddick, K. ACOLITE for Sentinel-2: Aquatic applications of MSI imagery. In Proceedings of the “ESA Living Planet Symposium 2016”, Prague, Czech Republic, 9–13 May 2016. [Google Scholar]
Figure 1.
Location of the study area, shown with the extent of Sentinel-2 MSI granules and Landsat-8 OLI tiles used for the analysis. Location of the gauging station, which measured the discharge data used for the analysis, is represented by a red dot.
Figure 1.
Location of the study area, shown with the extent of Sentinel-2 MSI granules and Landsat-8 OLI tiles used for the analysis. Location of the gauging station, which measured the discharge data used for the analysis, is represented by a red dot.

Figure 2.
(a) Spatial representation of the average Chl-a concentration, computed from all the available cloud-free Sentinel-2A and Sentinel-2B MSI data acquired during the year 2017; (b) spatial representation of the average TSM concentration, computed from all the available cloud-free Sentinel-2A and Sentinel-2B MSI data acquired during the year 2017.

Figure 3.
Spatial profile along the last 400 km of the Po River, showing multi-temporal statistics of the TSM concentration computed from all the available cloud-free Sentinel-2A and Sentinel-2B MSI data acquired during the year 2017.
Figure 3.
Spatial profile along the last 400 km of the Po River, showing multi-temporal statistics of the TSM concentration computed from all the available cloud-free Sentinel-2A and Sentinel-2B MSI data acquired during the year 2017.

Figure 4.
Comparison of Po River discharge and estimated Chl-a and TSM concentrations throughout the year 2017.
Figure 4.
Comparison of Po River discharge and estimated Chl-a and TSM concentrations throughout the year 2017.

Publisher’s Note: MDPI stays neutral with regard to jurisdictional claims in published maps and institutional affiliations. |
© 2018 by the author. Licensee MDPI, Basel, Switzerland. This article is an open access article distributed under the terms and conditions of the Creative Commons Attribution (CC BY) license (https://creativecommons.org/licenses/by/4.0/).
Share and Cite
MDPI and ACS Style
Filipponi, F. River Color Monitoring Using Optical Satellite Data. Proceedings 2018, 2, 569. https://doi.org/10.3390/IECG_2018-05336
AMA Style
Filipponi F. River Color Monitoring Using Optical Satellite Data. Proceedings. 2018; 2(10):569. https://doi.org/10.3390/IECG_2018-05336
Chicago/Turabian StyleFilipponi, Federico. 2018. "River Color Monitoring Using Optical Satellite Data" Proceedings 2, no. 10: 569. https://doi.org/10.3390/IECG_2018-05336