Proceeding Paper

An Overview of Statistical Methods for Studying the Extreme Rainfalls in Mediterranean †

Department of Meteorology-Climatology, School of Geology, Aristotle University of Thessaloniki, Thessaloniki 54124, Greece
*
Author to whom correspondence should be addressed.
Presented at the 2nd International Electronic Conference on Atmospheric Sciences, 16–31 July 2017; Available online: http://sciforum.net/conference/ecas2017.
Proceedings 2017, 1(5), 681; https://doi.org/10.3390/ecas2017-04132
Published: 17 July 2017

Abstract

:
Extreme rainfall is one of the most devastating natural events. The frequency and intensity of these events has increased. This trend will likely continue as the effects of climate change become more pronounced. As a consequence, it is necessary to evaluate the different statistical methods that assess the occurrence of the extreme rainfalls. This research evaluates some of the most important statistical methods that are used for the analysis of the extreme precipitation events. Extreme Value Theory is applied on ten station data located in the Mediterranean region. Furthermore, its two main fundamental approaches (Block-Maxima and POT) and three commonly used methods for the calculation of the extreme distributions parameters (Maximum Likelihood, L-Moments, and Bayesian) are analyzed and compared. The results showed that the Generalized Pareto Distribution provides better theoretical justification to predict extreme precipitation compared to Generalized Extreme Value distribution while in the majority of stations the most accurate parameters for the highest precipitation levels are estimated with the Bayesian method. Extreme precipitation for return period of 50, 150 and 300 years were finally obtained which indicated that Generalized Extreme Value Distribution with Bayesian estimator presents the highest return levels for western stations, while for the eastern Mediterranean stations the Generalized Pareto Distribution with Bayesian estimator presents the highest ones.

1. Introduction

The frequency and the intensity of extreme rainfall episodes has increased in many land areas around the world [1]. Additionally, in many European countries such as the Czech Republic [2], northern Italy [3] and Germany [4], the extreme precipitation episodes are observed with a high frequency. Due to their severe impacts in many fields (agriculture, economy, etc.), these episodes have been examined commonly, using either precipitation indices or real data. Although it is necessary to investigate the future behavior of extreme events especially for regions such as the Mediterranean, especially the central Meditteranean, where the flood and drought risks are high [5]. For this purpose, it is useful to evaluate the statistical tools that are used to study extreme climatic episodes which is the main purpose of the present study.
Extreme Value Theory (EVT) is one of the most usual statistical methodologies which is used for the description of rare events (climatic or not) and specifically its two fundamental approaches the Generalized Extreme Value distribution (GEV) and the Generalized Pareto distribution (GPD). EVT analyzes the tail of the studied parameter distribution, which describes the extreme values, commonly produced by the Block Maxima or the Peak Over Threshold (POT) technique. For the application of the Block maxima, the data set is divided into same-sized non overlapping periods and from each one the maximum (or minimum) value is chosen. This new data set includes the extreme values. According to researches [6,7,8] the GEV distribution, which combines three different statistical families (Gumbel, Fréchet, and Weibull) can fit the extreme data set with a high accuracy. Another way of defining extreme values is to choose all the values that exceed a specific limit-threshold. This technique is POT and GPD distribution fit this data set satisfactorily [7]. Both Block Maxima and POT methods have some difficulties on their application. Firstly, choosing the most appropriate period-size (for Block Maxima) is not an easy procedure, according to Coles [9] too large sub-periods produce only a few values, while too small sub-periods could lead to biases. Secondly, in POT procedure the choice of the most appropriate threshold includes an uncertainty [10] as it is a scientist’s choice and this can affect the final results.
For the analysis and the description of the extremes distribution, three parameters were used: shape, scale and location. The values of these parameters can be calculated, using several statistical methods such as the Maximum likelihood (MLE), the L-moments and the Bayesian method. The MLE is an often-used method due to its reliable results and its simplicity. Mainly it is used for large data sets, as its results could be doubtful for samples minimum then 50 values [11,12]. The L-moment method is based on the linear combinations of probability weighed moments (PWMs). Finally the Bayesian is an accurate but complex method, which uses the initial data and offers supplementary information about it from alternative sources, through the prior distribution.
The main purpose of this study is to evaluate some of the most commonly used statistical methods and techniques that are used for the extreme analysis. That is achieved using the extreme precipitations around the Mediterranean region. Additionally it offers an overview of three statistical techniques, for the estimation of the extreme distribution parameters. Finally based on the above methods and techniques this study presents a measurement of the rainfall risk for the Mediterranean stations through the return levels.

2. Experiments

2.1. Data

For this research daily values of precipitation from 10 Mediterranean stations (Malaga, Barcelona, Nice, Bastia, Cagliari, Verona-Villa-Franca, Bologna, Gospic, Split-Marjan, Athens, and Thessaloniki) were used. Studying extreme climatic events requires an accurate data set in order to achieve reliable results. As a consequence the 10 studied stations, which cover the whole Mediterranean region, were chosen as their percentage of missing values does not exceed 2%. For the majority of stations, the data came from the “European Climate Assessment & Dataset” (ECAD) [13], while for Athens and Thessaloniki, the data was provided by the National Observatory of Athens and by the Department of Meteorology and Climatology of the Aristotle University of Thessaloniki respectively. Furthermore, the data covers a period of 60 years (1951–2010) and the location of each station can be observed in Figure 1.

2.2. Methodology

In the present study the two fundamental approaches of EVT were applied on the extreme precipitation events of the Mediterranean stations. Firstly the extreme values of precipitation were chosen for each station, using both the Block Maxima and the POT technique. Due to the fact that the data set is daily values of precipitation, the Block Maxima applied on annual sub-periods. As a result, the maximum precipitation episode of each year was chosen as extreme. According to the second technique, POT, the rainfall episodes with amounts higher than 99% were chosen as extremes. The percentage of 99% is in agreement with Anagnostopoulou and Tolika [14] who proved that this is the most appropriate threshold for extreme rainfalls in Europe. The two new produced data sets were fitted on both the Generalized Extreme Value Distribution (GEV) and the Generalized Pareto Distribution (GPD) respectively. Moreover, to check if the chosen distributions can describe the extreme data sets satisfactorily, both the Kolmogorov Smirnoff and the Anderson Darling tests were applied. Finally, three statistical methods that are used for finding the distributions parameters were evaluated. These methods are: the Maximum Likelihood estimation method (MLE), the L-moments method and the Bayesian method.

3. Results

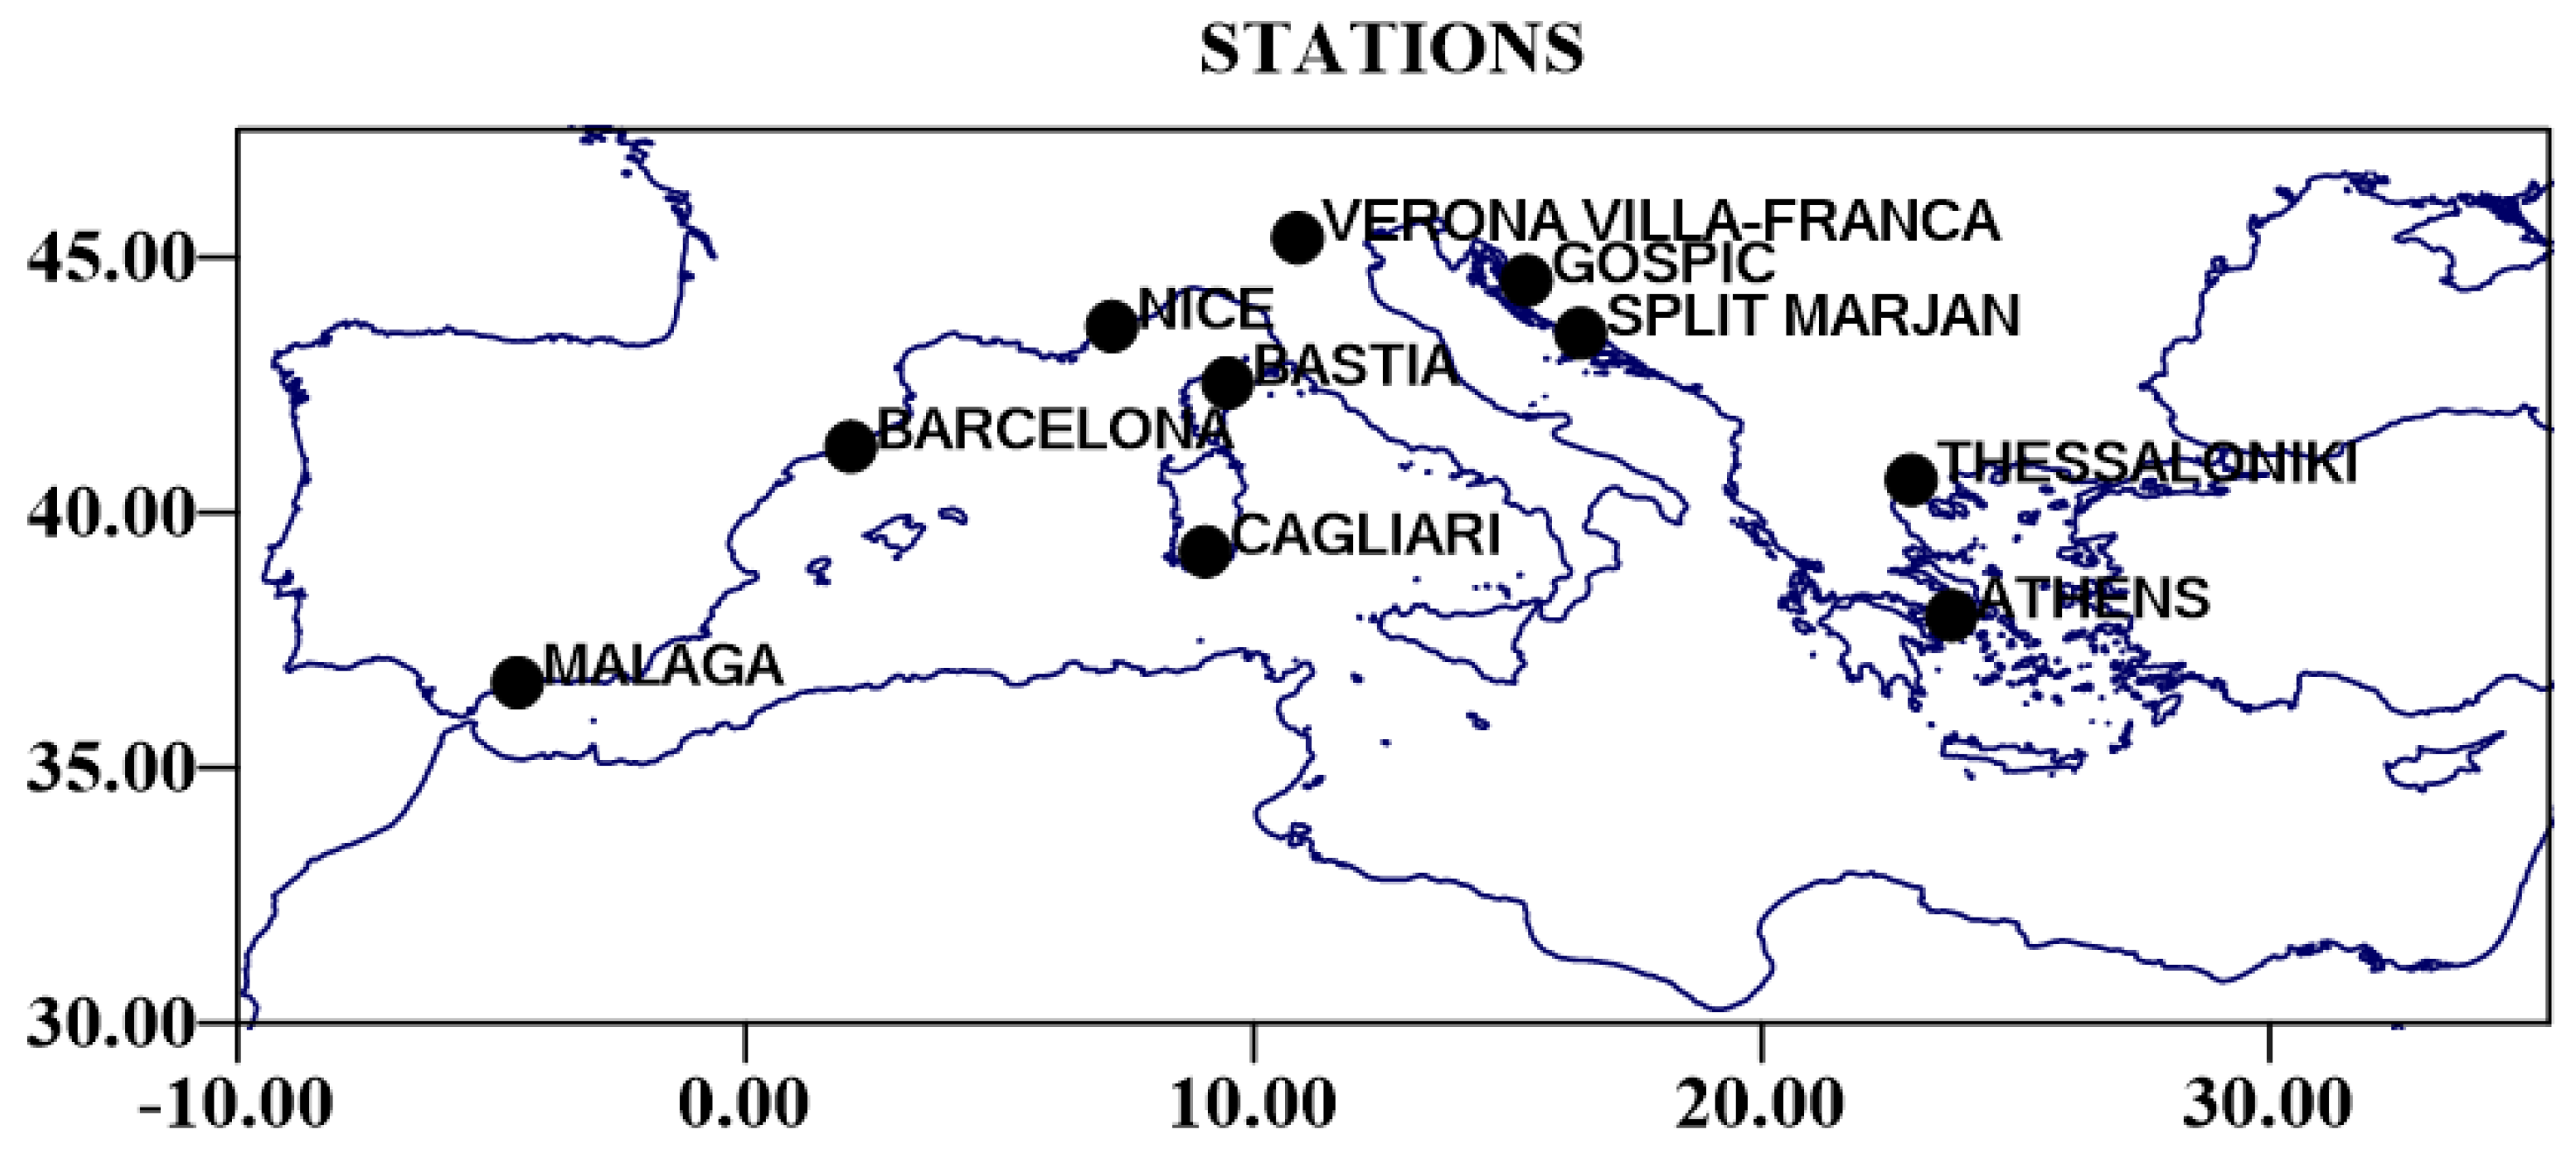
3.1. Climatology of the 10 Mediterannean Stations

In order to study the climatic extreme events of a region, it is helpful to know its climatology. Table 1 presents the mean daily precipitation and the absolute maximum rainfall amount that was recorded on each station.
According to Table 1 Gospic is the station with the highest mean daily precipitation, while Malaga has the highest absolute maximum amount. As it concerns the lowest values, both the minimum mean daily precipitation and the lowest absolute maximum rainfall amount observed in Greek stations (Athens and Thessaloniki respectively). In general, it is obvious from Table 1 that the mean daily precipitation is not related with the absolute maximum amount. For instance, Malaga had the most extreme rainfall episode, although its mean daily precipitation is low.

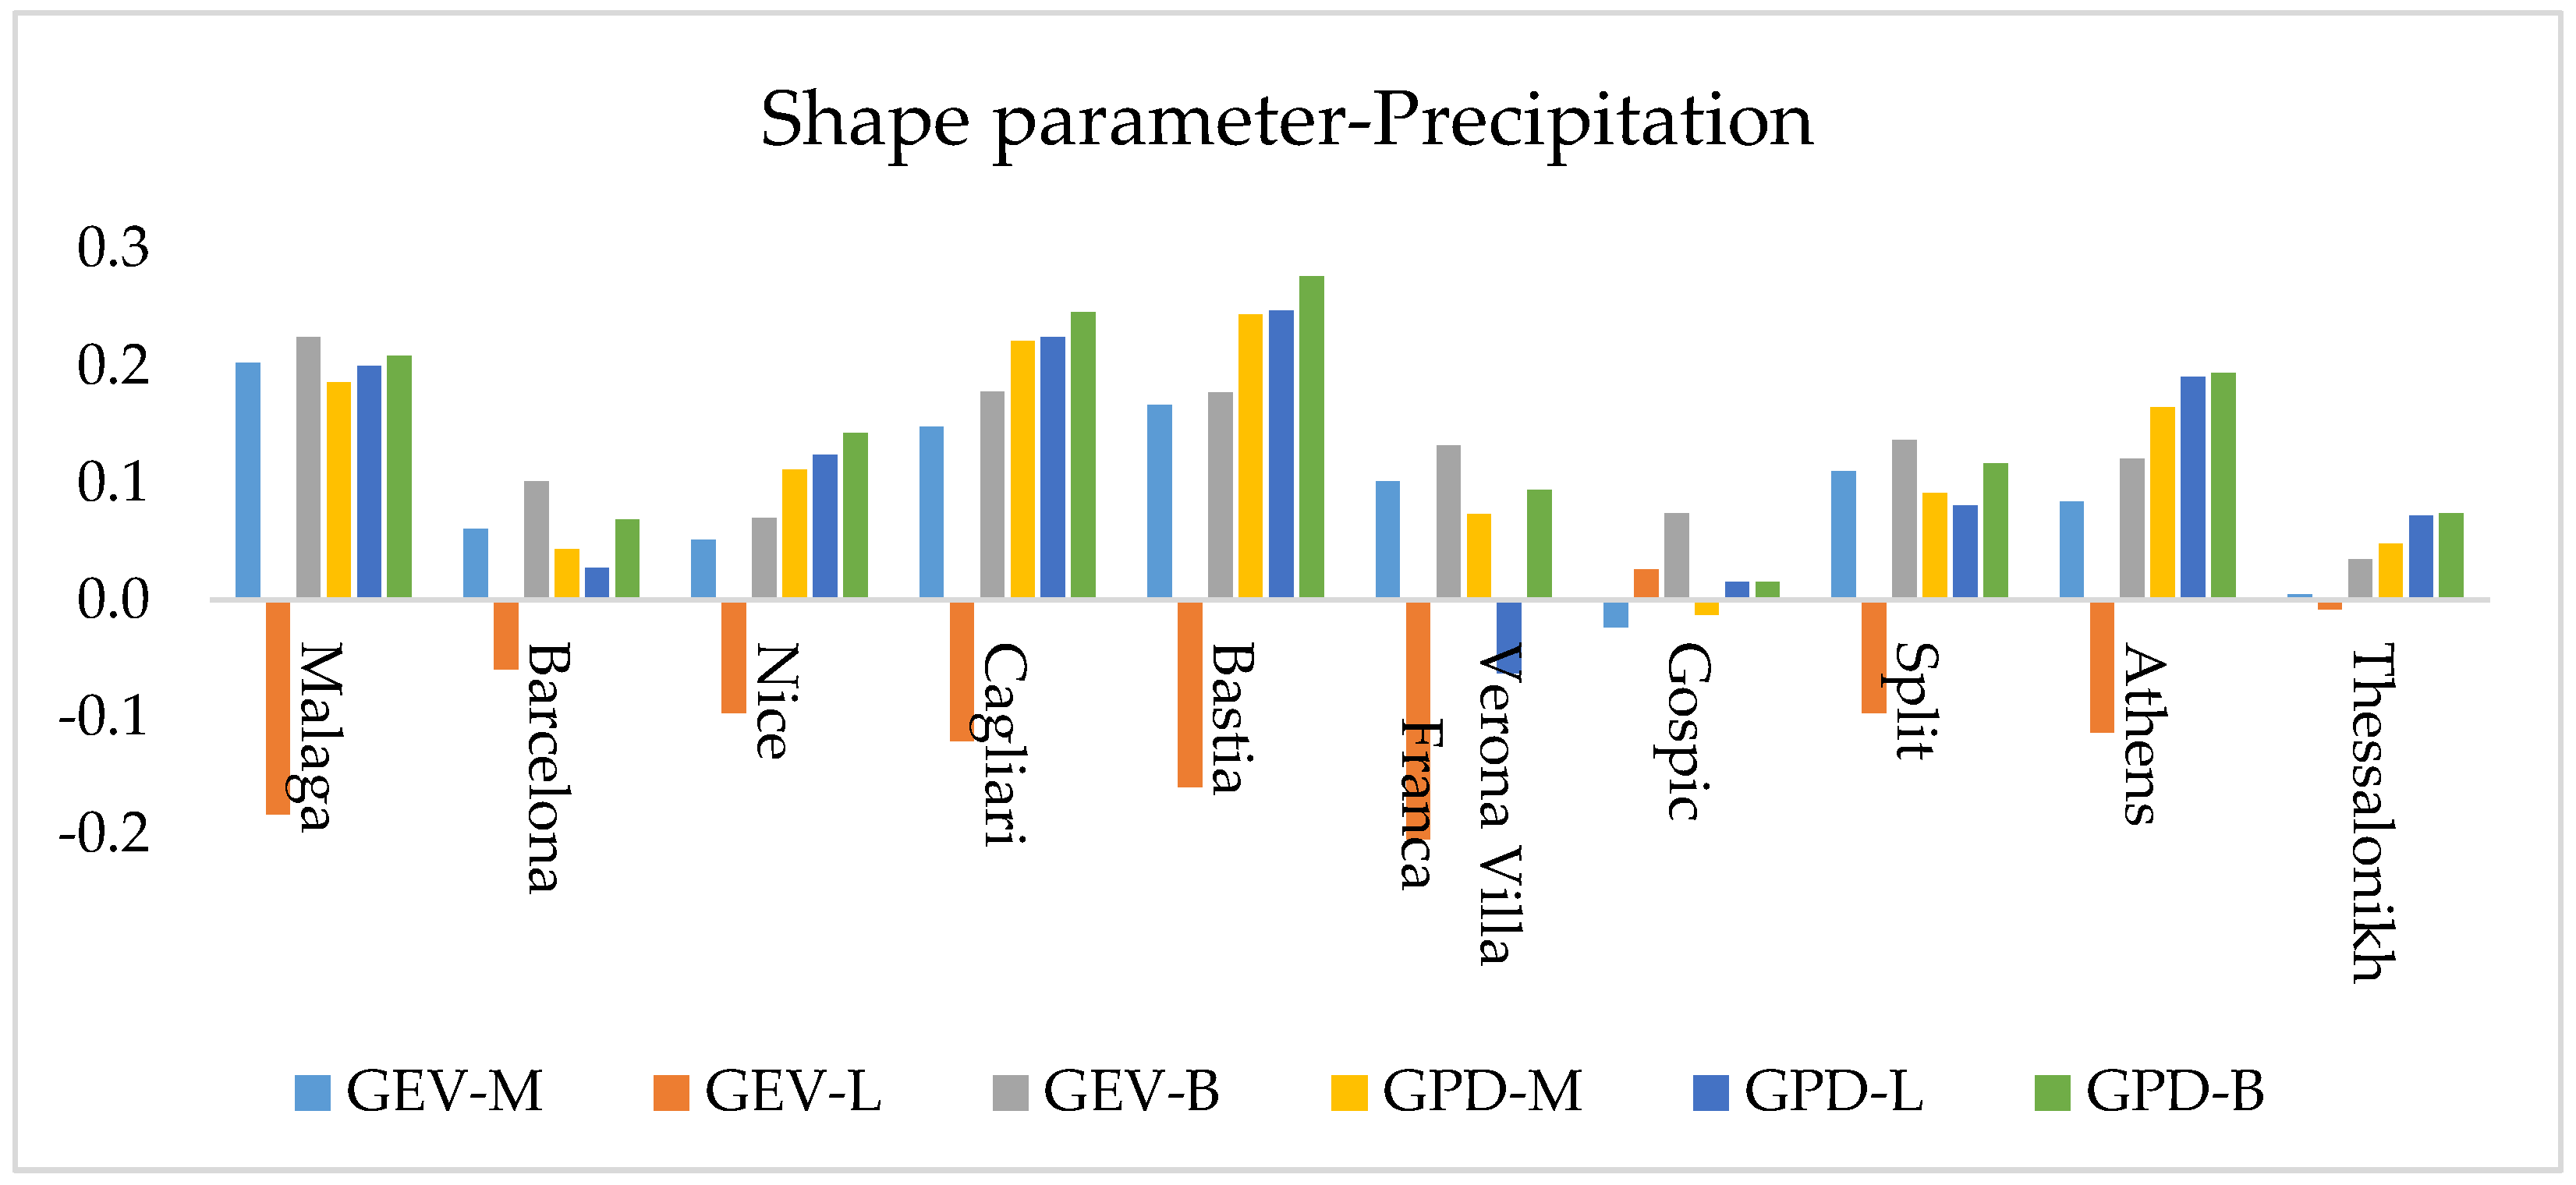
3.2. Goodness of Fit Test with Shape Diagram
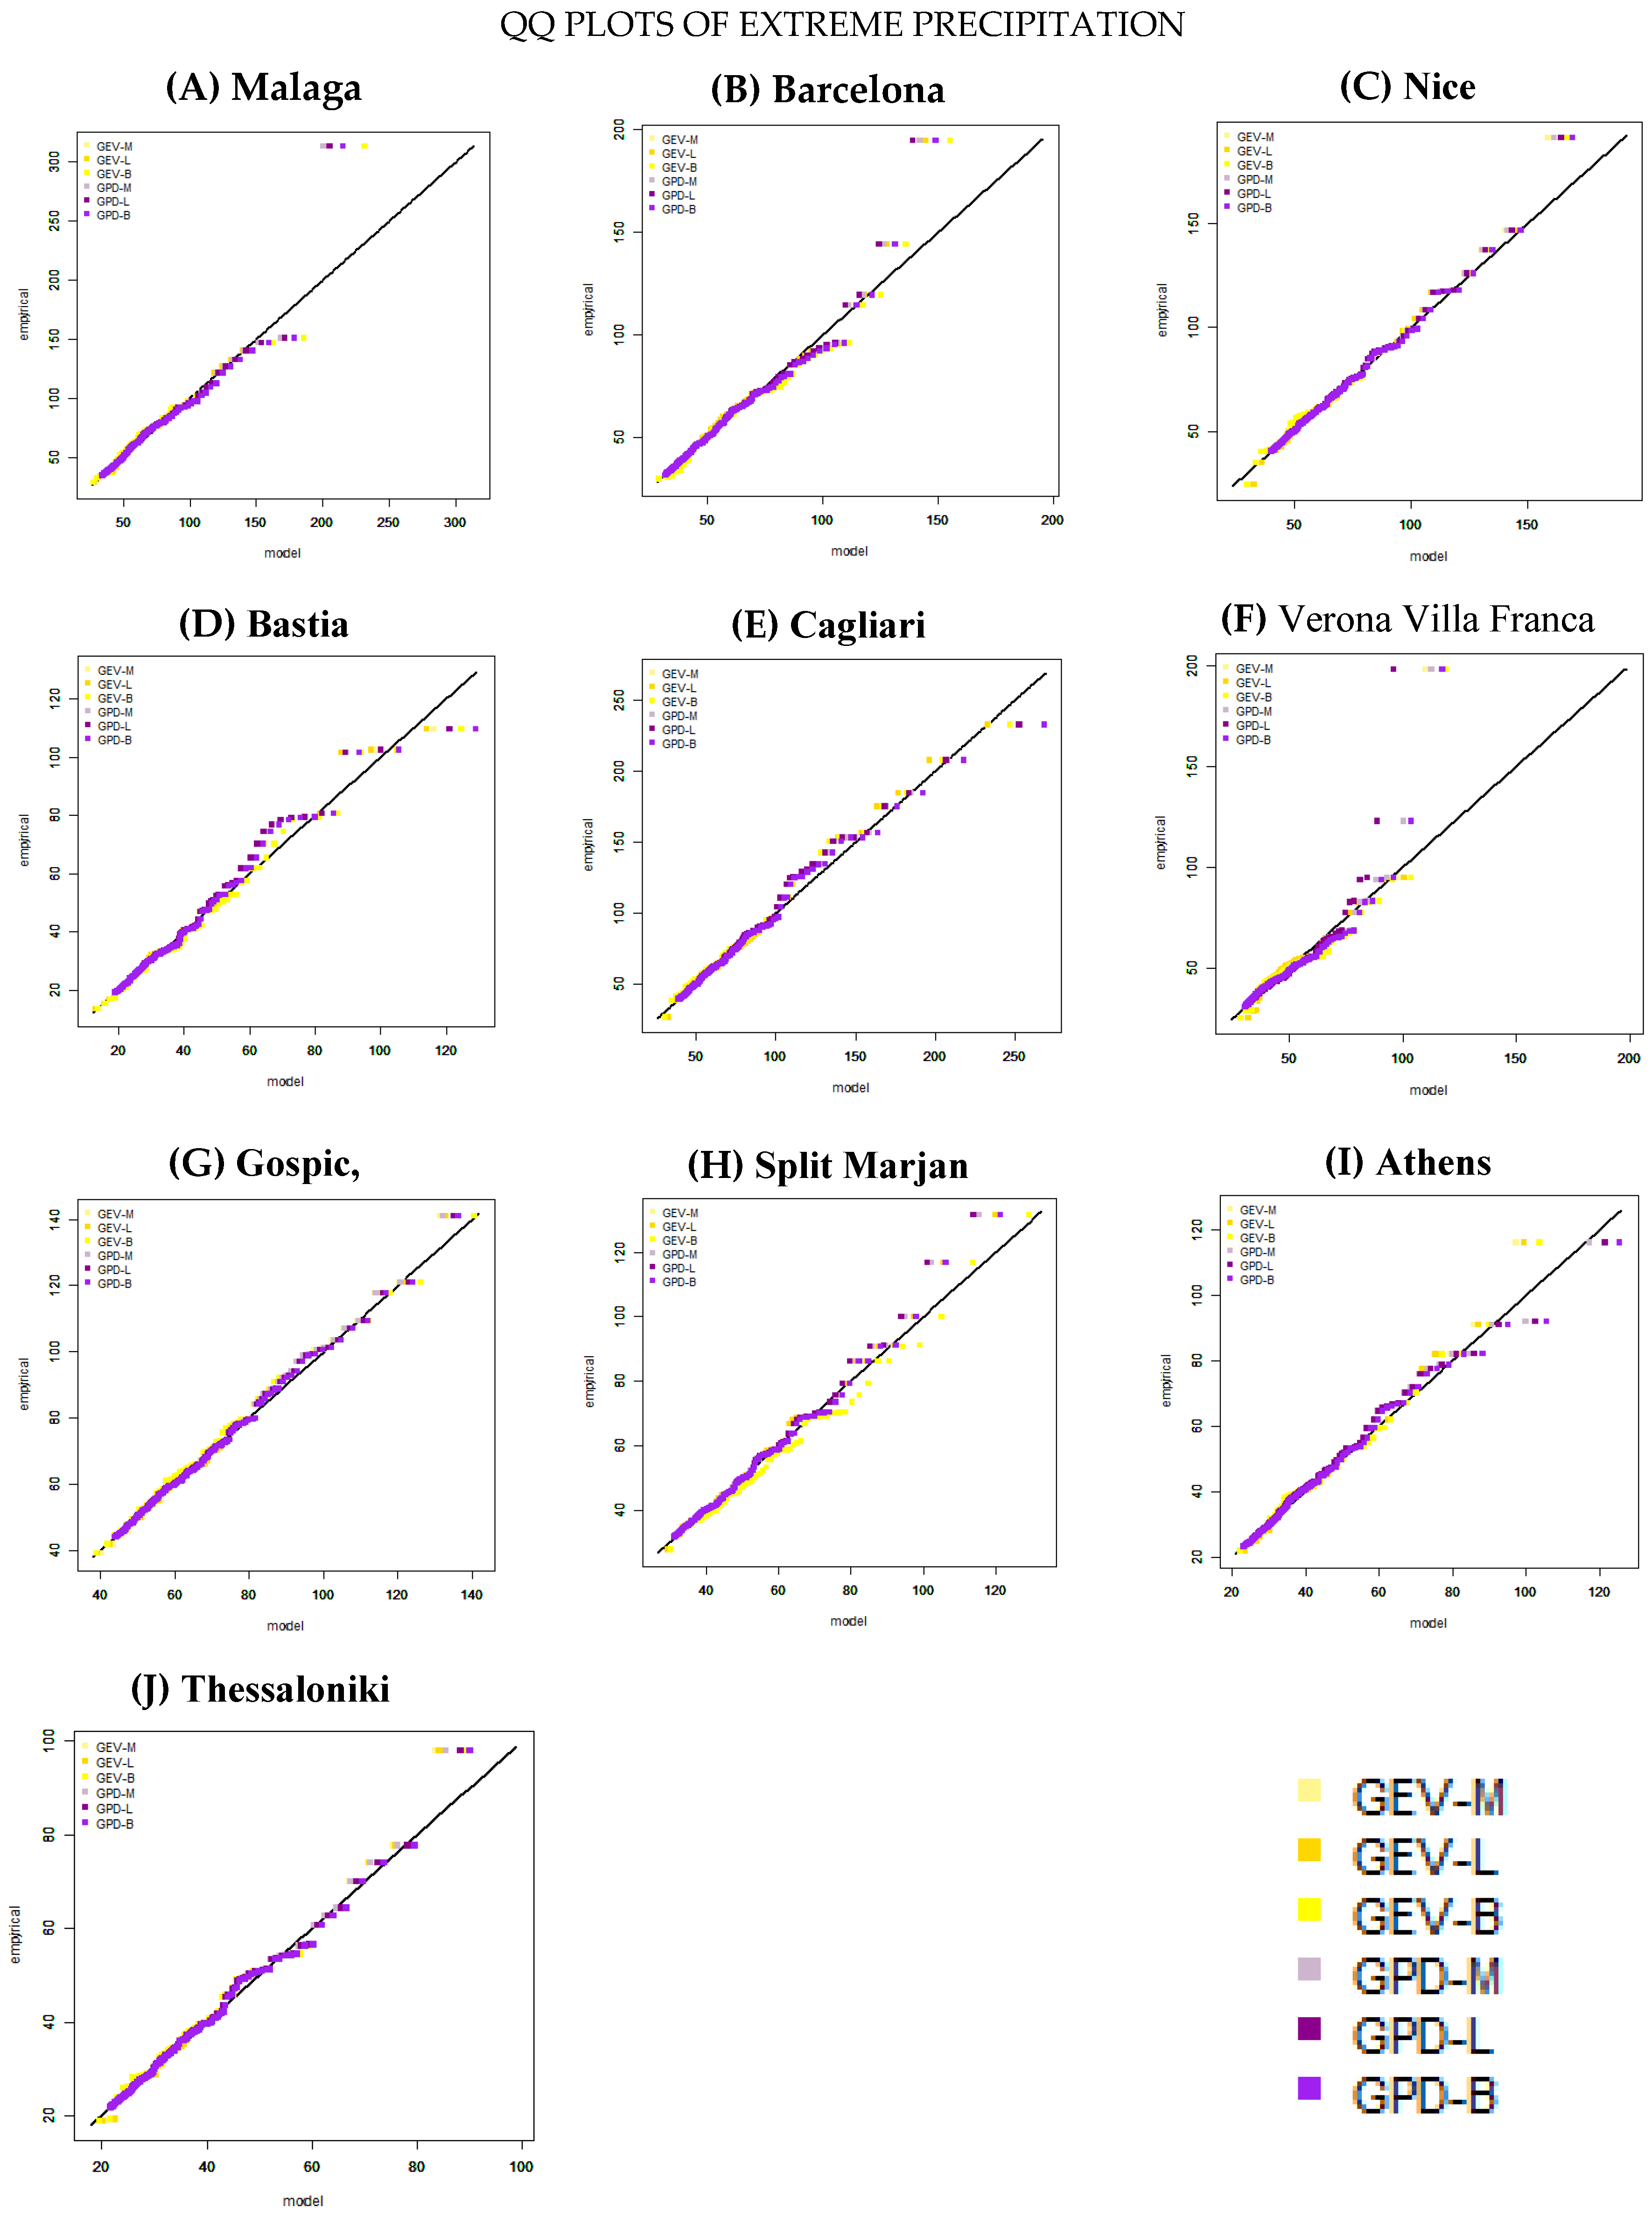
After the application of two goodness of fit tests (Kolmogorov-Smirnov, Anderson Darling), it is proved that GEV and GPD distributions can characterize the extreme rainfall behavior with high accuracy. Following that, the parameters of each distribution were estimated using three different methods (MLE, L-Moments and the Bayesian methods). Shape parameter is a helpful tool for checking whether the chosen distribution is appropriate or not. Particularly as rainfalls haven’t got an upper threshold the appropriate distribution should not be bounded above. For example the Weibull distribution (negative shape parameter), is inappropriate for precipitation. On the contrary, the Frechet distribution (unbounded above distribution) which has positive shape value, could be appropriate for precipitations. Based on that, Figure 2, presents an overview of the shape diagrams of each station. It is shown that GEV-L is not appropriate for the description of extreme rainfalls in the majority of stations. Moreover, GPD-M and GEV-M are inappropriate for Gospic, while GPD-L for Verona-Villa-Franca.

3.3. QQ-Plots

Quantile-quantile plot (QQ plot) is a useful tool used to check if the assumed distribution fits satisfactorily the studied data set. In Figure 3A–J GEV and GDP distributions using the MLE, L-moments and Bayesian techniques are compared to each station. According to Figure 3 both GEV and GPD distributions characterize satisfactorily the extreme rainfalls in the majority of the stations. Generally the QQ plots reveal that the GPD-M, GPD-L and GPD-B methods are more appropriate for small and medium rainfall values, compared with GEV-M, GEV-L and GEV-B which deviate a little from the reference line. As it concerns the greatest values of the extreme rainfalls, they are accurately fitted by both GEV-B and GPD-B distributions in almost all stations.

3.4. Return Levels

The estimation of the precipitation return levels, offers a common way to estimate the climatic risk, usually based on historical data. In this study, the return levels of extreme rainfalls were calculated for both GEV and GPD distribution using MLE, L-moments and Bayesian techniques (Table 2). According to Table 2, Bastia presents the highest return levels of extreme precipitation while Thessaloniki the lowest. That is observed in the three return periods, regardless of the method and the distribution which is used. In Table 2 it appears that GPD-B and GEV-B give the highest return levels for the three return periods and for all stations except of Verona-Villa-Franca. For the lowest return levels the results are more complex, as in almost five stations the GEV distribution (mainly GEV-M) asses the lowest return levels whereas GPD distribution (GPD-M and GPD-L) presents the lowest of the rest of the stations. What is also observed in Table 2, is that the Bayesian methods do not give any lowest return level neither with GEV nor with the GPD distribution. Finally, in the western Mediterranean and in stations with the highest altitude, the highest precipitation return levels are recorded with the GEV-B method while for the eastern stations with the GPD-B. Moreover, the GPD distribution either with MLE or with the L-moments method present the lowest return values for the western stations, while the GEV-M for the eastern ones.

4. Discussion and Conclusions

The main aim of the present study is to evaluate different statistical methods that are used for the description of extreme rainfall events. For this purpose, daily values of precipitation are used, coming from 10 stations located around the Mediterranean region. The stations expand from Spain to Greece and the time period starts from 1951 to 2010. To analyse the extreme rainfalls, the data was organized into new data sets, the Block Maxima data set which was fitted with the GEV distributon and POT data set fitted with GPD distribution. Finally, their parameters were estimated with MLE, L-moments and Bayesian methods.
The choice of the distribution that can characterize the extreme rainfall’s behavior became using goodness of fit tests. In accordance with many researches [14,15,16,17] GEV and GPD distribution seem to be the most appropriate. The importance of choosing an appropriate distribution is great, as it can affect the final results [18]. Consequently, an extra test for choosing an appropriate estimation method was achieved through the QQ plots. The results showed that GPD method with all of the three techniques could characterize sufficient the extreme rainfall episodes especially the minimum and medium extreme values. Moreover, it should be mentioned that both GEV-B and GPD-B are appropriate for the maximum values of extreme precipitation. Taking into account both the QQ plots and the shape diagram it is observed that the less suitable method for fitting the extreme episodes is GEV-L, despite the fact that is commonly used [15,19].
Furthermore, in this research the return levels of extreme rainfalls were calculated for three return periods (50, 150 and 300 years). The results showed that in the stations of Bastia and Malaga the highest return levels were recorded while in the eastern the lowest ones. That is explained from the fact that many of these stations such as Bastia are located in the western Mediterranean close to cyclogenesis center (Gulf of Genoa) [20,21], while other stations such as Malaga located along the Atlantic depression trajectories which are moving into the Mediterranean [20]. It is also found that GEV-B method, also used by Dyrrdal et al. [16], assess the highest return levels of precipitation for the western Mediterranean stations, while the GPD-B, also used by Cooley et al. [22] for the eastern ones.

Author Contributions

All authors conceived and initiated the study. Georgia Lazoglou analyzed the data. All authors contributed to the discussion and interpretation of the results and the writing of the manuscript.

Conflicts of Interest

The authors declare no conflict of interest.

Abbreviations

The following abbreviations are used in this manuscript:
GEV-MGeneralized Extreme Value Distribution with the Maximum Liklihood estimation method
GEV-LGeneralized Extreme Value Distribution with the L-moments estimation method
GEV-BGeneralized Extreme Value Distribution with the Bayesian estimation method
GPD-MGeneralized Pareto Distribution with the Maximum Liklihood estimation method
GPD-LGeneralized Pareto Distribution with the L-moments estimation method
GPD-BGeneralized Pareto Distribution with the Bayesian estimation method
GEV-LGeneralized Extreme Value Distribution with the L-moments estimation method
MLEMaximum Liklihood Estimation method
EVTExtreme Value Theory
GEVGeneralized Extreme Value Distribution
GPDGeneralized Pareto Distribution
POTPeaks Over Threshold

References

  1. Pachauri, R.K.; Allen, M.R.; Barros, V.R.; Broome, J.; Cramer, W.; Christ, R.; Dubash, N.K. Climate Change 2014: Synthesis Report; Contribution of Working Groups I, II and III to the Fifth Assessment Report of the Intergovernmental Panel on Climate Change (IPCC): Geneva, Switzerland, 2014. [Google Scholar]
  2. Kyselý, J. Trends in heavy precipitation in the Czech Republic over 1961–2005. Int. J. Climatol. 2009, 29, 1745–1758. [Google Scholar] [CrossRef]
  3. Brunetti, M.; Maugeri, M.; Nanni, T. Changes in total precipitation, rainy days and extreme events in northeastern Italy. Int. J. Climatol. 2001, 21, 861–871. [Google Scholar] [CrossRef]
  4. Hundecha, Y.; Bardossy, A. Trends in daily precipitation and temperature extremes across western Germany in the second half of the 20th century. Int. J. Climatol. 2005, 25, 1189–1202. [Google Scholar] [CrossRef]
  5. Pal, J.; Giorgi, F.; Bi, X. Consistency of recent European summer precipitation trends and extremes with future regional climate projections. Geophys. Res. Lett. 2004, 31, 4. [Google Scholar] [CrossRef]
  6. Kharin, V.V.; Zwiers, F.W. Changes in the extremes in an ensemble of transient climate simulations with a coupled atmosphere-ocean GCM. J. Clim. 2000, 13, 3760–3788. [Google Scholar] [CrossRef]
  7. Katz, R.W.; Parlange, M.B.; Naveau, P. Statistics of extremes in hydrology. Adv. Water Resour. 2002, 25, 1287–1304. [Google Scholar] [CrossRef]
  8. García, J.A.; Serrano, A.; Gallego, M.C. A spectral analysis of Iberian Peninsula monthly rainfall. Theor. Appl. Climatol. 2002, 71, 77–95. [Google Scholar] [CrossRef]
  9. Coles, S. An Introduction to Statistical Modeling of Extreme Values; Springer Series in Statistics: London, UK, 2001. [Google Scholar]
  10. Beguería, S. Uncertainties in partial duration series modelling of extremes related to the choice of the threshold value. J. Hydrol. 2005, 303, 215–2309. [Google Scholar] [CrossRef]
  11. Hosking, J.R.M.; Wallis, J.R. Regional Frequency Analysis: An Approach Based on LMoments; Cambridge University Press: New York, NY, USA, 1997. [Google Scholar]
  12. Coles, S.; Dixon, M.J. Likelihood-based inference for extreme value models. Extremes 1999, 2, 5–23. [Google Scholar] [CrossRef]
  13. Klein Tank, A.M.G.; Wijngaard, J.B.; Können, G.P.; Böhm, R.; Demarée, G.; Gocheva, A.; Mileta, M.; Pashiardis, S.; Hejkrlik, L.; Kern-Hansen, C.; et al. Daily dataset of 20th century surface air temperature and precipitation series for the European Climate Assessment. Int. J. Climatol. 2002, 22, 1441–1453. [Google Scholar] [CrossRef]
  14. Anagnostopoulou, C.; Tolika, K. Extreme precipitation in Europe: Statistical threshold selection based on climatological criteria. Theor. Appl. Climatol. 2012, 107, 479–489. [Google Scholar] [CrossRef]
  15. Kyselý, J. Coverage probability of bootstrap confidence intervals in heavy-tailed frequency models, with application to precipitation data. Theor. Appl. Climatol. 2010, 101, 345–361. [Google Scholar] [CrossRef]
  16. Dyrrdal, A.V.; Lenkoski, A.; Thorarinsdottir, T.L.; Stordal, F. Bayesian hierarchical modeling of extreme hourly precipitation in Norway. Environmetrics 2015, 26, 89–106. [Google Scholar] [CrossRef]
  17. Roth, M.; Buishand, T.A.; Jongbloed, G.; Klein Tank, A.M.G.; van Zanten, J.H. Projections of precipitation extremes based on a regional, non-stationary peaks-over-threshold approach: A case study for the Netherlands and north-western Germany. Weather Clim. Extremes 2014, 4, 1–10. [Google Scholar] [CrossRef]
  18. El Adlouni, S.; Ouarda, T.B.M.J.; Zhang, X.; Roy, R.; Bobée, B. Generalized maximum likelihood estimators for the nonstationary generalized extreme value model. Water Resources Res. 2007, 43, 455–456. [Google Scholar] [CrossRef]
  19. Lee, S.H.; Maeng, S.J. Frequency analysis of extreme rainfall using L-moment. Irrig. Drain. 2003, 52, 219–230. [Google Scholar] [CrossRef]
  20. Trigo, I.; Davies, T.; Bigg, G. Objective climatology of cyclones in the Mediterranean region. J. Clim. 1999, 12, 1685–1696. [Google Scholar] [CrossRef]
  21. Maheras, P.; Flocas, A.H.; Patrikas, I.; Anagnostopoulou, C. A 40 year objective climatology of surface cyclones in the Mediterranean region: Spatial and temporal distribution. Int. J. Climatol. 2001, 21, 109–130. [Google Scholar] [CrossRef]
  22. Cooley, D.; Nychka, D.; Naveau, P. Bayesian Spatial Modeling of Extreme Precipitation Return Levels. J. Am. Stat. Assoc. 2007, 102, 824–840. [Google Scholar] [CrossRef]
Figure 1. The geographical distribution of the 10 studded stations.
Proceedings 01 00681 g001
Figure 2. Shape parameter of the 10 studied stations, estimated by six different statistical methods (GEV-M, GEV-L, GEV-B, GPD-M, GPD-L, GPD-B).
Proceedings 01 00681 g002
Figure 3. QQ plots for the 10 studied stations (from A to J) using six different statistical methods (GEV-M, GEV-L, GEV-B, GPD-M, GPD-L, GPD-B). X-axis provides the models values and Y-axis the empirical values.
Proceedings 01 00681 g003
Table 1. An overview of rainfalls in the 10 studied stations.
STATIONSPRECIPITATION
NameCountryMean Daily (mm)Absolute Maximum (mm)
MalagaSpain1.55313.00
BarcelonaSpain1.72194.80
NiceFrance2.20191.40
BastiaFrance2.12232.40
CagliariItaly1.14109.60
Verona Villa FrancaItaly2.17198.00
GospicCroatia3.79141.00
Split MarjanCroatia2.23131.60
AthensGreece1.09116.00
ThessalonikiGreece1.2498.00
Table 2. The precipitation return levels for the 10 stations and for three return periods (50, 150 and 300 years). The red cells shows the highest values of each station while the blue shows the lowest ones.
MalagaBarcelonaNiceCagliariBastiaVerona Villa FrancaGospicSplit MarjanAthensThessaloniki
50 YEARS
GEV-M194.9140.1153.6110.8222.2106.4128.3115.993.981.2
GEV-L192.9139.7158.7109.0221.8113.1129.7115.795.881.9
GEV-B216.4150.4162.6117.3231.8111.9134.5122.999.385.5
GPD-M191.6138.0156.0115.1240.1109.3129.0111.9112.483.0
GPD-L195.7135.3158.6115.1239.394.1131.9110.4116.285.6
GPD-B203.2143.8163.9120.7255.7113.1132.4116.3117.986.7
150 YEARS
GEV-M258.0167.9183.4142.4287.1128.4145.3140.9113.094.0
GEV-L252.4167.3194.0137.9285.6146.0146.9139.8117.195.0
GEV-B297.7185.2195.6150.4309.3138.8155.5154.2122.3102.8
GPD-M248.9163.6190.3153.7325.7130.2147.0134.4143.298.1
GPD-L256.8159.0194.9154.1325.4105.1151.3131.8150.7102.4
GPD-B270.0172.8203.6163.9354.8136.3152.0141.6152.7104.1
300 YEARS
GEV-M305.5186.4203.1165.0334.4143.6155.7158.2126.0102.1
GEV-L296.4185.5218.2158.1331.8171.3157.5156.4131.9103.3
GEV-B361.6209.2217.5174.0368.0158.0168.9176.8138.4114.3
GPD-M291.6180.3214.1183.4392.8144.2158.3149.8165.6108.0
GPD-L302.9174.4220.5184.1393.1111.6163.8146.4176.4113.8
GPD-B321.0192.3232.0197.7434.3152.1164.5159.3178.6115.8
Publisher’s Note: MDPI stays neutral with regard to jurisdictional claims in published maps and institutional affiliations.

