Evaluation of the Sensitivity of the Updated RegCM4 Model to Physics Parameterizations over the Mediterranean Region: Precipitation and Temperature Simulations †


Abstract
:1. Introduction
2. Experiments
2.1. Data
2.2. Methodology
3. Results
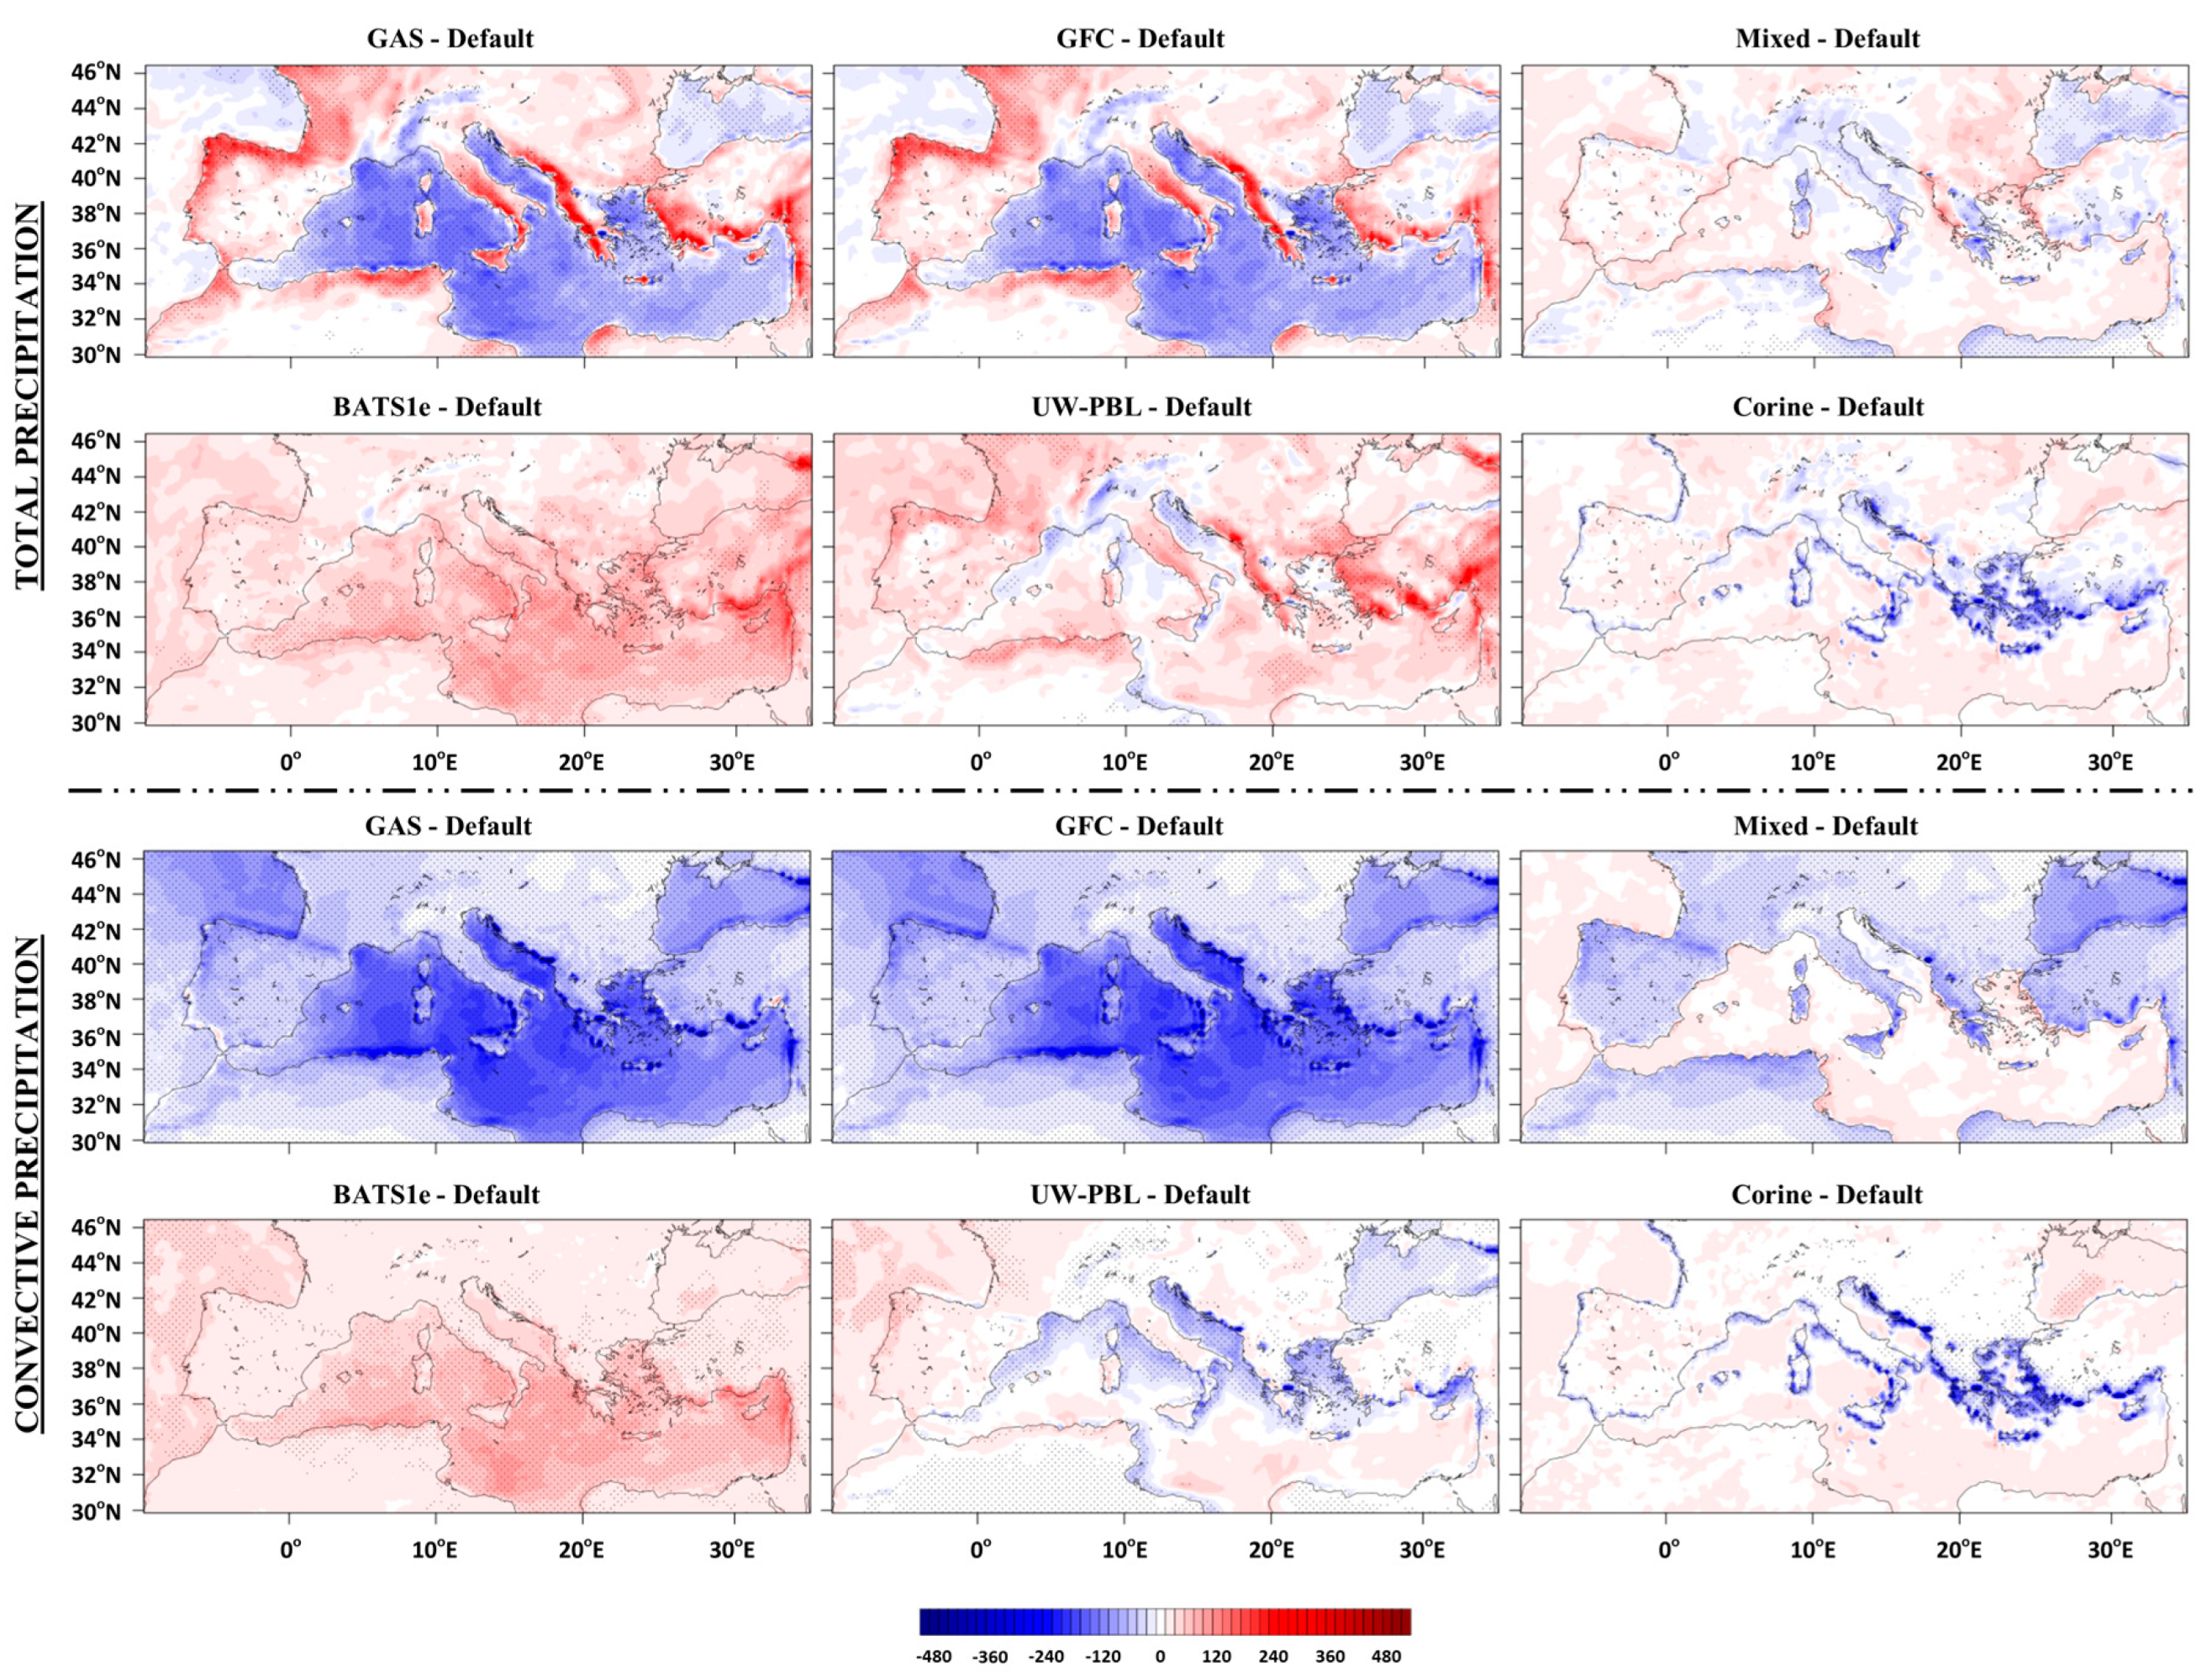
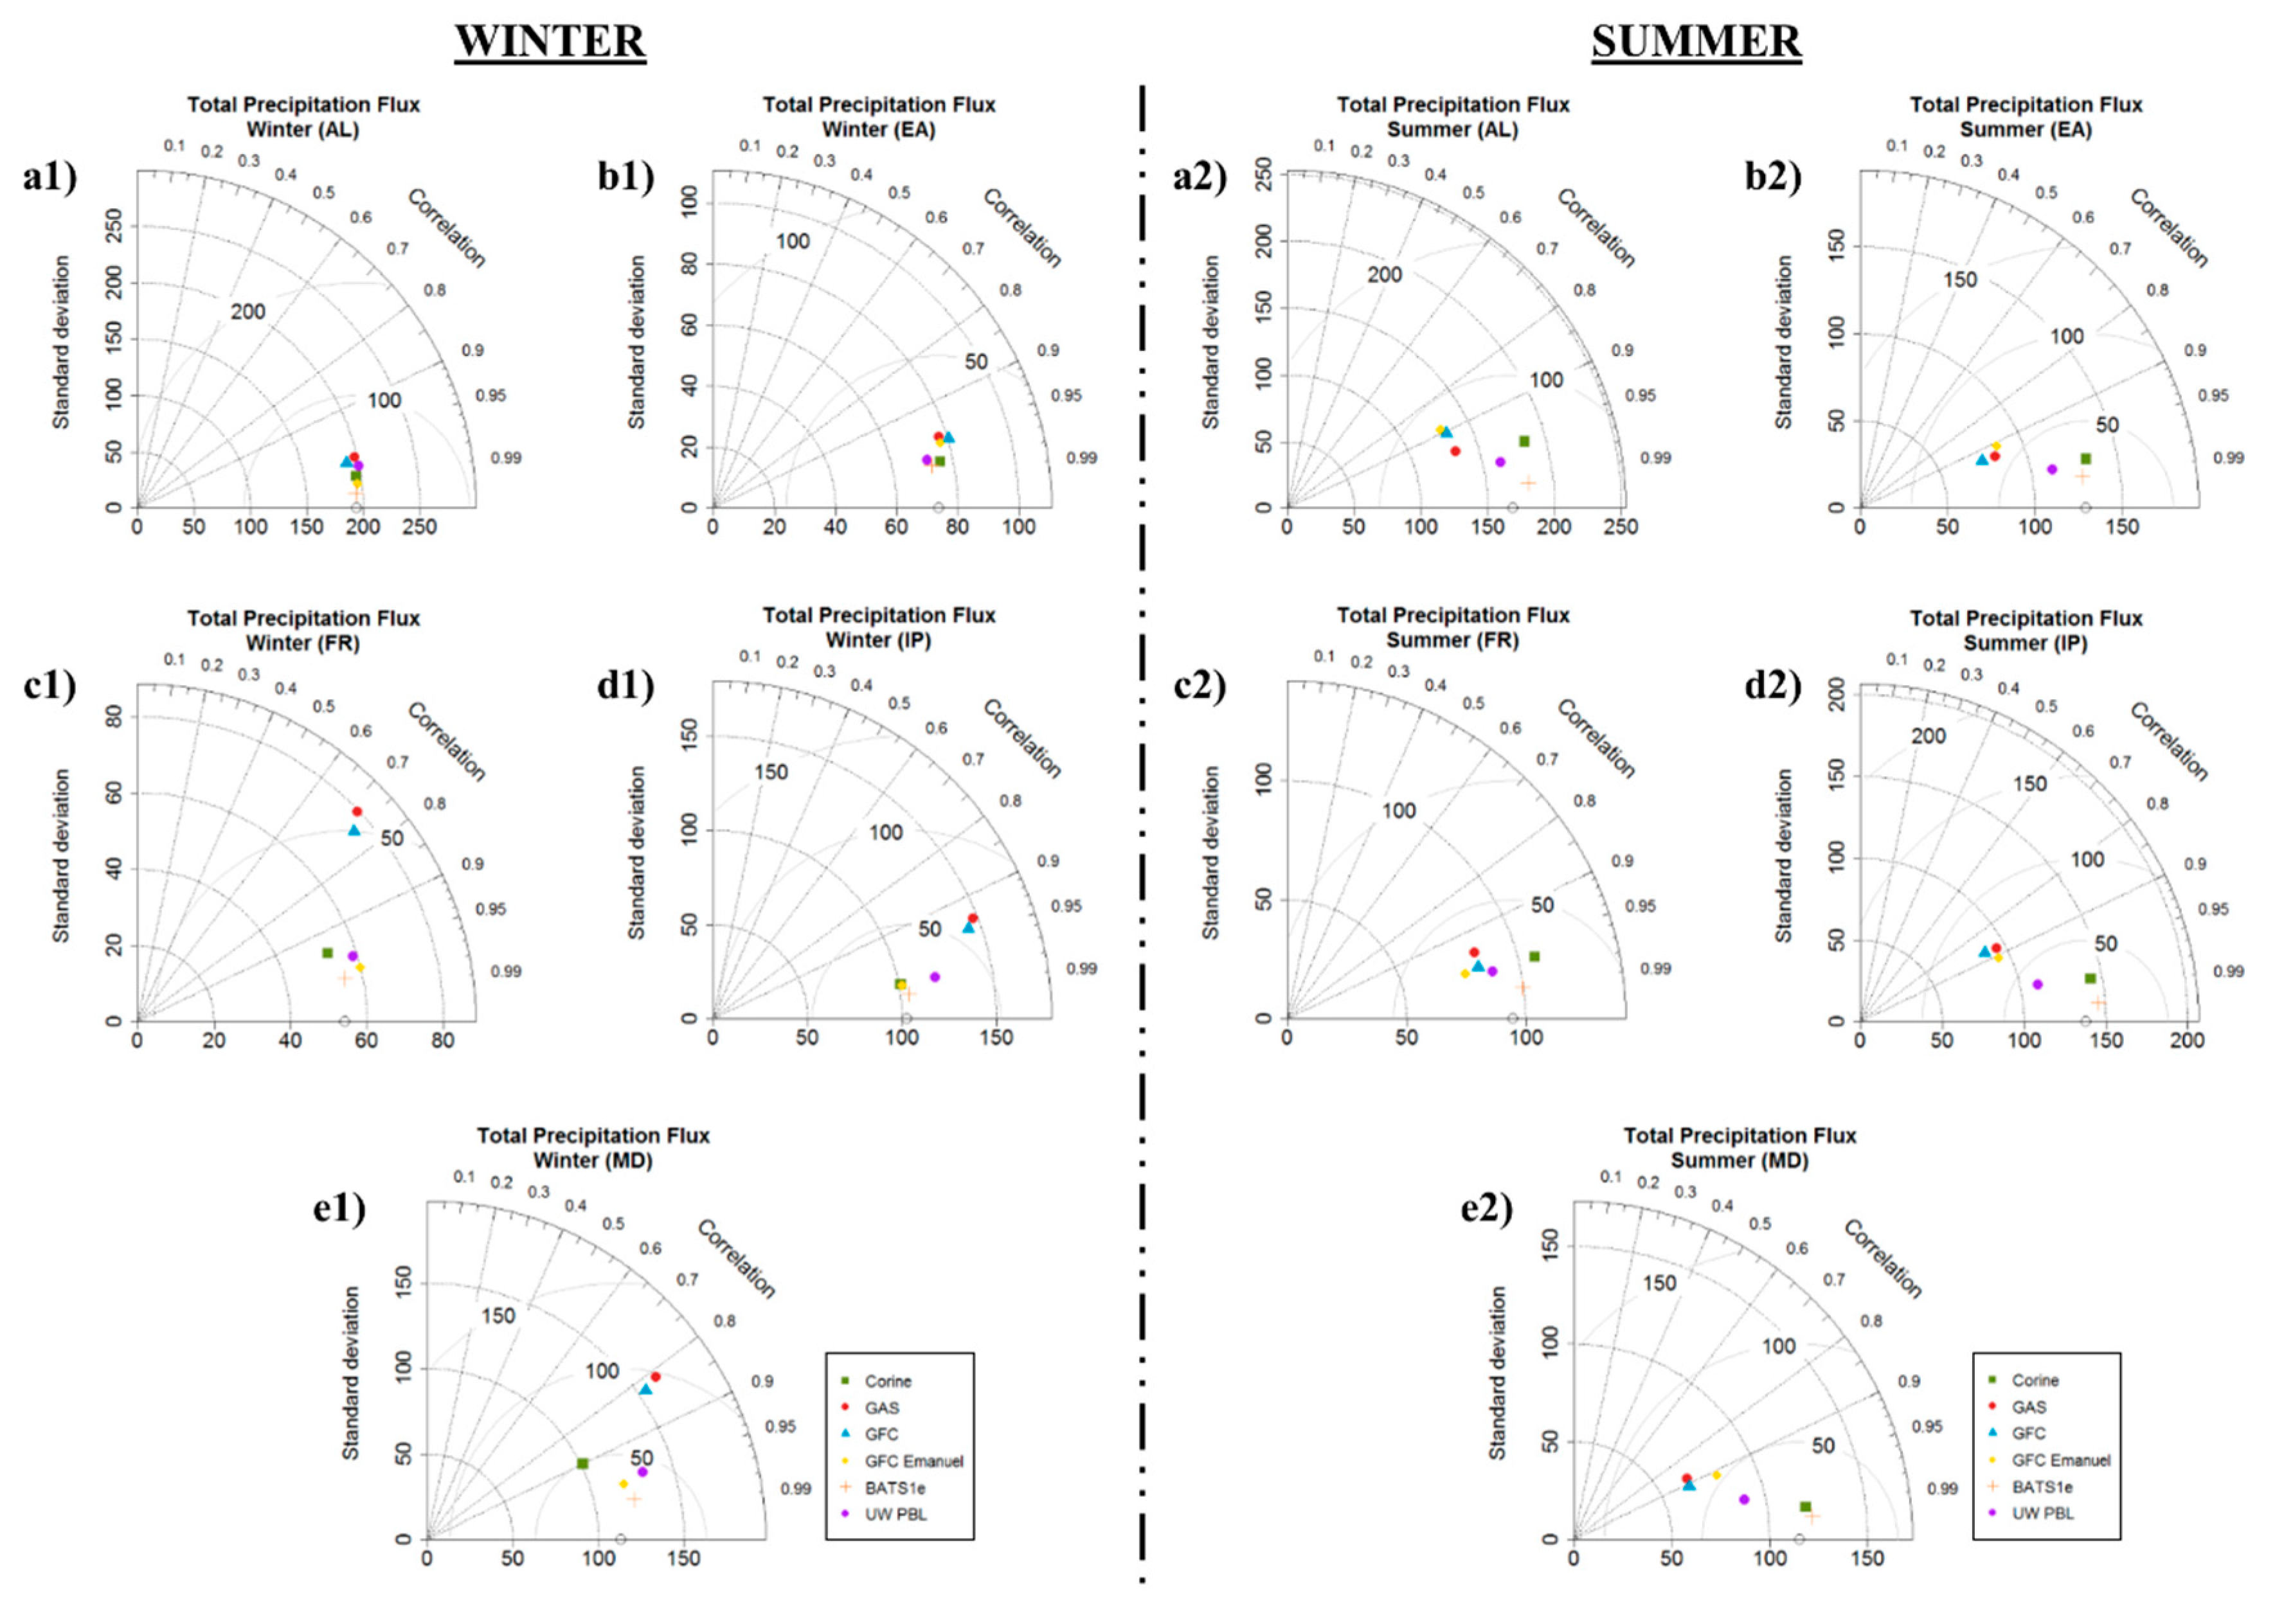
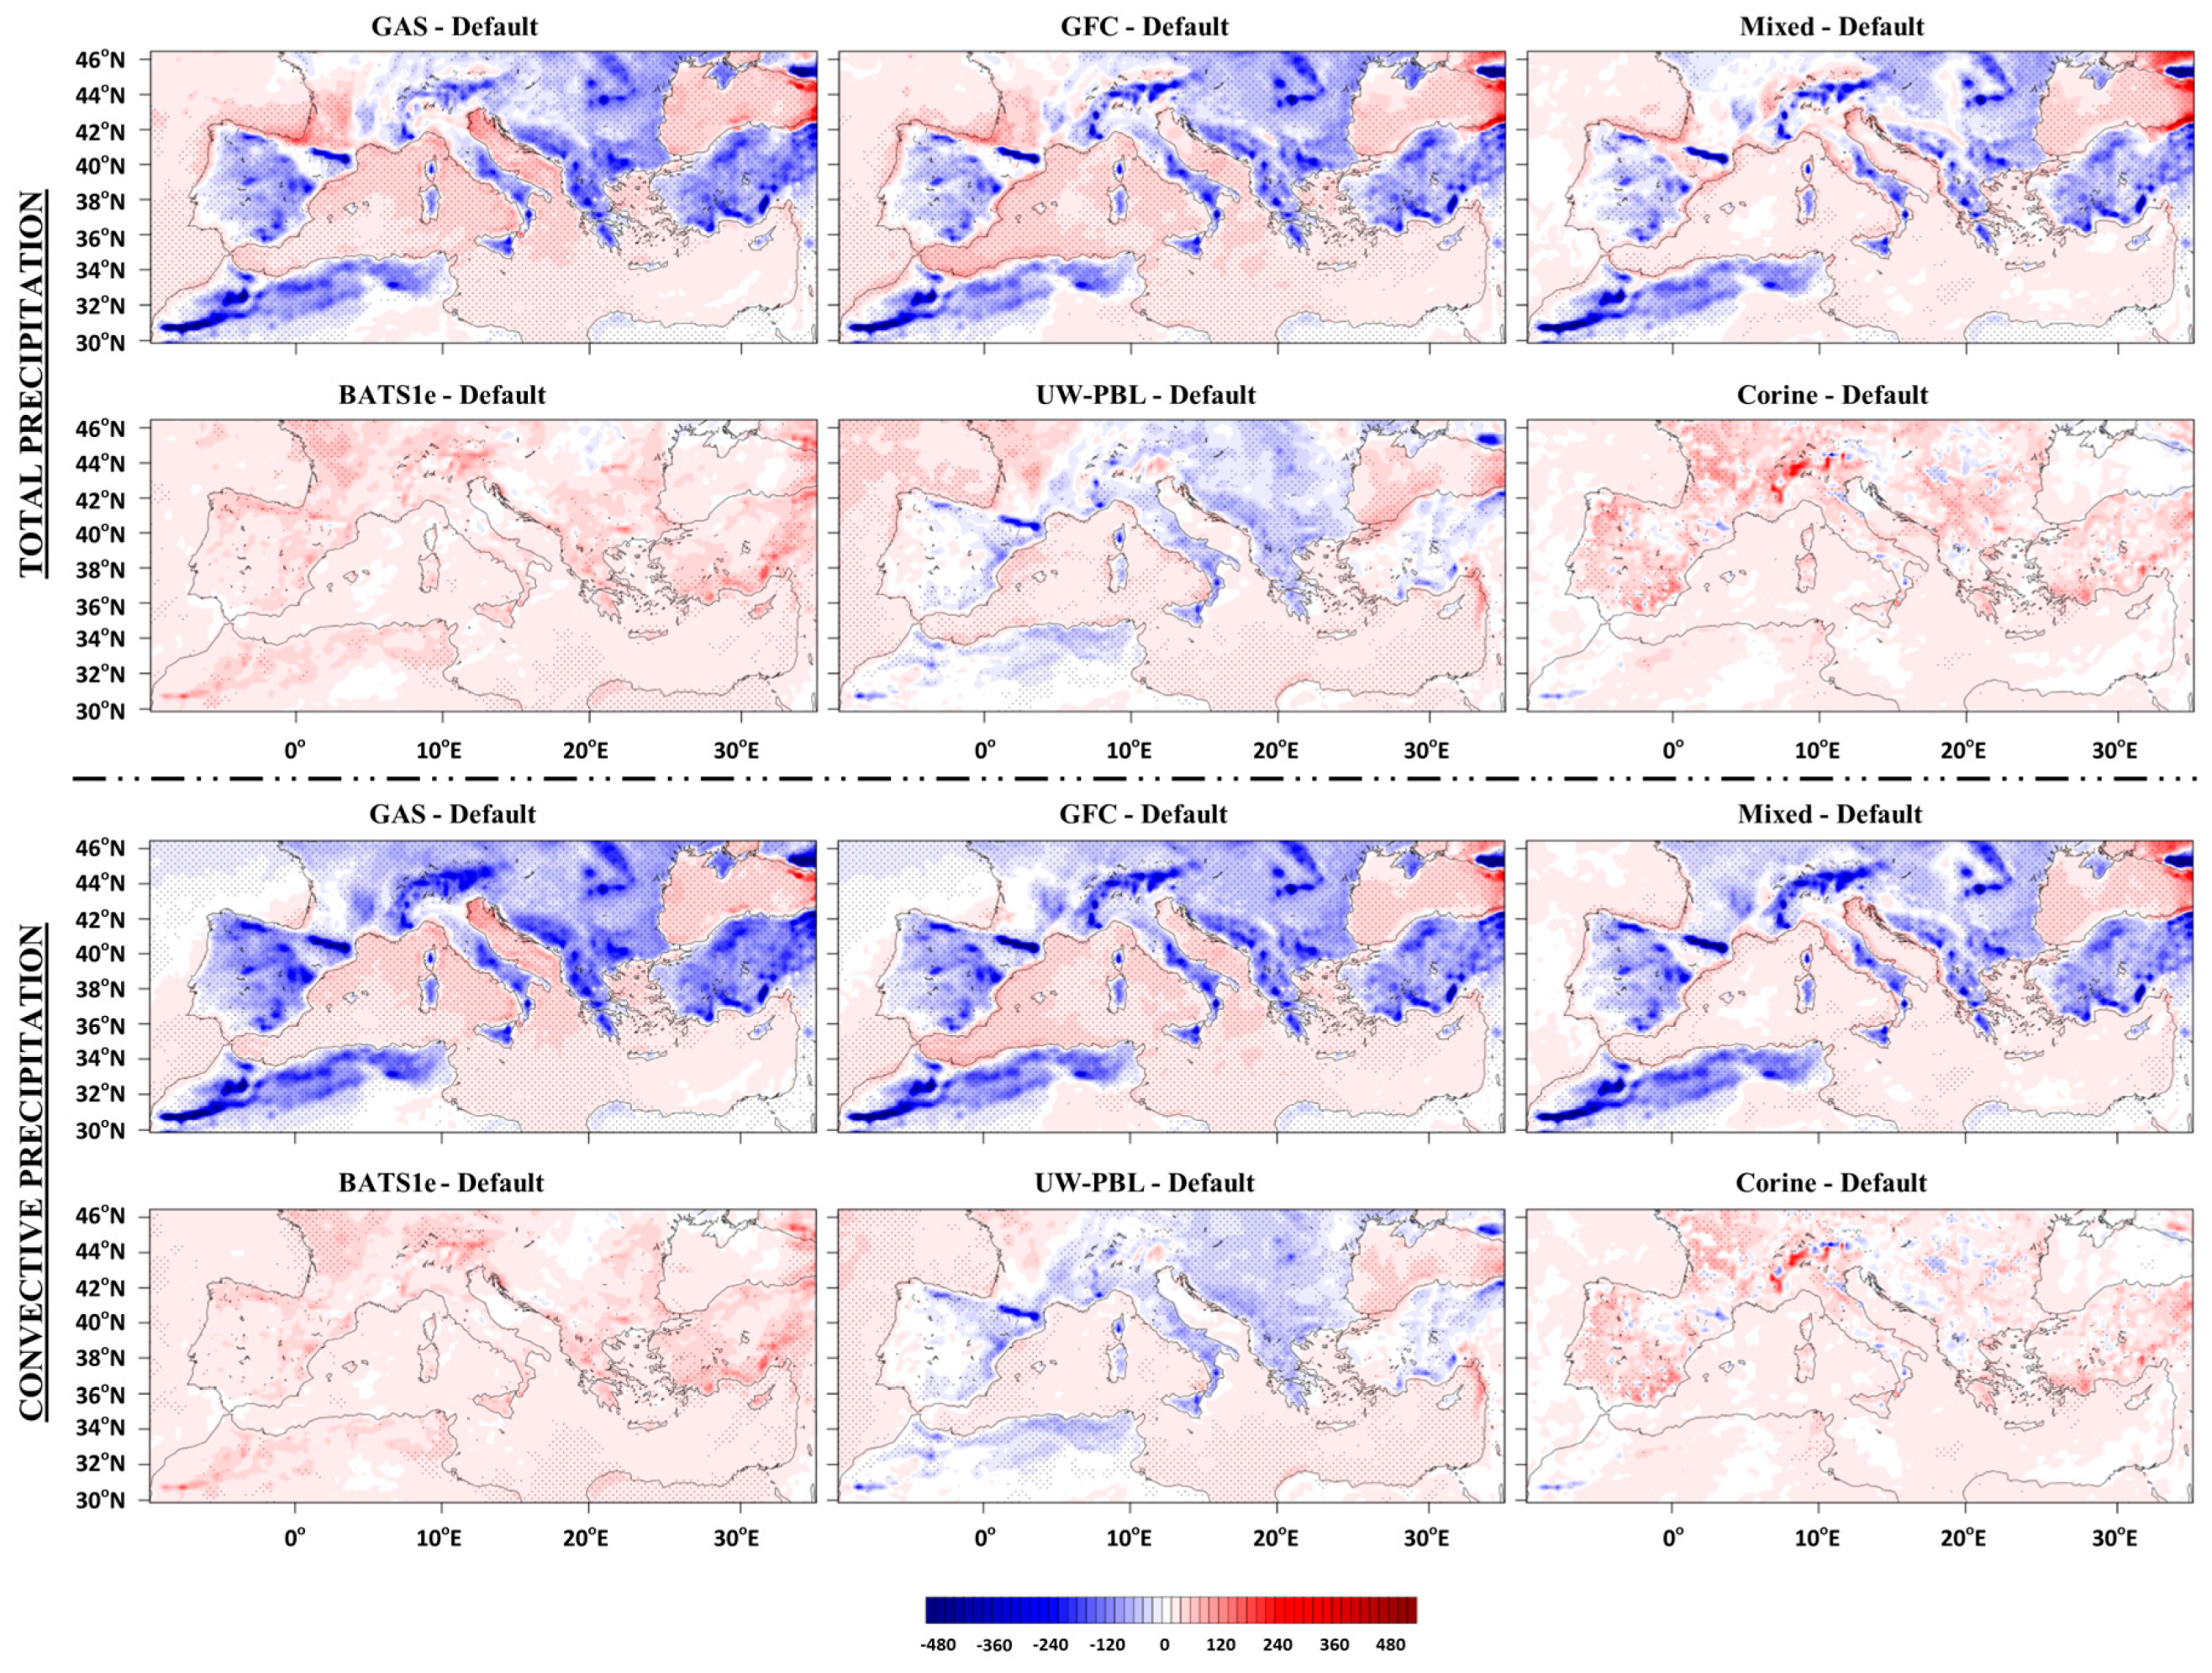
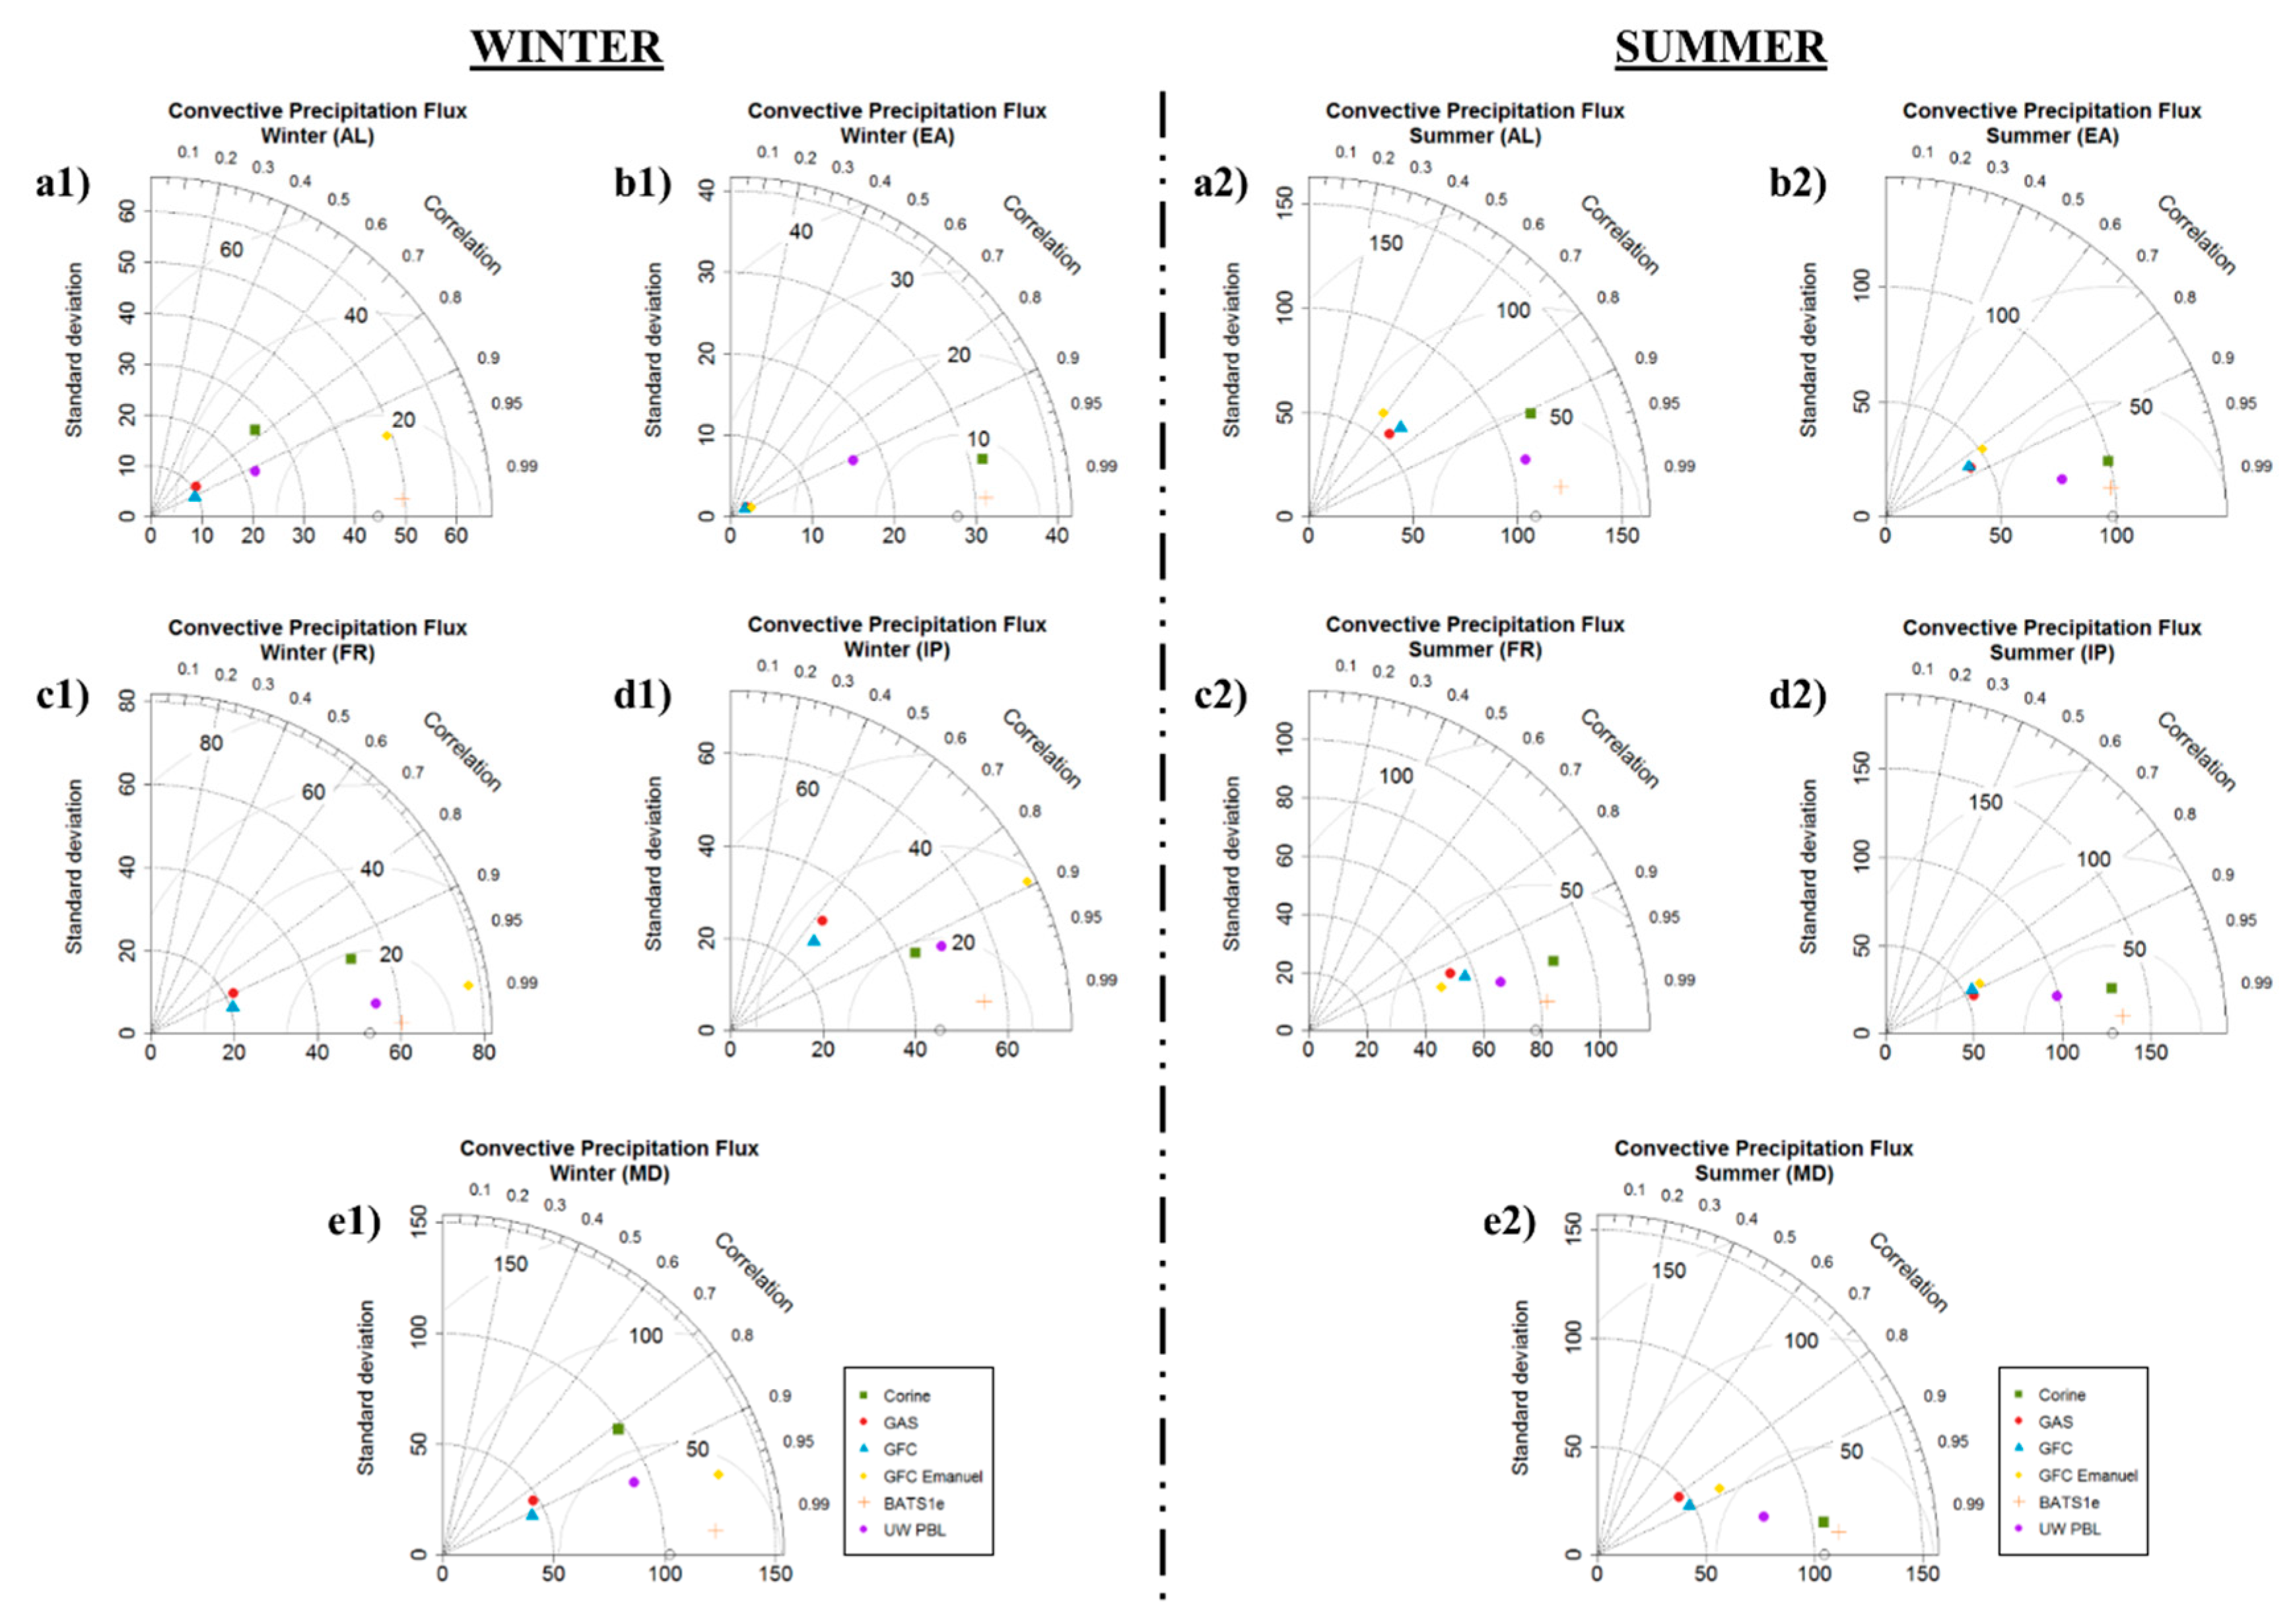
3.1. Precipitation (mm)
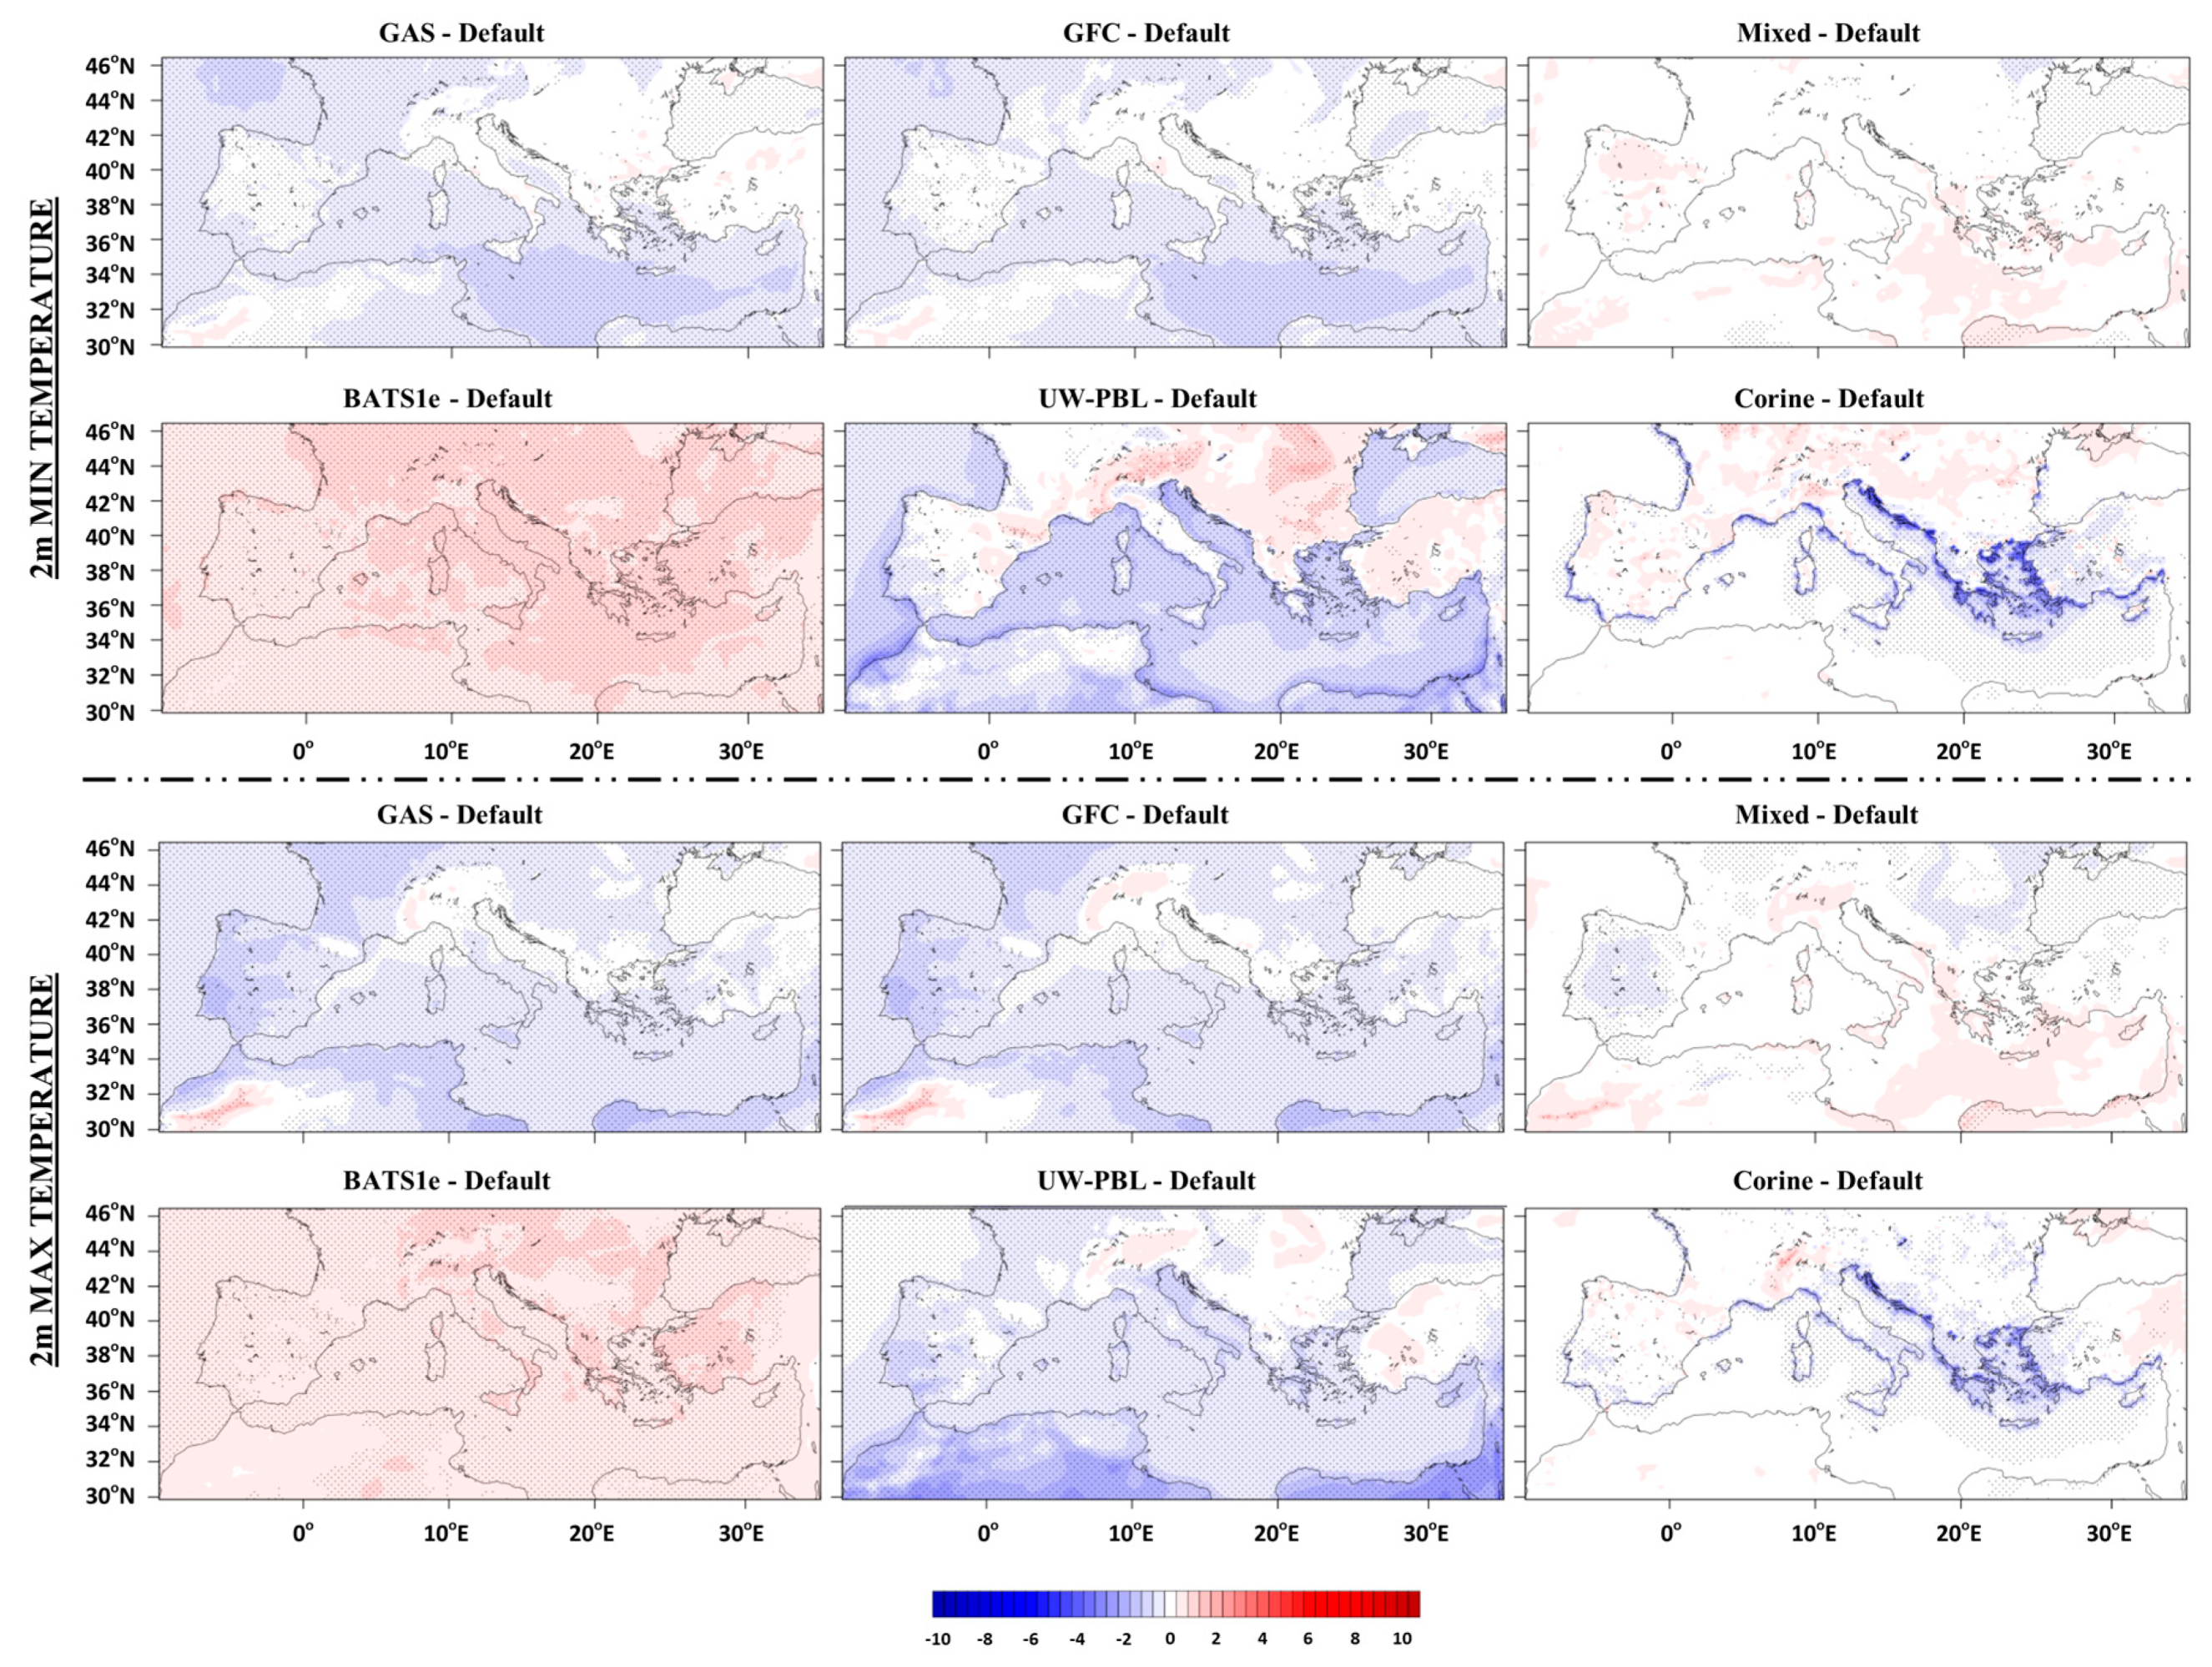
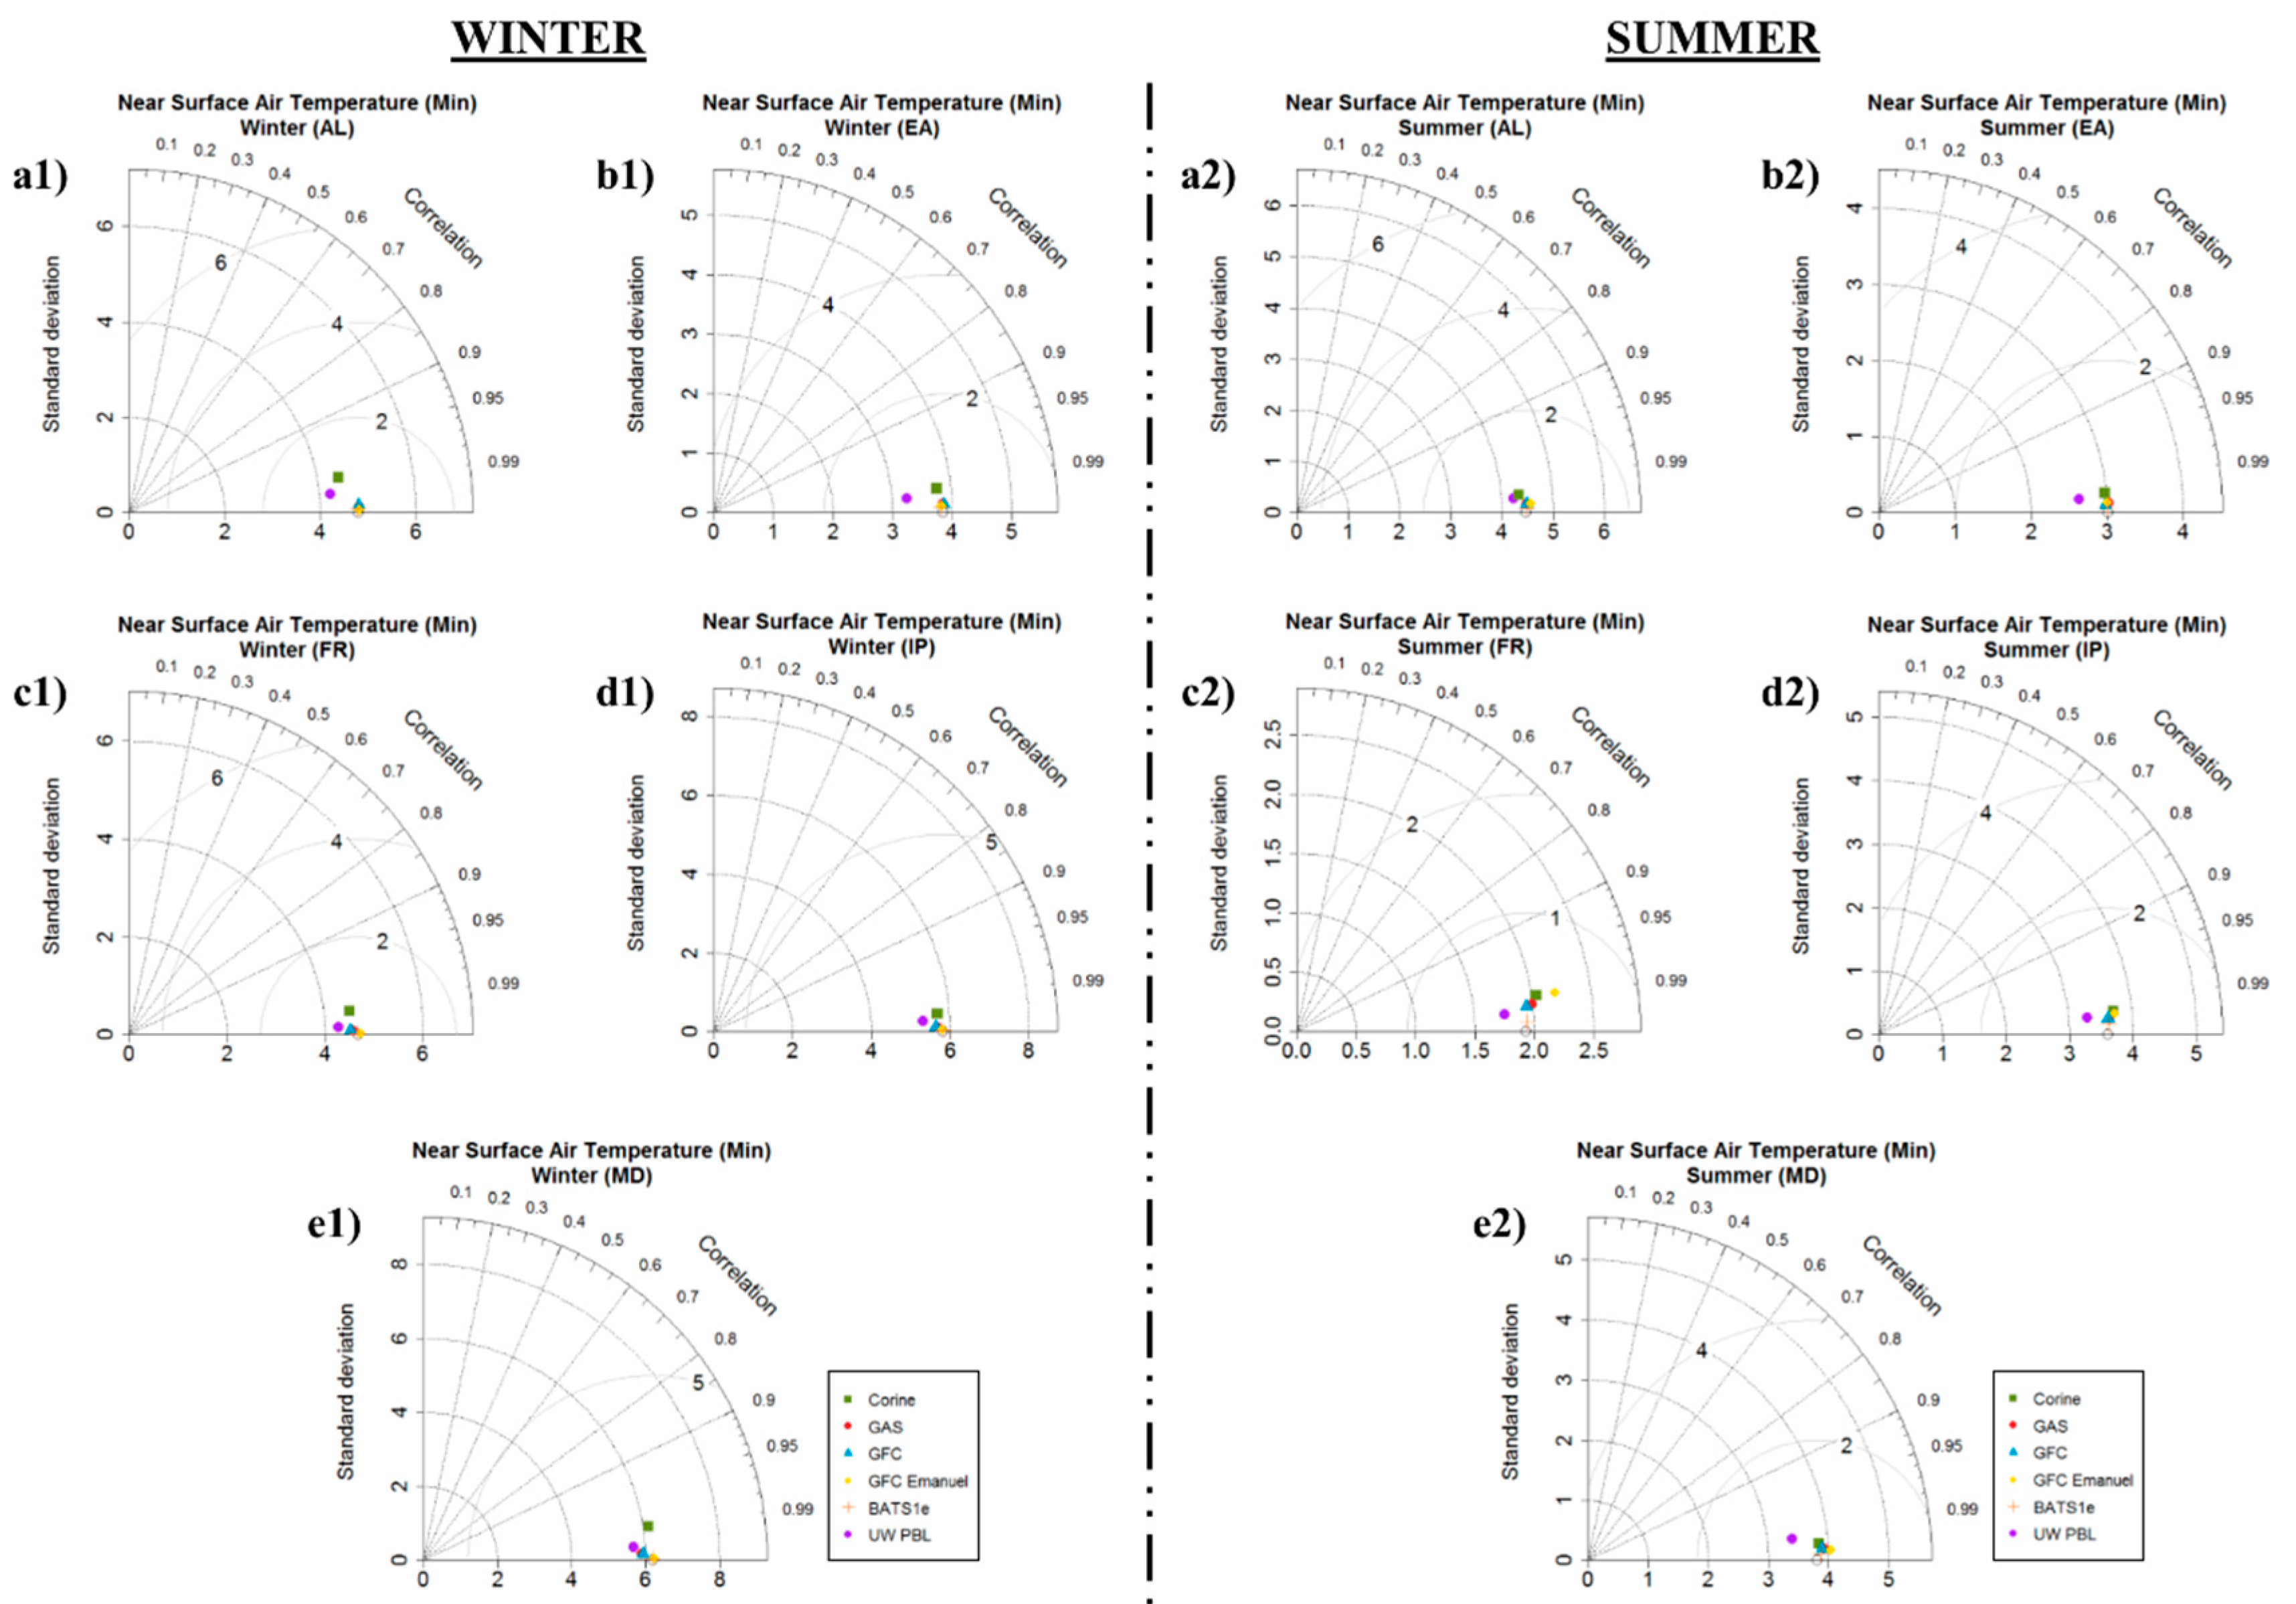
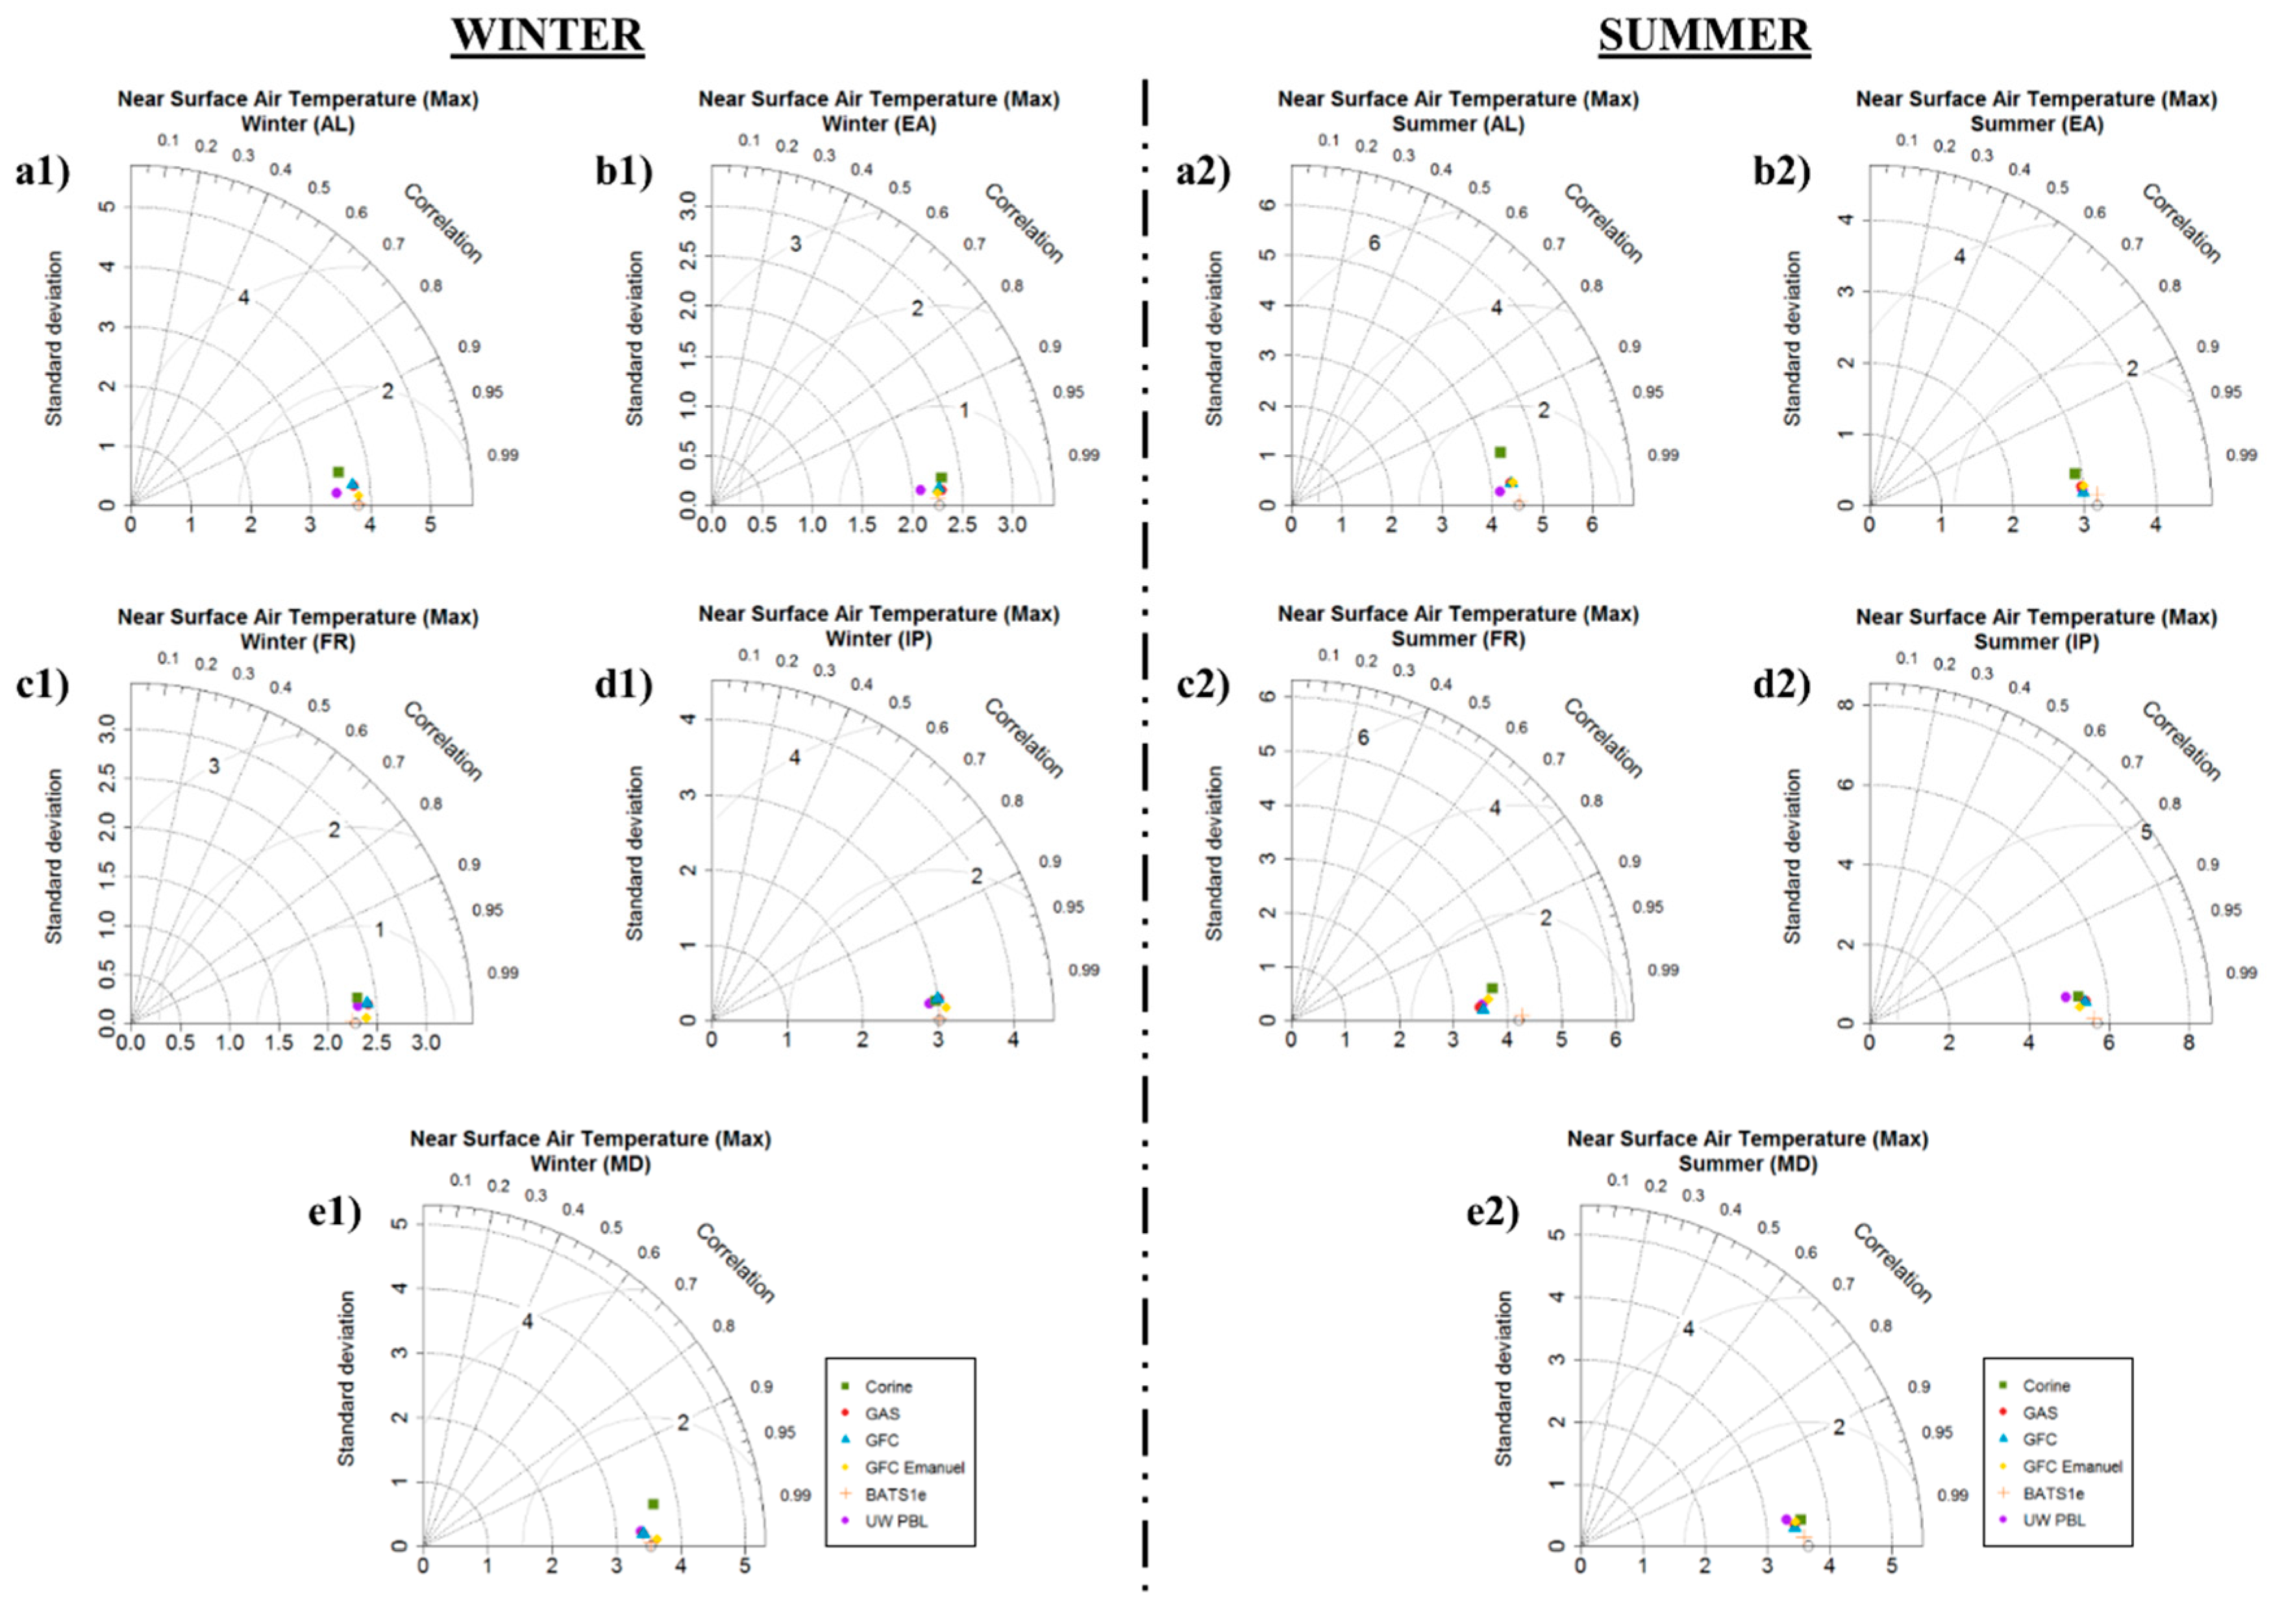
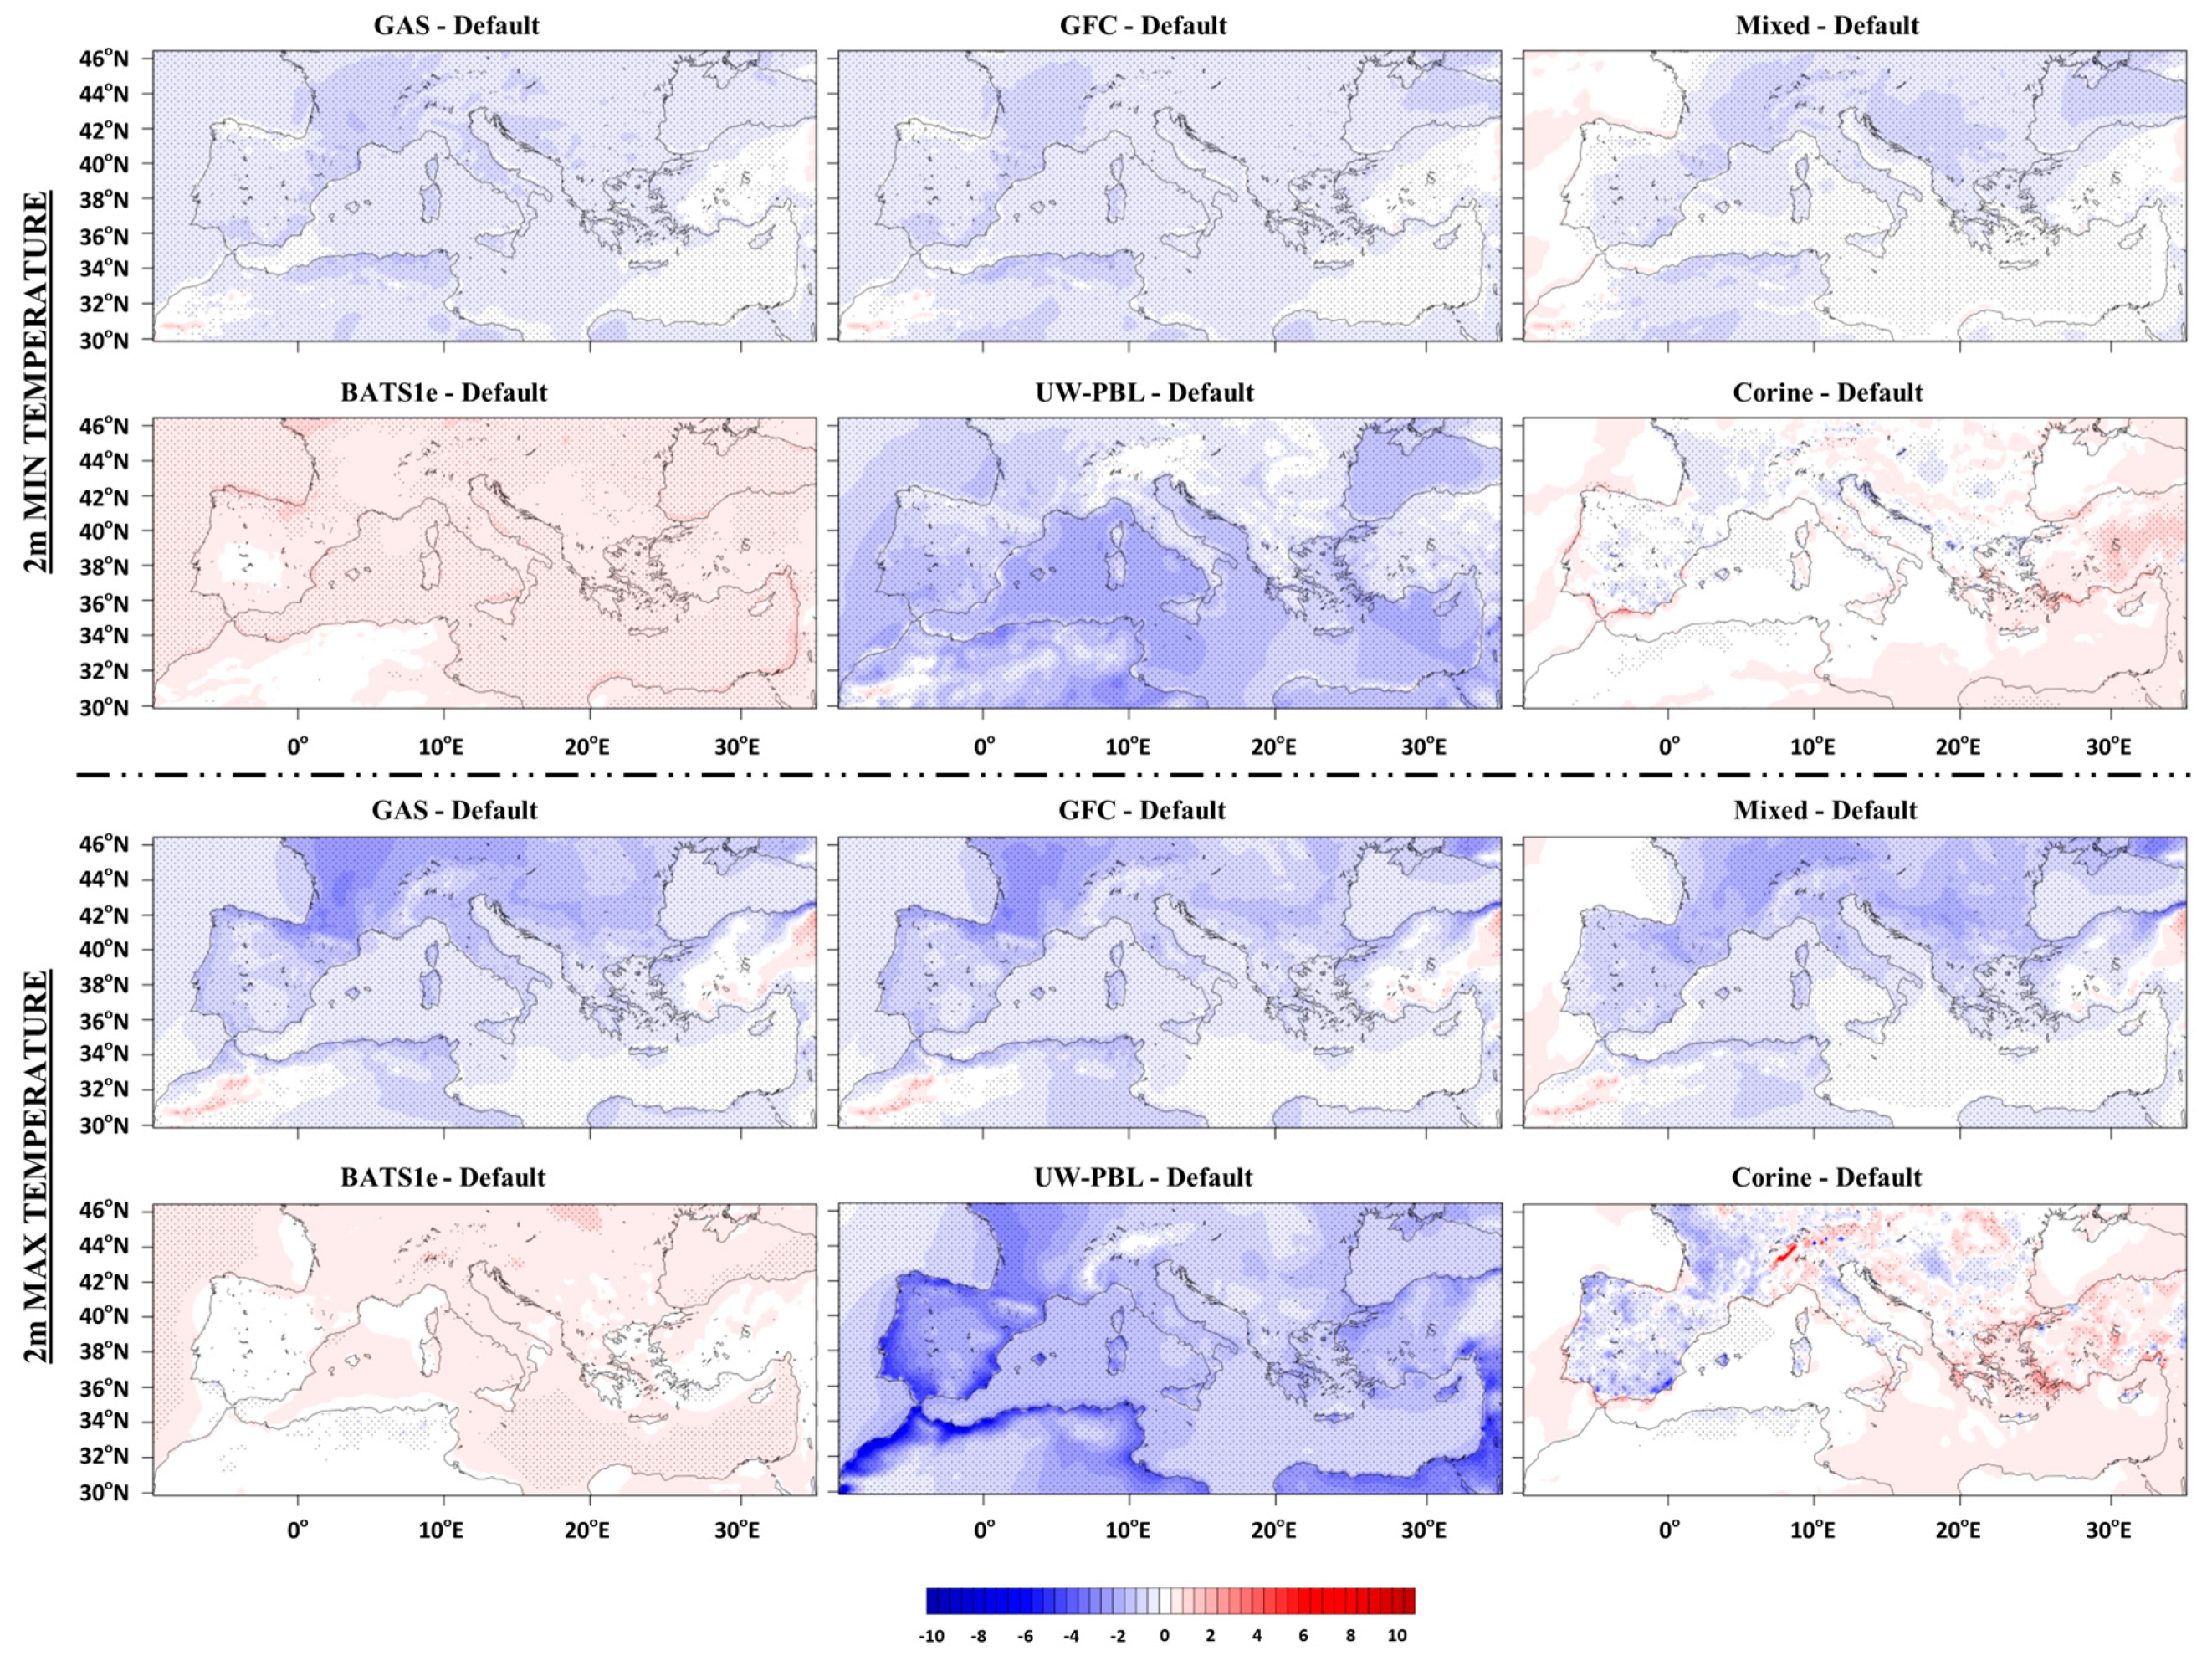
3.2. Near Surface (2 m) Temperature (°C)
4. Conclusions
Author Contributions
Acknowledgments
Conflicts of Interest
References
- NASA Science: Climate Variability. Available online: https://science.nasa.gov/earth-science/oceanography/ocean-earth-system/climate-variability (accessed on 25 June 2017).
- Oke, T.R. Boundary Layer Climates, 2nd ed.; Routledge—Taylor & Francis Group e-Library: Abingdon Oxford, UK, 2002; 435p. [Google Scholar]
- The Environmental Literacy Council: Land Use Changes & Climate. Available online: https://enviroliteracy.org/air-climate-weather/climate/land-use-changes-climate/ (accessed on 25 June 2017).
- Zanis, P.; Douvis, C.; Kapsomenakis, I.; Kioutsioukis, I.; Melas, D.; Pal, J.S. A sensitivity study of the Regional Climate Model (RegCM3) to the convective scheme with emphasis in central eastern and southeastern Europe. Theor. Appl. Climatol. 2009, 97, 327–337. [Google Scholar] [CrossRef]
- Martínez-Castro, D.; Porfirio da Rocha, R.; Bezanilla-Morlot, A.; Alvarez-Escudero, L.; Reyes-Fernández, J.P.; Silva-Vidal, Y.; Arritt, R.W. Sensitivity studies of the RegCM3 simulation of the summer precipitation, temperature and local wind field in the Caribbean Region. Theor. Appl. Climatol. 2006, 86, 5–22. [Google Scholar] [CrossRef]
- Güttler, I.; Branković, Č.; O’Brien, T.A.; Coppola, E.; Grisogono, B.; Giorgi, F. Sensitivity of the regional climate model RegCM4.2 to planetary boundary layer parameterization. Clim. Dyn. 2014, 43, 1753–1772. [Google Scholar] [CrossRef]
- Yan, Y.; Zheng-Hui, X. A simulation study on climatic effects of land cover change in China. Adv. Clim. Chang. Res. 2013, 4, 117–126. [Google Scholar] [CrossRef]
- Giorgi, F.; Marinucci, M.R.; Bates, G.T. Development of a second generation regional climate model (RegCM2). Part I: Boundary layer and radiative transfer processes. Mon. Weather Rev. 1993, 121, 2794–2813. [Google Scholar] [CrossRef]
- Giorgi, F.; Marinucci, M.R.; Bates, G.T.; DeCanio, G. Development of a second generation regional climate model (RegCM2). Part II: Convective processes and assimilation of lateral boundary conditions. Mon. Weather Rev. 1993, 121, 2814–2832. [Google Scholar] [CrossRef]
- Elguindi, N.; Bi, X.; Giorgi, F.; Nagarajan, B.; Pal, J.; Solmon, F.; Rauscher, S.; Zakey, A.; O’Brien, T.; Nogherotto, R.; et al. Regional Climate Model RegCM User Manual Version 4.4; International Centre for Theoretical Physics (ICTP): Trieste, Italy, 2014. [Google Scholar]
- Grell, G.A.; Dudhia, J.; Stauffer, D.R. A Description of the Fifth-Generation Penn State/NCAR Mesoscale Model (MM5); NCAR Technical Note, NCAR/TN-398+STR; NCAR-UCAR (National Center for Atmospheric Research): Boulder, CO, USA, 1994. [Google Scholar] [CrossRef]
- Kotlarski, S.; Keuler, K.; Christensen, O.B.; Colette, A.; Déqué, M.; Gobier, A.; Goergen, K.; Jacob, D.; Lüthi, D.; van Meijgaard, E.; et al. Regional climate modeling on European scales: A joint standard evaluation of the EURO-CORDEX RCM ensemble. Geosci. Model Dev. 2014, 7, 1297–1333. [Google Scholar] [CrossRef]
- Emanuel, K.A. A scheme for representing cumulus convection in large-scale models. J. Atmos. Sci. 1991, 48, 2313–2335. [Google Scholar] [CrossRef]
- Grell, G.A. Prognostic evaluation of assumptions used by cumulus parameterizations. Mon. Weather Rev. 1993, 121, 764–787. [Google Scholar] [CrossRef]
- Arakawa, A.; Schubert, W.H. Interaction of a cumulus cloud ensemble with large-scale environment, Part I. J. Atmos. Sci. 1974, 31, 674–701. [Google Scholar] [CrossRef]
- Fritsch, J.M.; Chappell, C.F. Numerical prediction of convectively driven mesoscale pressure systems. Part I: Convective parameterization. J. Atmos. Sci. 1980, 37, 1722–1733. [Google Scholar] [CrossRef]
- Fritsch, J.M.; Chappell, C.F. Numerical prediction of convectively driven mesoscale pressure systems. Part II: Mesoscale model. J. Atmos. Sci. 1980, 37, 1734–1762. [Google Scholar] [CrossRef]
- Holtslag, A.A.M.; de Bruijn, E.I.F.; Pan, H.L. A high resolution air mass transformation model for short-range weather forecasting. Mon. Weather Rev. 1990, 118, 1561–1575. [Google Scholar] [CrossRef]
- Grenier, H.; Bretherton, C.S. A moist PBL parameterization for large-scale models and its application to subtropical cloud-topped marine boundary layers. Mon. Weather Rev. 2001, 129, 357–377. [Google Scholar] [CrossRef]
- O’Brien, T.A.; Chuang, P.Y.; Sloan, L.C.; Faloona, I.C.; Rossiter, D.L. Coupling a new turbulence parameterization to the RegCM adds realistic stratocumulus clouds. Geosci. Model Rev. 2012, 5, 989–1008. [Google Scholar] [CrossRef]
- Zeng, X.; Zhao, M.; Dickinson, R.E. Intercomparison of bulk aerodynamic algorithms for the computation of sea surface fluxes using TOGA COARE and TAO data. J. Clim. 1998, 11, 2628–2644. [Google Scholar] [CrossRef]
- Heymann, Y.; Steemans, C.; Lenco, M.; Wyatt, B.; Weber, J.L.; O’Brien, C.; Cornaert, M.H.; Sifakis, N. CORINE Land Cover—Technical Guide; European Commission: Luxembourg, 1994; 136p. [Google Scholar]
- Bossard, M.; Feranec, J.; Otahel, J. CORINE Land Cover Technical Guide—Addendum 2000; Technical Report No. 40; European Environment Agency (EEA): Copenhagen, Denmark, 2000; 105p. [Google Scholar]
- Dickinson, R.E.; Henderson-Sellers, A.; Kennedy, P.J. Biosphere-Atmosphere Transfer Scheme (BATS) Version 1e as Coupled to the NCAR Community Climate Model; NCAR Technical Note, NCAR/TN-387+STR; NCAR-UCAR (National Center for Atmospheric Research): Boulder, CO, USA, 1993. [Google Scholar] [CrossRef]
- Giorgi, F.; Bi, X.; Qian, Y. Indirect vs. Direct effects of anthropogenic sulfate on the climate of East Asia as simulated with a regional coupled climate-chemistry/aerosol model. Clim. Chang. 2003, 58, 345–376. [Google Scholar] [CrossRef]
- Wilks, D.S. Statistical Methods in Atmospheric Sciences, 3rd ed.; Elsevier Academic Press: San Diego, CA, USA, 2011; 676p. [Google Scholar]
- Taylor, K.E. Summarizing multiple aspects of model performance in a single diagram. J. Geophys. Res. 2001, 106, 2156–2202. [Google Scholar] [CrossRef]
- Yan, Y.; Zheng-Hui, X. A simulation study on climatic effects of land cover change in China. Adv. Clim. Chang. Res. 2013, 4, 117–126. [Google Scholar] [CrossRef]


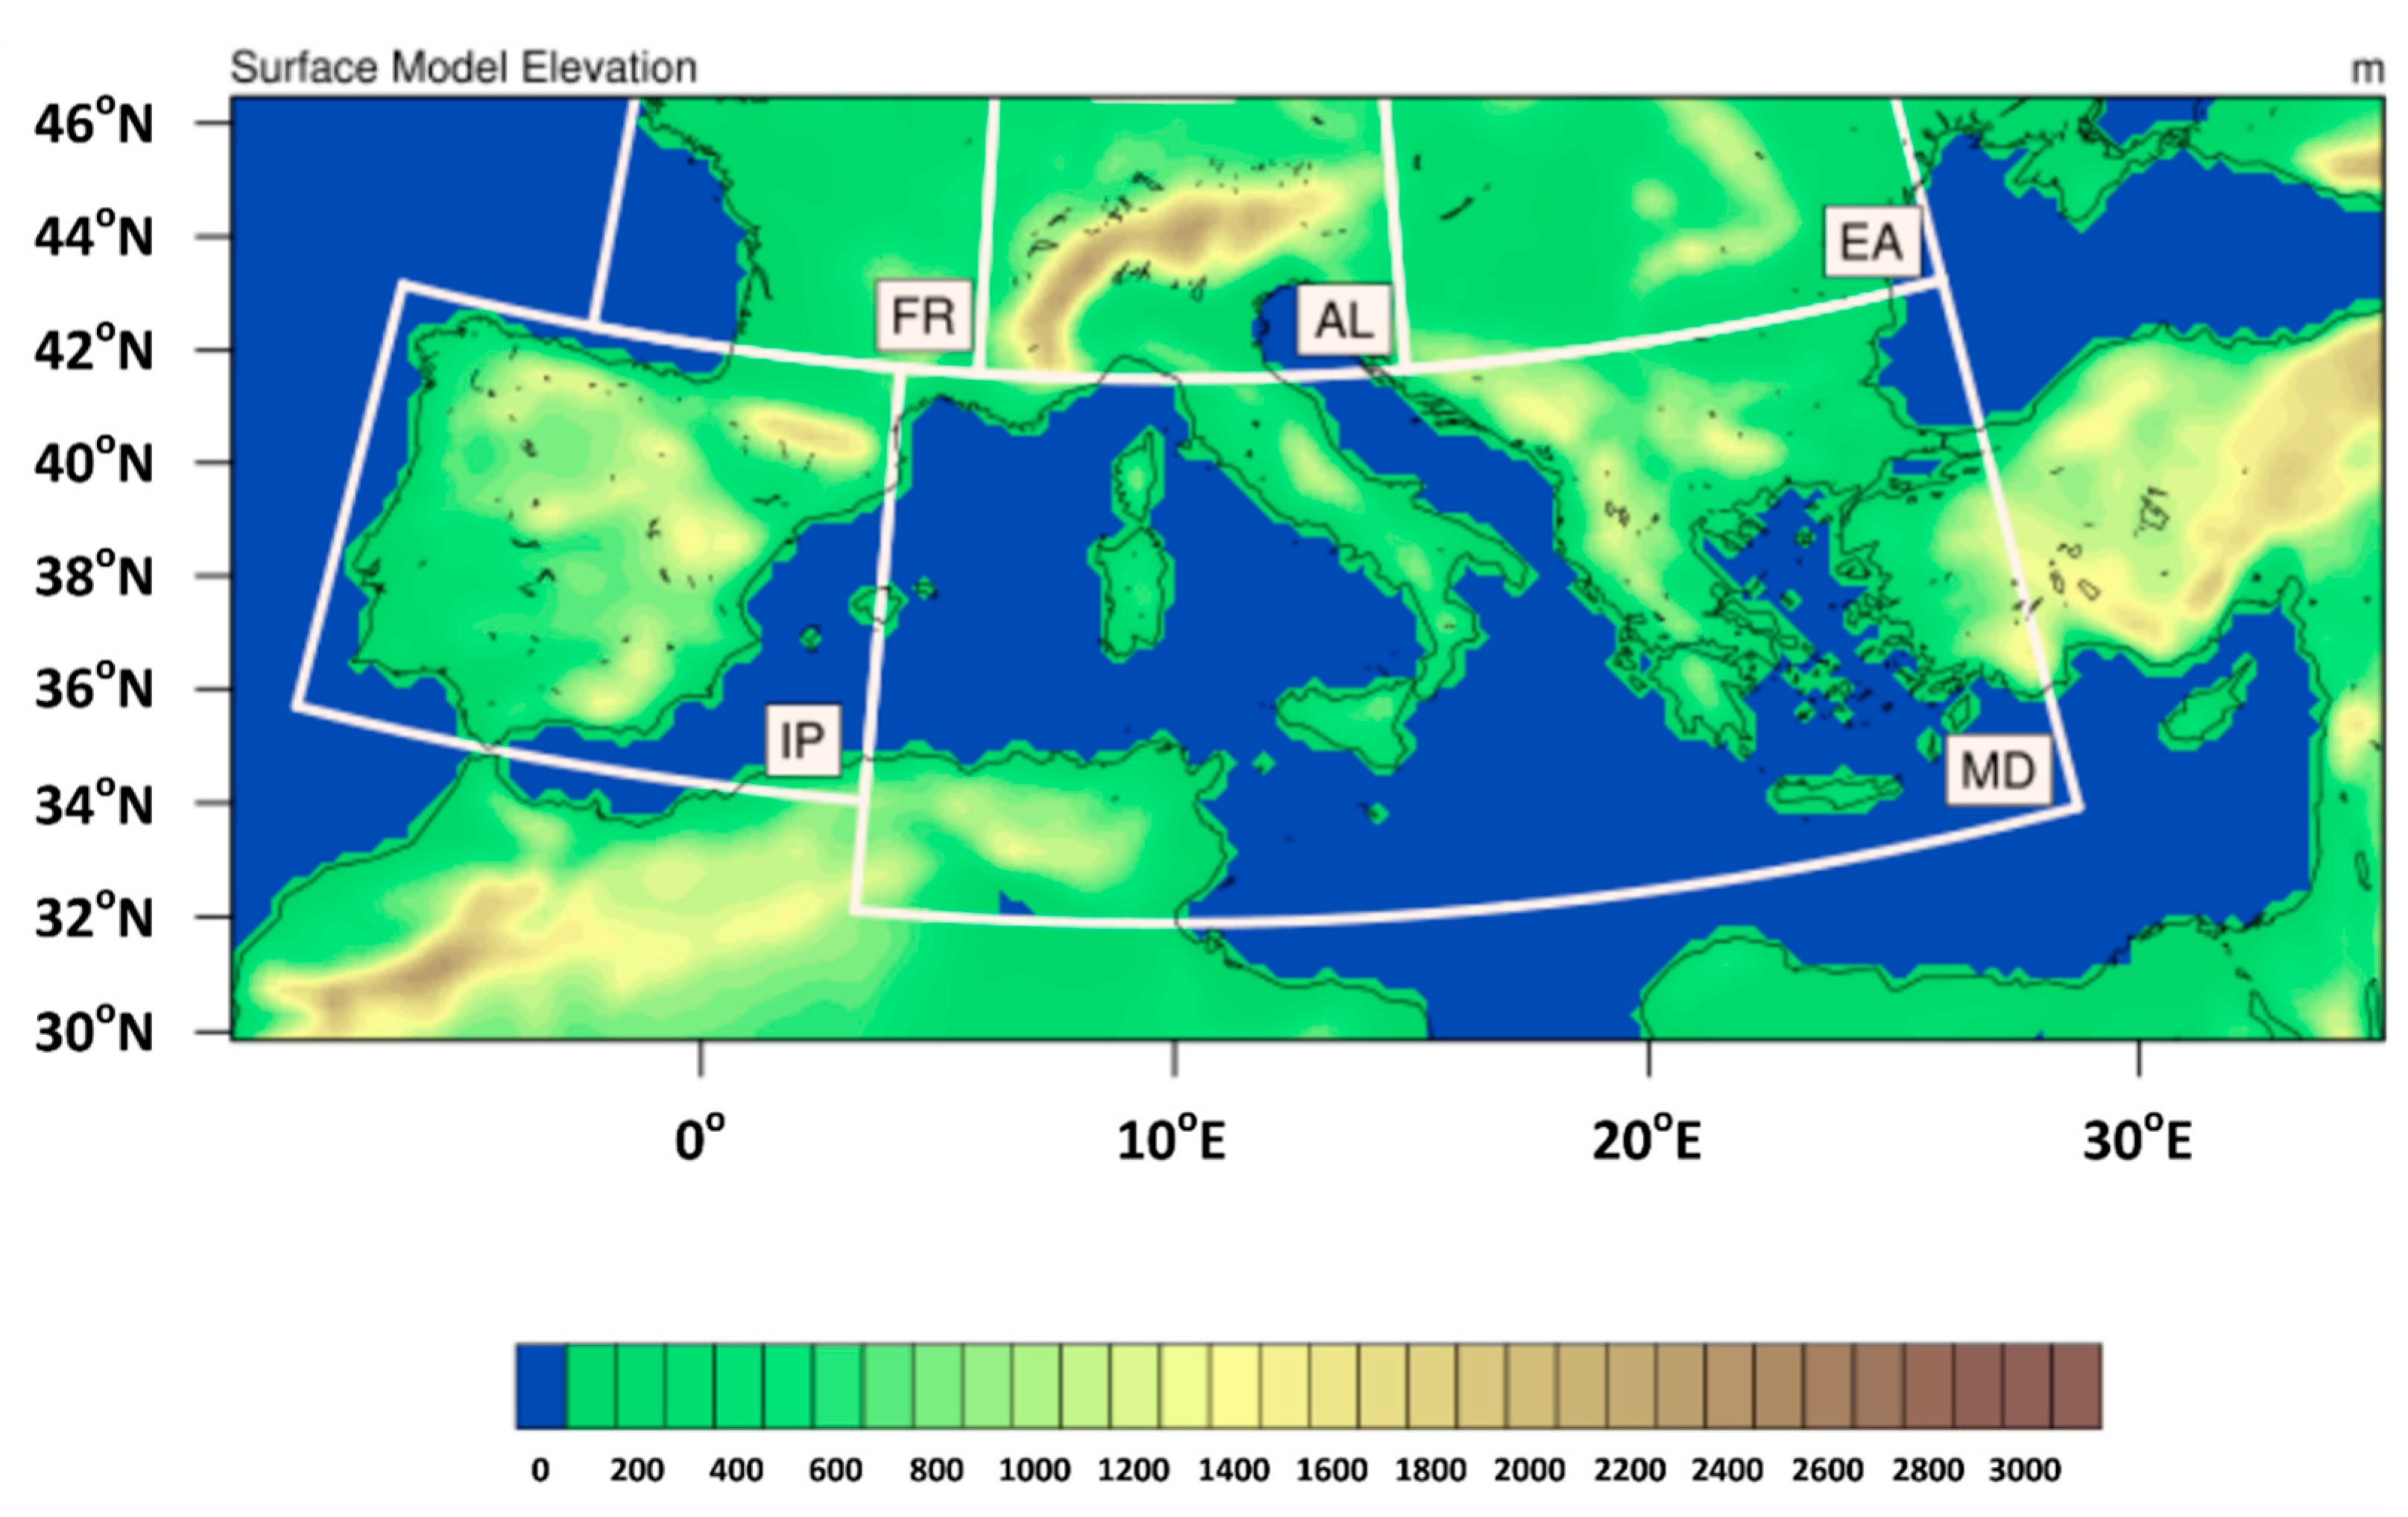
| Abbreviation | Area |
|---|---|
| AL | The Alps and the surrounding area |
| EA | The part of Eastern Europe |
| FR | The wider France region |
| IP | The Iberian Peninsula |
| MD | The greatest part of the Mediterranean Sea, Italy, Greece, the Balkans and southwestern Turkey |
| Default | |
|---|---|
| Driving Field | ERAINT |
| Cumulus Scheme | MIT-Emanuel |
| Convective Closure Scheme | - |
| Planetary Boundary Layer Scheme | Holtslag PBL |
| Ocean Flux Scheme | Zeng et al. |
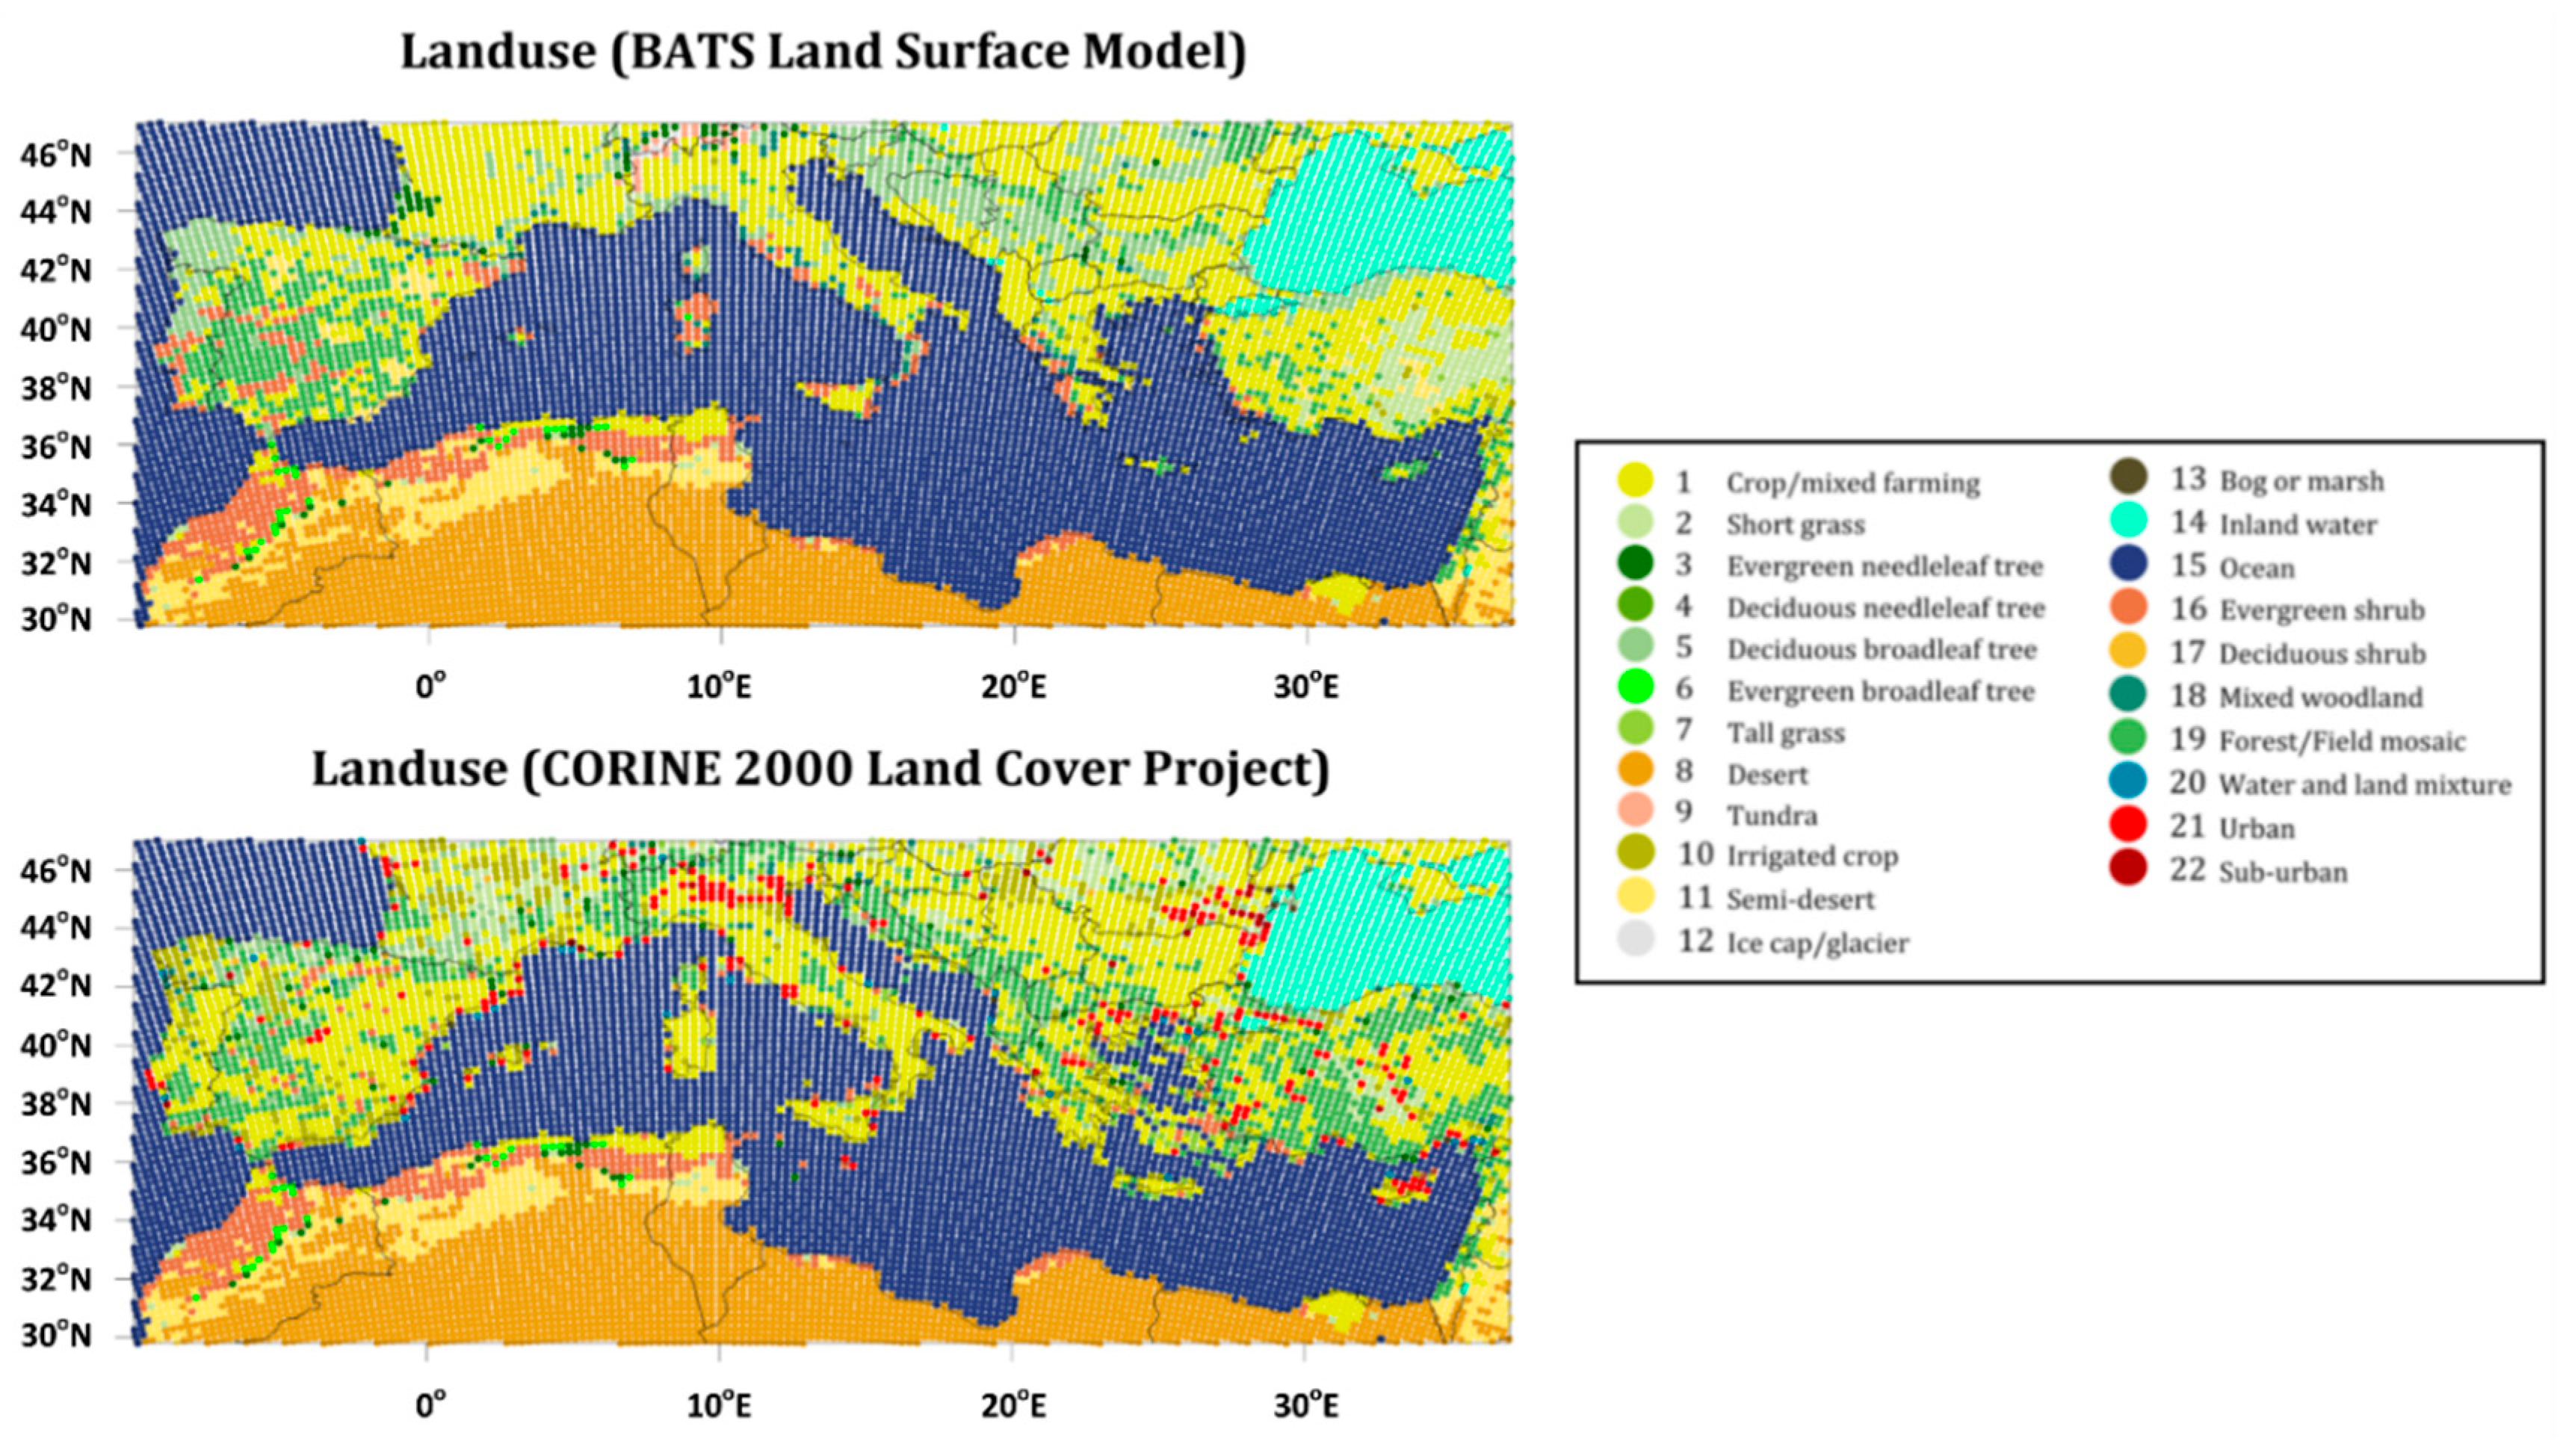
| Land Surface Model | BATS |
Publisher’s Note: MDPI stays neutral with regard to jurisdictional claims in published maps and institutional affiliations. |
© 2017 by the authors. Licensee MDPI, Basel, Switzerland. This article is an open access article distributed under the terms and conditions of the Creative Commons Attribution (CC BY) license (https://creativecommons.org/licenses/by/4.0/).
Share and Cite
Velikou, K.; Tolika, K. Evaluation of the Sensitivity of the Updated RegCM4 Model to Physics Parameterizations over the Mediterranean Region: Precipitation and Temperature Simulations. Proceedings 2017, 1, 112. https://doi.org/10.3390/ecas2017-04133
Velikou K, Tolika K. Evaluation of the Sensitivity of the Updated RegCM4 Model to Physics Parameterizations over the Mediterranean Region: Precipitation and Temperature Simulations. Proceedings. 2017; 1(5):112. https://doi.org/10.3390/ecas2017-04133
Chicago/Turabian StyleVelikou, Kondylia, and Konstantia Tolika. 2017. "Evaluation of the Sensitivity of the Updated RegCM4 Model to Physics Parameterizations over the Mediterranean Region: Precipitation and Temperature Simulations" Proceedings 1, no. 5: 112. https://doi.org/10.3390/ecas2017-04133