Low Cost Optical Electronic Nose for Biomedical Applications †


School of Engineering, University of Warwick, Coventry CV4 7AL, UK
*
Author to whom correspondence should be addressed.
†
Presented at the Eurosensors 2017 Conference, Paris, France, 3–6 September 2017.
Proceedings 2017, 1(4), 589; https://doi.org/10.3390/proceedings1040589
Published: 16 August 2017
(This article belongs to the Proceedings of Proceedings of Eurosensors 2017, Paris, France, 3–6 September 2017)
Abstract
:Here we report on the development of a Non-Dispersive Infrared Sensor (NDIR) optical electronic nose, which we intend to target towards healthcare applications. Our innovative electronic nose uses an array of four different tuneable infra-red detectors to analyse the gas/volatile content of a sample under test. The instrument has the facility to scan a range of wavelengths from 3.1 μm and 10.5 μm with a step size of 20 nm. The use of a tuneable filter, instead of expensive lasers, reduces the overall cost of the system. We have tested our instrument to a range of gases and vapours and our electronic nose is able to detect, for example, methane down to single figure ppm at two different wavelengths. It is also able to discriminate between complex odours, here we present the results from 6 different chemicals. In this case, fixed frequency measurements were used as “virtual sensors” and their output then analysed by (PCA), which for all but one case, showed good separation.
1. Introduction
The electronic nose (eNose) has been in continuous development since its invention is the early 1980s [1,2]. It typically employs an array of sensors with overlapping sensitivities to create an olfactory map of a complex odour and, by using some form of pattern recognition technique, is easily able to discriminate samples with different olfactory maps. These instruments have been deployed in broad range of applications, however more recently there has been a greater focus on healthcare applications—investigating gas phase biomarkers that emanate from biological samples (be it urine, stool, breath, sweat or blood). The number of diseases investigated is considerable and vary from cancers (e.g., brain, colorectal and breast) to asthma and eye infections. This interest arises from the eNoses ability to be non-invasive, point of care, can be produced at price point appropriate for the medical profession and can give a real-time answer. Our research group have previous reported on the efficacy of this approach in detecting and monitoring a variety of gastroenterological and metabolic disorders [3,4].
The majority of previously reported eNose instruments rely on metal-oxide (MOX) or conducting polymer (CP) resistive sensors, though many others exist. However, MOX and CP sensors can suffer from drift and poor repeatability. For this reason, we are investigating and developing an optical based eNose, using a non-dispersive infrared detection approach.
2. Materials and Methods
Warwick Optical Electronic Nose
At the centre of our optical eNose is an array of four optical tuneable detectors, covering the mid and long wave infrared range (IR—3.1 to 10.5 μm) [5]. These tuneable sensors have micromachined Fabry-Pérot-Interferometer structures on top, which employ two parallel reflectors [5,6]. The optical filter’s central wavelength is simple tuned by varying the voltage on a control pin [6]. The optical tuneable filter sensors used in our eNose are listed in Table 1.
The principle detection method used here is similar to conventional NDIR and is based on the molecular absorption of IR and a subsequent fall in detected signal. This can be partially related to molecular groups as different chemical structures absorb specific IR frequencies. The number of photons absorbed is directly proportional to the power of the photon beam from the emitter and thus amount of the gas/vapour detected.
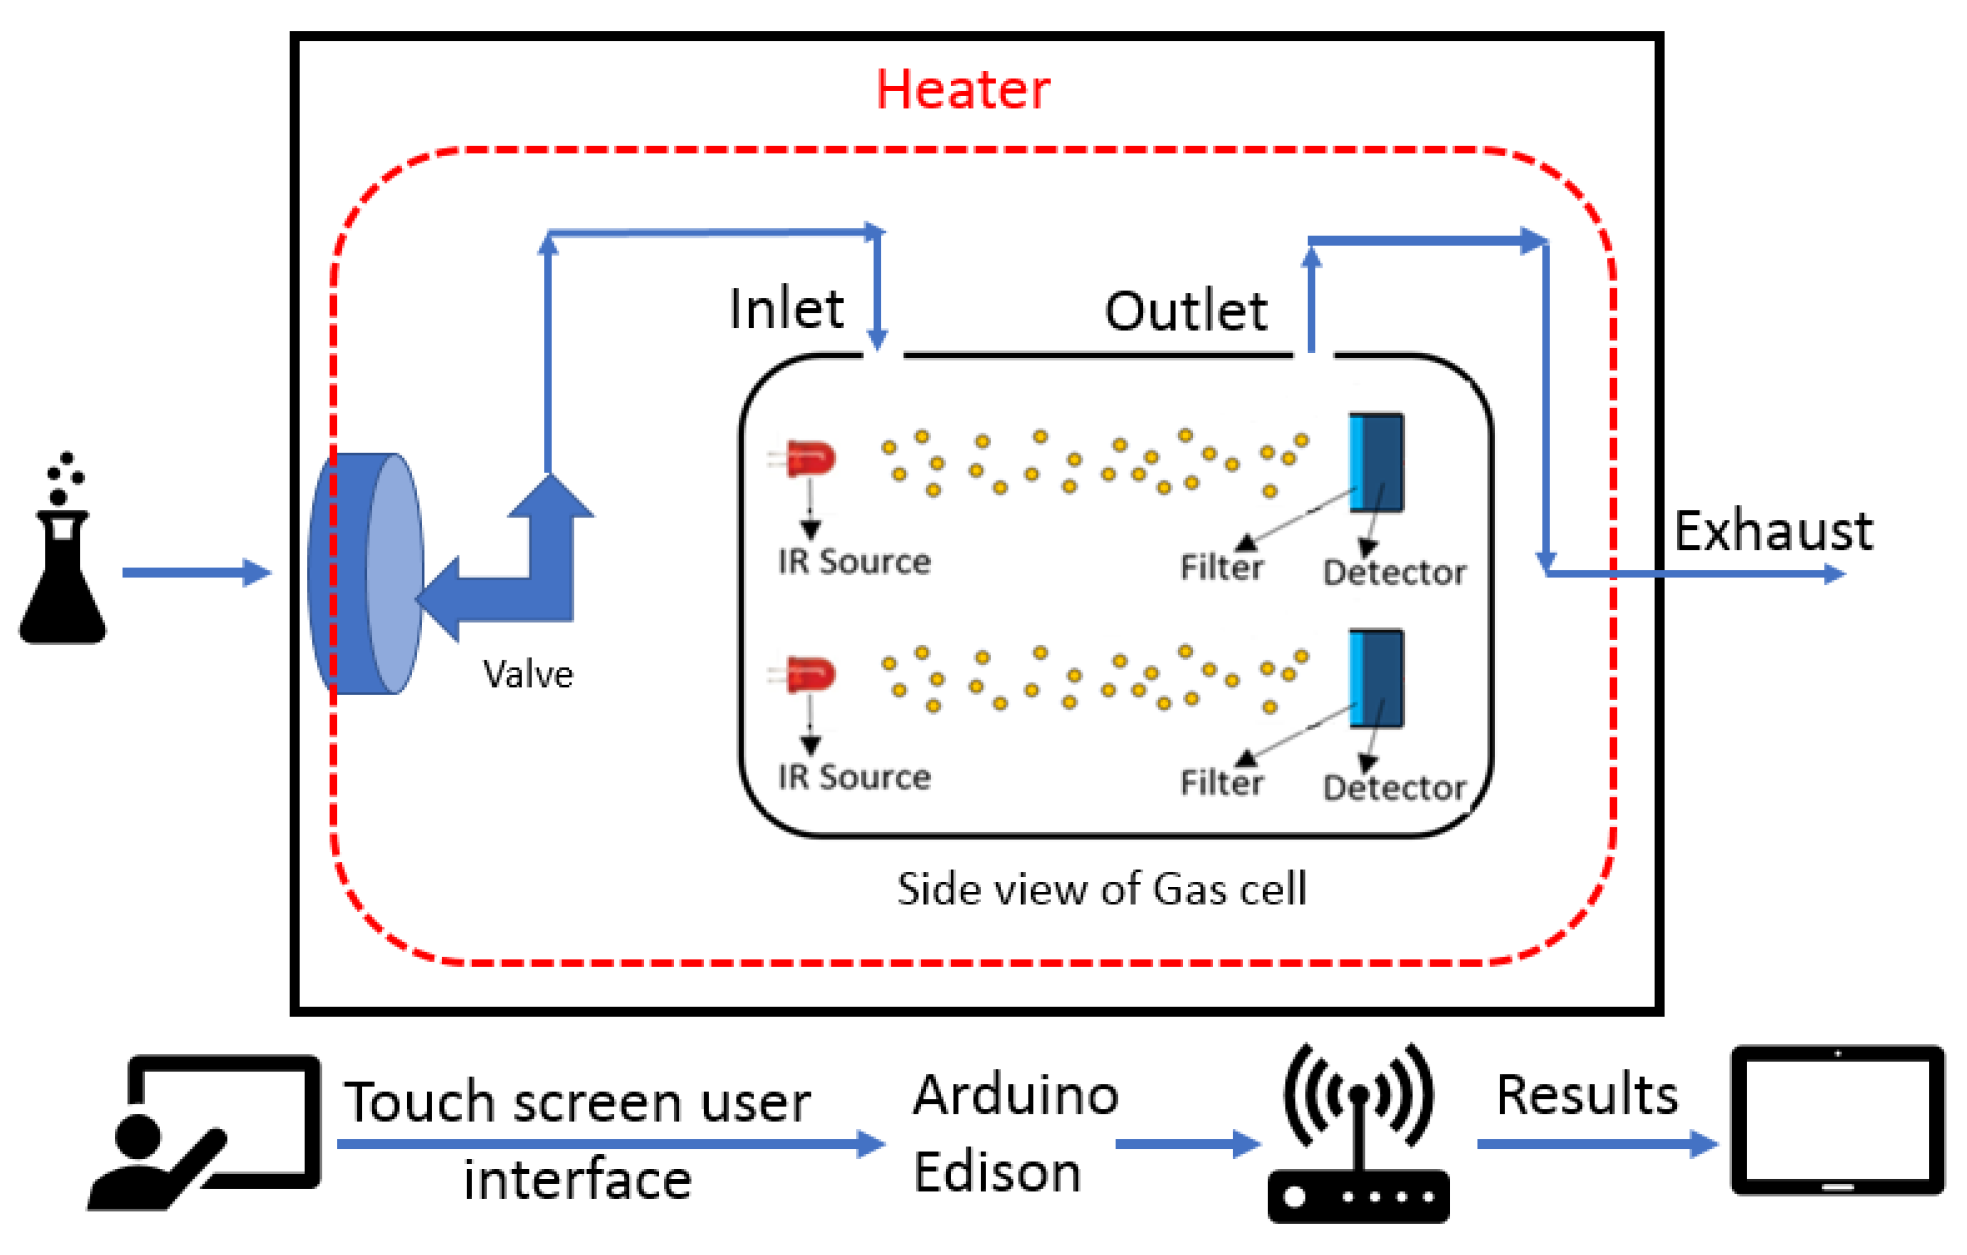
Our instrument comprises of four high emissivity (EMIRS200) thermal infrared emitters aligned to the four detectors—all fitted into a single chamber 30 cm long. The chamber is made from stainless steel and was wrapped with nichrome wire and heat insulator. Within the chamber a SHT75 (Sensirion) temperature and humidity sensor is fitted to provide feedback for the environmental control of the chamber. The system is controlled by touch screen and the whole system operates using Arduino Edison. Figure 1 gives an overview of the instrument.
The tuneable detector output of this system can be used to create “virtual sensors” as would be available in a more traditional eNose. In the current system, up to 10 frequency readings can be acquired per optical detector, to create a sensor array formed of 33 sensors, between 3.1 and 10.5 μm. As the filters can be tuned to the nearest 20 nm, the frequencies chosen for these virtual sensors does require method development. In the examples shown here, we have tested our system to a single gas type (methane), followed by simple chemicals, acetone, ethanol and isopropanol—some of which are known clinically relevant biomarkers. Finally, we have evaluated if the system could discriminate food groups (cola, orange juice and coffee).
3. Results
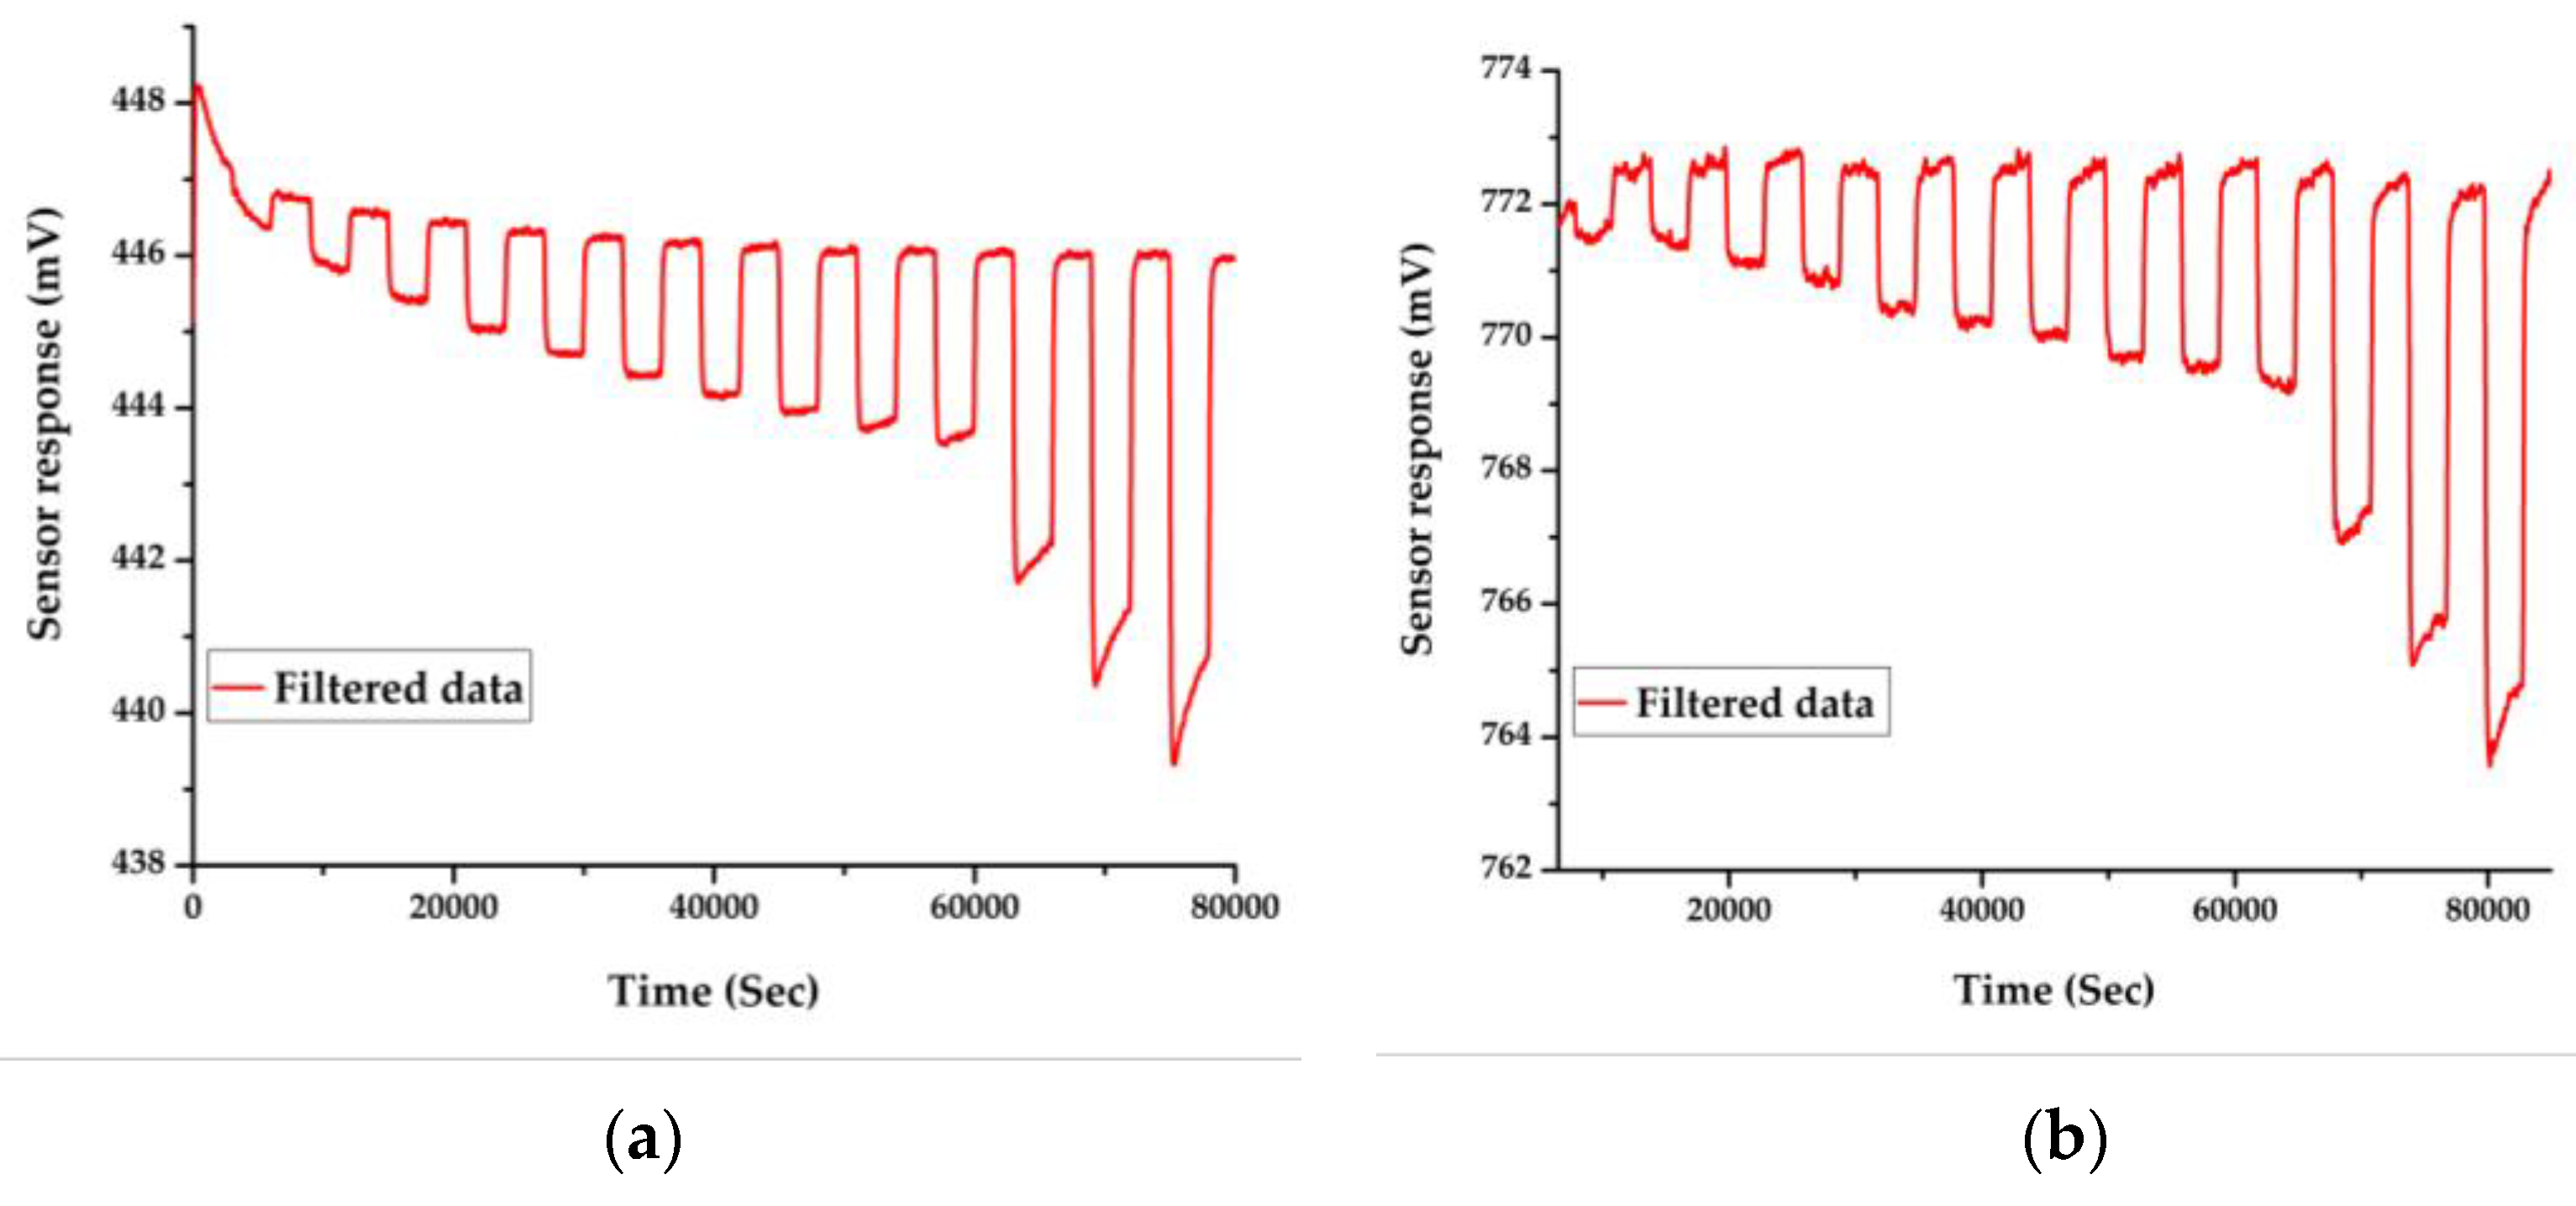
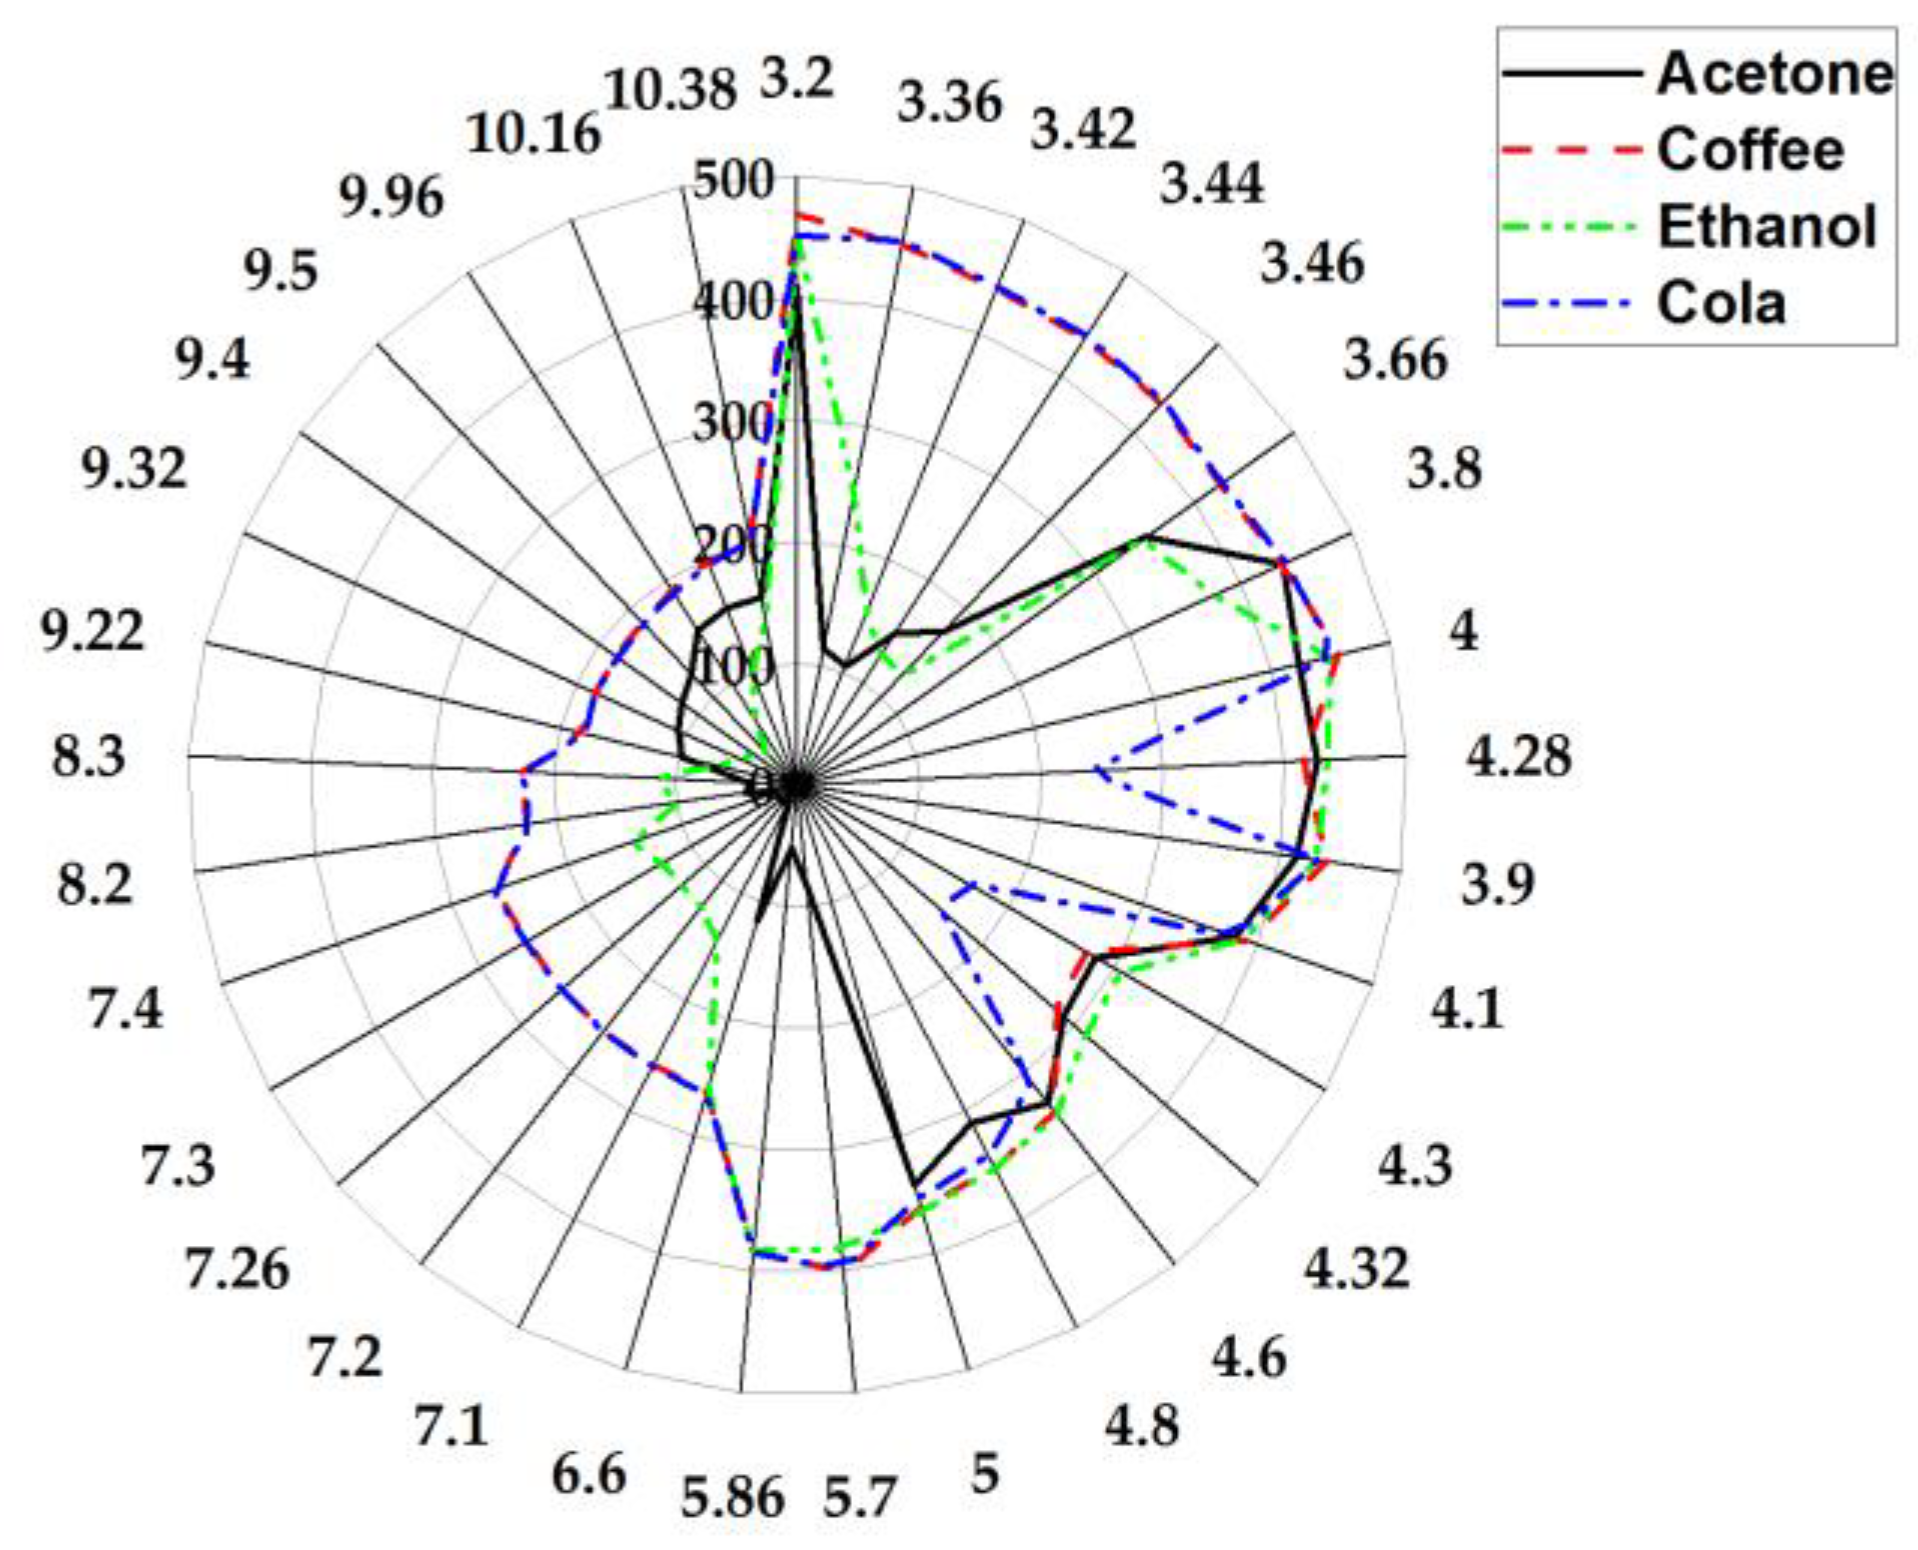
Initial testing was undertaken using CH4 at a concentration range from 0 to 100 ppm. The concentration of CH4 was increased linearly from 2.5 ppm to 25 ppm in 2.5 ppm steps, additionally 50 ppm, 75 ppm and 100 ppm were tested along with zero air as a baseline measurement. There was an exposure and recovery time of 25 min for each concentration step. Two different frequencies were used to show off the system’s ability to simultaneously measure the output from multiple sensors (7.88 μm and 3.4 μm) and the results are shown in Figure 2. The results indicate that the sensitivity to methane will be below 1 ppm. Once completed, the system was tested to a range of different single chemicals and complex odours. A subset of these results are shown in Figure 3, where the maximum change on detector output is provided at a range of different frequencies.
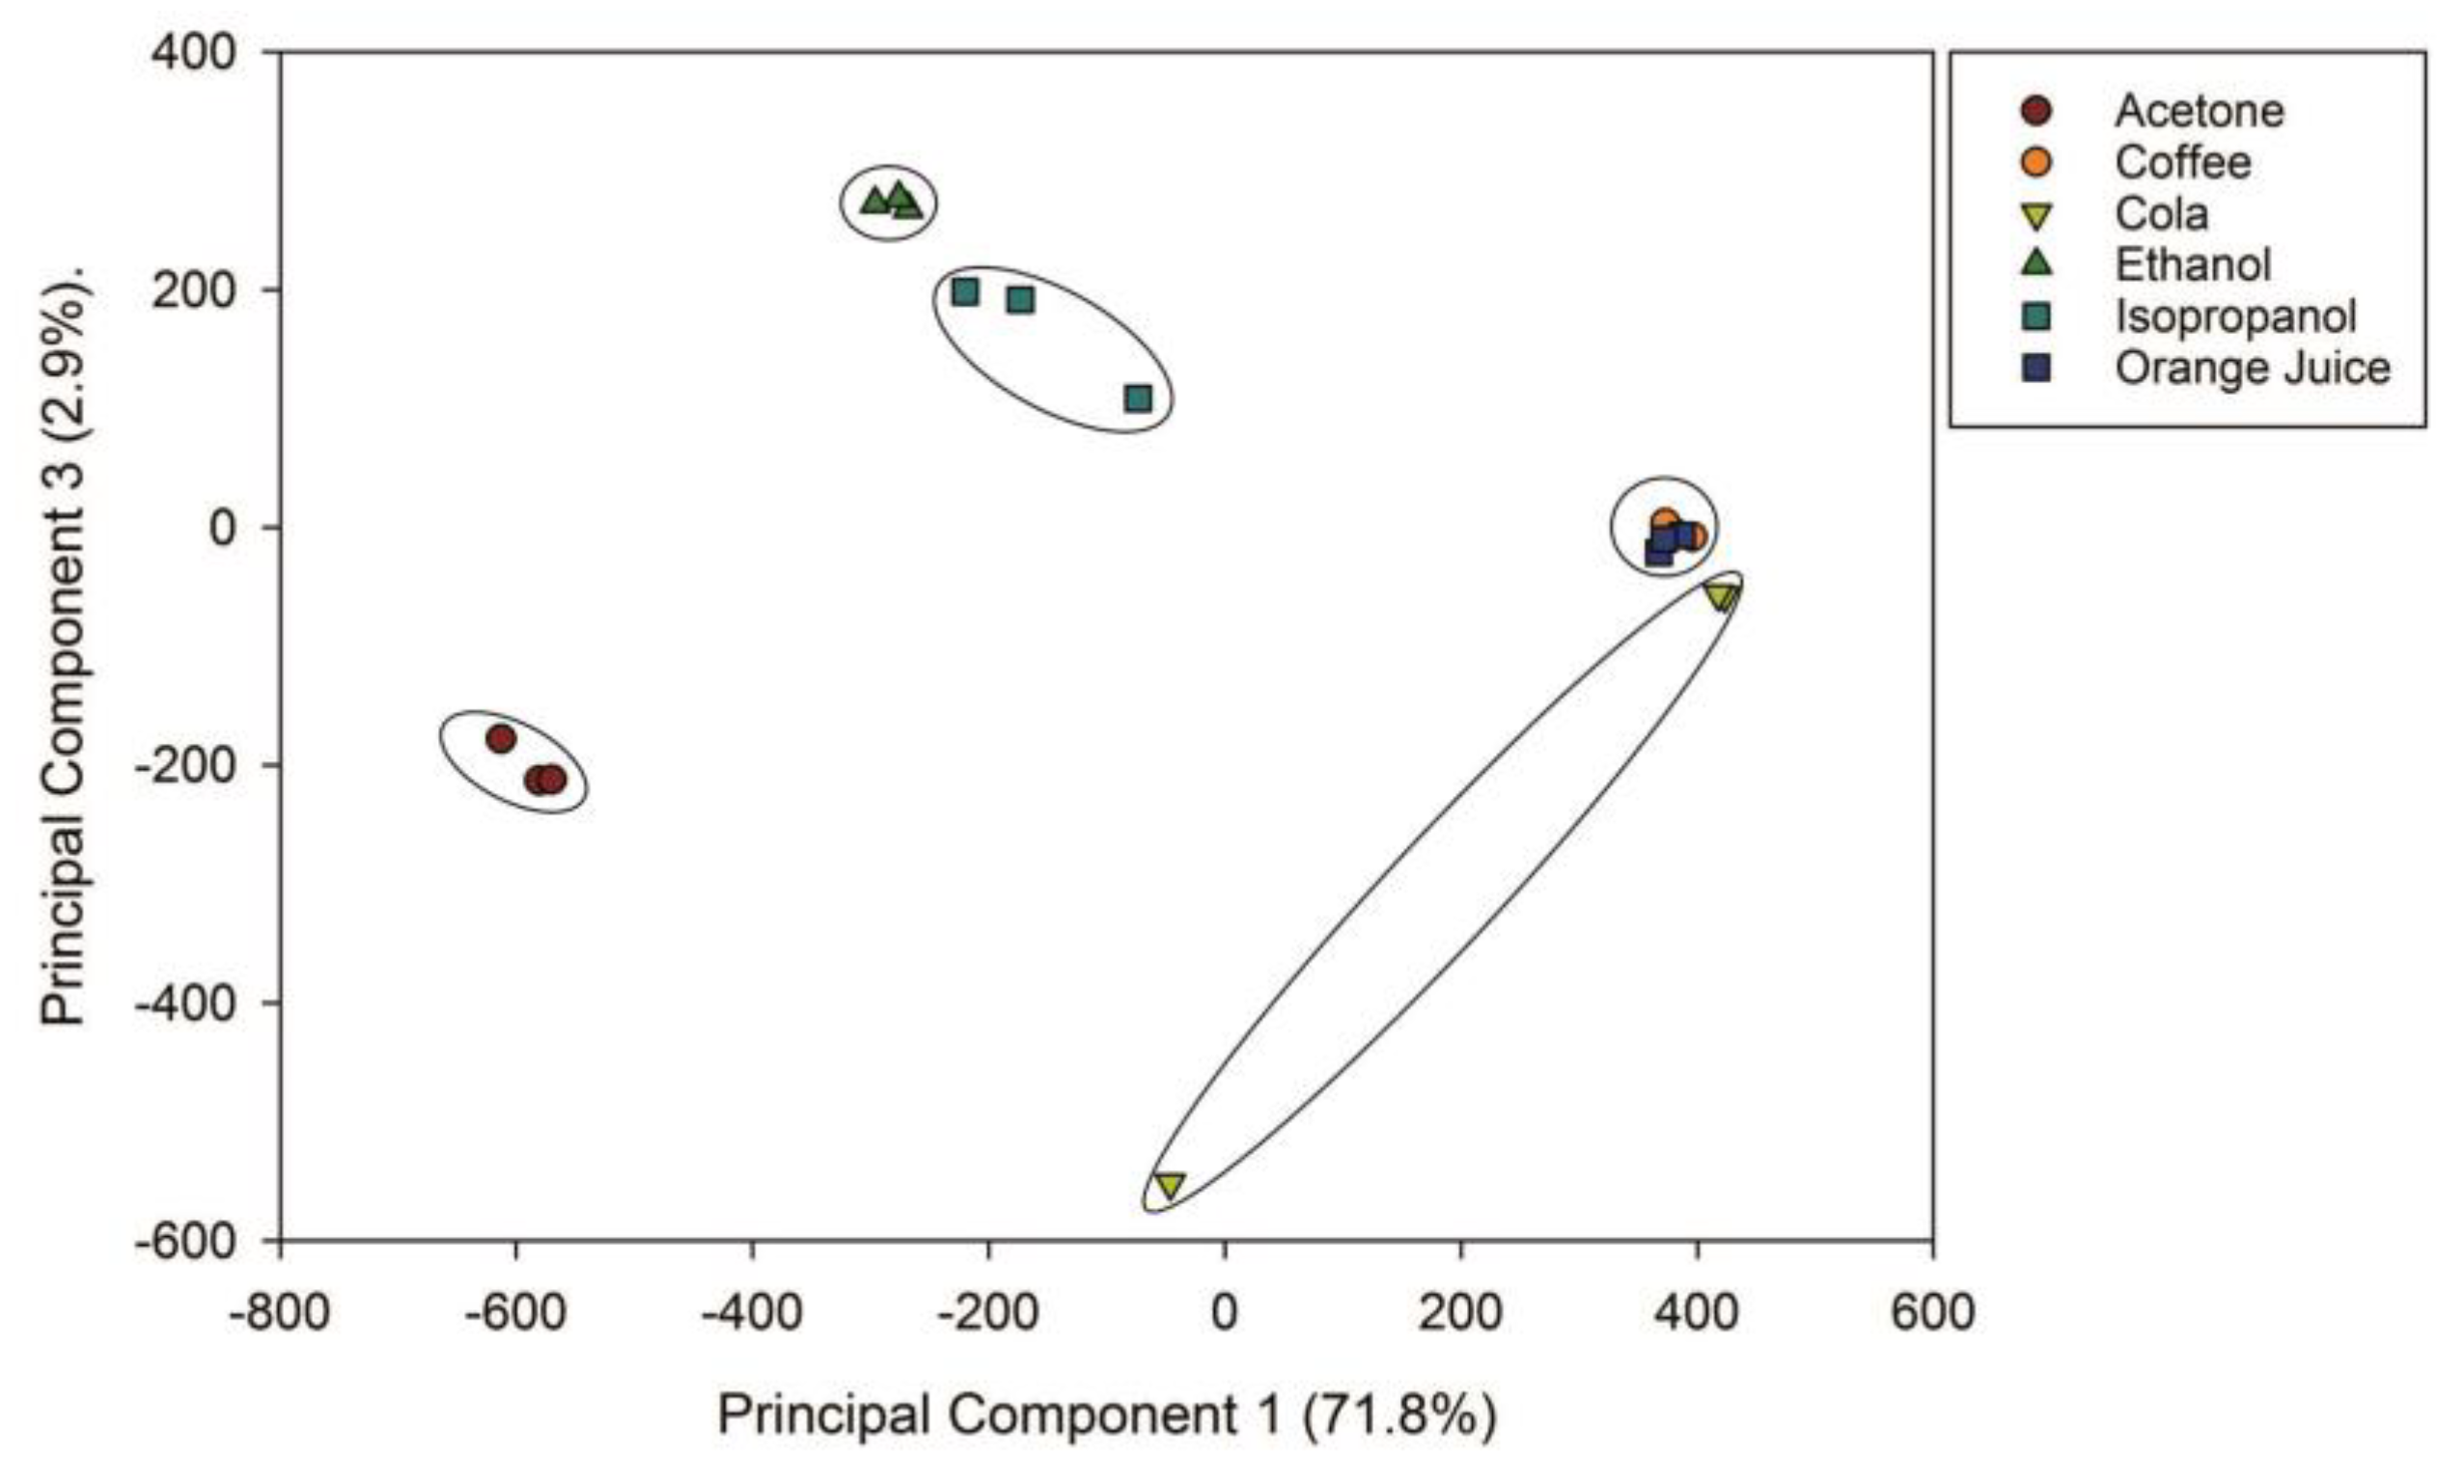
A common data analysis approach was applied, where features were extracted from the raw data, based on the maximum voltage drop of the sensor at a predefined wavelength. After these features were extracted, principle component analysis (PCA) was applied. Figure 4, shows a classification of the 6 different classes of samples. Since Isopropanol and ethanol are from the same family of chemicals, they are close to each other in this classification. The results also indicate that cola gave the biggest variation amongst all the samples and that acetone, isopropanol and ethanol are well separated.
4. Discussion & Conclusions
In this paper, we report on an optical based electronic nose based on an array of NDIR detectors. The results indicate that for methane the sensitivity is well below 1 ppm and this sensitivity can be achieved at more than one wavelength. Further testing shows that our system is able to separate more complex vapours and food groups, including acetone and ethanol. Many of the chemicals used here are known biomarkers for different diseases and we believe our optical based electronic nose may provide a simple, selective means to detect these chemicals. The use of an optical tuned filter system has the potential to provide a high dimensional dataset about a sample that could aid in discriminating/identifying disease conditions.
Conflicts of Interest
The authors declare no conflict of interest.
References
- Pelosi, P.; Persaud, K. Gas sensors: Towards an artificial nose. In Sensors and Sensory Systems for Advanced Robots; Springer: Berlin/Heidelberg, Germany, 1988; pp. 361–381. [Google Scholar]
- Persaud, K.; Dodd, G. Analysis of discrimination mechanisms in the mammalian olfactory system using a model nose. Nature 1982, 299, 352–355. [Google Scholar] [CrossRef] [PubMed]
- Arasaradnam, R.P.; Ouaret, N.; Thomas, M.G.; Quraishi, N.; Heatherington, E.; Nwokolo, C.U.; Bardhan, K.D.; Covington, J.A. A novel tool for noninvasive diagnosis and tracking of patients with inflammatory bowel disease. Inflamm. Bowel Dis. 2013, 19, 999–1003. [Google Scholar] [CrossRef] [PubMed]
- Covington, J.A.; Westenbrink, E.W.; Ouaret, N.; Harbord, R.; Bailey, C.; O’Connell, N.; Cullis, J.; Williams, N.; Nwokolo, C.U.; Bardhan, K.D. Application of a novel tool for diagnosing bile acid diarrhoea. Sensors 2013, 13, 11899–11912. [Google Scholar] [CrossRef] [PubMed]
- Neumann, N.; Ebermann, M.; Kurth, S.; Hiller, K. Tunable infrared detector with integrated micromachined fabry-perot filter. J. Micro/Nanolithogr. MEMS MOEMS 2008, 7, 021004. [Google Scholar] [CrossRef]
- Vaughan, M. The Fabry-Perot Interferometer: History, Theory, Practice and Applications; CRC Press: Boca Raton, FL, USA, 1989. [Google Scholar]
Figure 1.
Overview of Optical eNose (the side view of the chamber only shows 2 sensors out of 4).

Figure 2.
Sensor response to CH4 gas with different concentrations starts from 2.5 ppm to 100 ppm in two different wavelengths 7.88 μm (a) & 3.4 μm (b).
Figure 2.
Sensor response to CH4 gas with different concentrations starts from 2.5 ppm to 100 ppm in two different wavelengths 7.88 μm (a) & 3.4 μm (b).

Figure 3.
Radar plot of the raw sensors responses at different wavelength for different chemicals.

Figure 4.
PCA classification separating all 6 groups of Acetone, Isopropanol, Ethanol, Coffee, Cole and Orange juice.
Figure 4.
PCA classification separating all 6 groups of Acetone, Isopropanol, Ethanol, Coffee, Cole and Orange juice.


Table 1.
List of sensors which has been used in Warwick Optical E-Nose.
| Manufacturer | Type | Optical Wavelength (μm) |
|---|---|---|
| InfraTec | LFP-3144C-337 | 3.1 to 4.4 |
| InfraTec | LFP-3850C-337 | 3.8 to 5.0 |
| InfraTec | LFP-8850C-337 | 5.5 to 8.0 |
| InfraTec | LFP-80105C-337 | 8.0 to 10.5 |
Publisher’s Note: MDPI stays neutral with regard to jurisdictional claims in published maps and institutional affiliations. |
© 2017 by the authors. Licensee MDPI, Basel, Switzerland. This article is an open access article distributed under the terms and conditions of the Creative Commons Attribution (CC BY) license (https://creativecommons.org/licenses/by/4.0/).
Share and Cite
MDPI and ACS Style
Esfahani, S.; Covington, J.A. Low Cost Optical Electronic Nose for Biomedical Applications. Proceedings 2017, 1, 589. https://doi.org/10.3390/proceedings1040589
AMA Style
Esfahani S, Covington JA. Low Cost Optical Electronic Nose for Biomedical Applications. Proceedings. 2017; 1(4):589. https://doi.org/10.3390/proceedings1040589
Chicago/Turabian StyleEsfahani, Siavash, and James A. Covington. 2017. "Low Cost Optical Electronic Nose for Biomedical Applications" Proceedings 1, no. 4: 589. https://doi.org/10.3390/proceedings1040589