Modelling Cross Axis Sensitivity in MEMS Coriolis Vibratory Gyroscopes †

STMicroelectronics, AMG R&D, 1228 Geneva, Switzerland
*
Author to whom correspondence should be addressed.
†
Presented at the Eurosensors 2017 Conference, Paris, France, 3–6 September 2017.
Proceedings 2017, 1(4), 281; https://doi.org/10.3390/proceedings1040281
Published: 17 August 2017
(This article belongs to the Proceedings of Proceedings of Eurosensors 2017, Paris, France, 3–6 September 2017)
Abstract
:In this paper a Cross Axis evaluation methodology is presented. The Cross Axis Sensitivity value depends on backend testing position tolerances as well as technological features and design properties of the MEMS gyroscope. A numerical model was developed to take into account the sources of cross axis related to the last two contributions, not considering backend tolerances. Given a specific structure for the AM gyroscope, the asymmetries in the MEMS structure are acknowledged as the main sources for the cross axis. The results of the harmonic FEM simulations were finally compared with real testing data, thus proving the validity of the developed FEM model.
1. Introduction
The importance of microelectromechanical systems (MEMS) and, in particular, inertial gyroscopes has grown in the last few years due to their widespread diffusion in consumer electronics, for instance, in cameras, gaming and mobiles phones. MEMS gyroscopes placed in Inertial Measurement Units (IMUs) together with multiaxial accelerometer sensors have covered some of the areas where accelerometers only were used in former years, with the main applicative sectors being automotive (stability control, rollover and GPS) as well as the previously mentioned consumer electronics.
Because of the more demanding performances requested by latest applications, many specifications are to be addressed during the design and calibration steps. These include noise performances (ARW, bias instability and RRW) and stability parameters (ZRO and sensitivity drifts as the most important ones). In the case of Optical Image Stabilization applications (OIS) applications [1], where high sensitivity accuracy is requested, several other specifications have to be addressed and among them, Cross-Axis (CA) sensitivity has become another key parameter to be taken into account.
This paper describes a general approach to evaluate the CA in a multiaxial Micro-machined Coriolis Vibratory Gyroscope (CVG) and, in particular, on an amplitude modulated (AM) tri-axial gyroscope. The issues regarding CA and its impact on the calibration and the sensitivity accuracy have been nevertheless poorly investigated in the literature. The main contributions to CA sensitivity error, as it will be detailed in the next sections, deal with frontend, design and backend aspects. For frontend, technological limitations and manufacturing issues are the main contributors on asymmetries introduced in the mechanical structure, whereas the backend, assembly and testing accuracy is mainly due to placement-related errors.
In this paper, we intend first to specify the impact of CA errors on the properties of gyroscopes, then we will identify asymmetries and other unbalances as sources of errors and find ways to reproduce and predict the gyroscopes’ behavior on real parts. With the developed methodology, we will numerically assess the influence of different quadrature error contributions on the CA value. Finally we will measure CA Sensitivity on a population of gyroscopes tested with Automatic Test Equipment (ATE) to check the validity of the developed FEM model.
2. Cross Axis Sensitivity Modeling
The Cross-Axis sensitivity is a measure of the change in the output on a detection axis when a rate is applied on an orthogonal axis [2]. The CA terms are represented as the off-diagonal terms in the sensitivity matrix (1), where the former index is related to the axis on which the physical rate is applied and the latter refers to the detection axis.
It is possible to highlight two major sources for CA, as reported in [3]: the former is the CA contributor directly linked with the MEMS itself (SMi,j), deepened in this paper, while the latter mainly concerns with the backend steps i.e., the die attach steps, the testing tolerances and the component surface mounting (SBi,j). Due to the different phenomena involved it is fair to consider the sources of CA as uncorrelated normally distributed events and this leads to (2):
In an ideal multiaxial gyroscope design, the CA contribution term is set to zero or at least minimized by a proper design [4]. More specifically, this target is achieved on one side by creating a symmetric layout of the MEMS structure along x- and y-directions with respect to a central symmetry axis; on the other side CA is reduced by setting a differential readout of the several sensing axes the gyroscope is made of. In a purely ideal case, this means that, when a fixed arbitrary rate is applied on the first axis, the second and third axes will detect a differential signal equal to zero, therefore no leakage of angular rate readout occurs.
In common MEMS manufacturing processes it is well known that a set of unbalances in the mechanical structure arise in the final silicon. For the sake of simplicity, these unwanted asymmetries are modeled as normally distributed variables that affect the ideal geometry of the CVG.
These asymmetries are acknowledged as the main sources of CA errors and their effect is modeled by the numerical FEM model which will be detailed in the next section.
3. Numerical Model
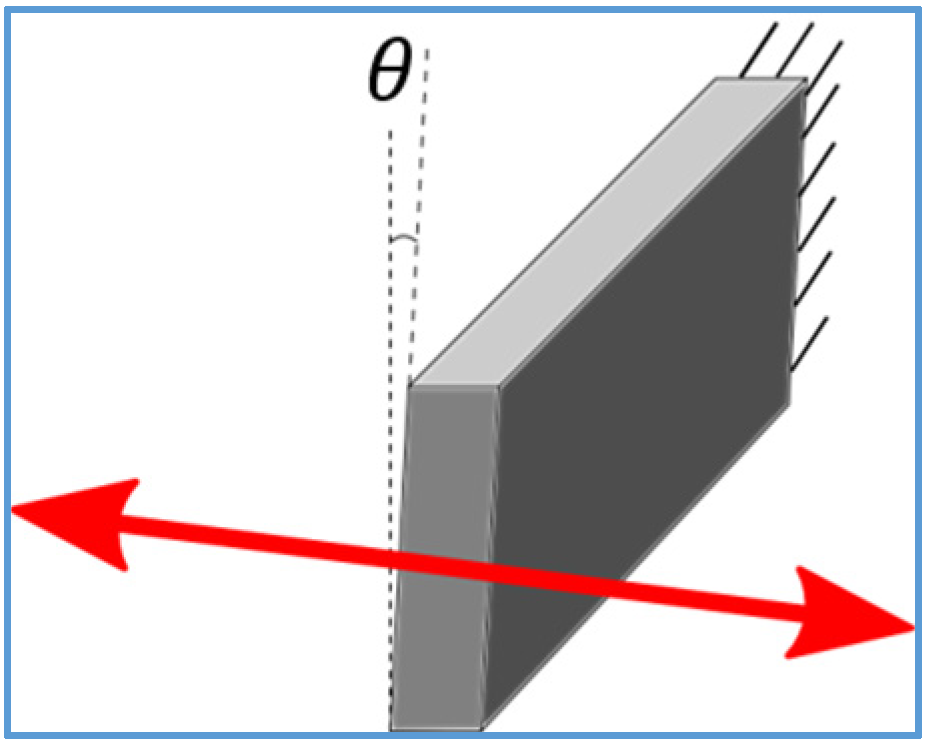
An analytical approach on conventional multiaxial microgyroscopes is often unfeasible to get a precise estimation of the different kinds of unwanted cross axis contributions. A more preferred numerical approach is then pursued. As a first step, the complete 2D CAD geometrical model of the microgyroscope was converted into a 3D FEM model in ANSYS® [5]. For each kind of cross-axis simulation, a proper asymmetry to the geometrical structure was introduced in the geometry of the FEM structure, in order to simulate the contribution of a set of different asymmetries. For instance, a non-vertical sidewall profile of the silicon trench structure along z-direction was introduced to take x- and y-quadrature into account, as depicted in Figure 1:
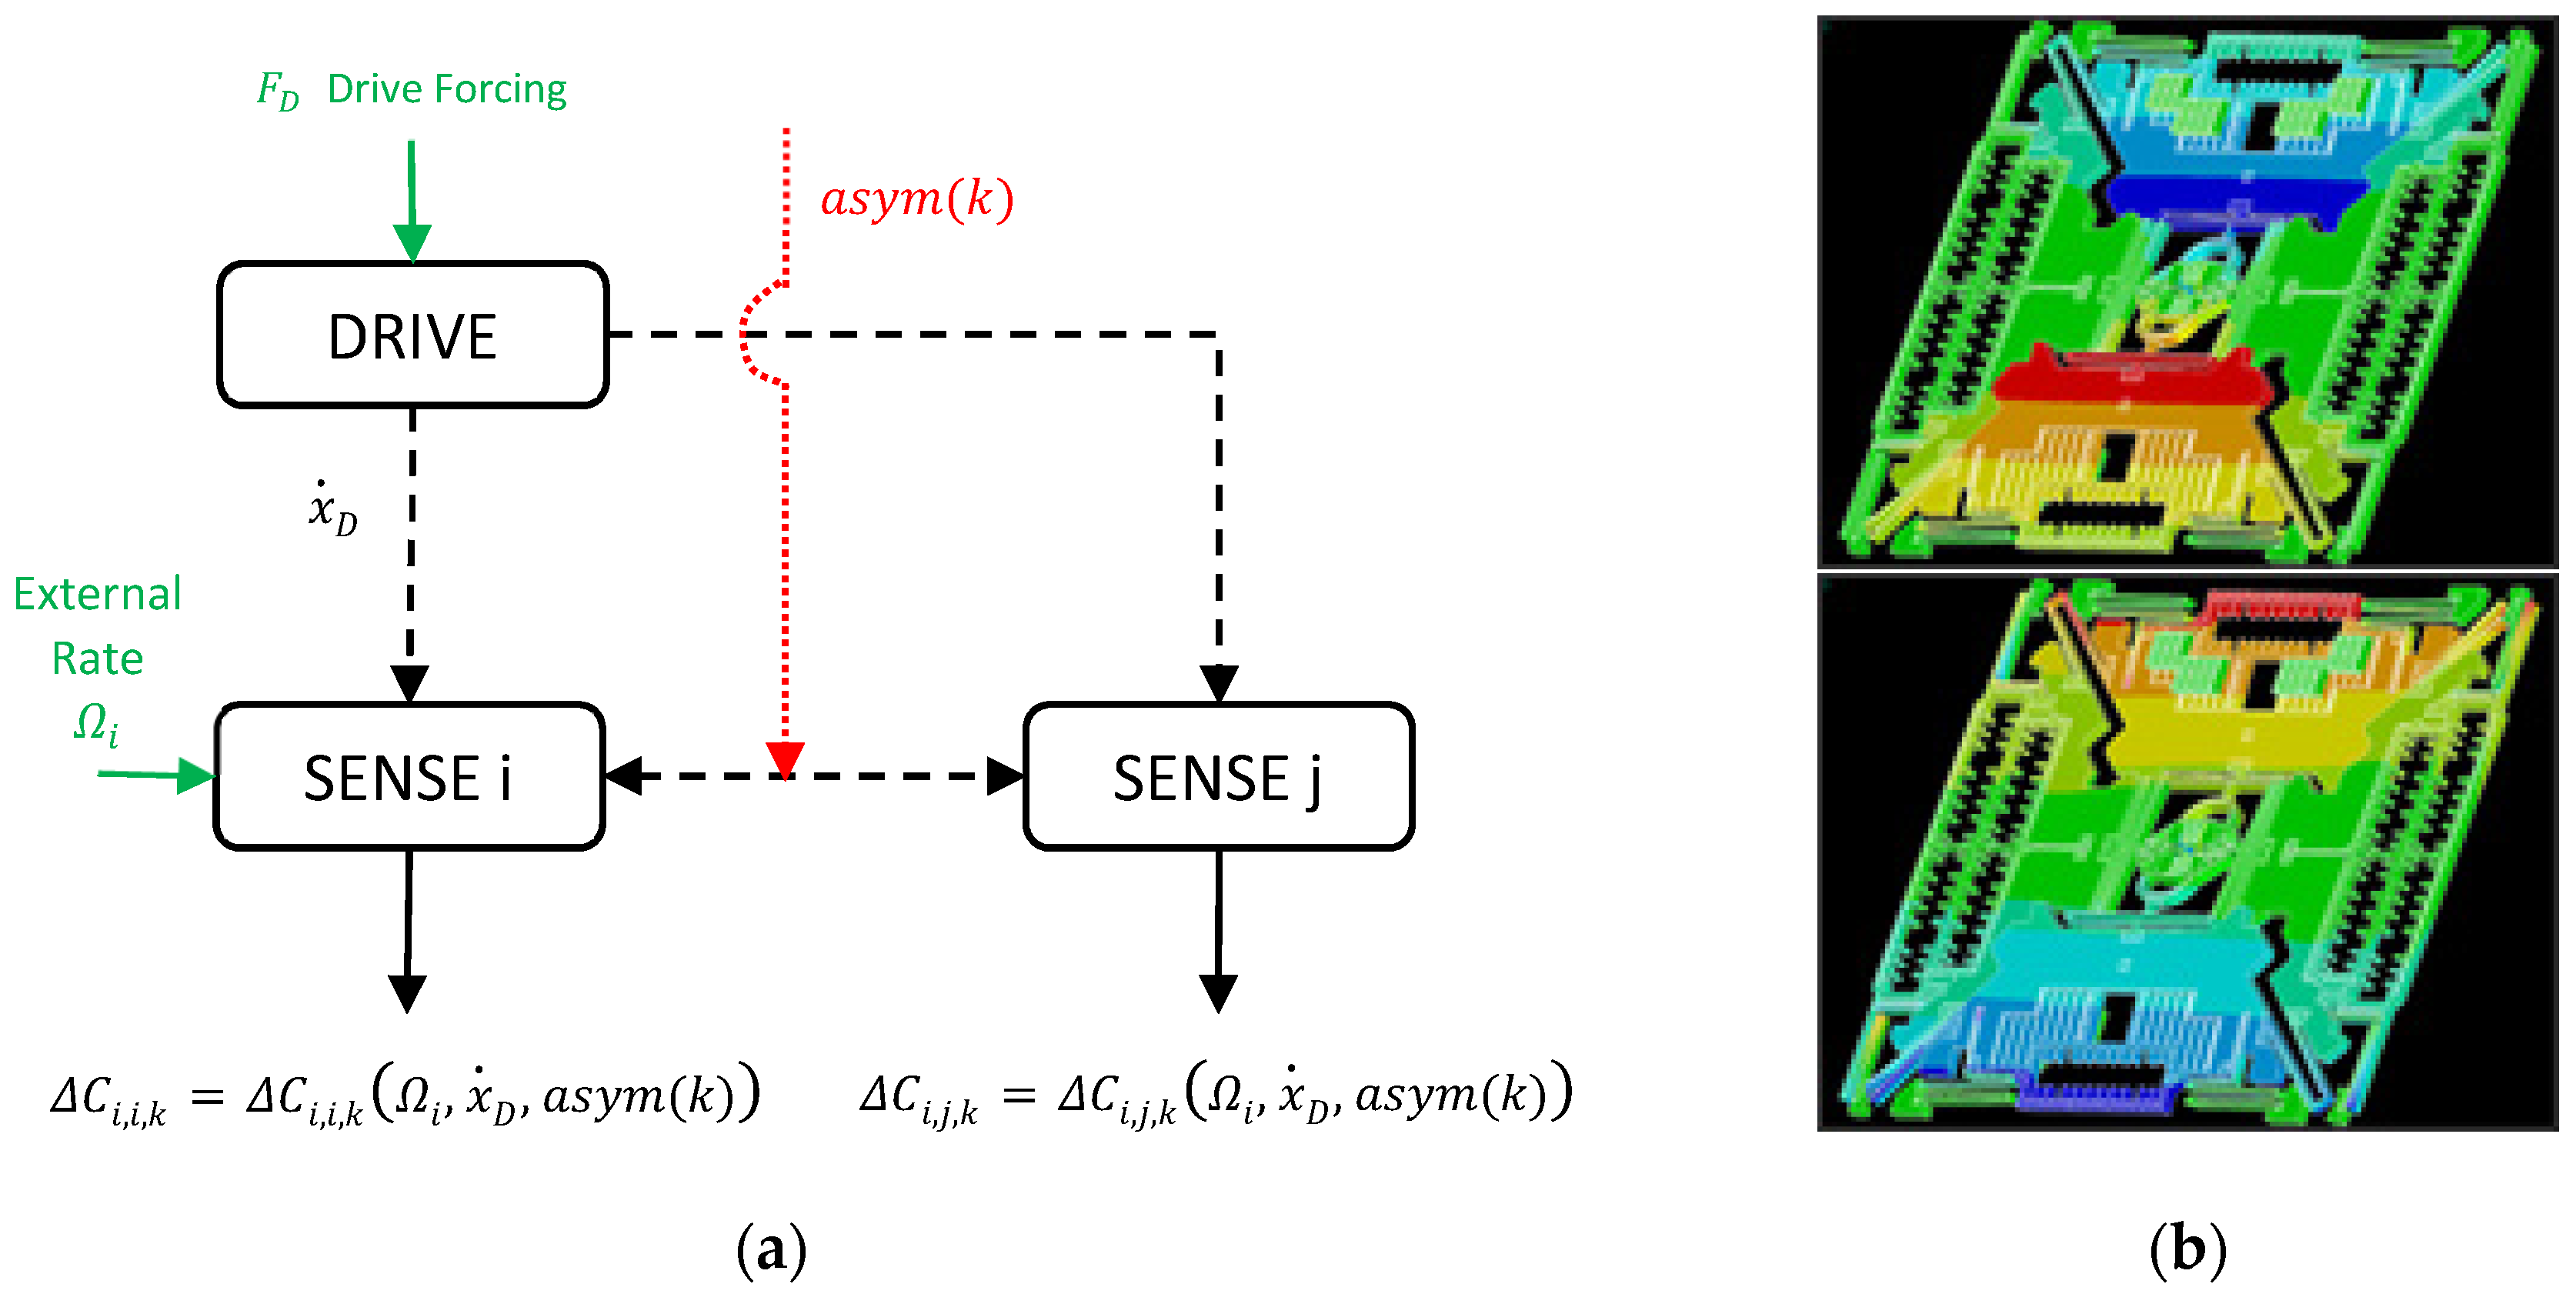
In order to model the capacitive actuation of the drive comb system, a forcing load at the drive resonance frequency was applied to the nodes related to the gyroscope drive comb finger area by means of kinematic coupling equations. This forcing value was properly set to make the gyroscope displacement equal to the operative one, as defined in the design phase.
Moreover, for each axis, an external angular rate was applied at a constant fixed value in order to represent the external rate given by the testing equipment during the gain factor trim step, which takes place in the ATE. The general flow scheme for the developed numerical model is shown in Figure 2a.
Once the harmonic simulation has been performed, the change in sensing electrode gap due to Coriolis Force can be calculated by a set of post processing steps. Firstly, for all pairs of rotor and sensing capacitor electrodes of the FEM model, the surface nodes are extracted. For each electrode, a surface fitting is then performed using MATLAB®. Finally, the capacitance change for each of the sense electrodes, , is computed by means of numerical integration, and it is therefore possible to evaluate the cross axis normalized terms as stated in (3):
where:
- First index represents the axis on which the external angular rate is applied;
- Second index represents the readout axis;
- Third index is a simple integer identifier for the kind of asymmetry introduced in the model. Where no k index is present (e.g., ), the capacitance change is evaluated in the ideal case, without any asymmetries.
From this value the cross axis signal amplitude on each axis was computed.
4. Results
The described simulation methodology was applied in the case study of the STMicroelectronics LSMDS3 [6] gyroscope in order to find the X to Z CA term (Sx,z). The numerical model of the MEMS developed included the sources of the asymmetries. This was done in order to evaluate the displacement of the Z sensing axis while forcing the sensor with an external angular rate on the X direction. Among the simulated asymmetries, the main contributors in terms of CA resulted to be the quadrature error that is the mechanical coupling between the drive and sense axes. As mentioned previously, for the axes that detect an out of plane displacement (X, Y), the quadrature is directly linked with the uniformity of the etching of the movable mass.
By design, the ideal structure showed negligible level of CA whereas, when considering a non-vertical sidewall of the movable mass due to non-ideality of trench etch, the CA terms increased. In the considered test case a wall angle was applied in X direction for the extrusion of the FEM geometry. The Coriolis force due to the external angular rate changes the gap for the respective X sensing axis, but at the same time generates an unwanted displacement read by the Z-axis, as shown in Figure 2b.
By numerical integration of the capacitance change due to the variation of the electrode gap as described in the previous section, it was possible to have an estimation of CA.
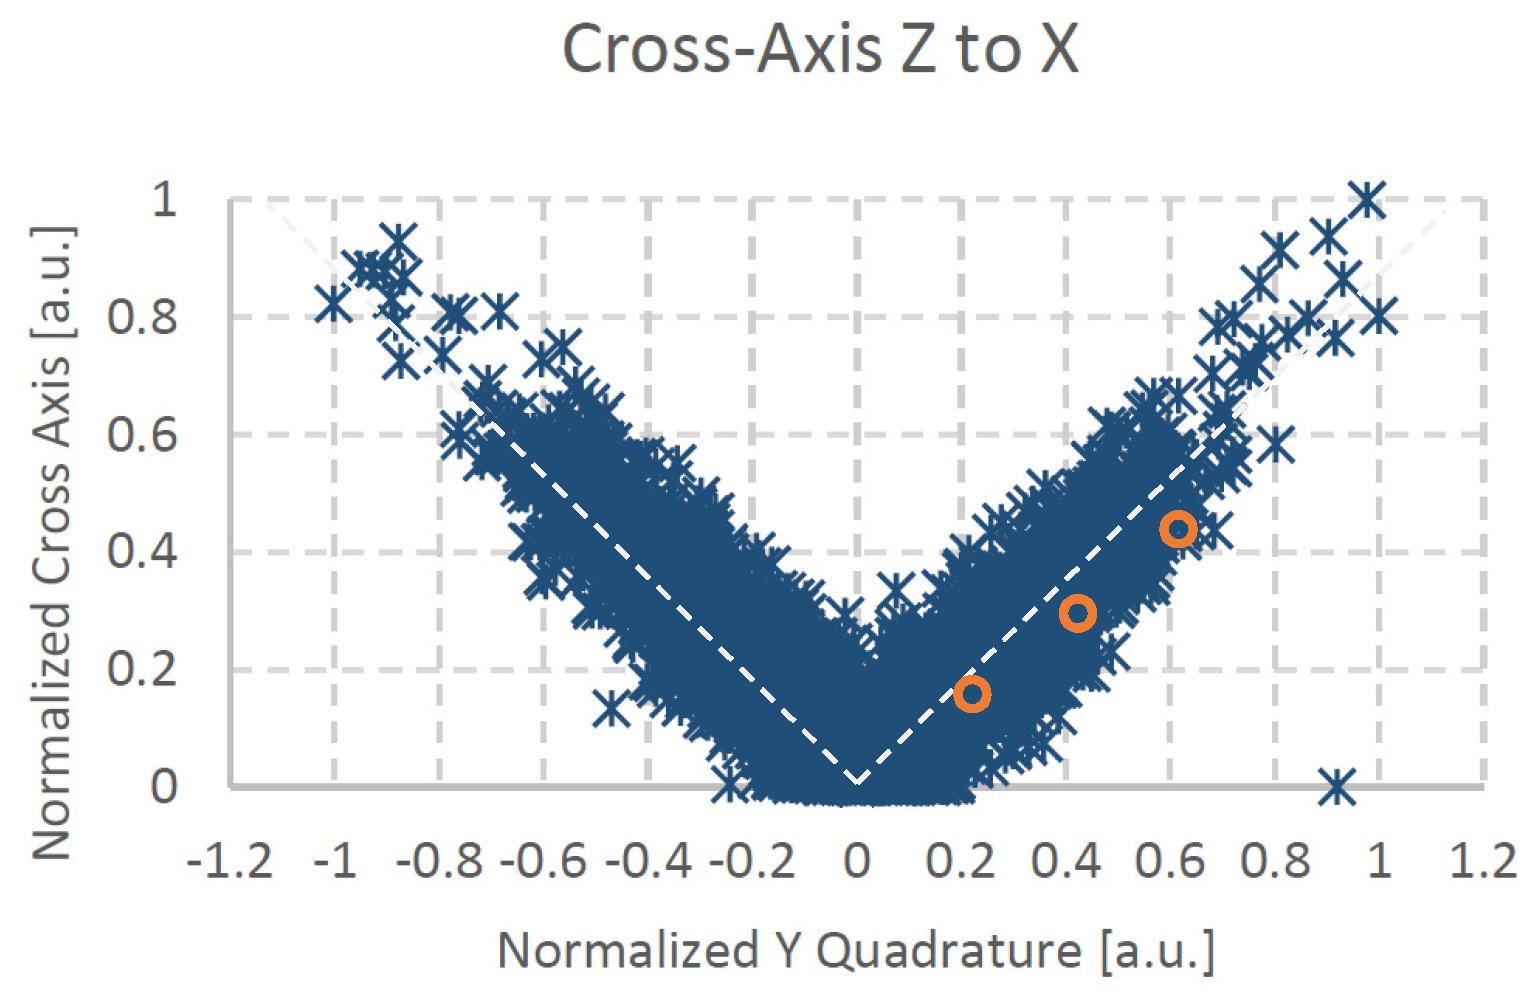
The results of the simulation were then compared with the ATE data collected during the volume production of the LSMDS3. As reported in Figure 3 the CA value for the Z-axis are strongly correlated with the quadrature of the out-of-plane axis Y. Moreover, the simulation results for a 3σ quadrature value are in good alignment with the collected experimental data, as showed in Table 1. The difference between the experimental data and the simulation results is attributed to the simplification adopted to model the nature of the quadrature error (uniform wall angle for the extrusion of the 2D geometry).
5. Conclusions
In this paper a general simulation methodology to evaluate cross axis sensitivity in CVG is presented and verified with experimental data.
Conflicts of Interest
The authors declare no conflict of interest.
References
- Lee, S.-K.; Kong, J.-H. An Implementation of Closed-loop Optical Image Stabilization System for Mobile Camera. In Proceedings of the IEEE International Conference on Consumer Electronics (ICCE), Las Vegas, NV, USA, 10–13 January 2014. [Google Scholar]
- NXP Freescale Semiconductors. In Accelerometer Terminology Guide; Rev. 0; April 2007.
- Fang, B.; Chou, W.; Ding, L. An Optimal Calibration Method for a MEMS Inertial Measurement Unit. Int. J. Adv. Robot. Syst. 2014, 11, 14. [Google Scholar] [CrossRef]
- Acar, C.A.; Shkel, A. MEMS Vibratory Gyroscopes—Structural Approaches to Improve Robustness, 1st ed.; Springer: New York, NY, USA, 2009. [Google Scholar]
- ANSYS. Mechanical APDL v.16: Theory Reference. Available online: http://www.ansys.com (accessed on June 2017).
- STMicroelectronics. LSM6DS3 Datasheet; STMicroelectronics: Geneva, Switzerland, 2015. [Google Scholar]
Figure 1.
Non vertical extrusion exploited in the FEM model to represent sidewall angle of a real MEMS structure which is commonly recognized as the main common source of quadrature for out of plane (x- and y-axes).
Figure 1.
Non vertical extrusion exploited in the FEM model to represent sidewall angle of a real MEMS structure which is commonly recognized as the main common source of quadrature for out of plane (x- and y-axes).
Figure 2.
ANSYS simulation model (a) General simulation flow (b) Contour plot of z- (above) and x-displacement (below) when harmonic simulation is performed.
Figure 2.
ANSYS simulation model (a) General simulation flow (b) Contour plot of z- (above) and x-displacement (below) when harmonic simulation is performed.
Figure 3.
Scatter plot of data coming from automated testing equipment which points out the correlation between Sx,z and Y-Quadrature (blue dots) and sample CA simulation results for the considered case (red dots).
Figure 3.
Scatter plot of data coming from automated testing equipment which points out the correlation between Sx,z and Y-Quadrature (blue dots) and sample CA simulation results for the considered case (red dots).

Table 1.
Simulation and testing result comparison.
| Condition | CA Values @3σ [a.u.] |
|---|---|
| Sx,z Automated Testing | 0.56 |
| SMx,z Simulation | 0.41 |
Publisher’s Note: MDPI stays neutral with regard to jurisdictional claims in published maps and institutional affiliations. |
© 2017 by the authors. Licensee MDPI, Basel, Switzerland. This article is an open access article distributed under the terms and conditions of the Creative Commons Attribution (CC BY) license (https://creativecommons.org/licenses/by/4.0/).
Share and Cite
MDPI and ACS Style
Guerinoni, L.; Falorni, L.G.; Gattere, G. Modelling Cross Axis Sensitivity in MEMS Coriolis Vibratory Gyroscopes. Proceedings 2017, 1, 281. https://doi.org/10.3390/proceedings1040281
AMA Style
Guerinoni L, Falorni LG, Gattere G. Modelling Cross Axis Sensitivity in MEMS Coriolis Vibratory Gyroscopes. Proceedings. 2017; 1(4):281. https://doi.org/10.3390/proceedings1040281
Chicago/Turabian StyleGuerinoni, Luca, Luca Giuseppe Falorni, and Gabriele Gattere. 2017. "Modelling Cross Axis Sensitivity in MEMS Coriolis Vibratory Gyroscopes" Proceedings 1, no. 4: 281. https://doi.org/10.3390/proceedings1040281