1. Introduction
The use of devices capable of extracting small quantities of energy from non-conventional sources has become a reality especially in mobile and wireless electronics [
1,
2], in powering wireless sensor networks [
3], wearables [
4] and remote sensors [
5]. One of the most reliable applications of these energy harvesters is the acquisition of data for the Smart Grids using distributed sensors [
6,
7] to read voltage, current, temperature or speed [
5]. Other applications in this area of interest include the use of harvesters to scavenge energy from electric fields to evaluate the status of high- and medium-voltage assets [
8]. Usually, the energy sources are heat, vibration or electromagnetic emissions, especially magnetic or electric fields. Light is also considered as a non-conventional source for these type of devices though the maturity of photovoltaic cells and the large quantities of energy that can be extracted sorts this technology far from the rest of harvesters. The approach proposed in this paper is different from what is usually done in the bibliography. First, the energy source is high-frequency current pulse derived from a phenomenon that happens in electrical insulation systems when they present some type of degradation. These pulses, namely partial discharges, release very small quantities of energy that hardly can be used to power sensors. Then, and this would be the second difference with the rest of works in this field, the scavenged energy stored in a capacitor is used to assess the status of the insulation. Differences in the rate of energy accumulation can be directly associated to an abnormal behavior of the insulation and, hence, an alarm would set to study the asset more closely.
2. Measuring partial discharges
The sudden release of the accumulated charge in vacuoles of gas inside or on the surface of dielectrics creates a pulse of current that flows to earth. The natural path for this current goes through the parasitic capacitances between the dielectric and the metallic structure connected to ground of the electrical machine. However, when these events are being measured to assess the status of the insulation system, another path with lower impedance to ground is connected to the mains of the machine to force the current to flow through it [
9]. The inductive sensors, namely high frequency current transformers (HFCT) or Rogowski coils, are clamped to this path to detect the partial discharges [
10]. Since the charge release occurs inside the machine, the current pulse has to travel through the transmission line losing some of its initial time-characteristics. Hence, the signal measured by the sensors is still very fast but has an oscillatory nature induced by the transmission line.
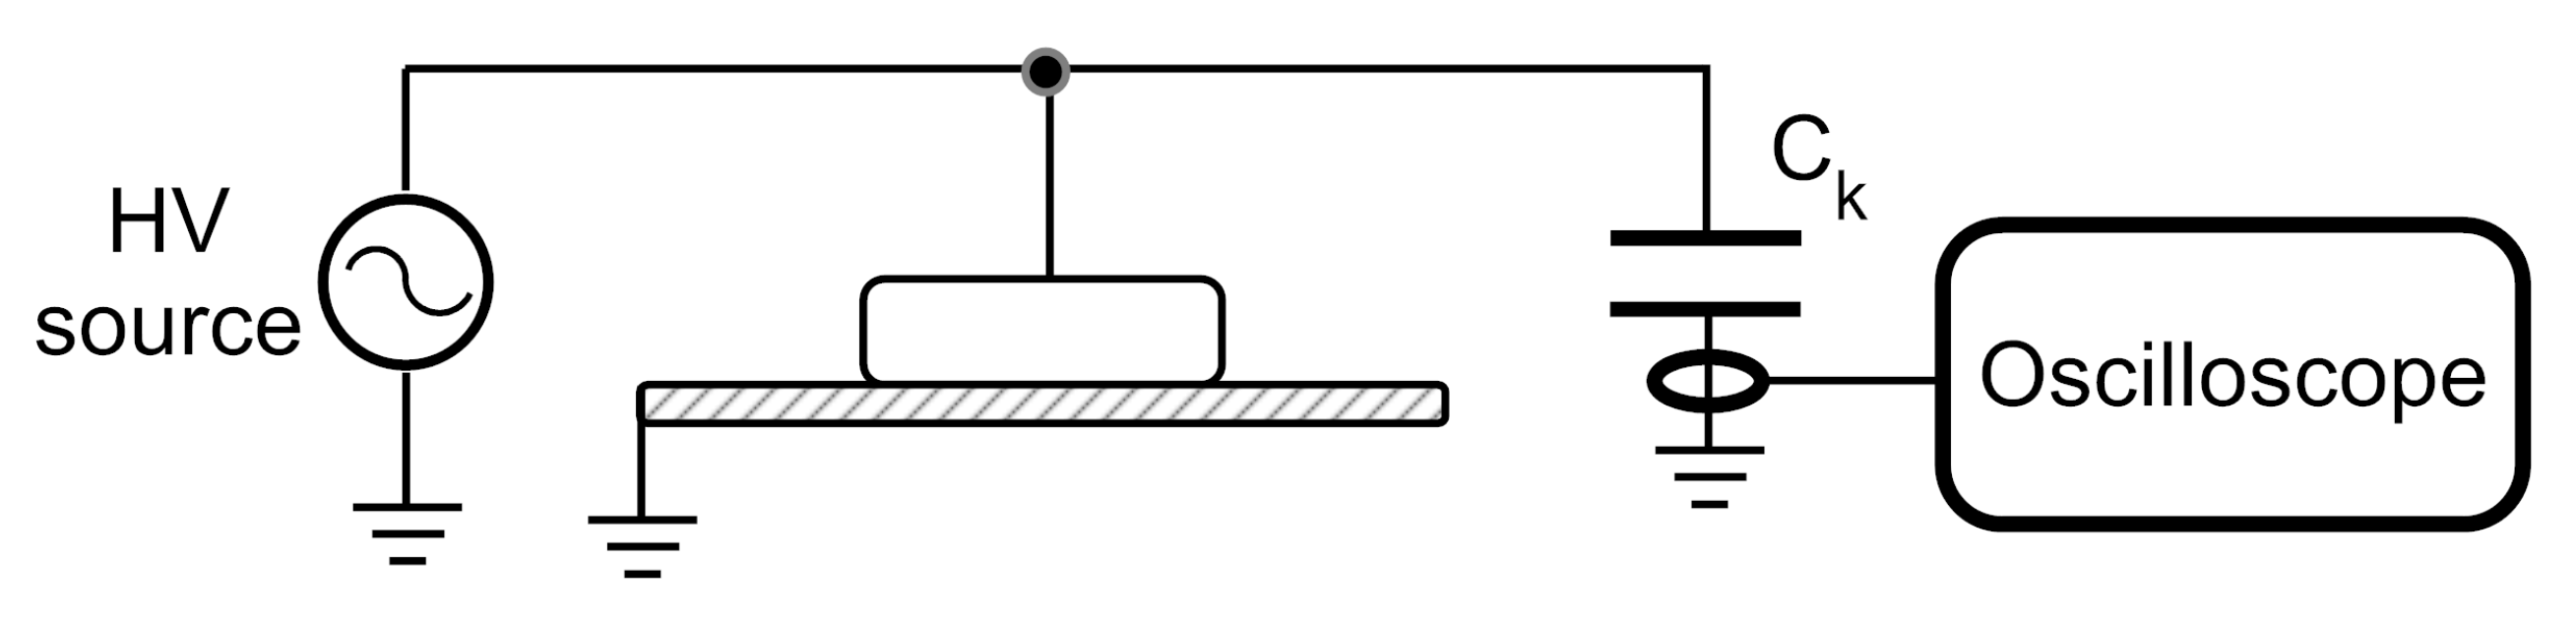
A simple setup was mounted to generate partial discharges consisting on an electrode placed on an polyethylene insulation sheet and connecting it to a high voltage source,
Figure 1. A coupling capacitor,
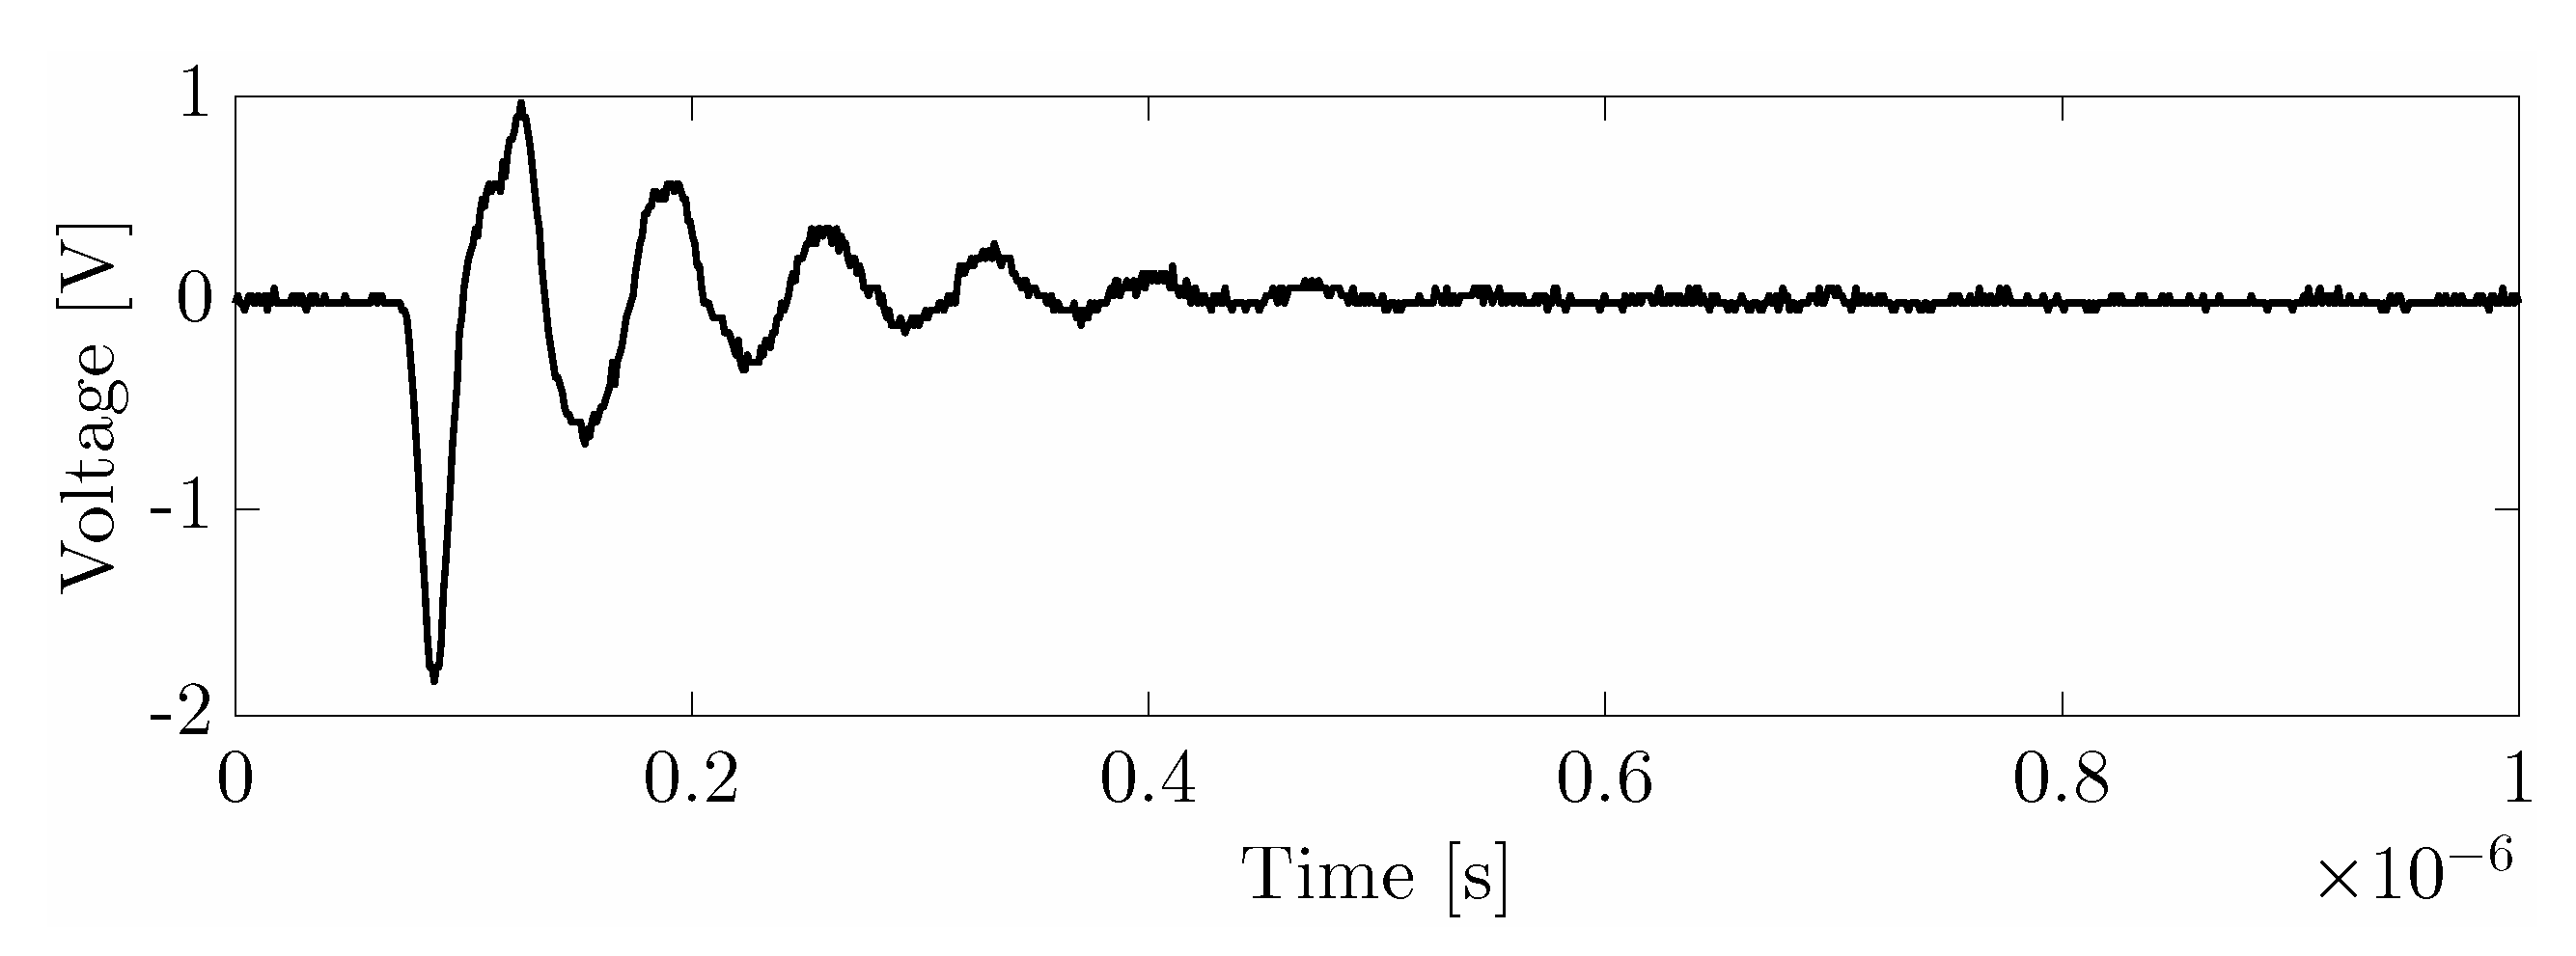
, is connected in parallel with the electrode and ground system and, finally, a HFCT is clamped in the cable connecting the capacitor to ground. The source is set to 2500 V which is well above the partial discharge inception voltage. The activity was monitored during no less than 15 minutes to ensure that there is a stable production of partial discharges. Then, a set of 500 pulses were acquired with an oscilloscope to extract statistical data of interest. An example of a partial discharge is shown in
Figure 2. It can be observed that the rise time of the front wave is close to 10 ns and could be as short as 1 ns depending on the path to ground. The amplitude of the pulse is proportional to the charge involved in the avalanche and the ringing and oscillation frequency are related to the characteristics of the transmission line.
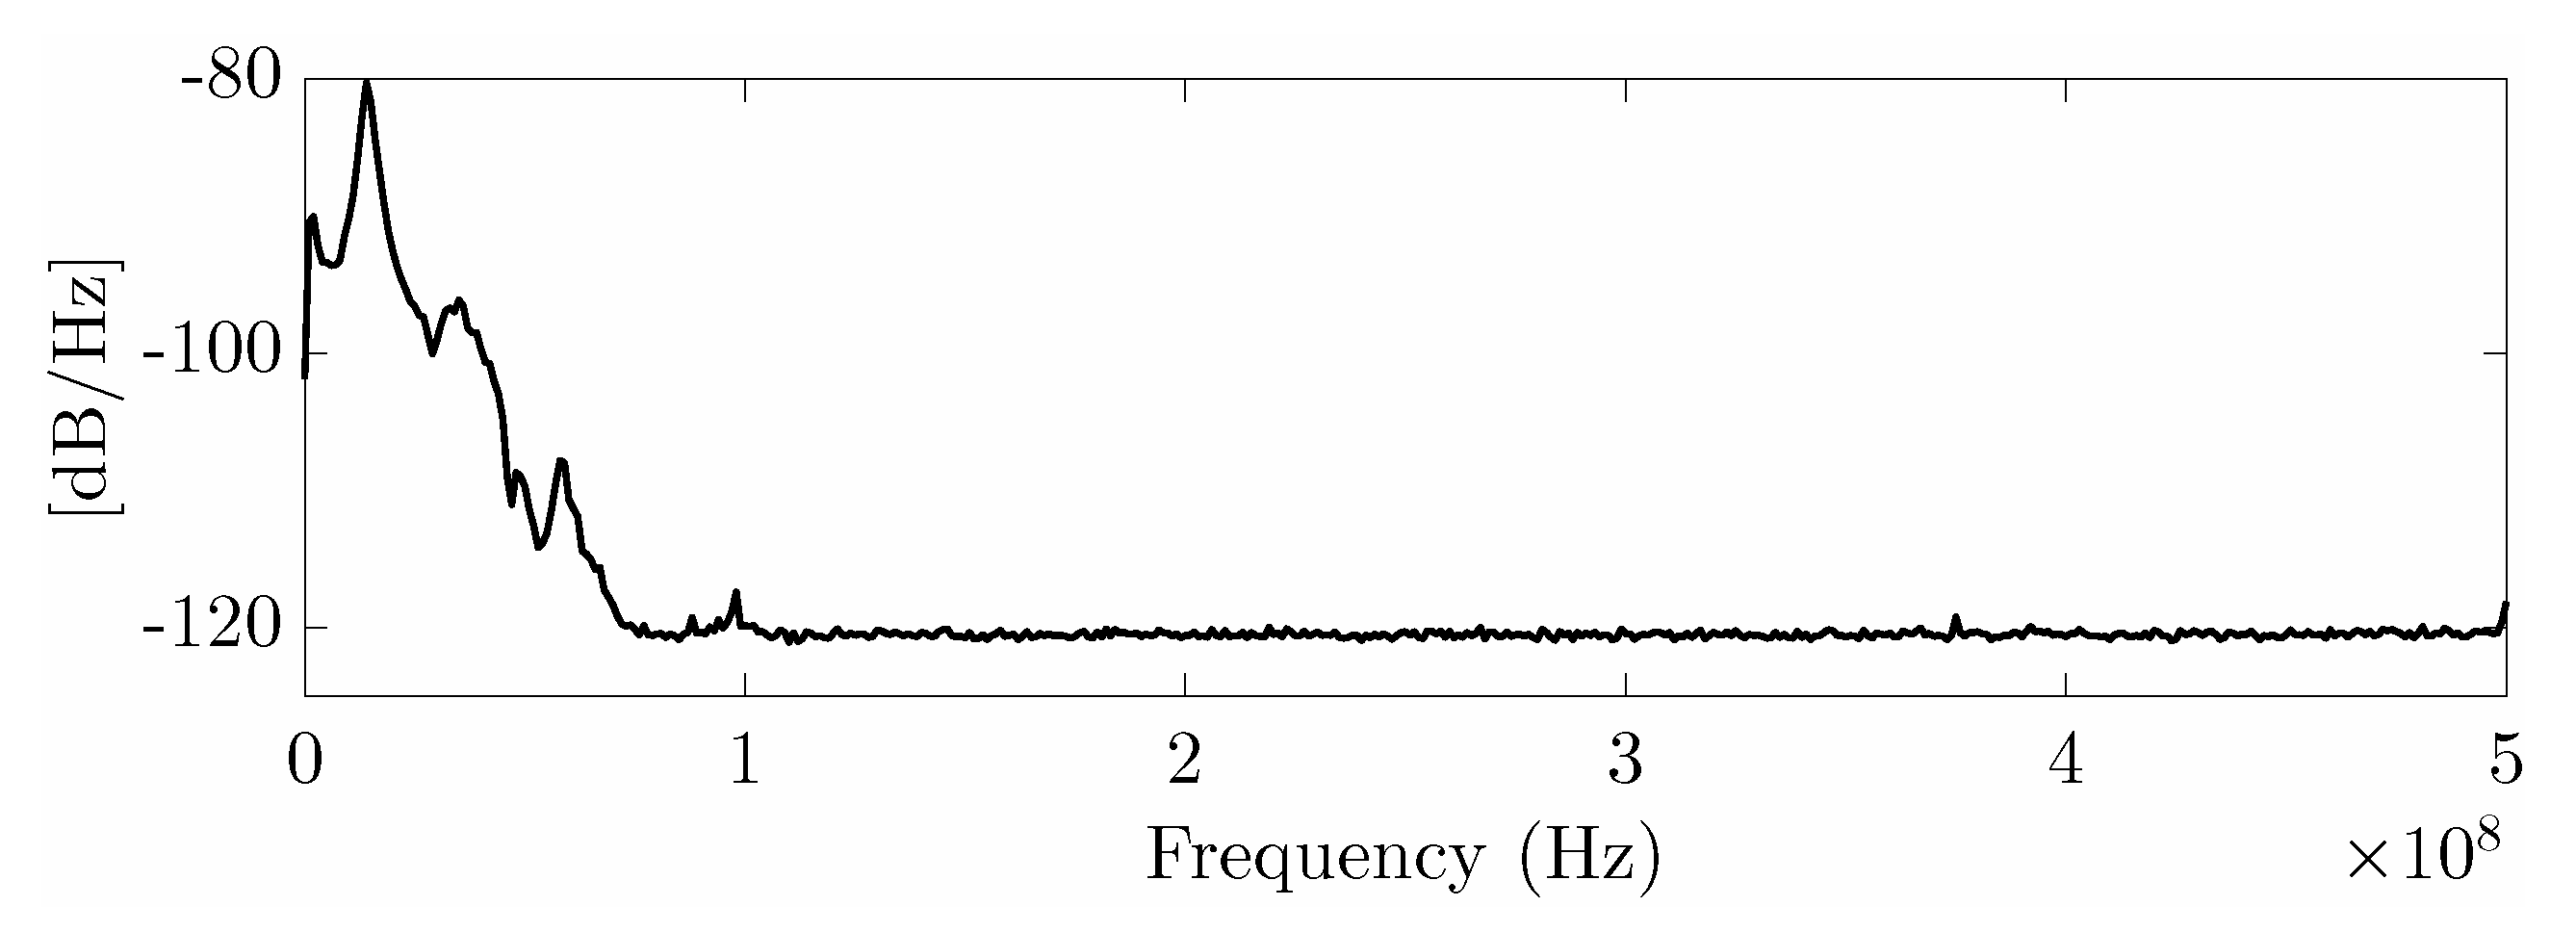
The stochastic nature of partial discharges results in a wide variety of maximum peaks so the average of all 500 pulses has been calculated to have a characteristic partial discharge. Then, the average peak reached a value of 1.42 V with a standard deviation of 0.3 V. The power spectral density shows that the main frequency is in 14 MHz though there is power up to 60 MHz,
Figure 3.
The energy of the characteristic partial discharge for this setup is calculated with Equation (
1) considering that the average pulse
starts at
and ends at
s. The result is
nJ which is extremely low and would have severe difficulties to supply power even to low-power sensors by itself. The total energy contained in 500 pulses can be calculated again with Equation (
1) substituting
with
, the signal for all pulses, and
s, which is the time that took 500 partial discharges to happen. In this case,
J, so, since partial discharges are continuously happening, the accumulated energy during long periods of time can still have some use storing it in a capacitor. The next step would be to know what voltage can be reached in a certain time for a specific capacitance.
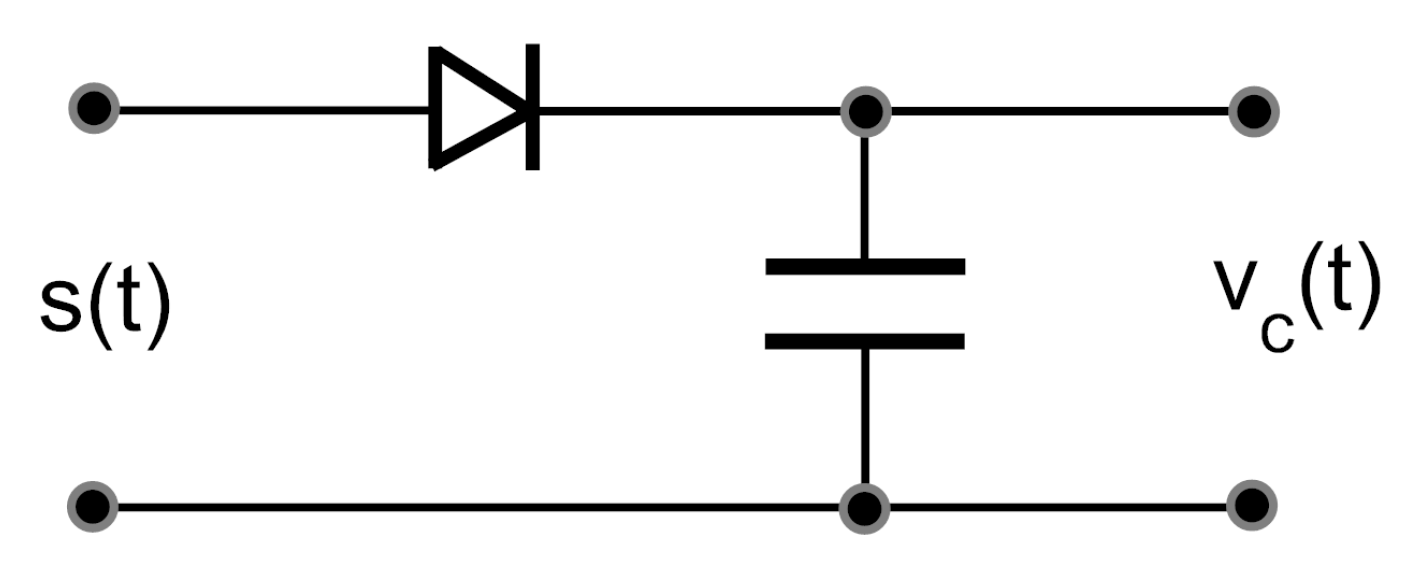
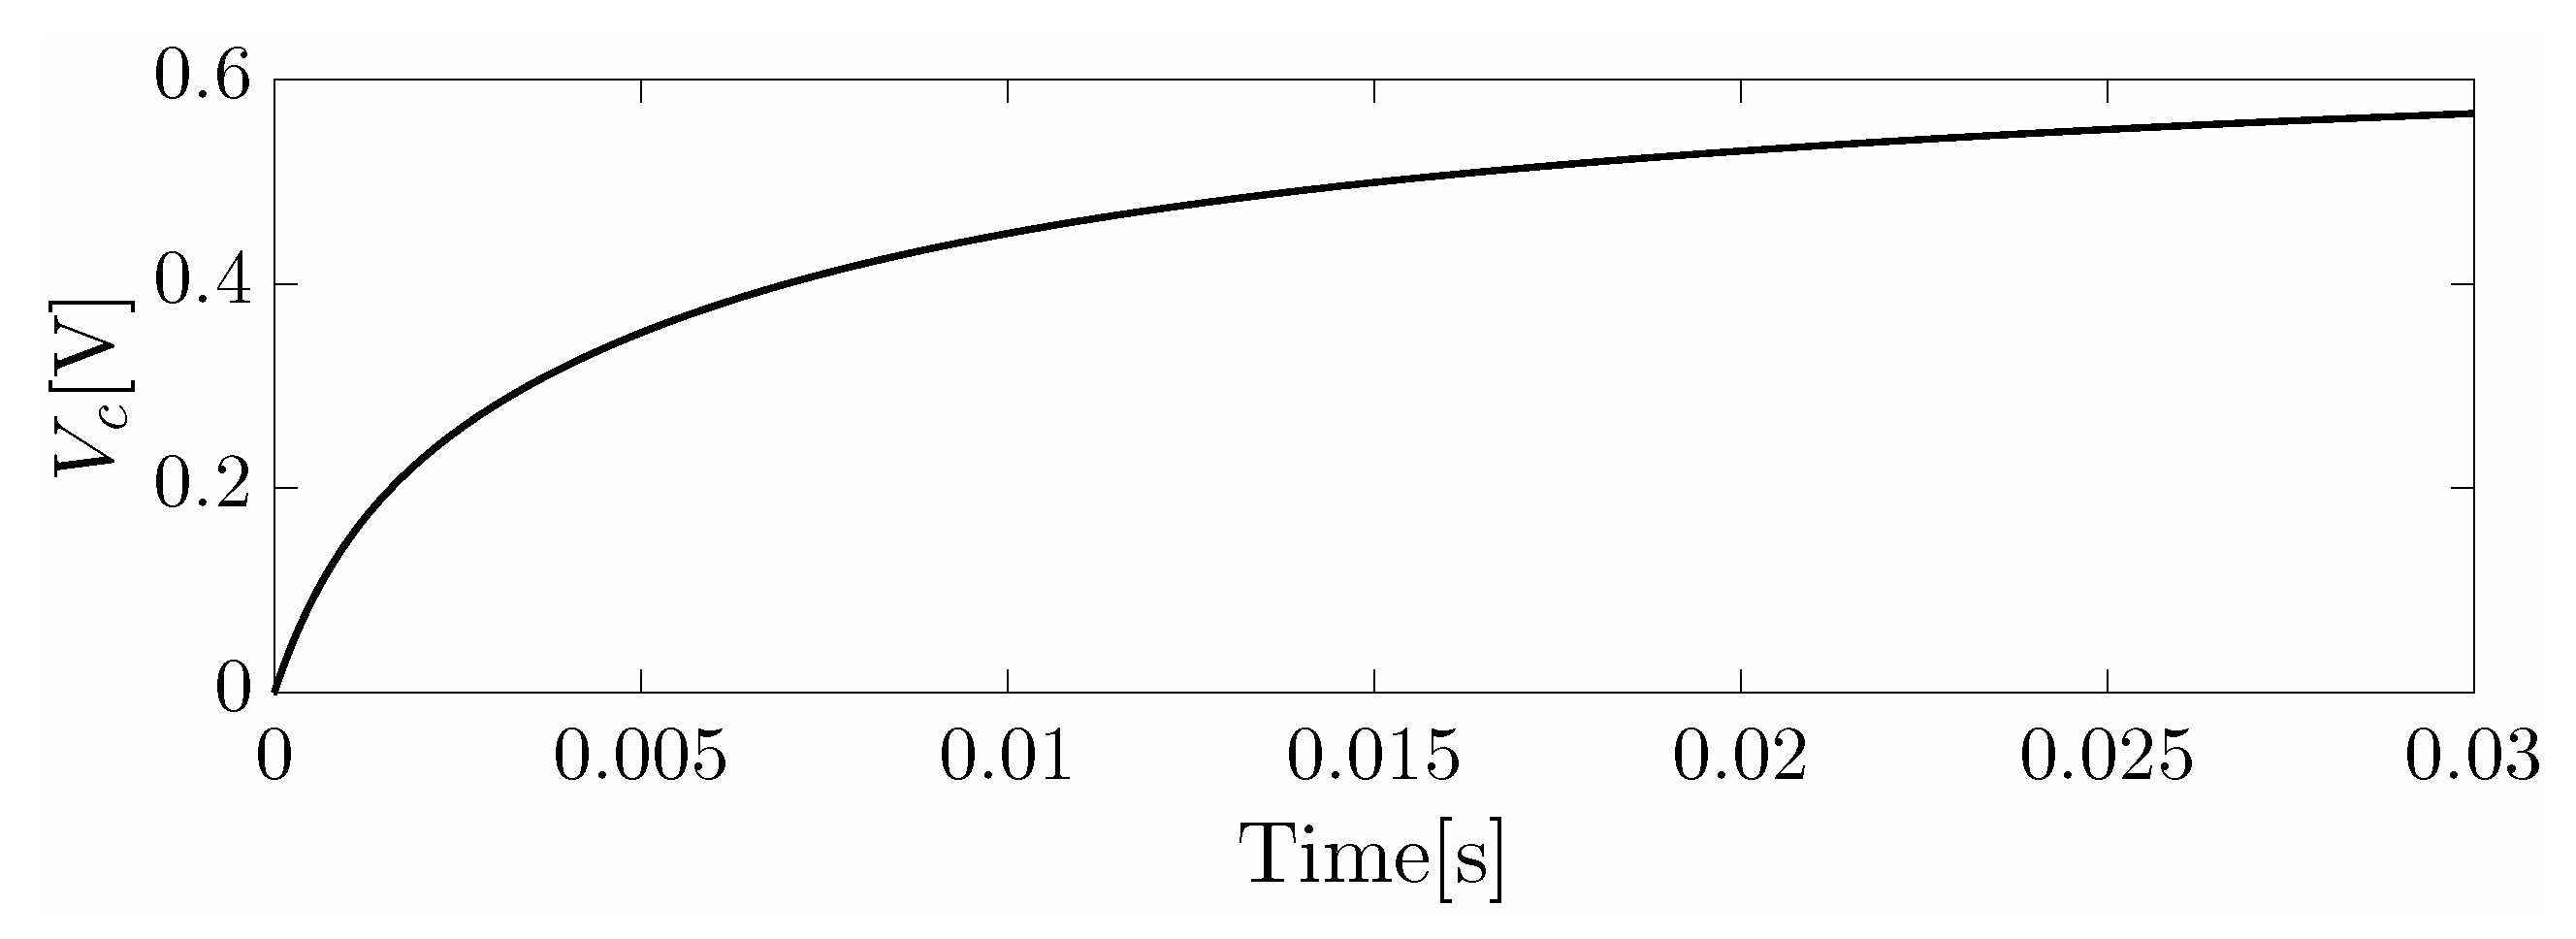
Some simulations were carried out to show the charge of a capacitor using the peak detector in
Figure 4 considering that a partial discharge happens every 1 microsecond. This rate of generation of partial discharges is extremely large in real conditions but helps to set the ground for the study. The chosen diode was a HSMS-2860 surface mount Schottky diode with very low forward voltage and the capacitor was
F. The input signal is that shown in
Figure 2. The results for the first ten pulses, i.e. 10 microseconds are displayed in
Figure 5. The increment in the voltage of the capacitor is small for every pulse,
V when the capacitor voltage is low and is reduced further when the capacitor is charged. Though the positive peaks of the pulses injected in the simulation can reach 1 V, the injected charge depends on the time constant of the system. From the HSMS-2860 the on-resistance of the diode is
, so the time constant of the charging stage is, approximately and considering a first order system,
s. The transient would end in
s which is much longer that the duration of the pulse. Therefore, the step voltage is very small compared with the positive peak. This step could be increased reducing the time constant of the system by reducing the capacitance. Unfortunately, this would store less energy proportionally to the reduction in the capacitance. The maximum voltage in the capacitor would be the maximum positive peak, 1 V, minus the voltage drop at the diode which, according to the data sheet is 0.35 V, yielding
V as can be inferred from
Figure 6. Additionally, the voltage increase rate in the storage capacitor is reduced as its voltage raises. This is expected since the signals are damped oscillations and as the capacitor is charged less pulses overpass the voltage level.
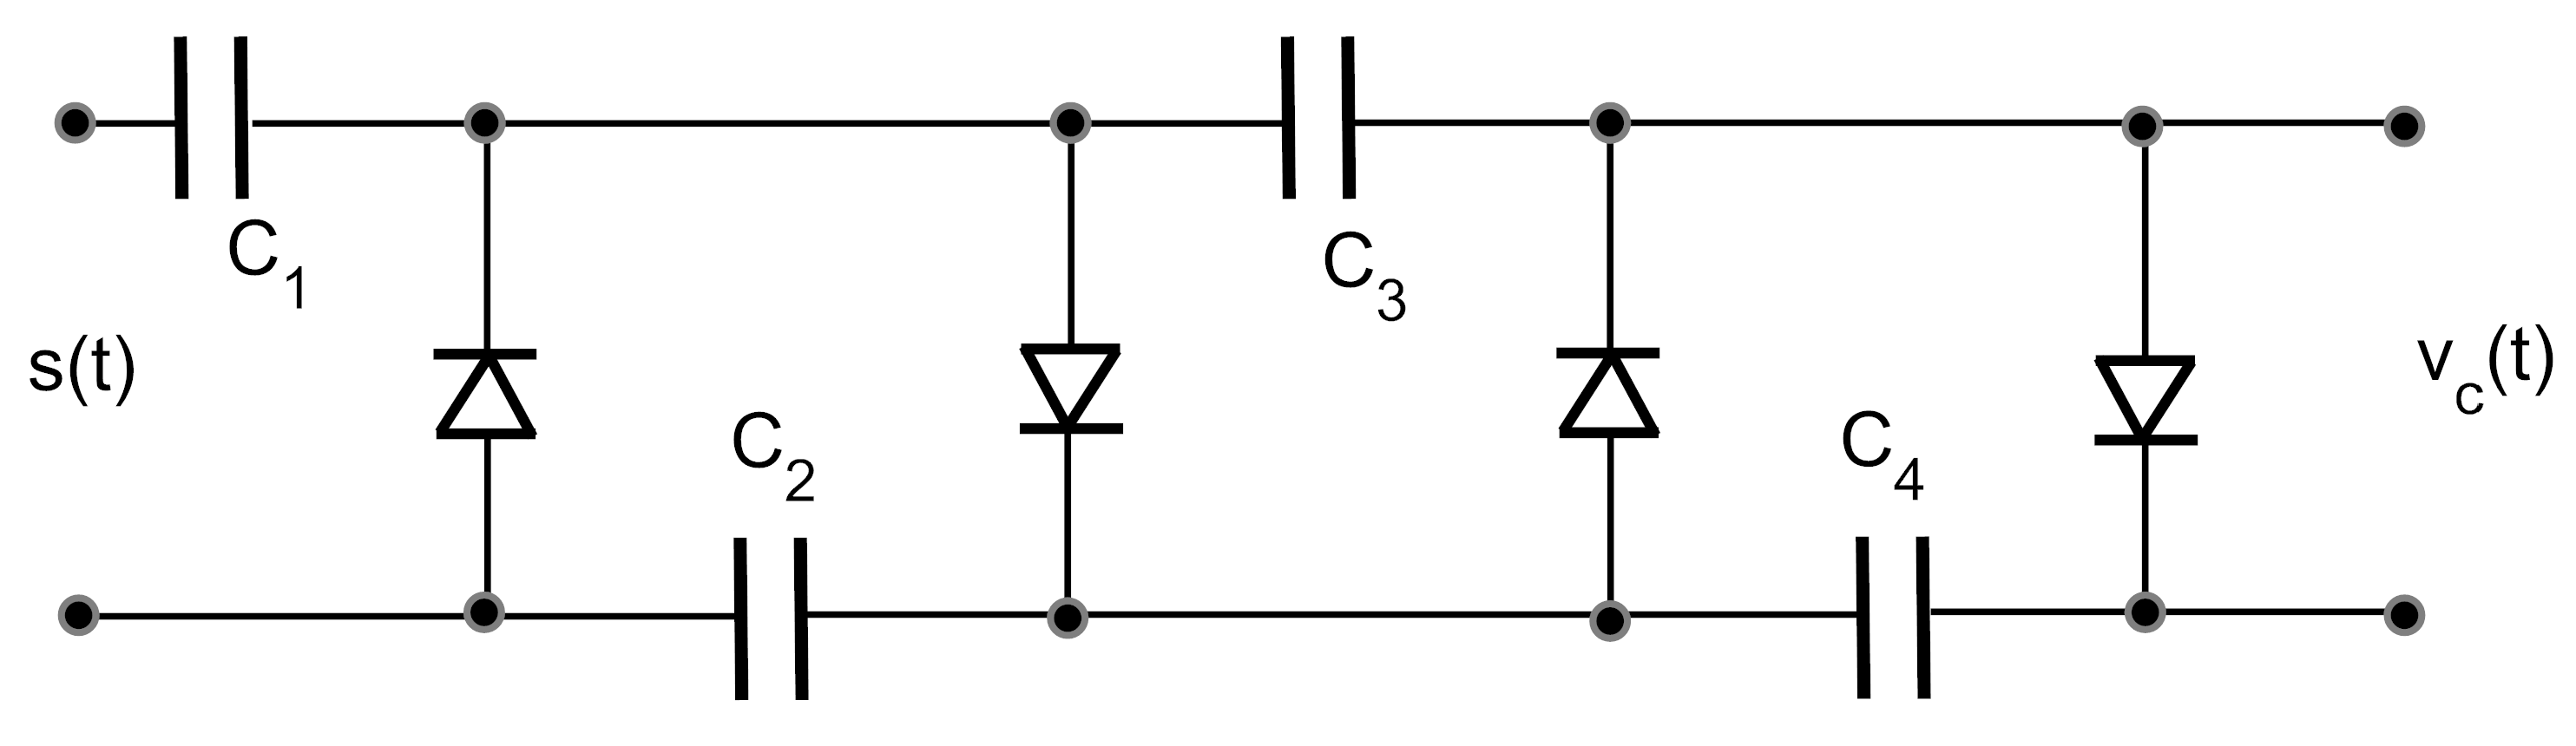
Using a Cockcroft-Walton voltage multiplier and rectifier,
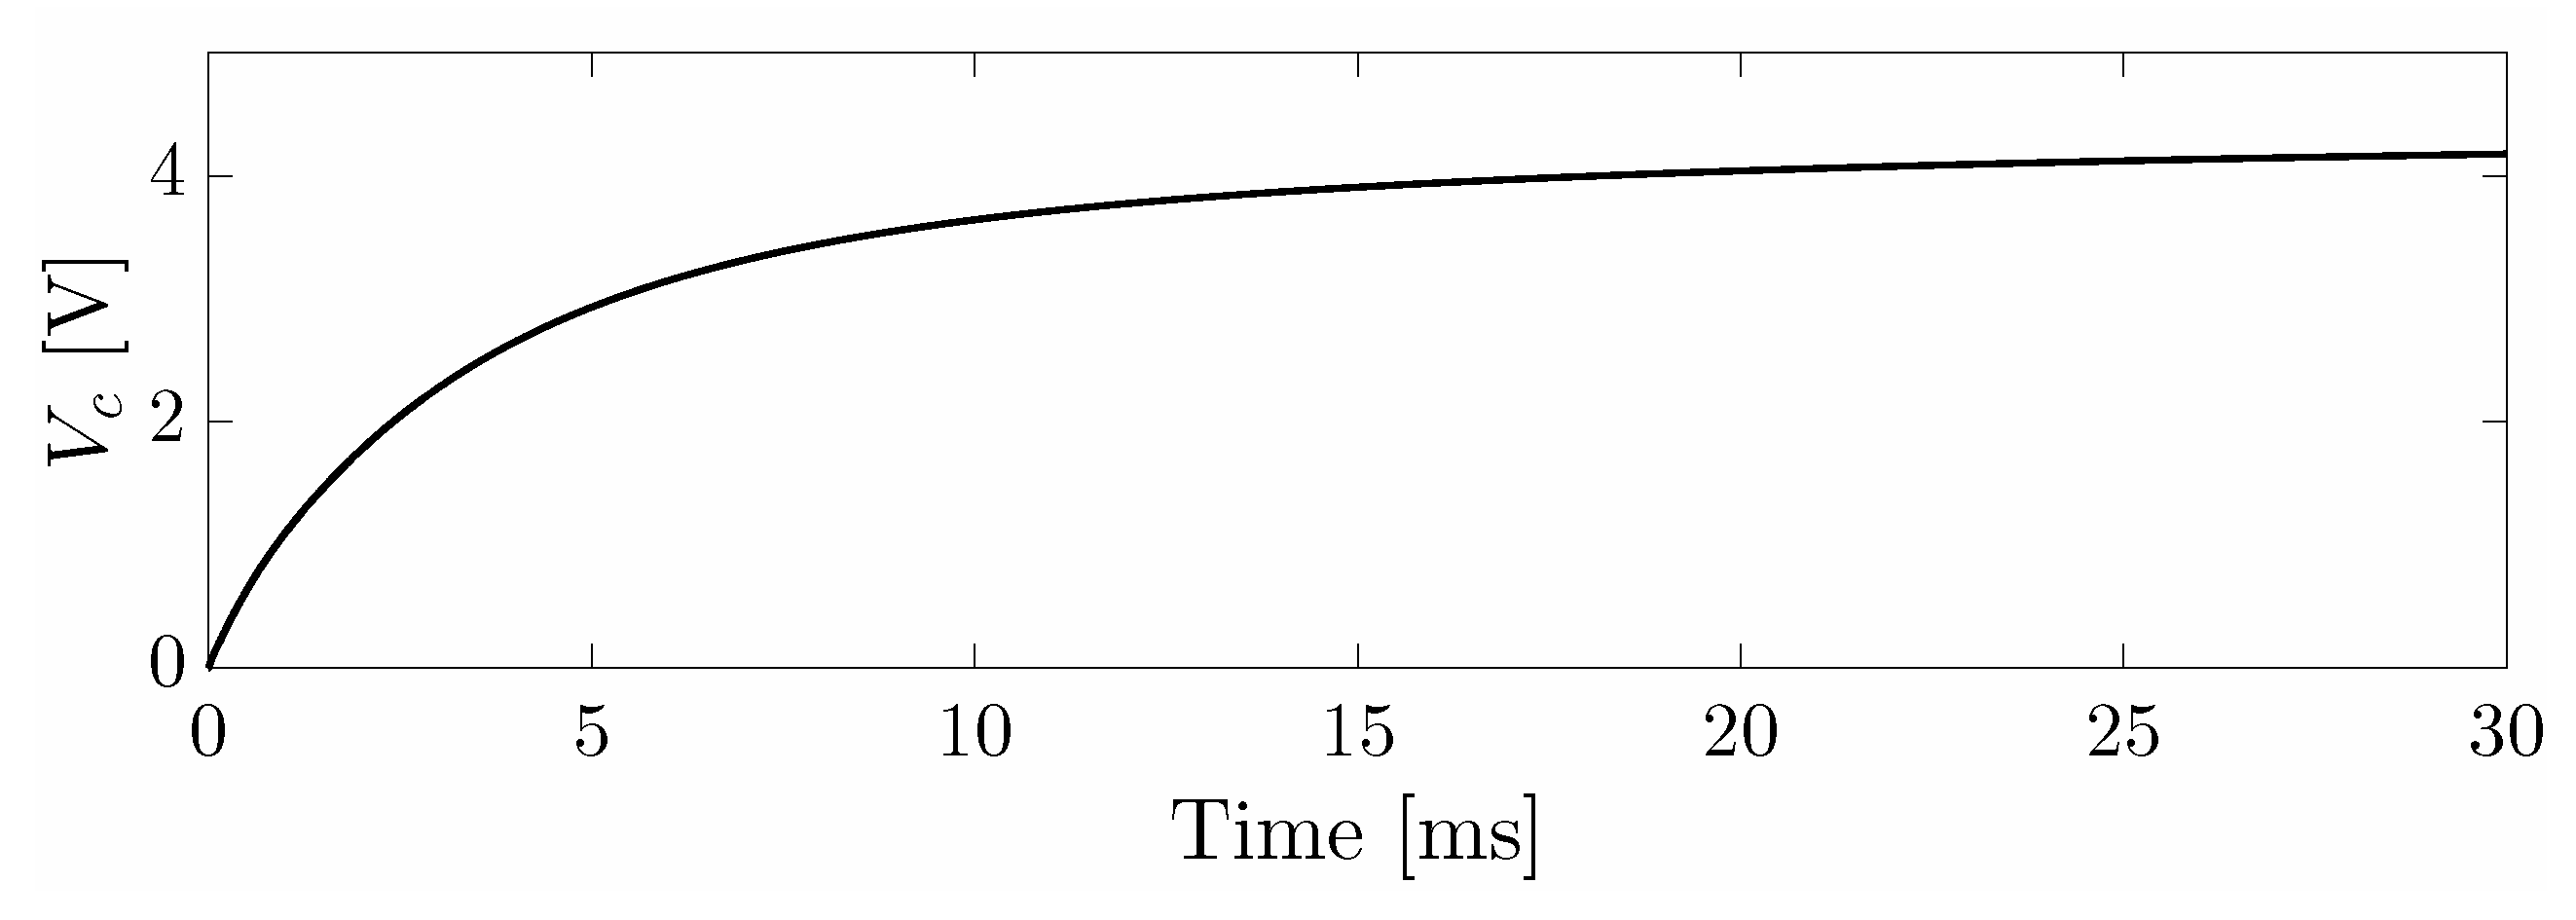
Figure 7, can help to increase the voltage at the storage capacitor. The design uses 1 nF capacitors and the same Schottky diodes as in the peak detector. The simulation results are shown in
Figure 8 where it is easily seen that the voltage can boosted up to 4 V. Again, it is worth mentioning that the time scale is not real since it depends on the number of partial discharges. In fact, to reach this voltage it would be necessary to acquire 30000 partial discharges with an average energy as the signal in
Figure 2. The time that takes to acquire this number of high amplitude pulses would depend on how damaged is the insulation, the insulation type, the type of defect, the path to ground, etc. Since the Cockcroft-Walton generator is also a full wave rectifier, the storage capacitor charge is faster as more pulses contribute to its charging.
3. Experimental results
The circuit in
Figure 7 was printed on a PCB with SMD components. The capacitance of the storage capacitor was 1 mF so the charging time was slower but the total stored energy is increased. The output of the HFCT in
Figure 1 was connected to the voltage multiplier. Since the charging time depends directly on the number of partial discharges, its evolution with time was previously studied giving the results shown in
Table 1. Its is clear that after 20 minutes the number reaches a steady rate close to
discharge per cycle of 50 Hz. This rate is fairly stable with time and it is one of the most common parameters used in the identification of aging in insulation systems. It is arguable that if the number of partial discharges per cycle raises, the insulation is suffering some type of degradation. Therefore, measuring the energy stored in the capacitor, namely its voltage, provides an indirect method of measuring
and, hence, the insulation aging.
Aging a dielectric is a difficult task so we have tested how the energy changes with
changing the voltage applied to the electrode on the insulation sheet in
Figure 1. When this voltages is raised, the number of partial discharges increases during some minutes until the steady rate is reached again. This increment in
results on a noticeable gain of energy stored in the capacitor.
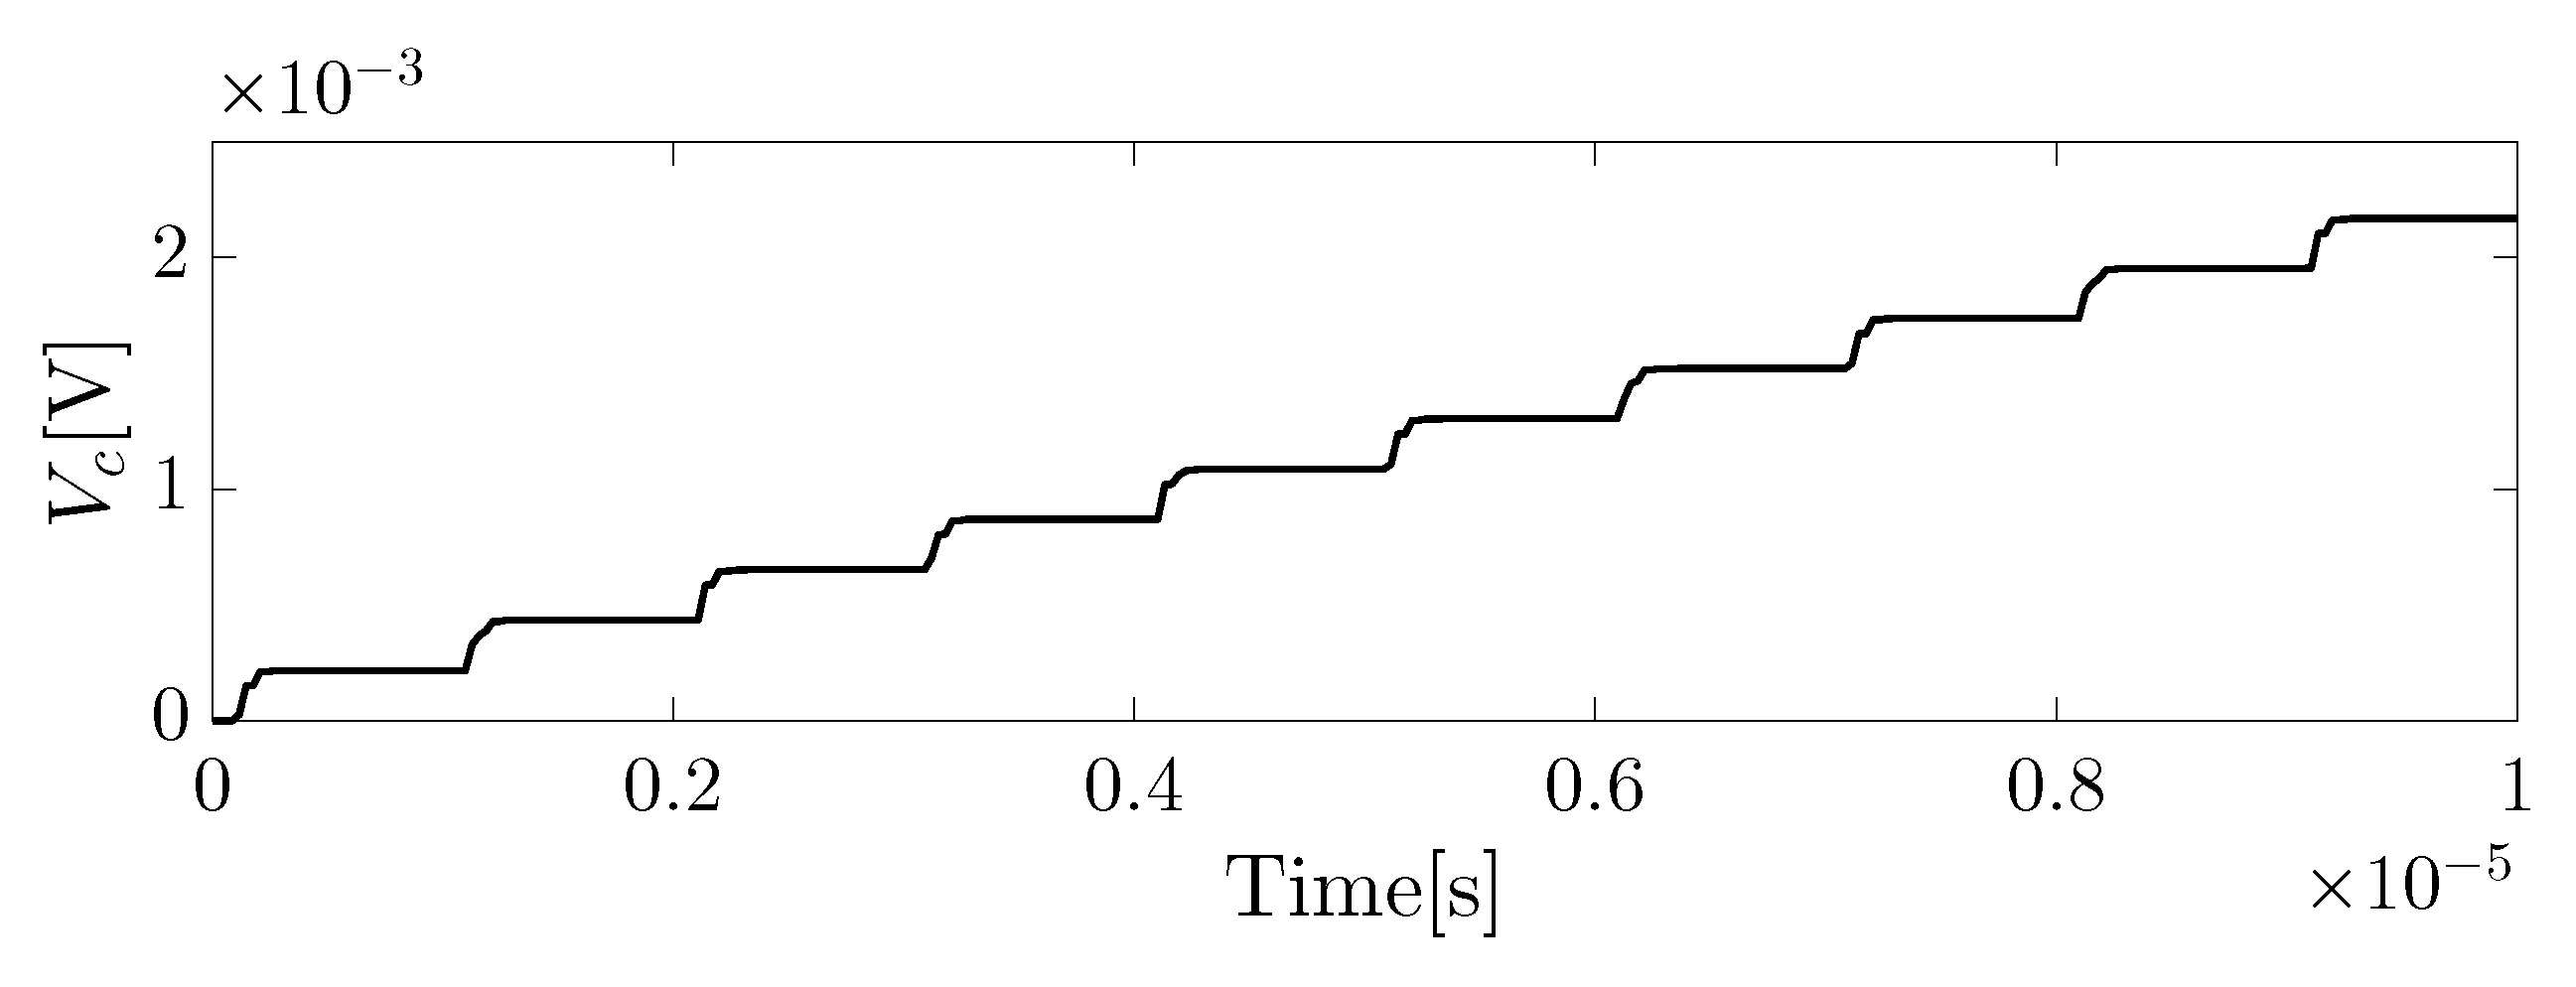
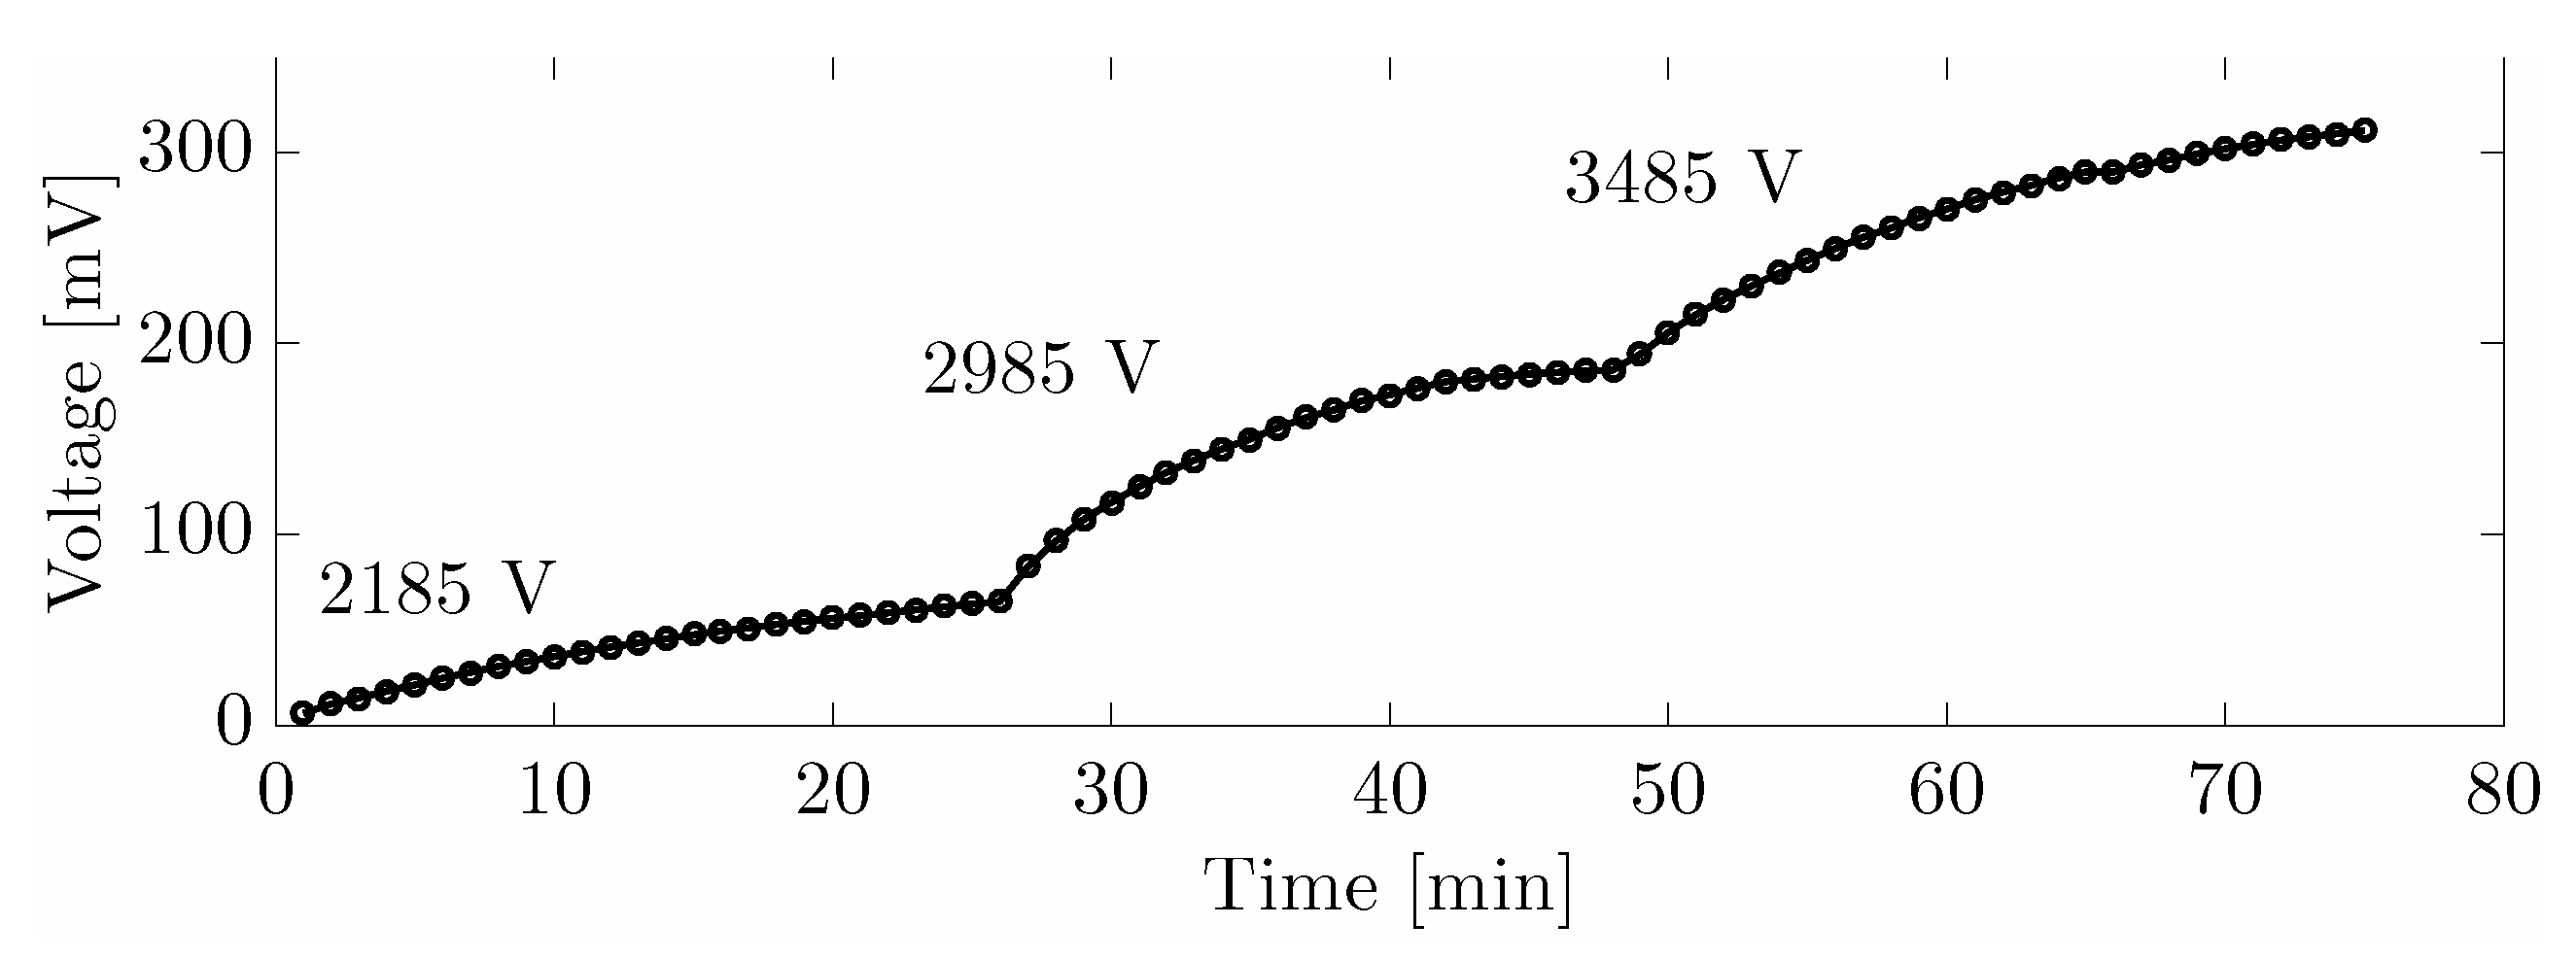
Figure 9 shows three voltage levels applied to the electrode and the evolution of the capacitor voltage time.
4. Conclusions
The proposed system to assess the status of insulation systems in electrical machines is based on the scavenging of energy from partial discharges. Since these phenomena are directly related with the aging of dielectrics, studying the increase of the stored energy can help in the early detection of possible failures. Moreover, the cost of the detector is negligible so a large number of devices can be deployed in substations connected to a wireless sensor network to share the information on the status of the assets.
At this stage, the voltage at the capacitor was acquired every minute with an oscilloscope. The input impedance was set to 1 M so it draws as low current as possible to not discharge the capacitor. The final prototype would include an autonomous acquisition system with a small microprocessor to detect sudden changes in the charging rate.
At the capacitor voltage levels shown in
Figure 9, the charging slope is constant when the number of partial discharge per cycle is steady and results in 1 mV/min. If the measurements were carried out in other test objects, this slope would certainly be different. Moreover, if there are other high frequency disturbances such as conducted pulse-width modulation signals, they would also contribute to the charging of the capacitor. However, these interferences are steady in time, so they would add to the constant slope and would not affect to the detection of a sudden variation of the generation of partial discharges.


