
Mittag–Leffler Function as an Approximant to the Concentrated Ferrofluid’s Magnetization Curve


1
Faculty of Natural Sciences, Southwest State University, 50 Let Oktyabrya St., 94, 305048 Kursk, Russia
2
Department of Theoretical Physics, Kursk State University, Radishcheva St., 33, 305000 Kursk, Russia
*
Author to whom correspondence should be addressed.
Fractal Fract. 2021, 5(4), 147; https://doi.org/10.3390/fractalfract5040147
Submission received: 30 August 2021
/
Revised: 24 September 2021
/
Accepted: 27 September 2021
/
Published: 30 September 2021
(This article belongs to the Special Issue Fractional Calculus Operators and the Mittag-Leffler Function)
Abstract
:In this work, we show that the static magnetization curve of high-concentrated ferrofluids can be accurately approximated by the Mittag–Leffler function of the inverse external magnetic field. The dependence of the Mittag–Leffler function’s fractional index on physical characteristics of samples is analysed and its growth with the growing degree of system’s dilution is revealed. These results provide a certain background for revealing mechanisms of hindered fluctuations in concentrated solutions of strongly interacting of the magnetic nanoparticles as well as a simple tool for an explicit specification of macroscopic force fields in ferrofluid-based technical systems.
1. Introduction
The magnetization of ferrofluids under realistic conditions of a highly concentrated suspension of magnetic particles covered by envelopes preventing the aggregation, and taking into account the possible polydispersity of these particles, is a complicated problem of condensed matter physics still far from its final resolution [1,2,3,4,5,6].
While the qualitative picture of superparamagnetic phenomena in ideal diluted media of magnetic dipoles is well-established [7], the effects of multiparticle interactions, aggregation of nanoparticles and their hindered rotation, a wide spectrum of possible relaxation times under such conditions do not allow practically applicable straightforward calculations.
Among the most accepted approaches, one can note the second-order modified mean-field (MMF2) theory proposed in the work [8], which treats the macroscopic magnetization M of ferrofluid as a function of the applied magnetic field intensity H in the form
where angle brackets denote averaging over the ensemble of microscopic magnetic moments and the particle size distribution, and are is the vacuum permeability and Boltzmann’s constant, respectively, is the density and
is the effective magnetic field in a medium with
where is the Langevin function.
Although this method and its further improvements, which take into account higher-order in the dipolar coupling constant for polydisperse concentrated ferrofluids [9], reasonably reproduce the magnetization curve, and especially the initial susceptibility
with
that makes it useful for magnetic granulometry of ferrofluids, it requires assumptions on the statistic properties of magnetic nanoparticles and rather complicated numerical computation of integrals when calculating integrals with the respective probability density functions.
On the other hand, a variety of practical problems require the knowledge of an accurate shape of the magnetization curve not around the zero field (4) but in the range of strong external magnetic field, where this line is highly curved, and further toward the saturation but not reaching the latter.
Most traditional technical applications of the magnetic fluid-based systems such as sensors, sealers, acoustic systems [10,11] as well as modern applications in microfluidics [12], controlled magnetophoresis [13], self-assembly [14], and separation [15] use the range of magnetic fields in which the working fluid is placed is in the middle region of the magnetization curve far from both the interval of initial magnetization and saturation. Therefore, predicting the shape of the magnetization curve in the region of its significant curvature is also an important technical task.
This situation induces the emergence of several alternative approaches aimed at an efficient fitting of ferrofluid’s magnetisation stated as an explicit function of the external magnetic field by an appropriate set of approximating functions [16,17,18,19] adjusted to experimental conditions.
In this work, we explore the Mittag–Leffler function as a promising universal approximant chosen for two reasons: (i) this function has high flexibility for fitting data with quite various behaviour [20] and (ii) the Mittag–Leffler function is involved in the description of fluctuational and relaxational processes in ferrofluids [21,22] that may affect the stationary magnetization in an external field.
2. Experimental Data and Their Processing
2.1. Measurements of Ferrofluid’s Magnetization
As an example of the practical analysis of ferrofluid’s magnetisation, we consider the set of samples specified previously in the work [23], which are obtained by the sequential dilutions of the initial magnetic liquid denoted as MF-1, see the parameters in Table 1. This procedure assures the same structure of magnetic nanoparticles in all samples, which differ by their concentration only.
To determine the magnetisation of samples, the ballistic method was used. Its essence is that the measuring cell containing magnetic fluid is placed between the poles of the electromagnet connected to a micromagnetometer (the relative uncertainty of measurements is estimated as 2.5%). The change of the magnetic flux after the cell’s rotation was registered allows calculating the magnetization, see [24] for technical details.
The maximal intensity of the magnetic field allowed by the setup is equal to in the region of measurements. During the experiment, the tending of ferrofluid’s magnetization to the saturated state in the strong magnetic field was controlled by plotting the magnetization as a function of the inverse magnetic field as follows from the definition for that implies as well as by monitoring the change of magnetization at subsequent steps of the magnetic field elevation. It is noted that the relative change of the registered for H close to tends to limits of experimental uncertainty that means that the obtained experiments data satisfy the conditions of “ferrofluid’s magnetization in a strong external magnetic field”.
2.2. The Mittag–Leffler Function as an Approximant for the Static Magnetization Curve
Being based on the asymptotic expansion of the Langevin function, the conventional way to consider the magnetization curve, when it tends to the state of saturation in a strong external magnetic field, is considering the function , which has the asymptotic form
where is some effective magnetic moment obtained via the procedure of an appropriate statistical averaging. In particular, for diluted systems it is argued [17] that it is related to the harmonic mean of elementary magnetic moments; MMF2 theory gives more complicated expression, which depends on the chosen statistical distribution, but does not change the principal functional form. As a consequence, the saturated magnetization is operationally defined as the limit when with the usage of the least mean square fitting experimental data.
Note however, that certain precautions related to the direct usage of Equation (6) were noted even in early works on the superparamagnetism in ferrofluids [25,26] argued to the free energy difference between initial and final states and different magnetization routes for very small and relatively larger magnetic particles. The latter was also noted recently in ref. [17].
In fact, experimental data showed in Figure 1A follow a curved path resembling some stretched exponential rather than a straight line as a function of the inverse magnetic field. This argues in favour of searching a more relevant approximation than Equation (6).
The promising candidate is the form
expressed via the Mittag–Leffler function defined as [27,28]
where is the Gamma function, and can be fractional, and a is a parameter whose physical meaning will be discussed below.
At the same time, , and the limiting case for
reduces this representation to Equation (6) in the classic superparamagnetic case. In this case ; in the general case it is an indefinite parameter to be determined by the fitting procedure.
In application to magnetization curve data for all dilutions, the fitting procedure and the subsequent computation of the Mittag–Leffler function with the parameters determined by this fitting were carried out using the packages [29,30] for MATLAB. Figure 2 clearly shows that the solid curves representing the functional form (7) accurately reproduce the experimental data not only in the asymptotic region of strong magnetic fields but practically over the whole range. The double logarithmic scale is used to better distinguish between curves, which otherwise go too close to each other in the region of small .
The values provided in Table 1 indicate that the relative average absolute deviations defined as
do not exceed a few percents. Figure 1B illustrates the distribution of these deviations in more details for MF-2 (for the rest of ferrofluids the picture is principally the same). One can see that they are distributed symmetrically over zero, i.e., this is connected with the experimental uncertainty. They are sufficiently small over the great majority of the external margetic filed range; the larger deviations are revealed in the close vicinity of the demagnetized state () only.
3. Discussion
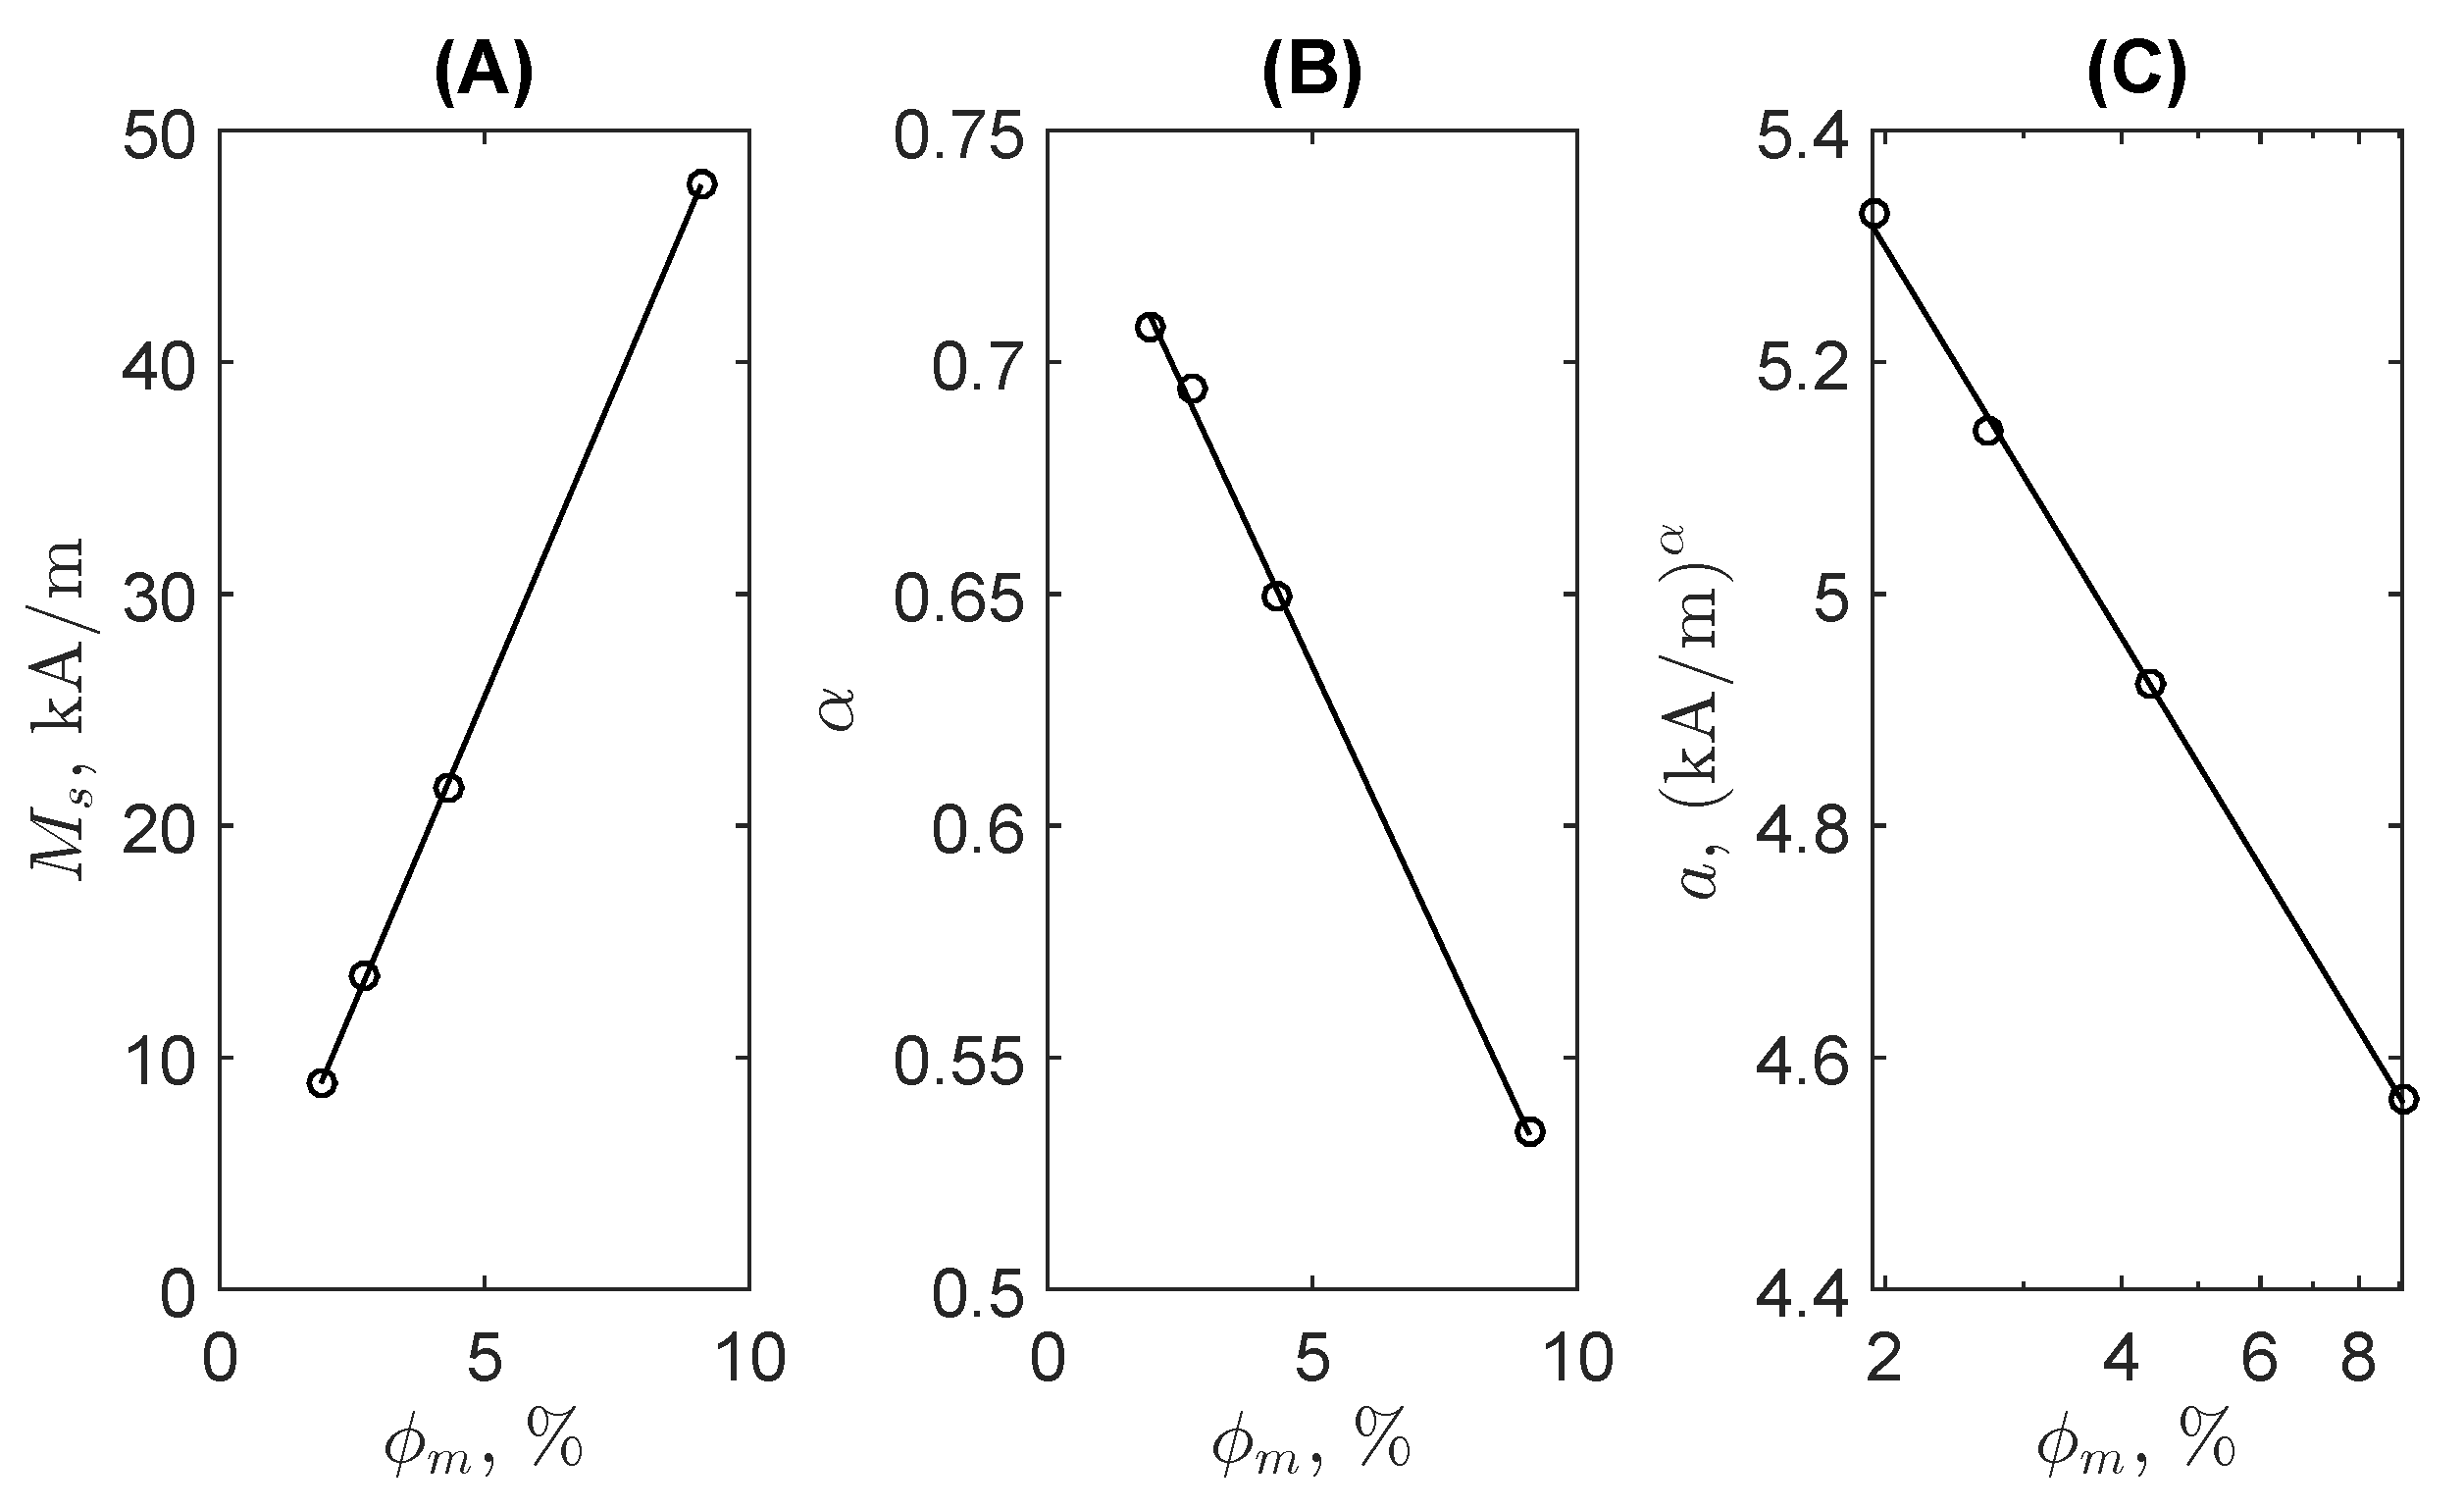
Thus, the Mittag–Leffler function-based expression (7) reproduces the magnetization curve with practically acceptable accuracy. Moreover, plotting the values of parameters listed in Table 1, one can see a certain regularity in their dependence on the magnetic phase concentration as shown in Figure 3 when a fluid’s state is far from a very diluted system, which should exhibit the classic superparamegnetic behaviour, and the Langevin function does not reduces to the Mittag–Leffler representation.
On the contrary, the dependences for concentrated systems can be connected to physical mechanisms. Looking at Table 1 and Figure 3B it is seen that the -index of the diminishes with the growing concentration of magnetic nanoparticles in a regular way that means that anomalous long-range effects accompany the more concentrated systems.
Note that the function (7) is a solution to the fractional differential equation
with the initial condition , where the fractional derivative of order in the Caputo sense,
The integer-order derivative within the integrand in Equation (11) is especially written explicitly as to highlight its meaning as the usual differential magnetic susceptibility. Therefore, it follows from Equations (10) and (11) that the parameter a can be considered to be a kind of the inverse fractional magnetic susceptibility, which is taken into account when the system is demagnetized to some state from the completely ordered one (, ). The higher concentrations lead to smaller values of that implies wider integration kernels in Equation (11), i.e., more expressed effects of retarded magnetic restructuring due to many-particle interactions.
In the concentrated systems, the growth of the applied magnetic field can induce chain formation resulting in the magnetisation response of the mixture of elementary magnetic dipoles of single (even interacting particles) and multicore aggregates [31].
Another feature related to the experimental procedure of measurements of concentrated ferrofluids magnetization in a strong magnetic field was revealed in the works [32,33], where it has been noted that a relatively long measurement procedure may lead to the system’s slow restructuring, which changes its macroscopic magnetic properties. Such a process is characterized by the relaxation times significantly exceeding those for Neel and Brown mechanisms. Moreover, the stretched exponential time dependence argues in favour of anomalous kinetics that unavoidably requires the usage of the Mittag–Leffler function.
Thus, we can hypothesize that the revealed fitting dependence on the external magnetic field may emerge as a fractional-order response to the switching-on external magnetic field accompanied by a hindered alignment of elementary magnetic dipoles in concentrated ferrofluids, their anomalous kinetic-based fluctuations and, additionally, a specific field shielding. As a kind of analogy, one can mention that Equation (1) contains as its argument, which, in turn, also contains the Langevin function. Thus, combining both (1) and (2) under the strong-field approximation (6), we obtain the nested structure similar to the first terms of the continued fraction representation of the electric ladder circuit that is a known example [34] of the system leading to the fractional-order dynamics with solutions expressed via the Mittag–Leffler function.
As a kind of argument supporting this hypothesis, we can consider dependencies shown in Figure 3. One can note that the dilution of the system, i.e., diminished concentration of the magnetic phase , leads to the growing -index. This realizes a transition from Equations (8) and (9) to the classic hyperbolic law (6) in the asymptotic limit. However, there is also a caveat: this Mittag–Leffler function-based consideration seems not be applicable to the completely demagnetized state when it results in diverging . This is also supported by Figure 1B where the deviations from the approximant grow approaching this state and Figure 3A where the linear approximation of the saturation magnetization does not go through the point . However, this conclusion does not affect the accuracy of approximation and regularities at moderate and high values of the applied external magnetic fields. On the contrary, large concentrations result in effects of the hindered rotation of magnetic nanoparticles preventing their alignment in the magnetic field, viscoelastic retardation of the alignment, agglomeration, etc, see the discussion above. All these factors lead to the emergence of memory effects that is reflected by the diminishing of the fractional index in the respective Mittag–Leffler function-based representation. At the same time, the linear dependence of the magnitude of the saturated magnetization shown in Figure 3A is the completely classic effect reflected even in the expression (1): larger concentrations of the magnetic phase directly proportionally result in the larger saturation magnetizations. The last of three dependencies, see Figure 3C is a phenomenological one but its logarithmic character is qualitatively expectable because the amplitude parameter a is a multiplier but not an additive term.
Finally, we should stress that the reasons described above have physically qualitative character, while the dependences shown in Figure 3 can find a direct practical application: when several experimental data points follow linear regularity for different concentrations of the magnetic phase, one can use the obtained regression lines to predict the magnetic response (the magnetization curve) of ferrofluids at intermediate concentrations without carrying out additional time-consuming measurements.
4. Conclusions
In this work, we demonstrated that the Mittag–Leffler function can be used as an efficient approximant for the representation of the ferrofluid magnetization curve at moderate and strong external magnetic field as an explicit function of the latter. This approach has an advantage as using only a small number of parameters to be fitted. Among them, the saturated magnetization is determined as better corresponding to the way of change of experimental data within the experimentally accessible range of applied magnetic fields. In addition, it is shown, see Figure 3 that there exits a regularity in the change of these parameters in response to the change of the concentration of the magnetic nanoparticles while the latter is not very small. As a result, one can predict the change magnetic properties of a ferrofluid due to its dilution, i.e., a small number of reference dilutions used to determine the coefficients of linear fits of these parameters. In turn, they provide an opportunity to plan dilutions leading to desired magnetic properties. Thus, it can be easily used in applied problems, which demand the phenomenological high-accurate analytic representation of ferrofluid’s magnetization when the controlling configuration of the external magnetic field is stated by the system’s construction. Among such applications, one can mention different microfluidic devices operating with microparticles and biological cells, e.g., [12,35], devices based on the magneto-Archimedes effect, e.g., [15,16,23], ferrofluid-based measuring devices [19,36], etc.
In addition, the static field-dependent magnetic susceptibility (except the close vicinity of the state ) also has a simple analytical representation in this case since the derivative of the Mittag–Leffler function (8) is known [28]
and can be accurately computed numerically with the existing software [30].
Finally, the revealed mathematical dependence poses some outlooks for future more detailed investigations of possible physical mechanisms, which may lead to such a representation of static magnetization in the form close to typical for anomalous kinetics processes. In particular, does it mean the existence of fractional-order fluctuations in the case of high concentrations of magnetic nanoparticles that possibly results in trapping their rotation, etc.?
Author Contributions
Conceptualization, E.B.P.; methodology, E.B.P. and P.A.R.; software, E.B.P.; formal analysis, E.B.P.; investigation, P.A.R. and E.B.P.; resources, P.A.R.; data curation, P.A.R.; writing—original draft preparation, E.B.P. and P.A.R.; writing—review and editing, P.A.R. and E.B.P.; visualization, E.B.P.; supervision, E.B.P. All authors have read and agreed to the published version of the manuscript.
Funding
P.A.R. is supported by the Ministry of Science and Higher Education of the Russian Federation, Russia within the research project of the state task No. 0851-2020-0035.
Data Availability Statement
The raw magnetization data used for illustrating the model reported in this study by figures are available on the reasonable request from the first author (P.A.R.).
Conflicts of Interest
The authors declare no conflict of interest.
References
- Bedanta, S.; Kleemann, W. Supermagnetism. J. Phys. D Appl. Phys. 2008, 42, 013001. [Google Scholar] [CrossRef]
- Wu, K.; Tu, L.; Su, D.; Wang, J.P. Magnetic dynamics of ferrofluids: Mathematical models and experimental investigations. J. Phys. D Appl. Phys. 2017, 50, 085005. [Google Scholar] [CrossRef]
- Lebedev, A.V.; Stepanov, V.I.; Kuznetsov, A.A.; Ivanov, A.O.; Pshenichnikov, A.F. Dynamic susceptibility of a concentrated ferrofluid: The role of interparticle interactions. Phys. Rev. E 2019, 100, 032605. [Google Scholar] [CrossRef]
- Usov, N.A.; Serebryakova, O.N. Equilibrium properties of assembly of interacting superparamagnetic nanoparticles. Sci. Rep. 2020, 10, 13677. [Google Scholar] [CrossRef]
- Devi, E.C.; Singh, S.D. Tracing the Magnetization Curves: A Review on Their Importance, Strategy, and Outcomes. J. Supercond. Nov. Magn. 2020, 34, 15–25. [Google Scholar] [CrossRef]
- Dikansky, Y.I.; Ispiryan, A.G.; Arefyev, I.M.; Kunikin, S.A. Effective fields in magnetic colloids and features of their magnetization kinetics. Eur. Phys. J. E 2021, 44, 1–13. [Google Scholar] [CrossRef] [PubMed]
- Rosensweig, R.E. Ferrohydrodynamics; Cambridge University Press: Cambridge, UK, 1985. [Google Scholar]
- Ivanov, A.O.; Kuznetsova, O.B. Magnetic properties of dense ferrofluids: An influence of interparticle correlations. Phys. Rev. E 2001, 64, 041405. [Google Scholar] [CrossRef] [PubMed]
- Solovyova, A.Y.; Elfimova, E.A.; Ivanov, A.O.; Camp, P.J. Modified mean-field theory of the magnetic properties of concentrated, high-susceptibility, polydisperse ferrofluids. Phys. Rev. E 2017, 96, 052609. [Google Scholar] [CrossRef] [Green Version]
- Rosensweig, R.E. Magnetic fluids. Annu. Rev. Fluid Mech. 1987, 19, 437–461. [Google Scholar] [CrossRef]
- Vékás, L. Ferrofluids and Magnetorheological Fluids. Adv. Sci. Technol. 2008, 54, 127–136. [Google Scholar] [CrossRef] [Green Version]
- Zhao, W.; Cheng, R.; Miller, J.R.; Mao, L. Label-free microfluidic manipulation of particles and cells in magnetic liquids. Adv. Funct. Mater. 2016, 26, 3916–3932. [Google Scholar] [CrossRef] [Green Version]
- Ivanov, A.S.; Pshenichnikov, A.F. Magnetophoresis and diffusion of colloidal particles in a thin layer of magnetic fluids. J. Magn. Magn. Mater. 2010, 322, 2575–2580. [Google Scholar] [CrossRef]
- Wang, L.; Wang, J. Self-assembly of colloids based on microfluidics. Nanoscale 2019, 11, 16708–16722. [Google Scholar] [CrossRef]
- Gao, Q.H.; Zhang, W.M.; Zou, H.X.; Li, W.B.; Yan, H.; Peng, Z.K.; Meng, G. Label-free manipulation via the magneto-Archimedes effect: Fundamentals, methodology and applications. Mater. Horizons 2019, 6, 1359–1379. [Google Scholar] [CrossRef]
- Lee, J.H.; Nam, Y.J.; Yamane, R.; Park, M.K. Position feedback control of a nonmagnetic body levitated in magnetic fluid. J. Phys. Conf. Ser. 2009, 149, 012107. [Google Scholar] [CrossRef]
- Rehberg, I.; Richter, R.; Hartung, S.; Lucht, N.; Hankiewicz, B.; Friedrich, T. Measuring magnetic moments of polydisperse ferrofluids utilizing the inverse Langevin function. Phys. Rev. B 2019, 100, 134425. [Google Scholar] [CrossRef] [Green Version]
- Rehberg, I.; Richter, R.; Hartung, S. Graphical Magnetogranulometry of EMG909. J. Magn. Magn. Mater. 2020, 508, 166868. [Google Scholar] [CrossRef] [Green Version]
- Ryapolov, P.A.; Sokolov, E.A.; Bashtovoi, V.G.; Reks, A.G.; Postnikov, E.B. Equilibrium configurations in a magnetic fluid-based field mapping and gas pressure measuring system: Experiment and simulations. AIP Adv. 2021, 11, 015206. [Google Scholar] [CrossRef]
- Podlubny, I.; Petráš, I.; Škovránek, T. Fitting of experimental data using Mittag–Leffler function. In Proceedings of the IEEE 13th International Carpathian Control Conference (ICCC), High Tatras, Slovakia, 28–31 May 2012; pp. 578–581. [Google Scholar] [CrossRef]
- Fannin, P.C. On the use of dielectric formalism in the representation of ferrofluid data. J. Mol. Liq. 1996, 69, 39–51. [Google Scholar] [CrossRef]
- Kalmykov, Y.P. Fractional rotational Brownian motion in a uniform dc external field. Phys. Rev. E 2004, 70, 051106. [Google Scholar] [CrossRef]
- Ryapolov, P.A.; Polunin, V.M.; Postnikov, E.B.; Bashtovoi, V.G.; Reks, A.G.; Sokolov, E.A. The behaviour of gas inclusions in a magnetic fluid in a non-uniform magnetic field. J. Magn. Magn. Mater. 2020, 497, 165925. [Google Scholar] [CrossRef]
- Polunin, V.M. Acoustics of Nanodispersed Magnetic Fluids; CRC Press: Boca Raton, FL, USA, 2015. [Google Scholar]
- Mayer, A.; Vogt, E. Magnetische Messungen an Eisenamalgam zur Frage: Ferromagnetismus und Korngröße. Z. Naturforschung A 1952, 7, 334–340. [Google Scholar] [CrossRef]
- Bean, C.P.; Jacobs, I.S. Magnetic granulometry and super-paramagnetism. J. Appl. Phys. 1956, 27, 1448–1452. [Google Scholar] [CrossRef]
- Podlubny, I. Fractional Differential Equations: An Introduction to Fractional Derivatives, Dractional Differential Equations, to Methods of Their Solution and Some of Their Applications; Academic Press: San Diego, CA, USA, 1998. [Google Scholar]
- Mainardi, F. Why the Mittag–Leffler function can be considered the Queen function of the Fractional Calculus? Entropy 2020, 22, 1359. [Google Scholar] [CrossRef]
- Podlubny, I. Fitting Data Using the Mittag–Leffler Function. Available online: https://www.mathworks.com/matlabcentral/fileexchange/32170-fitting-data-using-the-mittag-leffler-function (accessed on 30 September 2021).
- Podlubny, I. Mittag–Leffler Function. Available online: https://www.mathworks.com/matlabcentral/fileexchange/8738-mittag-leffler-function (accessed on 30 September 2021).
- Li, J.; Lin, Y.; Liu, X.; Lin, L.; Zhang, Q.; Fu, J.; Chen, L.; Li, D. The quasi-magnetic-hysteresis behavior of polydisperse ferrofluids with small coupling constant. Phys. B Condens. Matter 2012, 407, 4638–4642. [Google Scholar] [CrossRef]
- Lukashevich, M.V.; Naletova, V.A.; Turkov, V.A.; Nazarenko, A.V. A new method of measuring magnetization of a magnetic fluid not affecting its dispersive composition and calculation of volume distribution function. J. Magn. Magn. Mater. 1993, 122, 139–141. [Google Scholar] [CrossRef]
- Jin, D.; Kim, H. Magnetization of magnetite ferrofluid studied by using a magnetic balance. Bull. Korean Chem. Soc. 2013, 34, 1715–1721. [Google Scholar] [CrossRef] [Green Version]
- Sierociuk, D.; Podlubny, I.; Petras, I. Experimental evidence of variable-order behavior of ladders and nested ladders. IEEE Trans. Control Syst. Technol. 2012, 21, 459–466. [Google Scholar] [CrossRef] [Green Version]
- Myklatun, A.; Cappetta, M.; Winklhofer, M.; Ntziachristos, V.; Westmeyer, G.G. Microfluidic sorting of intrinsically magnetic cells under visual control. Sci. Rep. 2017, 7, 6942. [Google Scholar] [CrossRef] [PubMed] [Green Version]
- Smolyaninov, I.I.; Smolyaninova, V.N. Fine tuning and MOND in a metamaterial “multiverse”. Sci. Rep. 2017, 7, 8023. [Google Scholar] [CrossRef] [Green Version]
Figure 1.
(A) The magnetization of the ferrofluid MF-2 as a function of the inverse external magnetic field, experimental values (circles) and their approximation by the Mittag–Leffler function (curve); (B) the relative deviation between the data and their approximation plotted as a function of the external magnetic field applied to the sample.
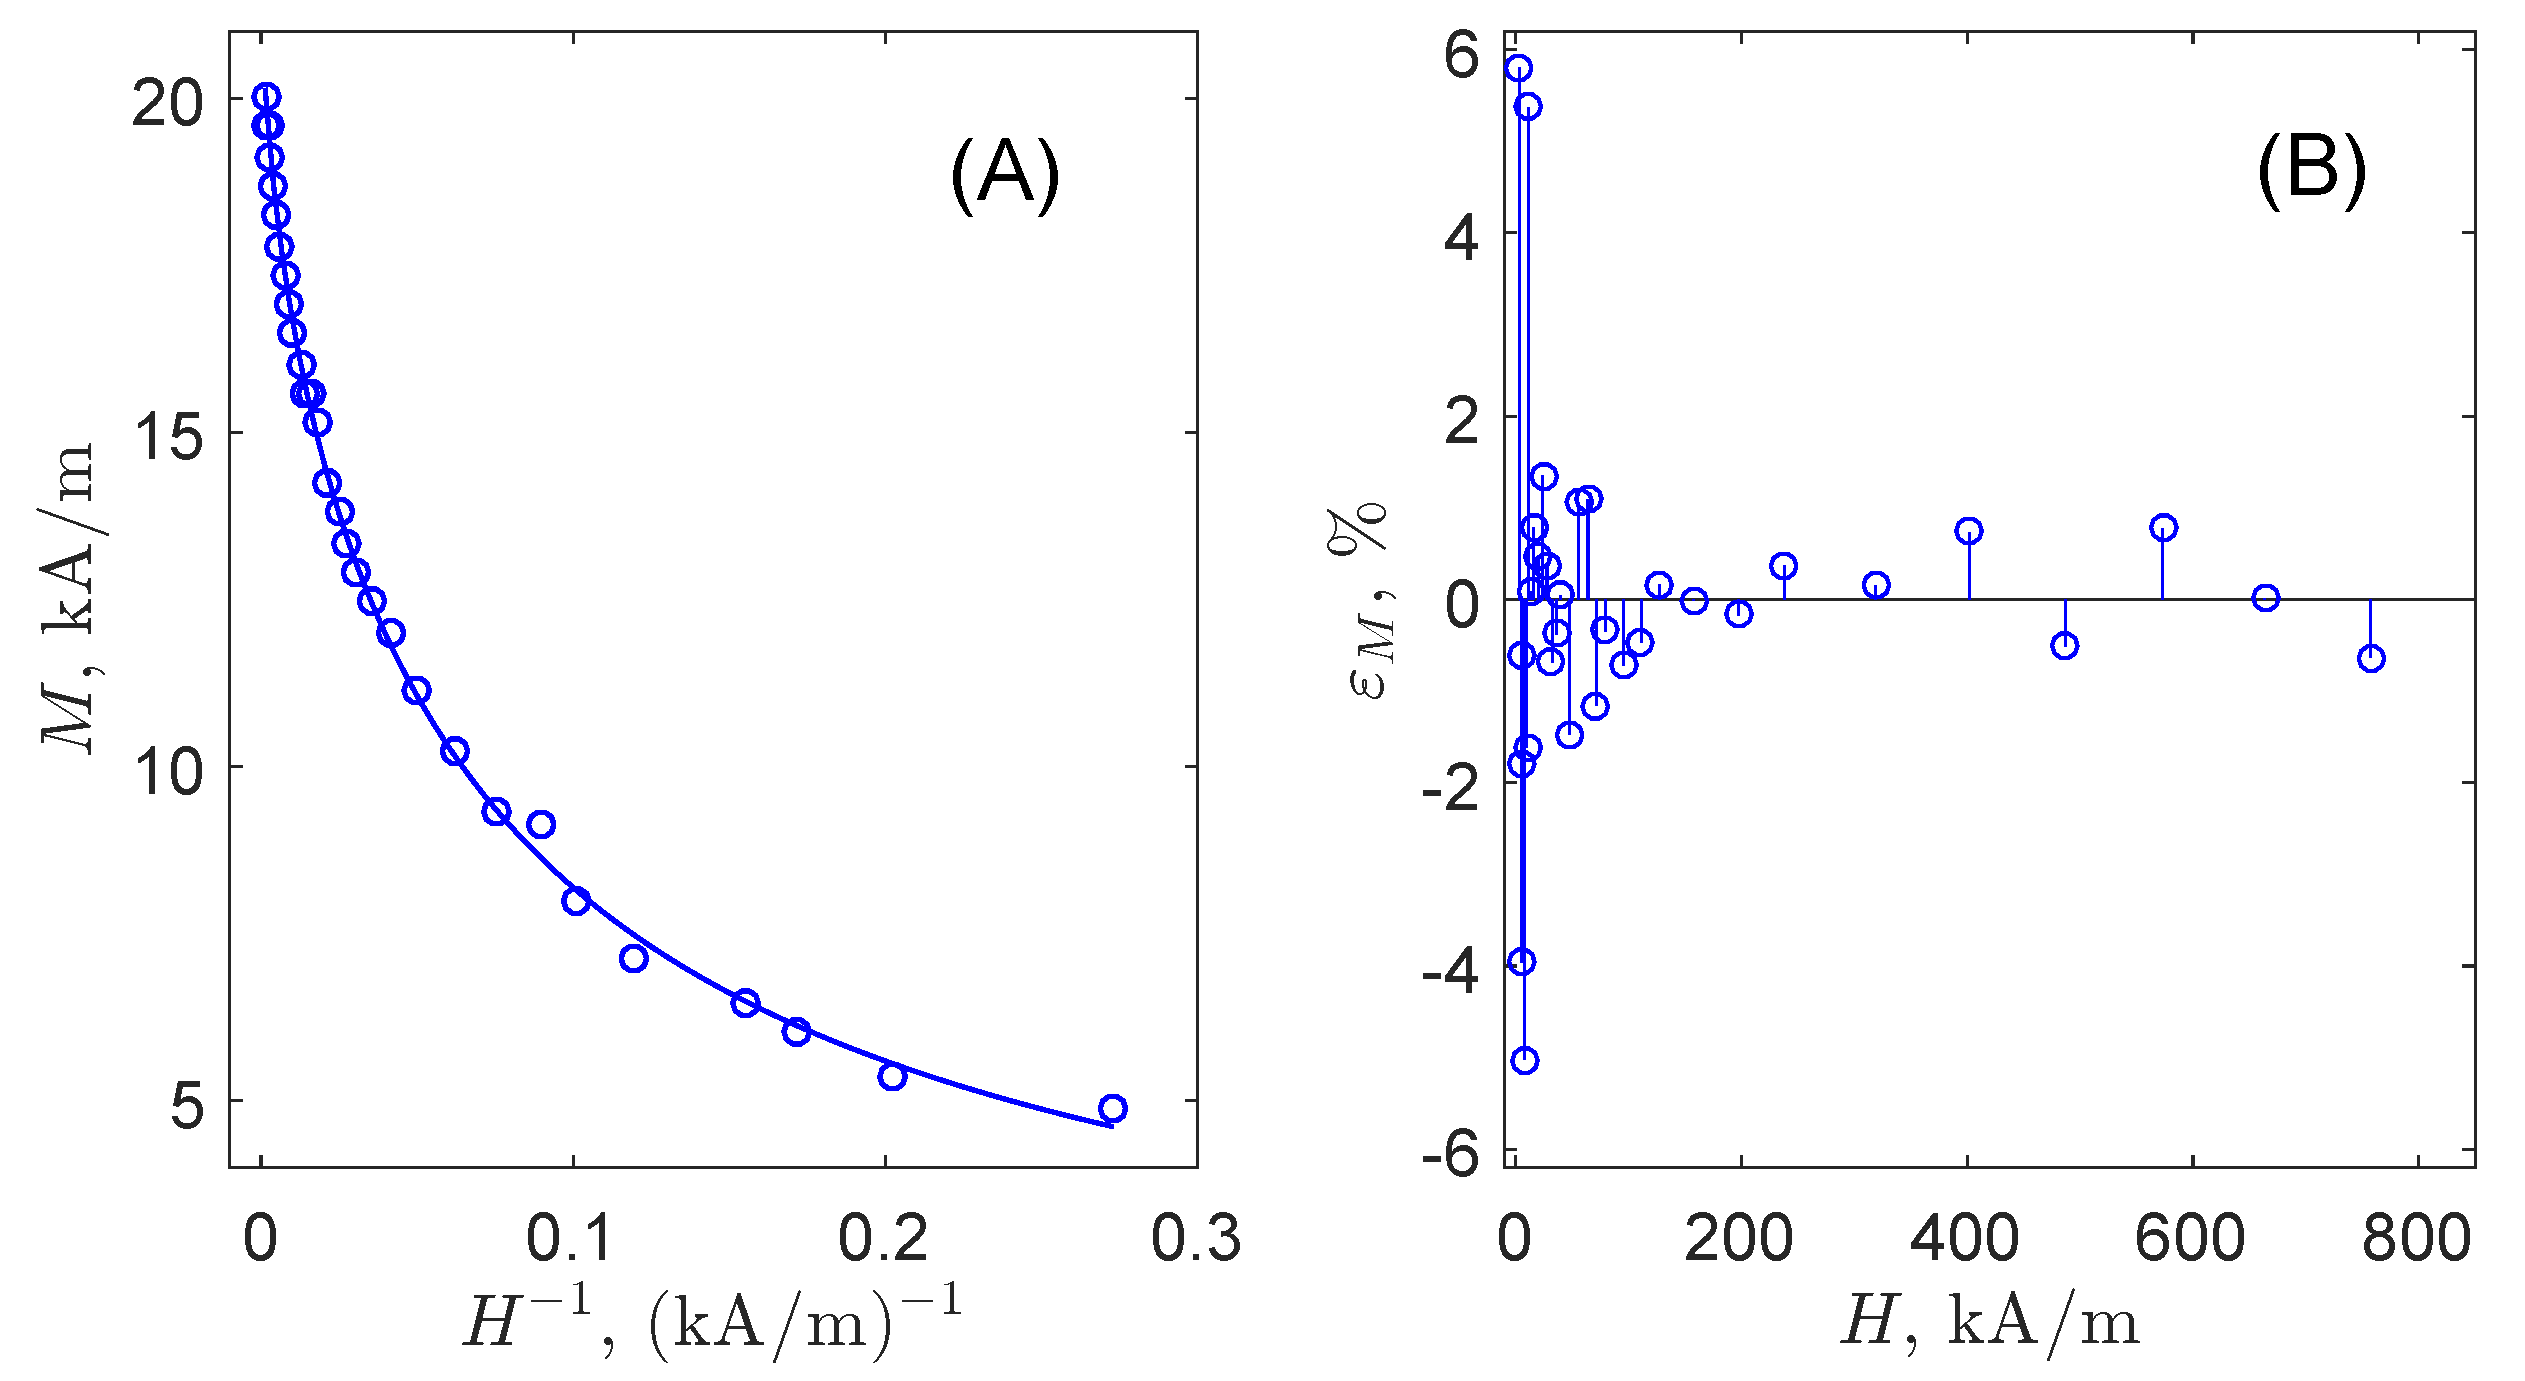
Figure 2.
The magnetization curves in double logarithmic scale for all ferrofluids listed in Table 1: experimental data (markers) and their the Mittag–Leffler function-based approximations (curves).
Figure 2.
The magnetization curves in double logarithmic scale for all ferrofluids listed in Table 1: experimental data (markers) and their the Mittag–Leffler function-based approximations (curves).
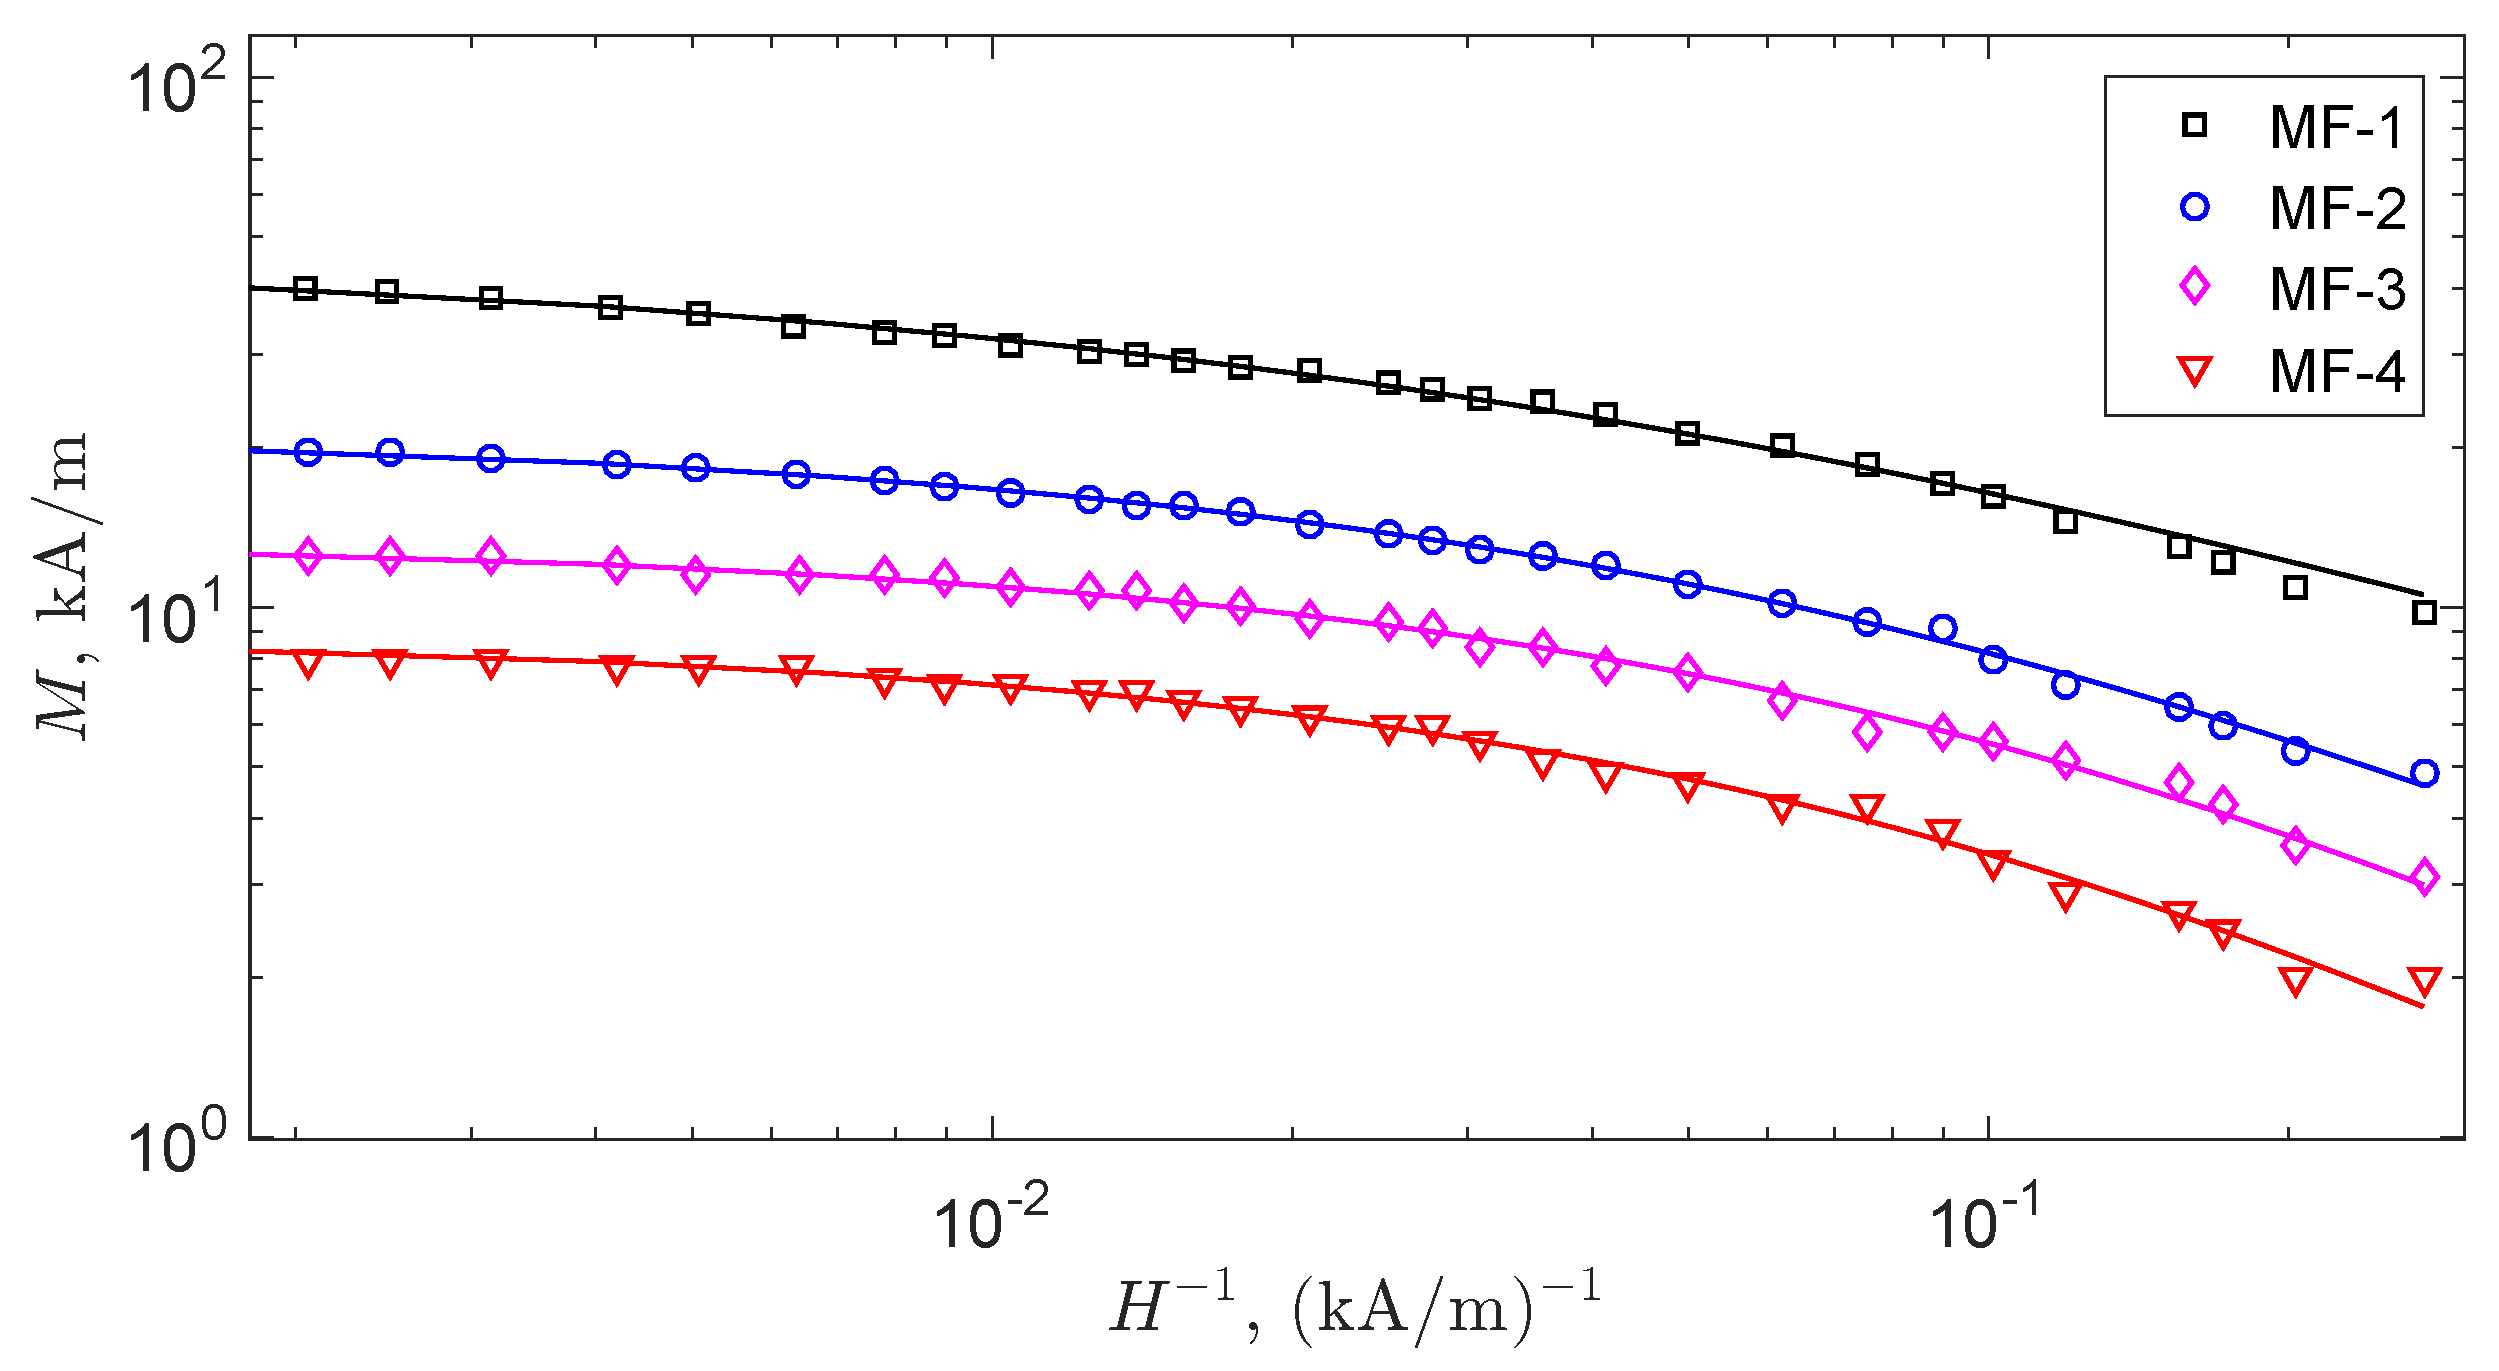
Figure 3.
Parameters (circles) of Equation (7) as functions of the magnetic phase concentration. The fitting equations shown as solid straight lines are (A), (B), and (C).
Figure 3.
Parameters (circles) of Equation (7) as functions of the magnetic phase concentration. The fitting equations shown as solid straight lines are (A), (B), and (C).

Table 1.
Physical properties of the studied ferrofluids: the density , the relative volume concentration of nanoparticles and the relative volume concentration of its magnetic fraction as well as the parameter of their magnetization curve determined by the Mittag–Leffler function-based approximation: the saturation magnetization , the inverse fractional magnetic demagnetizing susceptibility a, and the fractional index . The last row lists relative average absolute deviations between experimental and fitted data.
| MF-1 | MF-2 | MF-3 | MF-4 | |
|---|---|---|---|---|
| 1245 | 1058 | 952 | 870 | |
| 11.02 | 6.62 | 4.11 | 2.18 | |
| 9.08 | 4.34 | 2.70 | 1.93 | |
| 47.6 | 21.7 | 13.5 | 8.69 | |
| 4.56 | 4.92 | 4.77 | 5.33 | |
| 0.53 | 0.65 | 0.69 | 0.71 | |
| AAD, % | 2.1 | 1.2 | 2.0 | 2.5 |
Publisher’s Note: MDPI stays neutral with regard to jurisdictional claims in published maps and institutional affiliations. |
© 2021 by the authors. Licensee MDPI, Basel, Switzerland. This article is an open access article distributed under the terms and conditions of the Creative Commons Attribution (CC BY) license (https://creativecommons.org/licenses/by/4.0/).
Share and Cite
MDPI and ACS Style
Ryapolov, P.A.; Postnikov, E.B. Mittag–Leffler Function as an Approximant to the Concentrated Ferrofluid’s Magnetization Curve. Fractal Fract. 2021, 5, 147. https://doi.org/10.3390/fractalfract5040147
AMA Style
Ryapolov PA, Postnikov EB. Mittag–Leffler Function as an Approximant to the Concentrated Ferrofluid’s Magnetization Curve. Fractal and Fractional. 2021; 5(4):147. https://doi.org/10.3390/fractalfract5040147
Chicago/Turabian StyleRyapolov, Petr A., and Eugene B. Postnikov. 2021. "Mittag–Leffler Function as an Approximant to the Concentrated Ferrofluid’s Magnetization Curve" Fractal and Fractional 5, no. 4: 147. https://doi.org/10.3390/fractalfract5040147