Article

Text Mining in Cybersecurity: Exploring Threats and Opportunities

by
Maaike H. T. de Boer
1,*,
Babette J. Bakker
2,
Erik Boertjes
3,
Mike Wilmer
1,
Stephan Raaijmakers
1,4 and
Rick van der Kleij
5,6
1
Data Science, TNO, 2592 DA The Hague, The Netherlands
2
Strategy and Policy, TNO, 2592 DA The Hague, The Netherlands
3
BloomingData, 2512 XA The Hague, The Netherlands
4
Leiden University Centre for Linguistics (LUCL), Leiden University, 2311 BX Leiden, The Netherlands
5
Human Behavior and Organisational Innovations, TNO, P.O. Box 23, 3769 ZG Soesterberg, The Netherlands
6
Cybersecurity & SMEs Research Group, The Hague University of Applied Sciences, P.O. Box 13336, 2501 EH The Hague, The Netherlands
*
Author to whom correspondence should be addressed.
Multimodal Technol. Interact. 2019, 3(3), 62; https://doi.org/10.3390/mti3030062
Submission received: 28 June 2019 / Revised: 4 September 2019 / Accepted: 6 September 2019 / Published: 15 September 2019
(This article belongs to the Special Issue Text Mining in Complex Domains)

Abstract

:
The number of cyberattacks on organizations is growing. To increase cyber resilience, organizations need to obtain foresight to anticipate cybersecurity vulnerabilities, developments, and potential threats. This paper describes a tool that combines state of the art text mining and information retrieval techniques to explore the opportunities of using these techniques in the cybersecurity domain. Our tool, the Horizon Scanner, can scrape and store data from websites, blogs and PDF articles, and search a database based on a user query, show textual entities in a graph, and provide and visualize potential trends. The aim of the Horizon Scanner is to help experts explore relevant data sources for potential threats and trends and to speed up the process of foresight. In a requirements session and user evaluation of the tool with cyber experts from the Dutch Defense Cyber Command, we explored whether the Horizon Scanner tool has the potential to fulfill its aim in the cybersecurity domain. Although the overall evaluation of the tool was not as good as expected, some aspects of the tool were found to have added value, providing us with valuable insights into how to design decision support for forecasting analysts.

Graphical Abstract

1. Introduction

The number of cyberattacks on organizations is growing at an increasing rate [1]. Organizations need to protect themselves against the overall harm of cybercrime, that is, the sum of the material harms or costs, and the non-material harms of cybercrime [2]. As it is expected that the number of cyberattacks will continue to grow in the near future, the notion that organizations need to be more cyber resilient is becoming increasingly popular [3,4]. An important aspect of resilience is the ability to anticipate potential disruptions, novel demands or constraints, new opportunities, or changing operating conditions. Inputs that may help to predict future developments can thus be of great value [5]. Hence, organizations need to create foresight, an approach that brings together key agents of change and sources of knowledge to develop strategic visions and anticipatory intelligence, in order to anticipate developments further into the future. The engineering of resilience comprises the ways in which this capability to create foresight can be established and managed [5].
The ability to create foresight is usually performed by analysts within larger organizations or governmental agencies, such as national level cybersecurity centers, by quickly finding, analyzing, remediating, and documenting vulnerabilities and cyberattacks [6]. Although views on the general value of forecasting range from critical to cynical [7], a recent study by Schatz and Bashroush [8] shows that the security predictions of subject matter experts in this field did foresee notable developments in this area. There are concerns, however, about how to scale up forecasting given the dramatic growth rate of cyber threats and vulnerabilities [9]. Hence, the speed in which relevant information is being published outpaces the capability of security professionals to perform this forecasting function. As a result, relevant trends could not be noticed or noticed too late. This can undermine the innovative cyber capabilities of those professional entities that rely on forecasting. At the same time, rapid changes in security threat landscapes cause uncertainty for business continuity and may force changes to organizations’ security strategy [8]. A solution is to automate the handwork or to provide forecasting analysts with proper decision support tools that could help reduce ambiguity or even predict future developments (see also [8,10]). There have already been extensive efforts in government, academia, and industry to do so [11]. However, forecasting vulnerabilities and cyberattacks is not an easy job [12]. A common approach to provide decisive information is time-series forecasting of cyberattacks based on data from network telescopes, honeypots, and automated intrusion detection/prevention systems [6,12].
In this paper, we propose an alternative perspective to foresight by focusing on crawling and scraping of relevant open sources on the internet, such as Common Vulnerabilities and Exposures (CVE) databases, cybersecurity blogs and websites, Reddit posts and RDF Site Summary (RSS) feeds. We use state of the art information retrieval techniques to scrape, crawl, index and visualize. The novelty of this paper is to use the state-of-the-art techniques from text mining and information retrieval in the domain of cybersecurity to create foresight.
In the next section, we will discuss related work on foresight and some of the common approaches used in this field. Section 3 explains the proof of concept of our Horizon Scanner tool. Section 4 presents a first qualitative evaluation and a discussion on the results of this evaluation. Section 5 provides the conclusions.

2. Related Work

Foresight is a forward-looking approach, which brings together key agents of change and sources of knowledge to develop strategic visions and anticipatory intelligence [13]. Foresight does not only offer approaches and methods to identify or monitor current trends, but also to inform policy makers about relevant future developments. These developments are important to consider in policy design for sustainable strategies in all domains. This is especially true for cyber security, since the success of this rapidly evolving field depends on the ability to anticipate vulnerabilities, developments and potential threats.

2.1. Traditional Foresight Approaches

Traditionally, most foresight studies are expert-driven. They often deploy a mixture of qualitive techniques. Patterns are digested from a literature search and experts are consulted through workshops, interviews and surveys to identify the technology and innovation trends and threats. A wide variety of methods is related to foresight studies, including Horizon or Environmental Scanning, Future-oriented Technology Analysis (FTA), Science and Technology Roadmapping and scenario development. The most frequently used expert-driven technique used in these methods is still the Delphi method. “Delphi may be characterized as a method for structuring a group communication process so that the process is effective in allowing a group of individuals, as a whole, to deal with a complex problem.” [14]. This approach uses surveys and workshops to reach consensus with different stakeholders and can be used for instance to evaluate the potential threat of abuse of technologies [15].
Most commercially available foresight studies rely on these expert-driven techniques. For instance, Gartner’s Hype Cycle method plots technologies on the technology adoption life cycle on the basis of expert judgment [16]. Other commercial tools include Trendwatching [17], and Technology radar [18]. A tool to digitize expert involvement is the InnoRadar [19]. The InnoRadar is based on information from experts involved in reviewing EU projects, such as Horizon 2020, Framework Programme 7 (FP7) and Competitiveness and Innovation Programme (CIP) projects.
An important characteristic of all these foresight methods is that the outcome of a foresight study is not only an overview of the emerging trends and threats, but also, and even more important, a change in the perception of minds through collaboration activities [20]. The disadvantage of these processes is that they are often time consuming, hard to replicate and homogeneous in nature. The input for traditional foresight processes is constraint to a selected group of experts and other sources of information. Data mining and information retrieval have gained attention as promising techniques to enrich foresight work to support management in decision making [21].

2.2. Text Mining Foresight Approaches and Tools

Advances in Natural Language Processing (NLP) and text mining have opened possibilities for exploiting Big Data in foresight studies. It has become much easier for researchers to implement advanced data collection and mining techniques, which allows for analysis of data with a higher depth, breadth, and scale [22]. More and other (heterogeneous) data sources can be analyzed compared to traditional literature analysis. This approach allows for a broad coverage of unrestricted text, instead of a deep analysis of restricted domains [23]. Text mining consists of the discovery of previously unknown information from existing resources [24]. It uses techniques from information retrieval, information extraction, and NLP and connects them with the algorithms and methods of Knowledge Discovery and Data mining (KDD), machine learning and statistics [25]. Text mining searches for patterns in unstructured natural language texts, e.g., books, articles, e-mail messages, web pages, and is generally found useful in environments where large collections of text documents are handled [26].
Porter is one of the pioneers in the field of text mining and developed the concept of tech mining. “Tech mining (TM) uses text mining software to exploit science and technology (S&T) information resources.” [27]. Publications and patents are the most frequently used data sources in tech mining. Most research efforts are still concentrated on semi-automated bibliometric analysis, e.g., measuring citation-impact, co-occurrence, co-citation in patents and publications. Efimenko, Khoroshevsky, and Noyons [28] developed an approach called Map of Science, which analyzes associations between R&D fields on the basis of co-occurrence in research articles on e.g., Web of Science and Scopus. Specific ‘nodes’ of maps are created, weighted, and coupled based on the appearance of terms in full texts or abstracts. The outcome is visualized in VOSviewer, a software tool for constructing and visualizing bibliometric networks. Other studies explore new indicators, such as Patent Technology Rate Indicator (PTRI), which estimates the rate of technological progress in a technological domain [29].
More recently, the field has begun to explore advanced techniques for the identification of trends and weak signals. Techniques such as web scraping, network analysis [30], latent-semantic analysis (LSA), ontology modeling, sentiment analysis [31], text clustering (K-means, TF-IDF) and statistics-based approaches, such as Principal Component Analysis (PCA) [32], have become more popular in the last decade. At the same time, automatic foresight tools shift towards other type of data sources, such as web data, social media, geospatial, and news data. In comparison to scientific articles and patents, these data sources have a smaller time lag in publication date.
There is not one best method for scanning, identifying and assessing emerging issues from texts. The SESTI project experimented with different approaches (e.g., twitter/wiki scanning, expert review complemented by text mining and focused expert review) and found that each method has its own advantages, and disadvantages [33]. This diversity is also reflected in the variety of online tools available. Several companies and organizations have been experimenting with these new techniques and data sources. They scrape information from multiple web sources and show trending titles of for example news articles within several (hand-picked) topics. One of the most well-known is Google Trends. Other tools include Alltop [34], Trending Reddits [35], and BuzzSumo [36]. The European Commission’s Competence Centre on Text Mining and Analysis developed two tools: Tools for Innovation Monitoring (TIM), which aims to track emerging technologies as they progress toward market applications, and the Europe Media Monitor, which tracks predefined themes and topics in news articles [37]. The ITONICS tool Scout visualizes upcoming and important terms within patents, scientific publications, blogs and websites, and identifies related topics [38].
The Horizon Scanner tool can be seen as just another tool in this domain, and uses the advantages of some of the other tools. The crawling, scraping, indexing, trend analysis and visualizations used in the Horizon Scanner are state of the art. The Horizon Scanner tool is different from the several other tools, because it combines foresight with search. Most of the described tools work with predefined topics and show trends on those topics, without the ability to search for specific terms.

3. Horizon Scanner Tool

The aim of the Horizon Scanner tool is to help analysts to identify new innovations and technological trends within a specific sector, in this case cyber operations, both defensive and offensive, from a military perspective. These trends can be associated with vulnerabilities, developments and potential threats for organizations.
In an initial requirements session with around 20 cyber experts we identified important functionalities for the Horizon Scanner tool. The first functionality is, according to the experts, that new innovations and technological trends (patterns) should be perceived over time. The most interesting topics or trends are those that have a high growth in mentions or number of publications. Only looking at the absolute number of publications will probably provide information about the currently known topics, but not about the upcoming topics. Time graphs for the most important terms are used to demonstrate patterns over time.
A second functionality is the relation or link between different knowledge areas and the associated innovations and technological trends. This helps in cross-linking topics and domains. These relations are presented in an entity graph. The next paragraphs show how the design of the Horizon Scanner tool is created to meet these requirements.

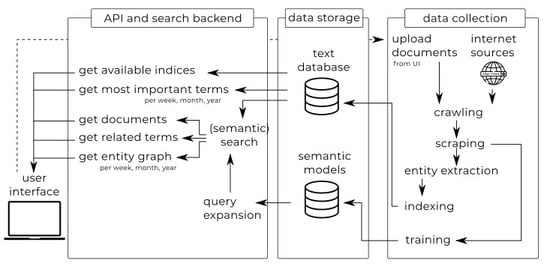
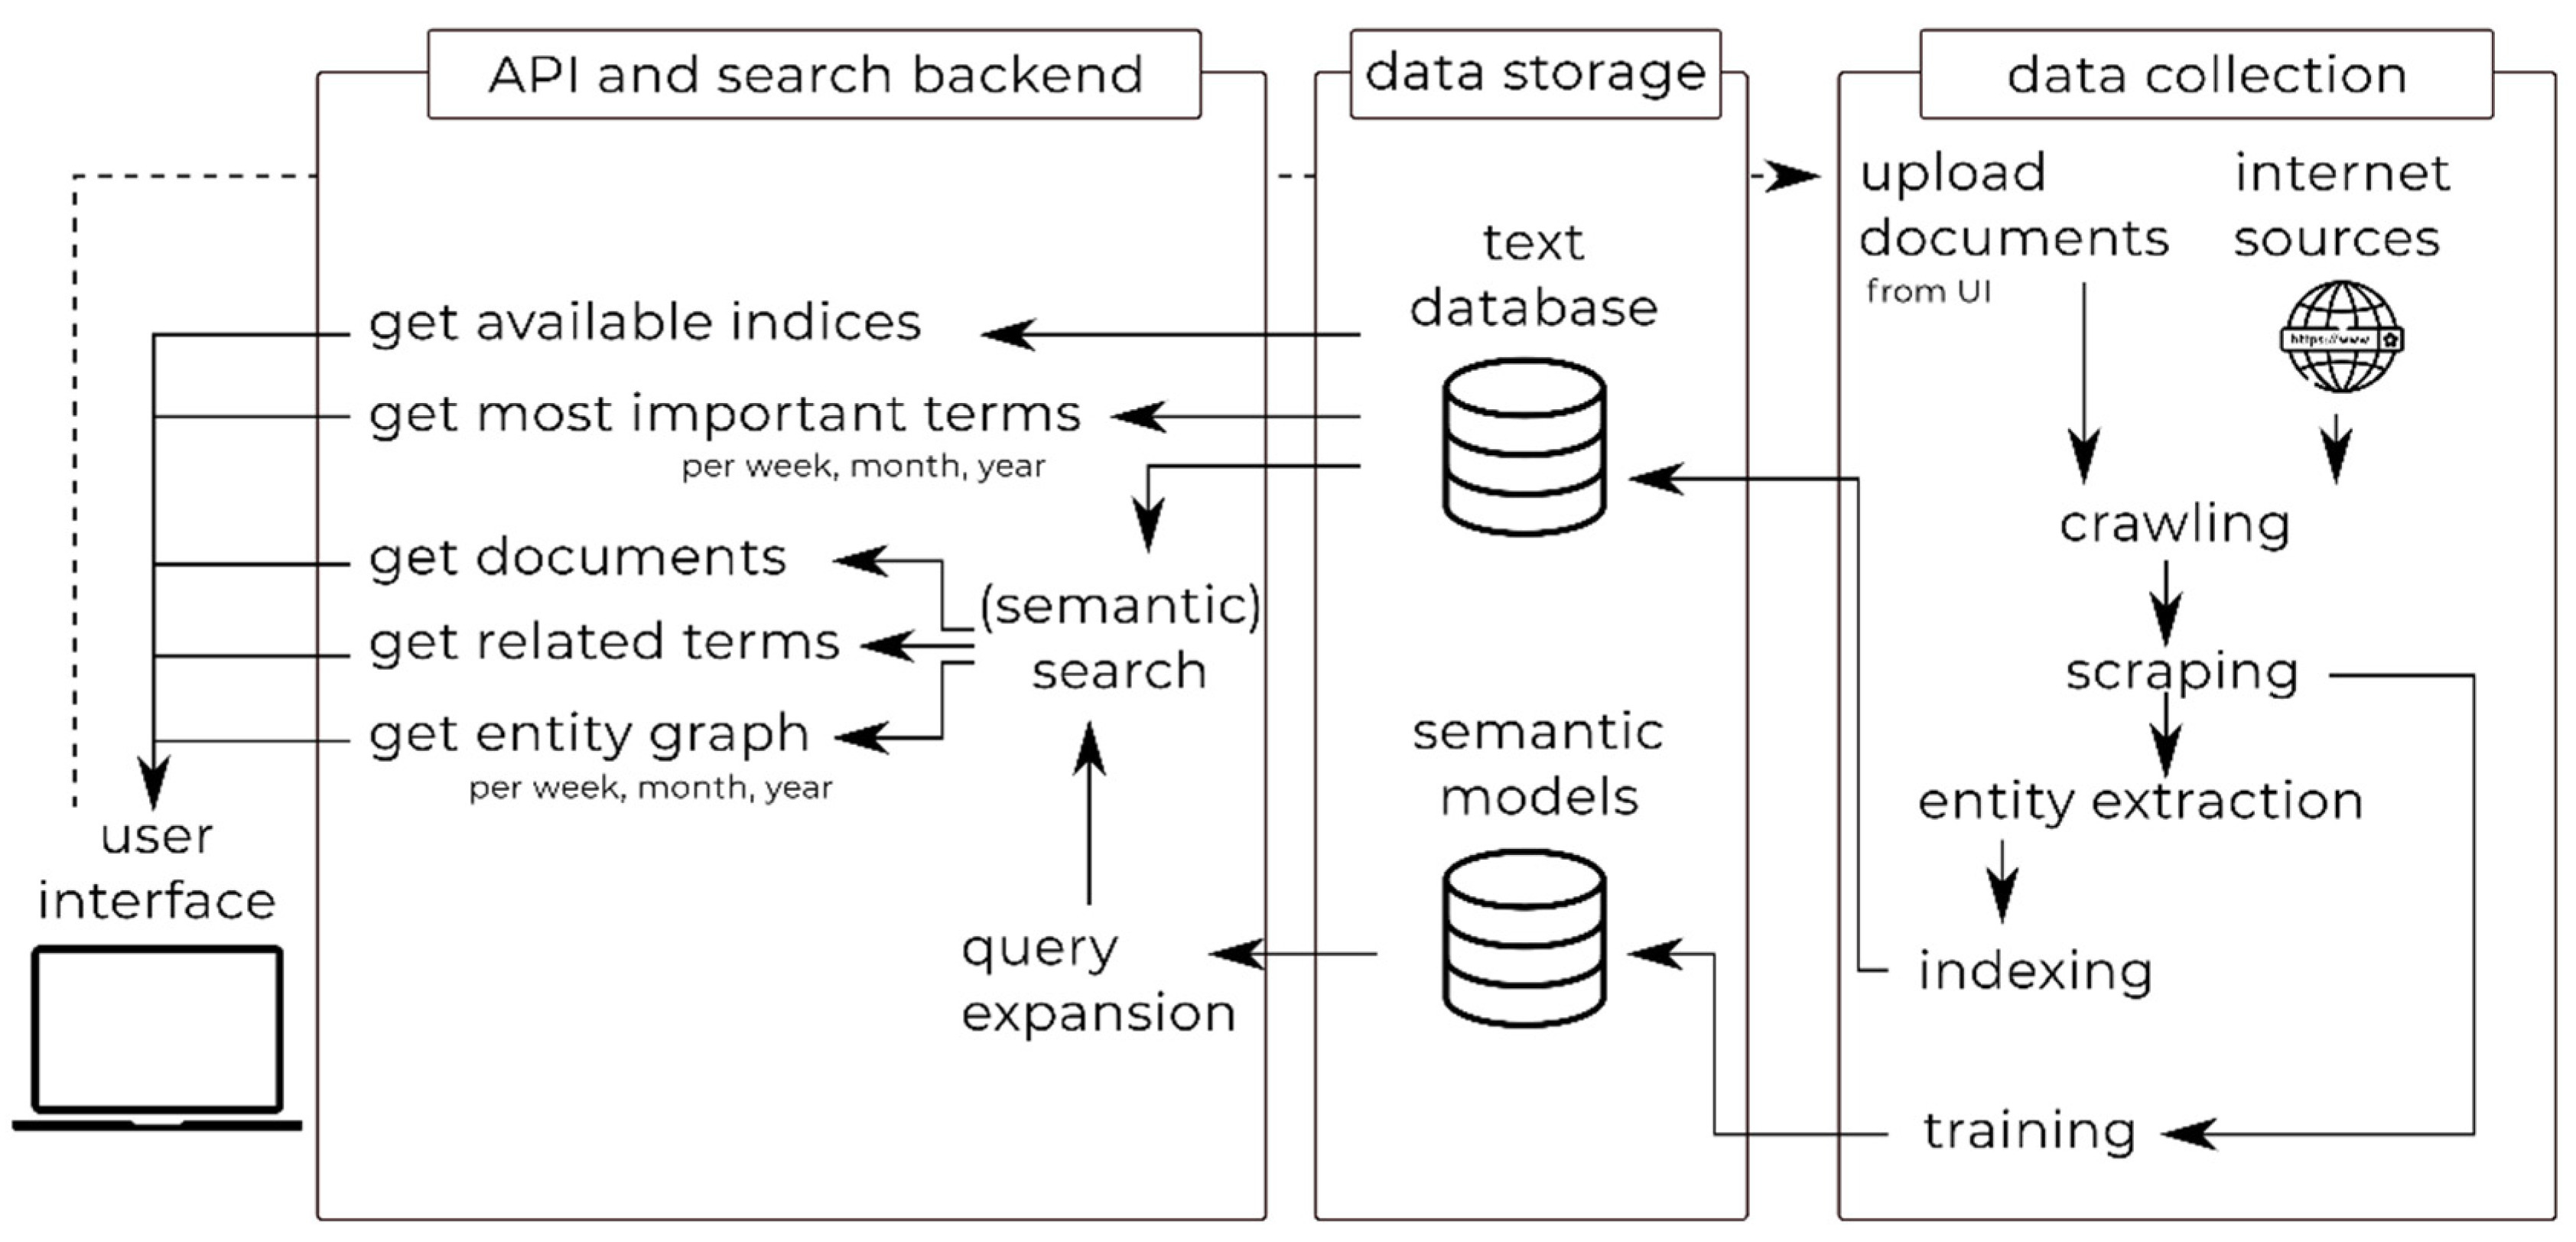
3.1. Overview of the Horizon Scanner Tool Architecture

Figure 1 shows a picture of the inputs and outputs of the Horizon Scanner tool and its modules. On the right side, the data collection process is depicted. Documents can be uploaded in the user interface, and internet sources are daily accessed. Data is automatically collected (crawled) and processed (scraped). Entities, relevant one, two- or three-word combinations, are extracted (entity extraction). The processed data is then used to train semantic (word2vec) models, which are used in the query expansion, and stored in a text database (indexing). The exact process of crawling, scraping and indexing is explained in Section 3.1.
The data storage modules, which are the semantic models and text database, are used in the API and search backend, which is connected to the user interface. The user interface has multiple views, which is further explained in Section 3.3. A first view is the start screen, in which the most important terms are shown. The text database is queried and from the available indices (the sub databases, in this case one; the cyber index) the entities are retrieved. The items in the database are sorted per week, month and year, and the entities in each selection are used to get the most important terms. This is further explained in Section 3.2.1. Another view in the user interface allows for semantic search. The user can ask a query, which is a term, one or more keywords or a sentence. This is handled in the API and search backend. The documents are retrieved and the related terms and entity graph are created. A query expansion is done to provide the user with potential other queries. The exact process is further explained in the following subsections.
The Horizon Scanner tool is implemented in the programming languages Python and JavaScript. Docker is used to combine the different modules. Several state of the art and open source text mining packages and tools are used to create the tool, indicated in the specific sections.

3.2. Data Collection: Crawling, Scraping and Indexing

To fill our database, we automatically crawl and scrape several data sources on the internet. Crawling refers to automatically downloading websites from the internet, whereas scraping is the process of extracting information from these websites or other sources, such as PDF documents.
The data sources will be different for different domains. For the cyber security application, we identified around 20 specific cyber related online sources and some references to related conferences and paper collections. These related sources include reddit posts, blogs of influencers in the field, and links to collections of online cyber threats. The selected papers are published in some of the main conferences in the field, dating between 2016 and 2018. All data sources contain only English text. The Horizon Scanner tool can currently handle English and Dutch texts, but mixing the languages in one database is not preferable for some of the algorithms used.
The crawlers crawl the specific websites daily and add the content to a database using the scraping and indexing modules. Although many websites use the same format, the specific tags that indicate the interesting information can be different, i.e., <text> or <information> or <content>. This implies that for every website a different scraper should be built to extract the correct information. Luckily, some websites adhere to a specific standard and all those websites can thus be scraped using the same code. In this research, most of the sources contain an RSS feed. RSS is an acronym for RDF Site Summary, Rich Site Summary and/or Real Simple Syndication and is a standardized, computer-readable format which is currently often used in websites [39]. RSS feeds can be, and are in our tool, scraped using the Python package named feedparser [40]. The different subtopics on the website Reddit can also be scraped using one type of code. Some of the other sources adhere the OSF (Open Semantic Framework) [41], and for a few we had to implement specific code to scrape the information from that website.
Besides scraping information directly from websites, PDF documents can also be scraped. This applies to the paper collections and conferences selected. The user interface (Section 3.4) also has an upload document function in which the experts can, after the release of the tool, add relevant documents. The information from PDFs is extracted using the Grobid (GeneRation of BIbliographic Data) package in Python [42].
The relevant information that is scraped from the different data sources is: time, title, authors, text and link to the source file. In the case of the PDFs only the abstract is extracted as text. This choice is made, because the abstract often has a similar length as the blogs posts on the websites. The link to the source file is added, because the files then do not have to be saved separately on the server and the privacy policies concerning reading the files are not violated. Additionally, the data source name and a unique id are added. This unique id is used to index the item and save it to a database. The Horizon Scanner tool uses an Elasticsearch database to store all information.

3.2.1. Entity Extraction

Asynchronously one more field is added to every item in the database. This field contains a list of extracted entities from the text. Entities are defined as relevant one, two- or three-word combinations that could be interesting to add in an entity graph. The entities are extracted to make the retrieval faster. The entities are extracted using several state-of-the-art text mining techniques. The extraction is comparable to the standard pre-processing steps [43]. First, the text is tokenized into words, only keeping the alphanumeric and special letters, but not numbers and special signs (using a regular expression). In our database, the numbers and special signs had no added value, but this can be different in other domains or in other languages. We do not use stemming of lemmatization, because we believe that the specific forms of the words have meaning and should be kept. The separate remaining words are then Part of Speech (PoS) tagged. We use the PoS tagger from the NLTK package in Python [44] to label each word with a tag indicating whether it is a noun, verb, preposition, determiner and so on. We then create a set of words, containing uni-, bi- and trigrams (one, two and three word combinations) that only contain words of type JJ (adjective) or NN(S) (nouns singular and plural) and are not in a standard stopword list [45]. This method can be compared to keyword extraction, but without using TF-IDF or other techniques on the document set. This is not done, because we use a filtering mechanism in the most important terms and the creation of the entity graph afterwards. The set of words is added as entities to the item in the database.

3.3. API and Search Backend: Search, Retrieval and Analysis

The start screen of the user interface shows the most important terms of a certain period. A term is defined as a word or words that may be the subject or predicate of a proposition. This is done using an ‘empty’ query in the database to retrieve all entries. The next subsection explains how the most important terms are extracted. Besides extracting the most important terms from the database, the database is also used to answer queries. In order to obtain insight into a topic, domain or field, a user can type in a query in the user interface. This query can be one or more keywords or a whole sentence. The query is then sent to the database and at most 10,000 hits are retrieved. These hits contain all information, including the time, title, author, text, source name, link to the source and entities (as described in the previous section). The number of hits per time-period (year, month, week) is counted. These frequency counts are used in the creation of the entity graph and the trend analysis (next subsections). Additionally, the user is assisted with possible related terms from the query expansion (last subsection). These terms can be added to the query to further focus or broaden the search.

3.3.1. Most Important Terms

The extraction of the most important terms in a certain period in time can be done using several different text mining methods, such as co-occurrence based methods, frequency based methods and probability based methods. In the paper by Verberne et al. [46] it is shown that the best method for term scoring with more than 10,000 words is the Kullback-Leibler divergence for Informativeness and Phraseness. The Kullback-Leibler divergence (KLdiv), also named relative entropy, uses two sets: a background set and a foreground set. The divergence measures how different the foreground is compared to the background using probability distributions. The Kullback-Leibler divergence for Informativeness and Phraseness adds to the original formula the weight of the informativeness, i.e., the specificity of a foreground term compared to the background set, and the phraseness, i.e., how many words the term has, in which a bi- or trigram occurring as often as a unigram is perceived better. The formula for the KLdiv is provided below (Equations (1)–(6)):
KLdiv = ( 1 γ ) kldivI + γ kldivP
where γ is the balancing parameter between informativeness and phraseness, and
K L d i v I = r e l f r e q f g log ( r e l f r e q f g r e l f r e q b g )
K L d i v P = r e l f r e q f g log ( r e l f r e q f g r e l f r e q u n i g r a m s )
where
r e l f r e q f g =   f g f r e q f g t e r m c o u n t
r e l f r e q b g =   b g f r e q b g t e r m c o u n t  
r e l f r e q u n i g r a m =   i = 1 n i f r e q f g t e r m c o u n t
where f g f r e q is the frequency of a term in the foreground set, f g t e r m c o u n t is the total number of terms in the foreground set, b g f r e q is the frequency of a term in the background set, b g t e r m c o u n t is the total number of terms in the background set, i f r e q is the frequency of a unigram in the foreground set. r e l f r e q f g can also be seen as the probability of a term in a document P ( t | D ) .
In the Horizon Scanner tool, we use the implementation of the KLdiv formula by Verberne et al., which can be found on Github under the name termprofiling [47]. The implementation takes a foreground and background set as input and outputs a ranked list. To create a list of most important terms for a specific set, for example the year 2019, we use all entities from the database items (i.e., documents or internet links) dated in 2019 as foreground set. The background set always consists of the entities from the item’s dates 2018 or earlier (also if the foreground set only contains documents from the last month or week). The output rank list is, thus, a list of all found entities in the foreground set with their corresponding KLdiv value, in which a higher value indicates more ‘importance’ in our interpretation. The gamma parameter is set to 0.2. In a small experiment with the gamma parameter, the higher the gamma, the more (multiword) terms occurred that only appear once in the database. To overcome this, we choose a lower gamma and only added terms that occur at least three times to our foreground set. We add a blacklist including the names of the months, the names of the sources and the terms ‘appeared’, ‘post’ and ‘posted’. In the start screen of our user interface, we show the top 50 terms from the foreground with the highest value. These terms can be used by the user to start the search, or to have a quick overview of potential trends.

3.3.2. Entity Graph

The entity graph is created by combining co-occurrences and frequencies, both often used in information retrieval [48]. Per subset of week, month and year, the retrieved entities per database item (i.e., document or internet link) are put in a co-occurrence matrix and the co-occurrences of two entities in one item are counted. Because this matrix contains all combinations of all entities, we shrink this matrix by only keeping the parts in which two items co-occur at least 10 times. In the user interface the entities are presented as nodes and the co-occurrences as edges. The entity matrix helps the user to find (new) connections between terms.

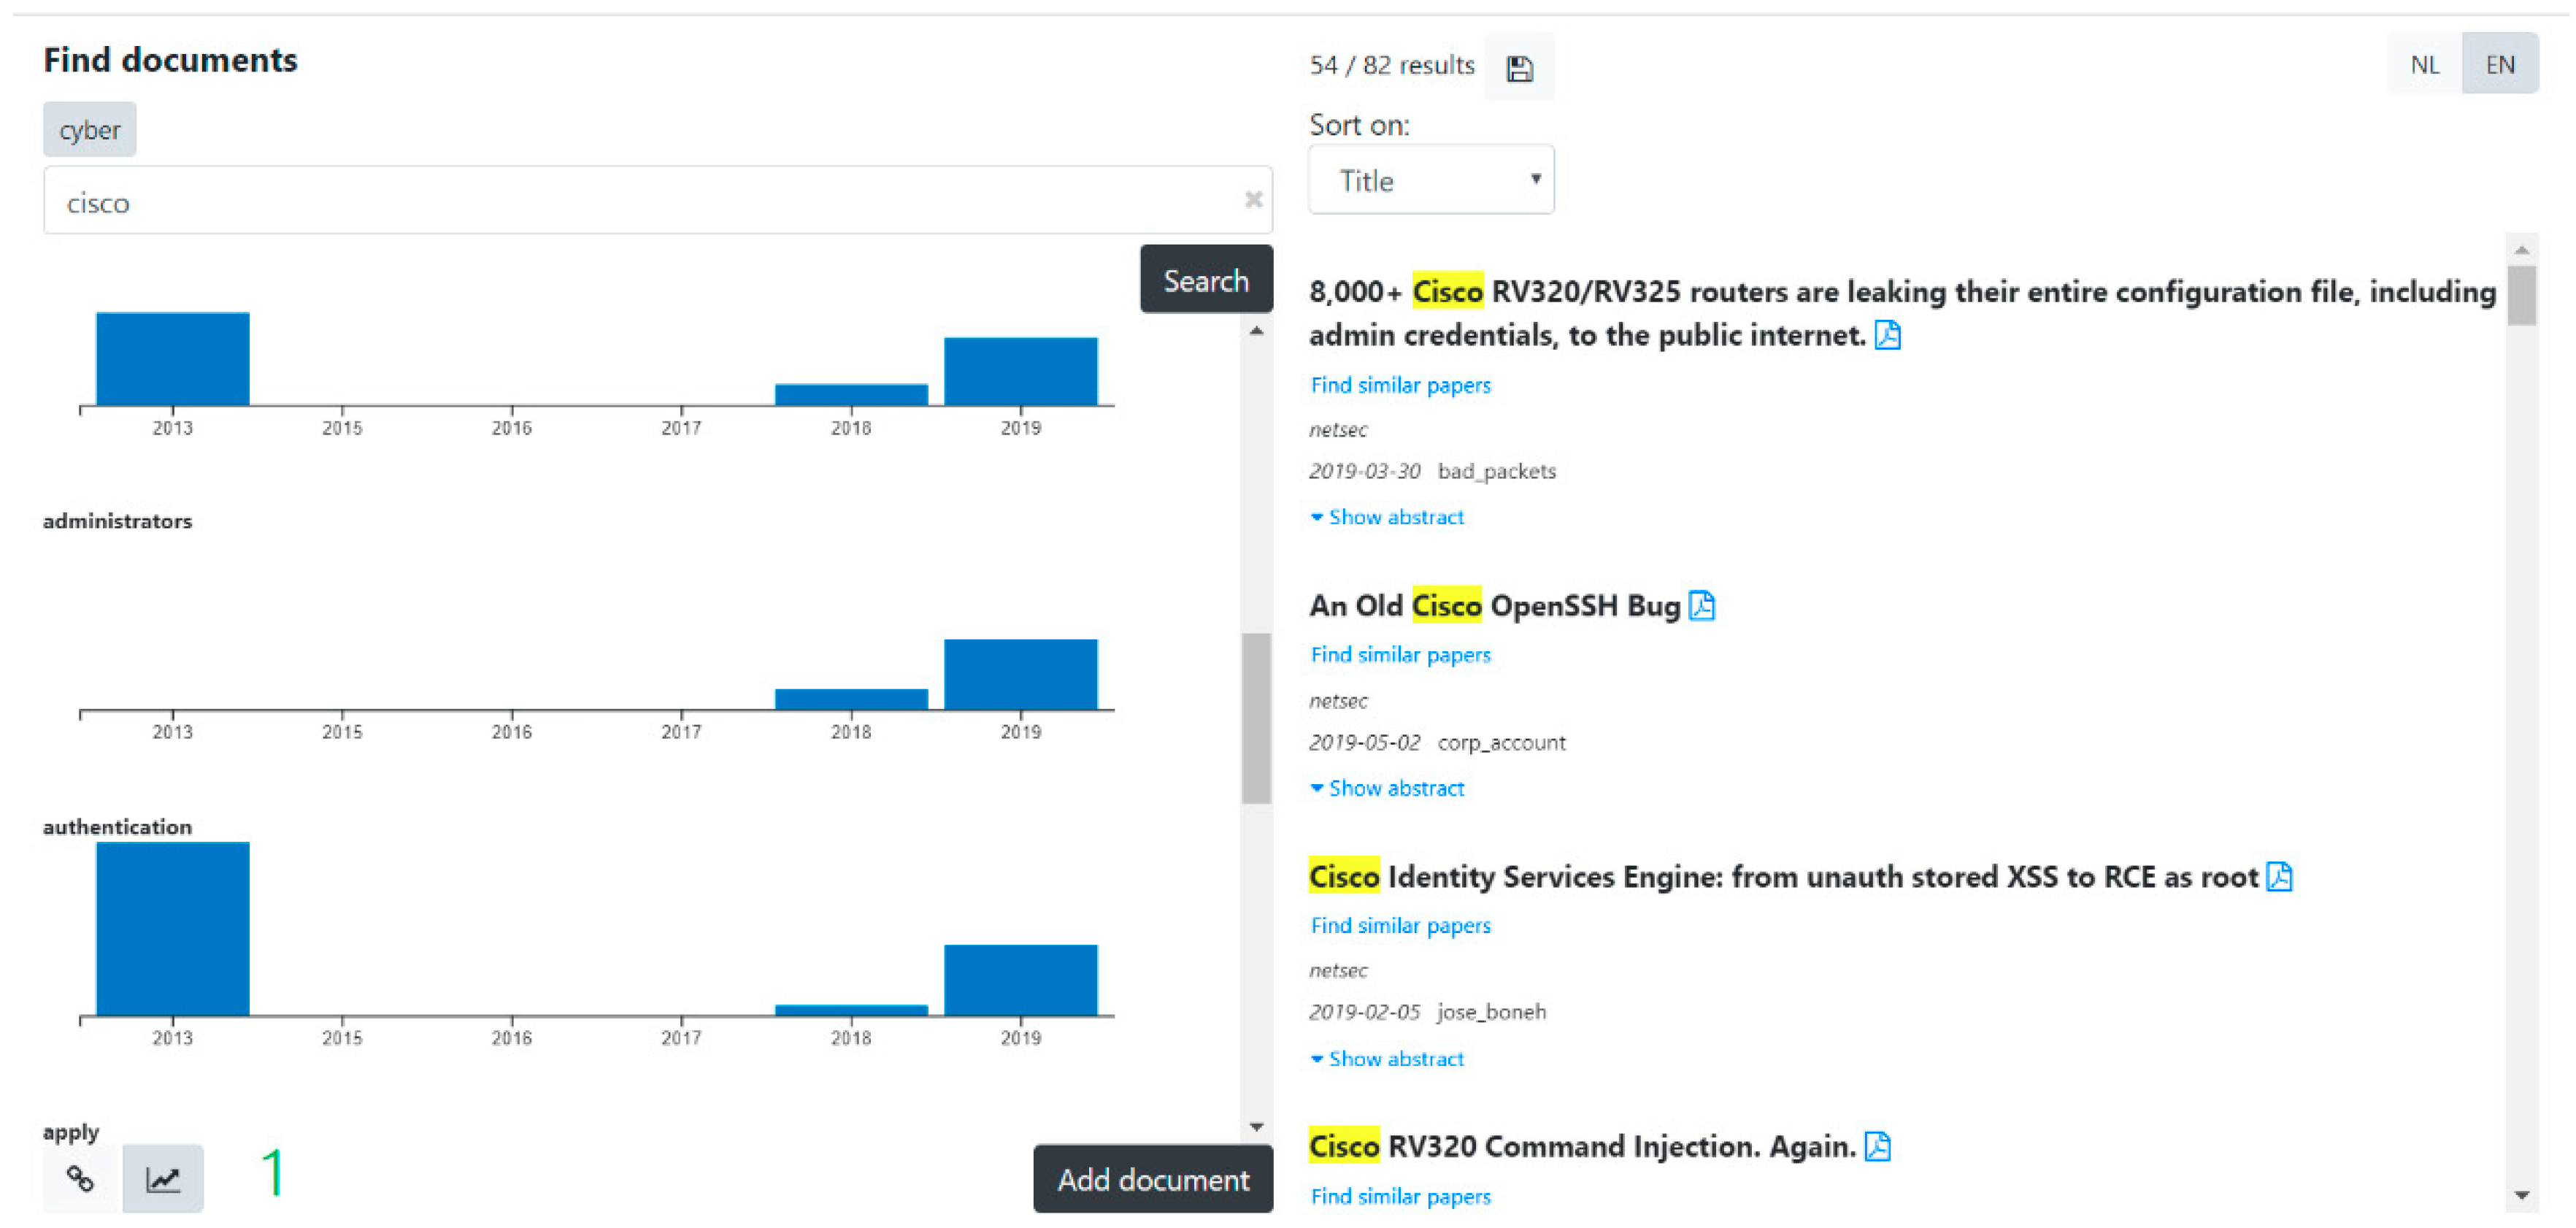
3.3.3. Trend Analysis

The trend analysis is performed using frequency counts. Although frequency counts do not seem sophisticated, they are often used in tools such as Google Trends. For each entity in the entity graph, a frequency count per subperiod, i.e., day in the subset week, week in the subset month and month in the subset year, is done. This frequency is normalized over the number of occurrences of that period. The trend analysis provides the user with an insight per entity whether it is growing or not and how fast. By only using the entities not the most frequent words are used in the analysis, but the most important words.

3.3.4. Query Expansion

In the text mining literature, many query expansion techniques are present. Currently, most often word embedding methods, such as word2vec, are used to expand queries [49,50]. In the Horizon Scanner tool, we use the query expansion method proposed by de Boer et al. [51]. Whereas many word2vec methods output a fixed number of expanded terms, this method only adds terms if the cosine similarity between the query word and the found set of terms is higher. In this way a more diverse set of terms is created. The semantic model used is a model trained on our cyber database using the gensim Python package [52]. If a word in the query is not found in the vocabulary, the GoogleNews word2vec model is used as backup model.

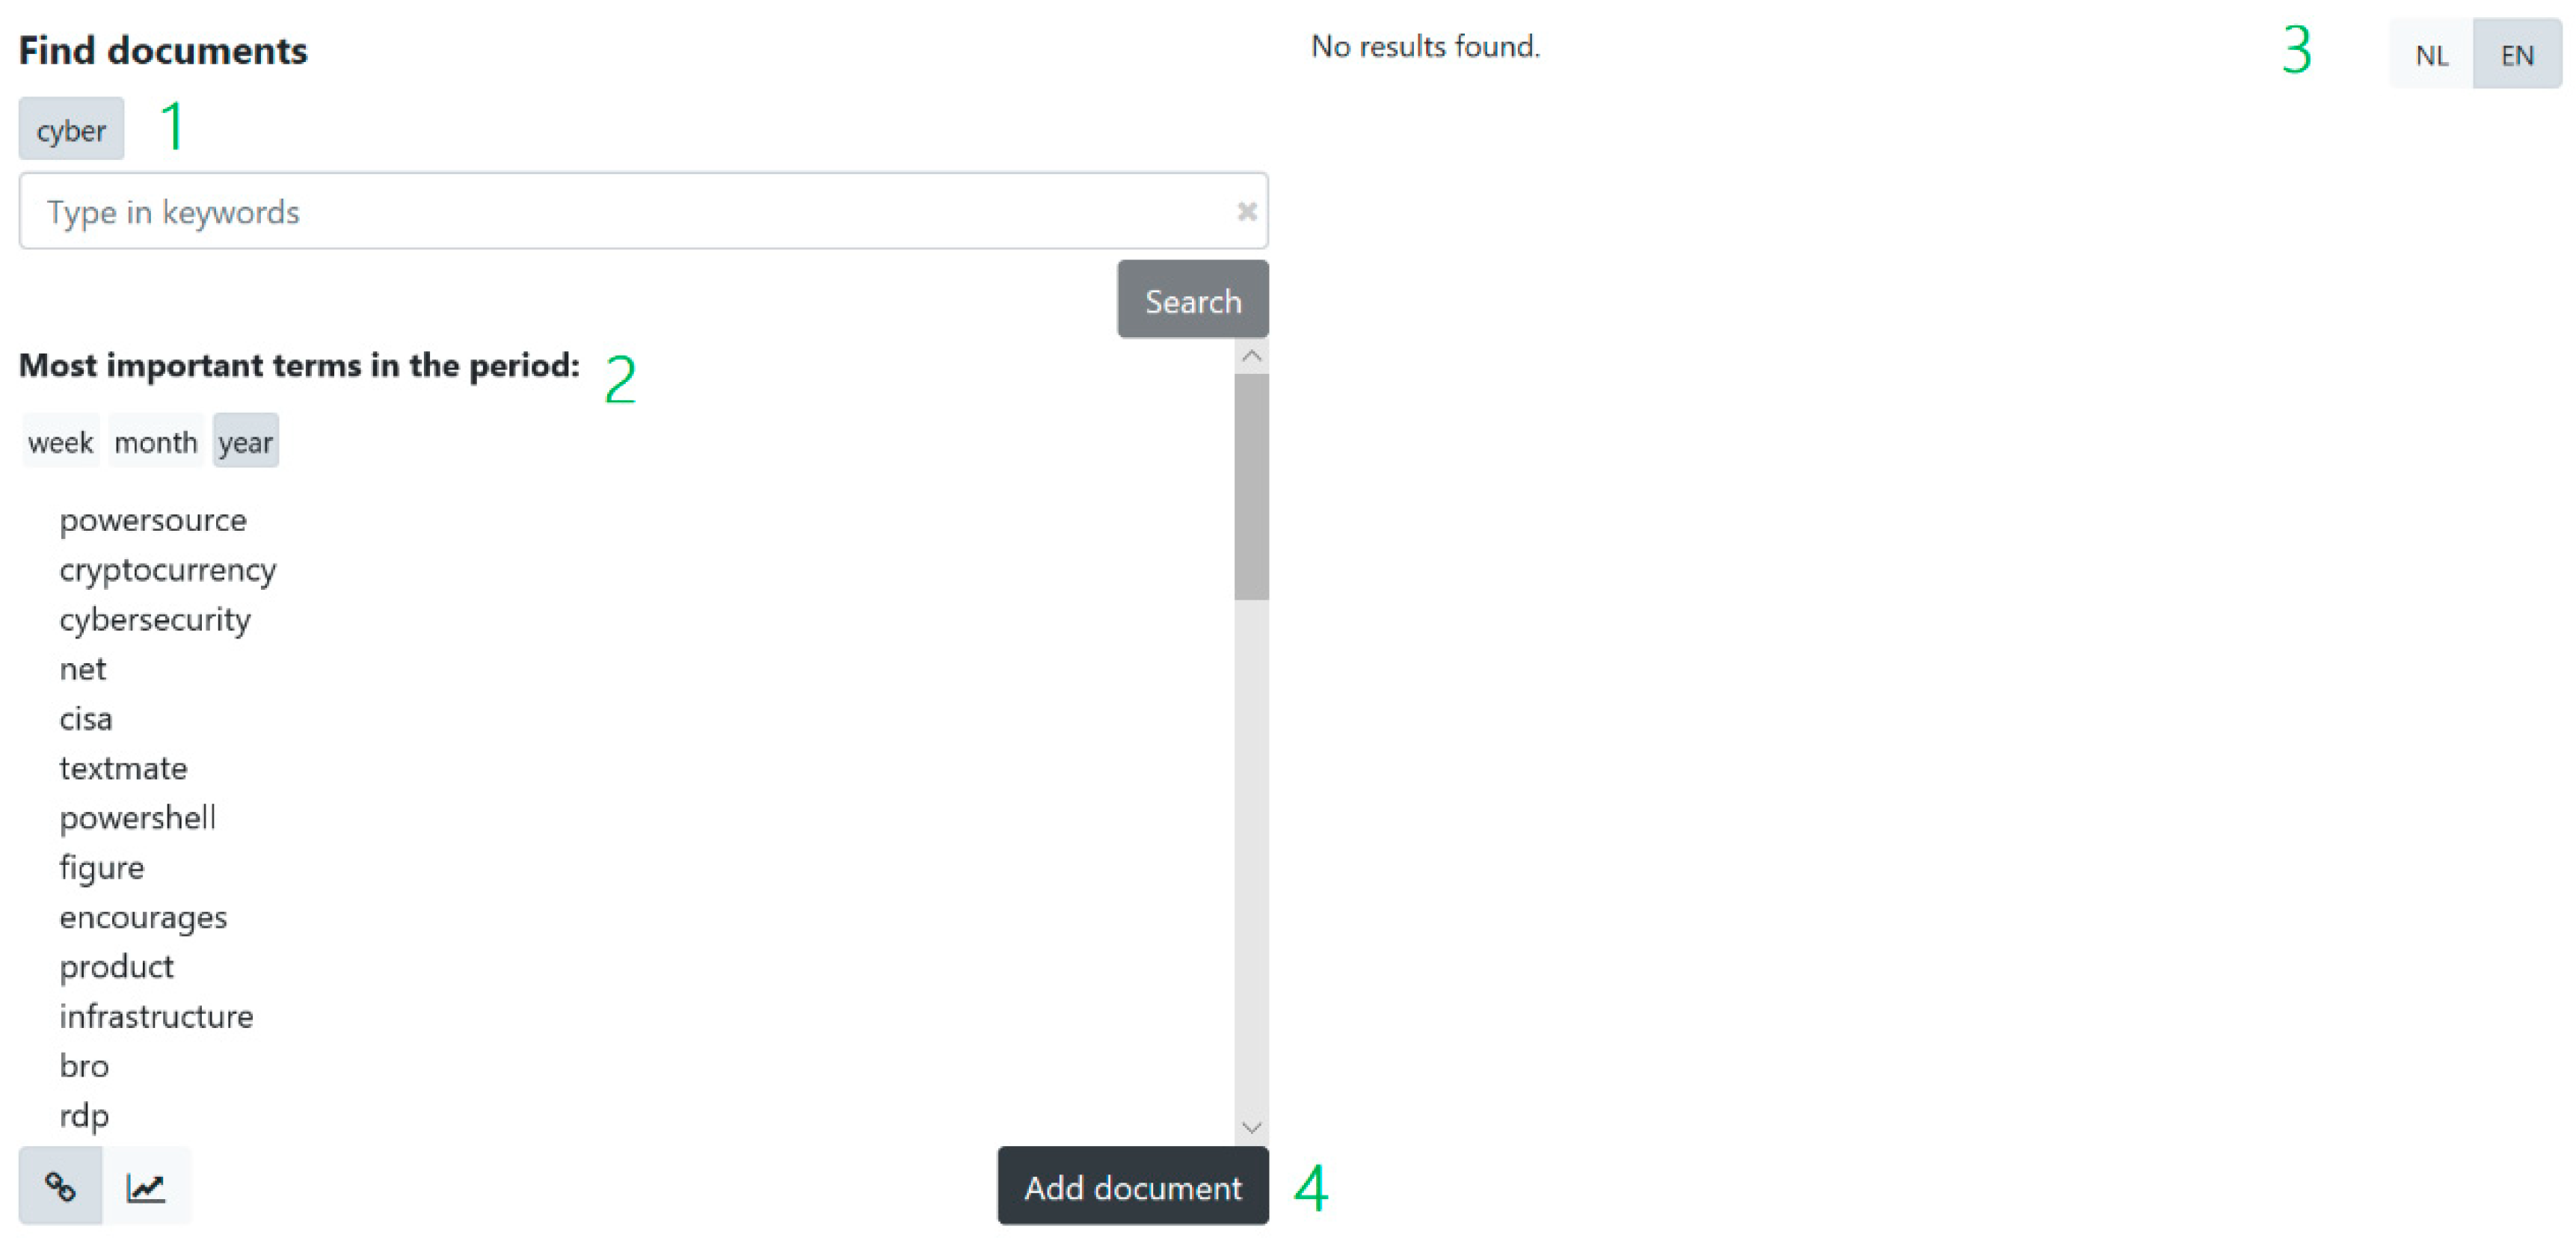
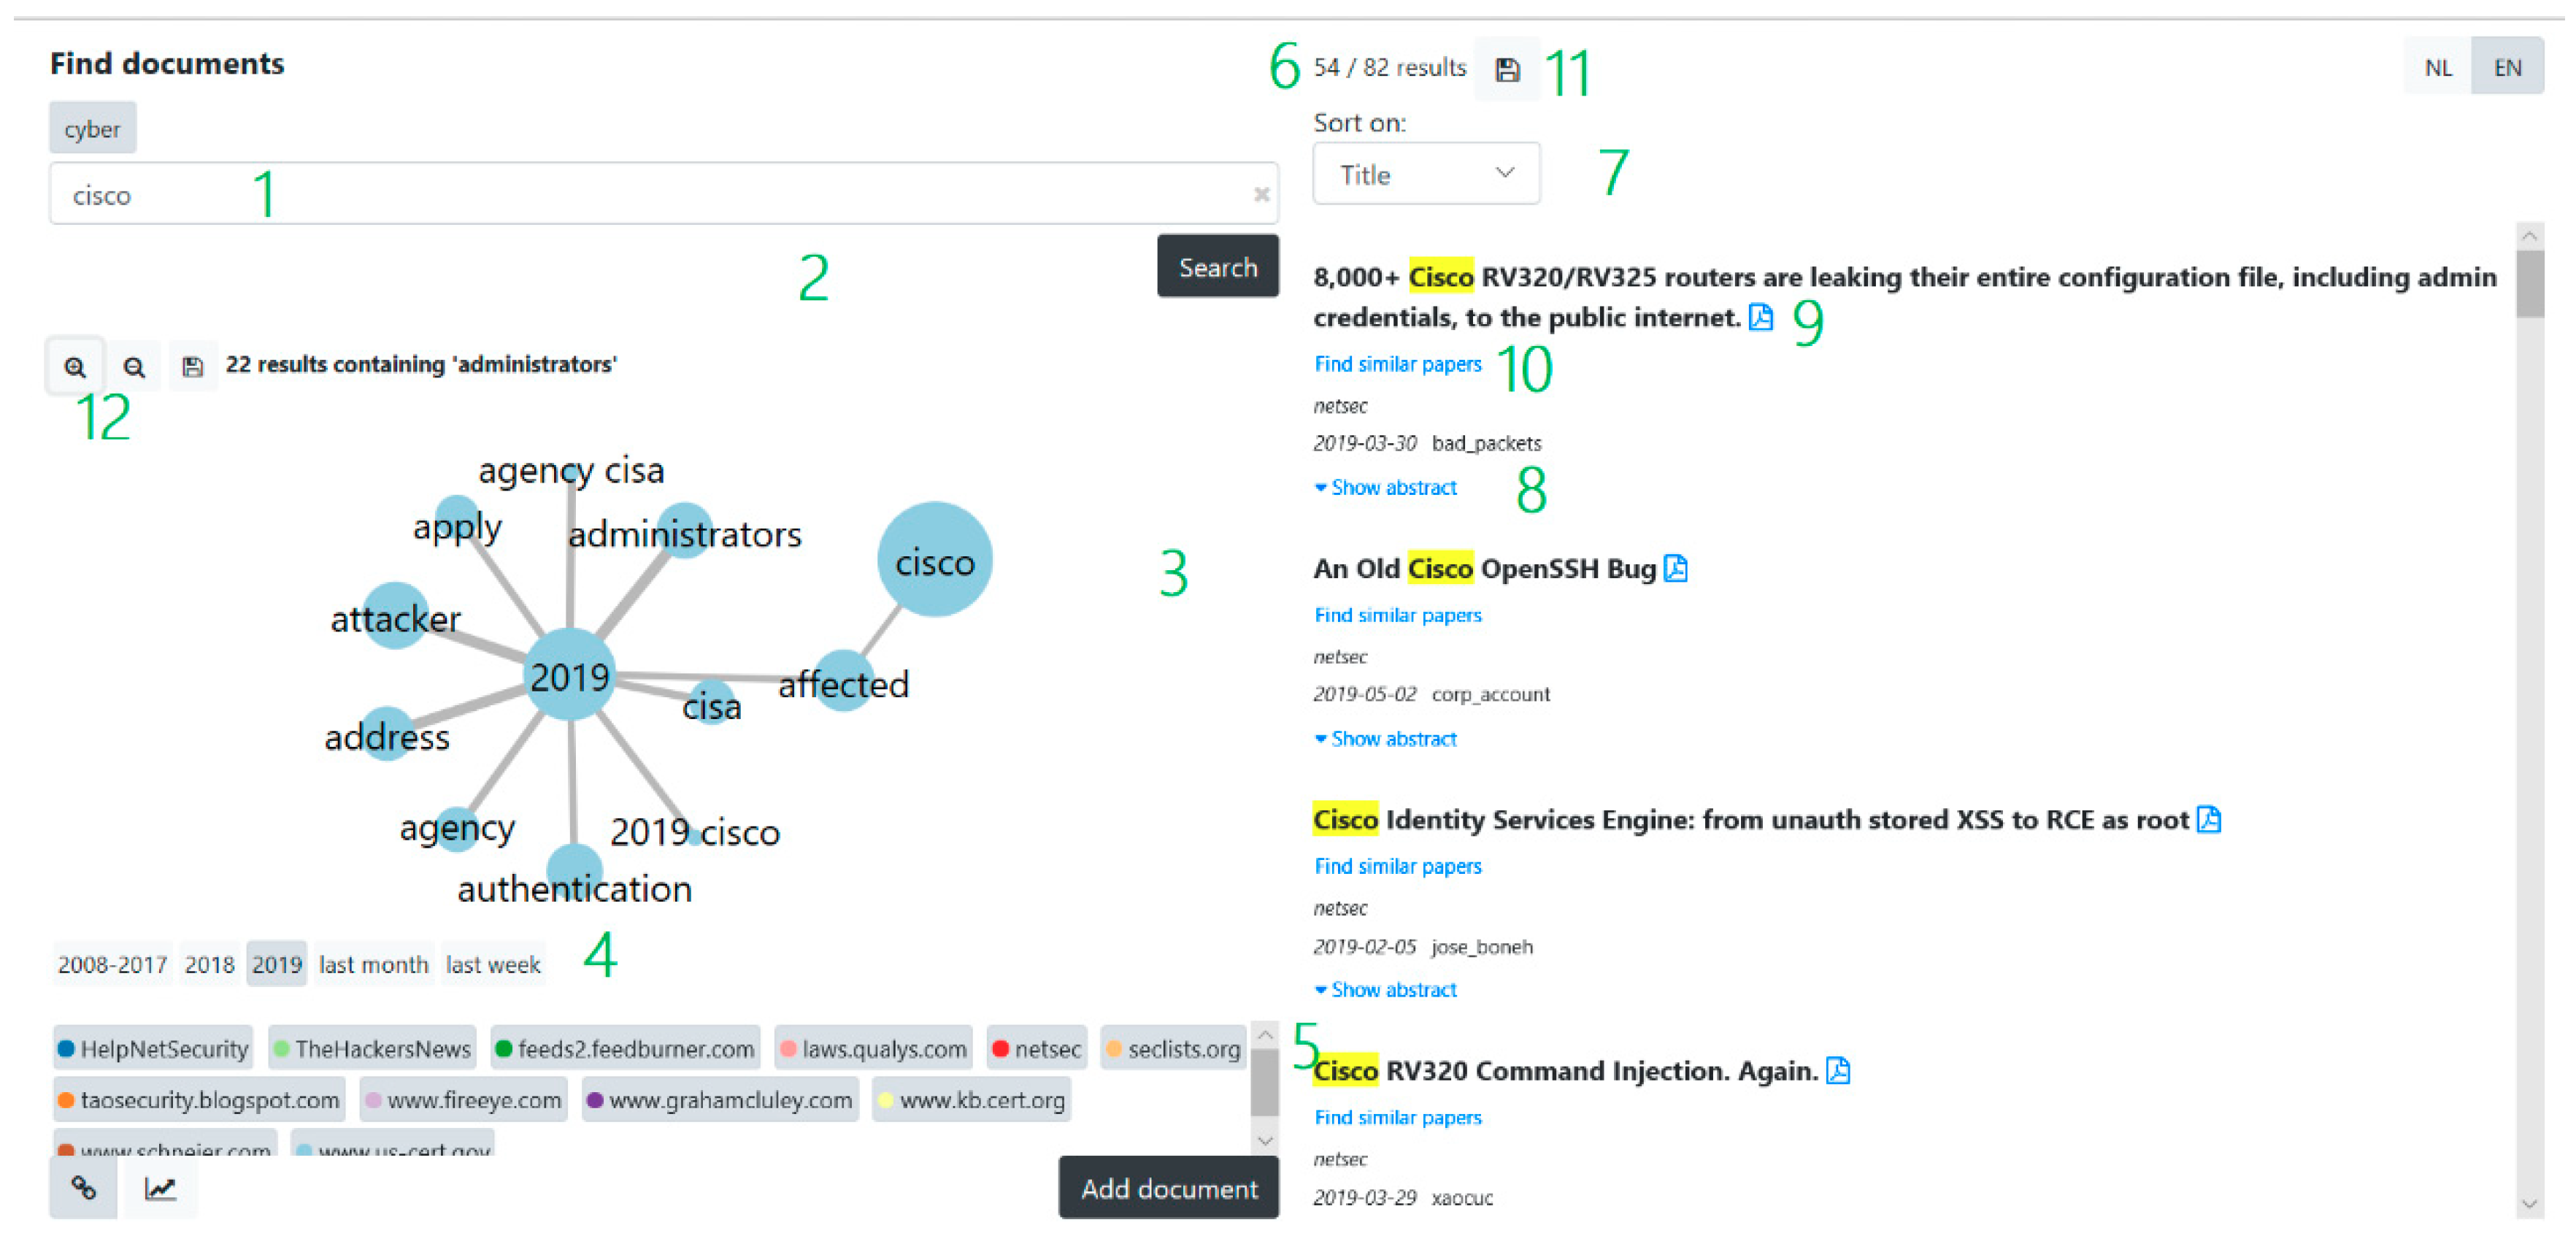
3.4. Graphical User Interface (GUI)

Figure 2 shows the start screen of the Horizon Scanner tool. On the top left side are the different databases, or corpora, clickable (1). In this case only the cyber database with more than 20 data sources is present. On the left bottom side are the most important terms in the period week, month or year visible (2). These terms are also clickable and turn up in the search box when clicked on. On the right side the language can be set on either Dutch (NL) or English (EN) (3). Documents or folders with documents can also be added using the ‘add document’ button (4). This allows the user to upload one or more documents that are uploaded to the server. At the server, the documents are processed as described in Section 3.1.
Figure 3 shows the result screen of the Horizon Scanner tool with the view of the entity graph. In this figure the query ‘cisco’ is used on the database named cyber (1). Below the query box, the related terms are displayed, if the query is found in the word2vec model (2), not present in this case. The remaining of the left side shows the entity graph (3). The nodes of the graph are the terms or concepts occurring in the results in the database. Only the concepts that occur at least 10 times in the relevant results over all years, are added to the entity graph. The color of the node indicates the source in which this concept occurs most. The edges in the graph indicate the co-occurrences between the concepts within one abstract. The concepts in the entity graph remain the same when adjusting the time window to a year or a week (4), but the size of the nodes and edges will change. Clicking on a node will filter the results on the right side to those containing the concept, indicating the concept by highlighting, and the indirect links with this concept are grayed out. Clicking on the categories below (5) will disable that source and filter the results and re-coloring the graph. The entity graph can thus provide insight in the most related and biggest terms and the relations between terms (over time) as well as the importance of sources.
The results on the right sight are the top 200 results for that query (6). The number 200 is chosen because often not more than 200 results are viewed in a non-expert search (scroll depth of 20 times 10 items in [53]). The results can be sorted by relevance, date and name (7). The abstracts can be extended in the GUI (8). The PDF files can be opened to further explore the data source (9). Additionally, for each of the results, the user can query for similar results (10). The abstract of the paper is then used as a query.
Both the results and the entity graph can be saved, the results as raw .txt and the graph as .svg file (11). It is also possible to zoom in and out in the entity graph (12).
Figure 4 shows the result screen of the Horizon Scanner tool with the view of the trend analysis. Switching between both views can be done using the link and graph icons on the bottom left (1). The trend analysis shows the normalized count of the different concepts over time. This time can be set to a year, month and week. This view can provide insight in the speed of growth of a certain topic. If a concept is selected in the entity graph, it is shown first in this view, and the remaining is selected by size. In the example, authentication is mentioned a lot in 2013, but less in 2018 and 2019. Administrators on the other hand, is mentioned more in the past two years.
The GUI is implemented in JavaScript and runs in a browser allowing for easy access to the Horizon Scanner tool. The HTTP server NGINX is used as the web server, while Flask is used for the implementation of a REST API between GUI and backend.

4. Qualitative User Evaluation and Discussion

4.1. Experimental Set-Up

In our qualitative user evaluation, three cyber experts from the Dutch Defense Cyber Command were selected to validate our tool. These cyber experts have experience with threatening intel and/or forecasting in their subdomain. Although we have performed our initial requirements session with around 20 cyber experts, these three experts were the only ones available in the timeframe and work on foresight within the cyber domain. To explore whether the tool actually helps analysts to identify new innovations and technological trends, only these three experts were therefore qualified and selected. Currently, the cyber experts mainly use text mining with specialized queries on search engines such as Google to find more specific information, and skim through many news sites, military websites, blogs, and other sources to get an impression what is happening in the domain.
For the user evaluation we used (1), an offline questionnaire; and (2) a personal interview. The SUS usability questionnaire [54] was used as a basis for our questionnaire. The SUS was translated to Dutch and a positive formulation of the 10 usability questions are used and two additional questions were added: “I can do my job better with the tool compared to without” and “the tool visualizes the data in an appealing way”. A 5-point Likert scale ranging from strongly agree to strongly disagree is used to score the answers on the question. Additionally, 18 open questions about the tool are added to the questionnaire, including questions on the added value of each subcomponent and general questions such as “describe the added value of the tool compared to not using the tool”, “what have you learned that you did not know before using the tool”, “what are the limitations of the tool”. The answers to the questions from the questionnaire were used as input for the personal interviews.

4.2. Results

The results of the scoring on the statements can be found in Table 1.
The results on the open questions and the personal interview were combined and described below. First of all, the most important terms at the start screen are perceived as valuable. The experts indicated that use of the time period tabs, i.e., week, month and year, produced different results, as expected. One expert indicated that the weekly forecast mainly showed actions and terms, the monthly forecast showed more general terms and company names and the year forecast more names of products. Most terms, such as ‘cybersecurity’, ‘actors’, and ‘release’, were indicated as relevant, and some terms, such as ‘bro’, ‘help’ and ‘use’, are indicated as non-relevant. In the personal interview, the experts indicated that a few expected terms pop up in the most relevant terms, as well as some potentially relevant but not yet thought of terms.
The search functionality was perceived as working, but not very valuable in this proof of concept with the limited amount of data. All experts indicated that their current methodology with using advanced search in Google provides them more relevant information and insights than our tool does. In the personal interviews, the experts indicated that one of the main reasons for this finding is that Google Search, or other commercial search engines, contain much more sources compared to the sources we crawled. One expert indicated that although less relevant or credible sources can be found in those search engines, the ‘filter bubble’ of the user profiles might already filter some of those away, and those that slip through they ignore. Other experts indicated that they have different search techniques, one in specific reliable sources, and one more explorative with commercial search engines. Our tool could be valuable for the first case, although it was not intentionally designed for it. The tool should than have an additional functionality of showing the latest posts or blog from one website. The Horizon Scanner tool is not yet valuable in the latter case because it has not enough sources. The experts indicated that if more sources are added, especially sources that are not scraped by commercial search engines, i.e., Reddit, Facebook and Twitter, and scientific papers, the tool could be valuable.
The produced output of the entity graph was perceived as not insightful, due to the limited dataset. The experts indicated that no novel terms appear in the graph, and some terms that were expected to appear did not, or were not linked as expected. A reason for this finding is most likely a combination of the limited data sources scraped and the algorithm used to find and link entities.
The trend analysis got some mixed feedback. On the one hand, the trend analysis can be very valuable, but the respondents stated that it not yet has reached that potential. One of the reasons is the limited sources and the fact that the entities from the entity graph are used for the trend analysis. The trends were normalized for the number of mentions, but because the scale is currently not displayed in the user interface, it is harder to judge whether an increase is a real trend or that it is based on one or two mentions more compared to the previous time point.
The possibility to add a new document was perceived as a useful functionality, but the functionality of adding documents was not yet clear. The experts indicated that the use of the added documents should be explored further before the real use can be judged.
The user interface is perceived not yet intuitive and user friendly. The interface can work with different screen sizes and different web browsers, but some functionalities appeared differently in different browsers, and some buttons disappeared when setting a smaller screen size. The interface was also not as fast as commercial search engines, although within seconds response time. The experts acknowledged that this is a proof of concept, but a user interface is a key component to make a tool valuable or not.
In general, the experts have difficulty to see the added value of the tool in its current state, but they see several options for improvement to make the tool more valuable. The improvements to bring the proof of concept to operations are (1) addition of more relevant sources, especially those that are not included in commercial search engines, (2) the ability to personally add, manage and weight data sources, (3) improvement of the user interface, especially speed and more intuitive use; (4) improvement of the entity graph; (5) more ‘explainability’, for example of why terms are perceived more important.

4.3. Discussion

The qualitative evaluation, although limited in its generalizability, gave us insight in the current methods used by cyber experts in the Defense realm. We learned that the experts are satisfied about how they currently collect their information using advanced search methods and highly-optimized commercial search engines. It could therefore well be that commercially-biased user expectations adversely affected the evaluation, in part explaining some of the negative results that were recorded. Moreover, the experts we interviewed regularly use text mining and content analysis for work purposes. Hence, there has evolved a tendency for them to use certain tools, and others not, out of habit or because they were told by others to do so (see also [23]). For it is difficult to change habits, it could be that the responses they provided were biased towards favoring the text mining tools and routines they are familiar with. Future evaluations should address these issues, for instance through involving analyst that are new on the job, or even still in training, not yet familiar with other tools, to get a better picture of the merits of new tools for forecasting or text mining.
In the suggestions for improvement we have received, the common denominator seems to be the need for more human-centric solutions in text mining. The experts wanted to have a personalized database, in which data sources of their interest are collected. These sources should then also be weighted in the results, and in- or excluded when indicated. The need for more explanation of the search results also indicates the importance of human-centricity in tool design.

5. Conclusions

This paper describes the Horizon Scanner tool, a tool that aims to help analysts explore the web for potential trending threats and vulnerabilities on cyber security. The tool uses text mining and information retrieval techniques to retrieve data from the web and PDFs, store and search this data and additionally, add information about the data in the form of an entity graph, a visualization of potential trends and an overview of potentially important terms. Through an initial requirements session, and a user evaluation we explored the potential of the tool to help analysts explore the web for trending topics on cyber security. Although the proof of concept was not optimized for speed and this was not an evaluation criterion, the results were affected by the fact that the current version of the tool cannot compete with commercial search engines in terms of speed and amount of data available. The tool was perceived as useful in providing an extraction of the most important terms in a certain period in time, an important functionality because this helps in identifying weak signals of threats or vulnerabilities. Future iterations of our tool will emphasize human-centric aspects, such as workflow support and increased explanation and controllability of the analyses.

Author Contributions

Conceptualization: M.H.T.d.B., R.v.d.K., S.R.; methodology, M.H.T.d.B.; software, M.H.T.d.B., E.B., M.W.; validation, M.H.T.d.B., R.v.d.K.; resources, TNO and DCEC; writing—original draft preparation, M.H.T.d.B., B.J.B., R.v.d.K.; writing—review and editing, R.v.d.K., B.J.B., E.B., M.W., S.R.; visualization, E.B.; supervision, S.R.; project management, R.v.d.K.

Funding

This research and tool development was supported by TNO’s program V1622 on cyber capabilities for the military.

Acknowledgments

We would like to thank: RVO Tech Watch for his financial support and feedback to set up a first version of the Horizon Scanner tool; Maya Sappelli, Jorrit van den Berg, Stefan Verbruggen, Riccardo Satta and Ajaya Adhikari for their help with the implementation; Rudi Gouweleeuw for his thorough feedback; DCEC for their valuable feedback on the tool and participation in the experiment.

Conflicts of Interest

The authors declare a conflict of interest with Maya Sappelli.

References

  1. Bissell, C.K.; LaSalle, R.; Cin, P.D. Ninth Annual Cost of Cybercrime Study; Ponemon Institute: Dublin, Ireland, 6 March 2019. [Google Scholar]
  2. Paoli, L.; Visschers, J.; Verstraete, C. The impact of cybercrime on businesses: A novel conceptual framework and its application to Belgium. Crime Law Soc. Chang. 2018, 70, 397–420. [Google Scholar] [CrossRef]
  3. DiMase, D.; Collier, Z.A.; Heffner, K.; Linkov, I. Systems engineering framework for cyber physical security and resilience. Environ. Syst. Decis. 2015, 35, 291–300. [Google Scholar] [CrossRef]
  4. Van Der Kleij, R.; Leukfeldt, R. Cyber Resilient Behavior: Integrating Human Behavioral Models and Resilience Engineering Capabilities into Cyber Security. In Proceedings of the International Conference on Applied Human Factors and Ergonomics, Washington, DC, USA, 24–28 July 2019; Springer Science and Business Media LLC: Berlin, Germany, 2019; pp. 16–27. [Google Scholar]
  5. Hollnagel, E. RAG-The resilience analysis grid. In Resilience Engineering in Practice: A Guidebook; Wreathall, J., Hollnagel, E., Eds.; CRC Press: Boca Raton, FL, USA, 2011. [Google Scholar]
  6. Bakdash, J.Z.; Hutchinson, S.; Zaroukian, E.G.; Marusich, L.R.; Thirumuruganathan, S.; Sample, C.; Hoffman, B.; Das, G. Malware in the future? Forecasting of analyst detection of cyber events. J. Cybersecur. 2018, 4, tyy007. [Google Scholar] [CrossRef]
  7. Denrell, J.; Fang, C. Predicting the Next Big Thing: Success as a signal of poor judgment. Manag. Sci. 2010, 56, 1653–1667. [Google Scholar] [CrossRef]
  8. Schatz, D.; Bashroush, R. Security predictions—A way to reduce uncertainty. J. Inf. Secur. Appl. 2019, 45, 107–116. [Google Scholar] [CrossRef]
  9. Paradis, C.; Kazman, R.; Wang, P. Indexing text related to software vulnerabilities in noisy communities through topic modelling. In Proceedings of the IEEE ICMLA 2018: 17th IEEE International Conference on Machine Learning and Applications, Orlando, FL, USA, 17–28 December 2018; IEEE: Piscataway, NJ, USA, 2018; pp. 763–768. [Google Scholar]
  10. Van Der Kleij, R.; Kleinhuis, G.; Young, H. Computer Security Incident Response Team Effectiveness: A Needs Assessment. Front. Psychol. 2017, 8, 2179. [Google Scholar] [CrossRef] [PubMed]
  11. Wu, Q.; Shao, Z. Network Anomaly Detection Using Time Series Analysis. In Proceedings of the Joint International Conference on Autonomic and Autonomous Systems and International Conference on Networking and Services (ICAS-ISNS’05), Papeete, French Polynesia, 23–28 October 2005; IEEE: Piscataway, NJ, USA, 2005; Volume 5, p. 42. [Google Scholar]
  12. Kim, D.H.; Lee, T.; Jung, S.O.D.; In, H.P.; Lee, H.J. Cyber Threat Trend Analysis Model Using HMM. In Proceedings of the Third International Symposium on Information Assurance and Security, Manchester, UK, 29–31 August 2007; IEEE: Piscataway, NJ, USA, 2015; pp. 177–182. [Google Scholar]
  13. Miles, I.; Harper, J.C.; Georghiou, L.; Keenan, M.; Popper, R. The many faces of foresight. In The Handbook of Technology Foresight: Concepts and Practice; Edward Elgar Publishing: Cheltenham, UK, 2008; pp. 3–23. [Google Scholar]
  14. Linstone, H.A.; Turoff, M. The Delphi Method: Techniques and Applications, 1st ed.; Addison-Wesley Educational Publishers: Boston, MA, USA, 1975. [Google Scholar]
  15. Hauptman, A.; Sharan, Y. Foresight of evolving security threats posed by emerging technologies. Foresight 2013, 15, 375–391. [Google Scholar] [CrossRef]
  16. Linden, A.; Fenn, J. Understanding Gartner’s Hype Cycles; Gartner: Stanford, CT, USA, 2003. [Google Scholar]
  17. TrendWatching. Available online: https://trendwatching.com/ (accessed on 23 June 2019).
  18. Thoughtworks. Available online: www.thoughtworks.com/radar/faq/ (accessed on 23 June 2019).
  19. Innoradar. Available online: https://www.innoradar.eu/ (accessed on 23 June 2019).
  20. Voros, J. A generic foresight process framework. Foresight 2003, 5, 10–21. [Google Scholar] [CrossRef]
  21. Kostoff, R.N.; Schaller, R.R. Science and Technology Roadmaps. IEEE Trans. Eng. Manag. 2001, 48, 132–143. [Google Scholar] [CrossRef]
  22. Chang, R.M.; Kauffman, R.J.; Kwon, Y. Understanding the paradigm shift to computational social science in the presence of big data. Decis. Support Syst. 2014, 63, 67–80. [Google Scholar] [CrossRef]
  23. Church, K.W.; Mercer, R.L. Introduction to the special issue on computational linguistics using large corpora. Comput. Linguist. 1997, 19, 1–24. [Google Scholar]
  24. Hearst, M.A. Untangling text data mining. In Proceedings of the 37th Annual Meeting of the Association for Computational Linguistics, College Park, MD, USA, 20–26 June 1999; Association for Computational Linguistics: Stroudsburg, PA, USA, 1999. [Google Scholar]
  25. Feldman, R.; Dagan, I. Knowledge Discovery in Textual Databases (KDT). In Proceedings of the First International Conference on Knowledge Discovery and Data Mining, Montreal, QC, Canada, 20–21 August 1995; IEEE: Piscataway, NJ, USA, 1995; Volume 95, pp. 112–117. [Google Scholar]
  26. Eriksson, J.; Giacomello, G. Content Analysis in the Digital Age: Tools, Functions, and Implications for Security. In The Secure Information Society; Krüger, J., Nickolay, B., Gaycken, S., Eds.; Springer: London, UK, 2013; pp. 137–148. [Google Scholar]
  27. Porter, A.L.; Cunningham, S.W. Tech mining. Competitive Intell. Mag. 2005, 8, 30–36. [Google Scholar]
  28. Efimenko, I.V.; Khoroshevsky, V.F.; Noyons, E.C.M.; Daim, T.U.; Chiavetta, D.; Porter, A.L.; Saritas, O. Anticipating Future Pathways of Science, Technologies, and Innovations: (Map of Science)2 Approach. In Innovation, Technology, and Knowledge Management; Cambridge University Press: Cambridge, UK, 2016; pp. 71–96. [Google Scholar]
  29. Benson, C.L.; Magee, C.L. Using enhanced patent data for future-oriented technology analysis. In Anticipating Future Innovation Pathways through Large Data Analysis; Daim, T.U., Chiavetta, D., Porter, A.L., Saritas, O., Eds.; Springer: Cham, Switzerland, 2016; pp. 119–131. [Google Scholar]
  30. Finlay, S. Text Mining and Social Network Analysis. In Predictive Analytics, Data Mining and Big Data; Business in the Digital Economy; Palgrave Macmillan: London, UK, 2016; pp. 179–193. [Google Scholar]
  31. Kayser, V.; Blind, K. Extending the knowledge base of foresight: The contribution of text mining. Technol. Forecast. Soc. Chang. 2017, 116, 208–215. [Google Scholar] [CrossRef] [Green Version]
  32. Mikova, N. Recent Trends in Technology Mining Approaches: Quantitative Analysis of GTM Conference Proceedings. In Anticipating Future Innovation Pathways Through Large Data Analysis; Springer: Cham, Switzerland, 2016; pp. 59–69. [Google Scholar]
  33. Könnölä, T.; Amanatidou, E.; Butter, M.; Carabias, V.; Leis, M.; Saritas, O.; Schaper-Rinkel, P.; Van Rij, V. On concepts and methods in horizon scanning: Lessons from initiating policy dialogues on emerging issues. Sci. Public Policy 2012, 39, 208–221. [Google Scholar] [Green Version]
  34. Alltop. Available online: www.alltop.com (accessed on 23 June 2019).
  35. Reddit. Available online: https://www.reddit.com/r/TrendingReddits/ (accessed on 23 June 2019).
  36. BuzzSumo. Available online: www.buzzsumo.com (accessed on 23 June 2019).
  37. EU Science Hub Activities. European Commission. Available online: https://ec.europa.eu/jrc/en/text-mining-and-analysis/activities (accessed on 23 June 2019).
  38. ITONICS. Available online: www.itonics.de/software/itonics-scout-environmental-scanning (accessed on 23 June 2019).
  39. Powers, S. Practical RDF: Solving Problems with the Resource Description Framework; O’Reilly Media: Sevastopol, CA, USA, 2003. [Google Scholar]
  40. McKee, K. Feedparser. Available online: https://github.com/kurtmckee/feedparser (accessed on 23 June 2019).
  41. OSF. Available online: http://opensemanticframework.org (accessed on 23 June 2019).
  42. Lopez, P. GROBID: Combining Automatic Bibliographic Data Recognition and Term Extraction for Scholarship Publications. In Computer Visio-ECCV 2012; Fitzgibbon, A., Lazebnik, S., Perona, P., Sato, Y., Schmid, C., Eds.; Springer Science and Business Media: Berlin, Germany, 2009; Volume 5714, pp. 473–474. [Google Scholar]
  43. Manning, C.; Raghavan, P.; Schütze, H. Introduction to information retrieval. Nat. Lang. Eng. 2010, 16, 100–103. [Google Scholar]
  44. The NLTK Toolkit. Available online: https://www.nltk.org/api/nltk.tag.html (accessed on 23 June 2019).
  45. Wikipedia. Available online: https://en.wikipedia.org/wiki/Stop_words (accessed on 23 June 2019).
  46. Verberne, S.; Sappelli, M.; Hiemstra, D.; Kraaij, W. Evaluation and analysis of term scoring methods for term extraction. Inf. Retr. 2016, 19, 510–545. [Google Scholar] [CrossRef] [Green Version]
  47. Termprofiling. Available online: https://github.com/suzanv/termprofiling (accessed on 23 June 2019).
  48. Chowdhury, G.G. Introduction to Modern Information Retrieval; Facet publishing: London, UK, 2010. [Google Scholar]
  49. Azad, H.K.; Deepak, A. Query expansion techniques for information retrieval: A survey. Inf. Process. Manag. 2019, 56, 1698–1735. [Google Scholar] [CrossRef] [Green Version]
  50. Kuzi, S.; Shtok, A.; Kurland, O. Query Expansion Using Word Embeddings. In Proceedings of the 25th ACM International, Indianapolis, IN, USA, 24–28 October 2016; pp. 1929–1932. [Google Scholar]
  51. De Boer, M.H.T.; Lu, Y.J.; Zhang, H.; Schutte, K.; Ngo, C.W.; Kraaij, W. Semantic Reasoning in Zero Example Video Event Retrieval. ACM Trans. Multimedia Comput. Commun. Appl. 2017, 13, 1–17. [Google Scholar] [CrossRef] [Green Version]
  52. Rehurek, R.; Sojka, P. Software Framework for Topic Modelling with Large Corpora. In Proceedings of the LREC 2010 Workshop on New Challenges for NLP Frameworks, Valletta, Malta, 22 May 2010; University of Malta: Msida, Malta, 2010; Volume 5, pp. 46–50. [Google Scholar]
  53. Athukorala, K.; Glowacka, D.; Jacucci, G.; Oulasvirta, A.; Vreeken, J. Is exploratory search different? A comparison of information search behavior for exploratory and lookup tasks. J. Assoc. Inf. Sci. Tech. 2016, 67, 2635–2651. [Google Scholar] [CrossRef]
  54. Brooke, J. SUS—A quick and dirty usability scale. In Usability Evaluation in Industry; CRC Press: Boca Raton, FL, USA, 1986. [Google Scholar]
Figure 1. Overview of the Horizon Scanner Tool.
Mti 03 00062 g001
Figure 2. Start screen of the Horizon Scanner tool.
Mti 03 00062 g002
Figure 3. Result screen of the Horizon Scanner tool with the entity graph.
Mti 03 00062 g003
Figure 4. Result screen of the Horizon Scanner tool with the trend analysis.
Mti 03 00062 g004
Table 1. Results questionnaire.
Statement (Translated Back from Dutch)Average Score
(1 = Strongly Disagree;
5 = Strongly Agree;
N = 3)
I think I will use the tool frequently2
I think this tool is useful in my organization2.67
The tool is easy to use1.67
I think I can use the tool without technical support2.33
I belief that the different functionalities of this tool are well integrated2
It is clear how I should use the tool2
The tool does what I expect it to do2
I feel confident when using the tool2
The tool gives me valuable information1.67
I can do my job better with the tool compared to without 1.33
The tool takes work from me/off my hands 1.67
The tool visualizes the data in an appealing way1.33

