A Survey on Psycho-Physiological Analysis & Measurement Methods in Multimodal Systems


Department of Computing, Faculty of Science and Engineering, Macquaire University, Sydney 2109, Australia
*
Author to whom correspondence should be addressed.
Multimodal Technol. Interact. 2019, 3(2), 37; https://doi.org/10.3390/mti3020037
Submission received: 23 April 2019
/
Revised: 8 May 2019
/
Accepted: 14 May 2019
/
Published: 28 May 2019
(This article belongs to the Special Issue Multimodal User Interfaces Modelling and Development)
Abstract
:Psycho-physiological analysis has gained greater attention in the last few decades in various fields including multimodal systems. Researchers use psychophysiological feedback devices such as skin conductance (SC), Electroencephalography (EEG) and Electrocardiography (ECG) to detect the affective states of the users during task performance. Psycho-physiological feedback has been successful in detection of the cognitive states of users in human-computer interaction (HCI). Recently, in game studies, psycho-physiological feedback has been used to capture the user experience and the effect of interaction on human psychology. This paper reviews several psycho-physiological, cognitive, and affective assessment studies and focuses on the use of psychophysiological signals in estimating the user’s cognitive and emotional states in multimodal systems. In this paper, we review the measurement techniques and methods that have been used to record psycho-physiological signals as well as the cognitive and emotional states in a variety of conditions. The aim of this review is to conduct a detailed study to identify, describe and analyze the key psycho-physiological parameters that relate to different mental and emotional states in order to provide an insight into key approaches. Furthermore, the advantages and limitations of these approaches are also highlighted in this paper. The findings state that the classification accuracy of >90% has been achieved in classifying emotions with EEG signals. A strong correlation between self-reported data, HCI experience, and psychophysiological data has been observed in a wide range of domains including games, human-robot interaction, mobile interaction, and simulations. An increase in and -band activity have been observed in high intense games and simulations.
1. Introduction
Research in psycho-physiological analysis has grown rapidly in recent decades. Psycho-physiological measures such as electroencephalography (EEG), electrocardiography (ECG) and skin conductance (SC) have been used to estimate user cognitive and affective states in various environments. People from varied backgrounds are using psycho-physiological analysis according to their logical foundations, interests, and inspirations. Various studies have been conducted to record user experience or psychological effects during human-computer interaction (HCI), they have utilized real-time features from the psychophysiological data to access subject’s psychology. Along these lines, we have various research outcomes for different research questions, yet next to no amassed information that could be utilized for creating more exact research questions or for making hypothetical theories. This review aims to provide a critical analysis of these studies.
Psycho-physiological research involves the study of human psychology through physiological signals [1]. However, there is no direct relationship between psychological phenomena and physiological processes, which makes the interpretation of the signals more difficult. Multi-modal human-computer interaction (HCI) stimuli are quite challenging in this scenario—they utilized physically intricate input devices and usually provide outputs in multiple modalities; these interactions also involve detailed cognitive processing on various levels and can last from a few seconds to several hours [2]. The motivation for using a multi-modal interaction system also changes from person to person [3]. As most of the psycho-physiological activities initiated from a much simpler experimental setup, it is not obvious that the same relation will appear when interacting with a multi-modal HCI system. For example, a direct relation found between physiology and psychology when a person looks at the pictures that are selected for inducing emotions, might not appear the same way when the person is experiencing a multi-modal system.
A cognitive state is the mental action of acquiring knowledge through thoughts, experience and senses. There are many processes and functions that contribute to a cognitive state such as attention, memory, reasoning, problem solving, and so forth. Psychological efforts are the cognitive actions executed to complete a task. Emotional state is a relatively brief conscious experience result in intense mental activity. User experience is the actual experience of a user based on cognitive states and emotions when interacting with an HCI. In cognitive psychology, cognitive load refers to the used amount of working memory resources.
Another complication in analyzing multi-modal system through psychophysiology is the lack of common theory on how the interaction experience arises. One big task is to identify the research questions that can be answered even when the multi-modal interaction is complex and the psychological processes are numerous, and then to design an experimental setup with no confounding variables affecting the results [4]. If the multi-modal interaction is complicated and hard to control, the sample size should be large enough to record the reaction without noise. The recommended sample size by statisticians to effectively detect a large reaction is at least 28 [5], but it largely depends upon the experimental tasks, psychophysiological measures, and environment.
The HCI experience is greatly affected by physical reactions during a process. Hence, it will entice the claim that psycho-physiological strategies give a technique to measure the multi-modal HCI experience itself. Actually, we can only see into those parts of the interaction that has distinguished measurable physical concomitants. In spite of that, physiological measures might provide more representing and detailed information about the user’s cognitive and emotional states than subjective techniques [6]. Most of the physiological studies involved voluntary participation, therefore, the recordings are polluted by participants’ answering style, social involvement, the limit of memory, questionnaire quality and observer biases. Moreover, for HCI interaction the main advantage is that the signals can be recorded automatically and in real-time without disturbing the participant’s natural conduct. Another advantage of psychophysiological measurement is that it can detect quite sensitive responses. Join together with other methods such as observational data and questionnaires, the psycho-physiological analysis includes noteworthy precision in studying multi-modal HCI. There are some practical limitations such as expensive equipment, attention, time and device maintenance but with the advancement in technology, these factors will become insignificant.
As there is a lot of literature on the theory, method and practice of psycho-physiological analysis, in this paper we are only covering the part relates to cognitive and emotional state estimation. There are many papers that review the psycho-physiological analysis in HCI context, but no single accepted theory is available that can explain the HCI interaction experience. Most of the theoretical framework has been borrowed from other fields such as physiology, psychology and media research. In this paper, we reviewed some recent methods used to analyze multi-modal HCI systems and the parameters involved in estimating the cognitive and emotional state.
2. Psycho-Physiological Signals and Analysis
Psychophysiology is a branch of physiology that deals with the relationship between psychological and physical phenomenon. To record psychophysiological signals, three kinds of measure: reports, reading, and behavior are used. The reports evaluate participants introspection and self-rating about the psychological and physiological states [7]. Questionnaires are most commonly used to record the self-rating. The merit of using report is that it is a representation of user’s subjective experience; however, the demerit is the human error such as bias response, misunderstanding of question or scale, and so forth [8].
Reading corresponds to the physiological responses that are measured via an instrument to read bodily events such as heart rate, body temperature, muscle tension, brain signals, skin conductance and so forth [7]. The benefit of using these measures is that they provide an accurate and subject independent response; however, they are very prone to physical activity and situation [9]. The behavior measure involves the recording of observations and actions such as facial expressions, eye movements, and so forth [7]. These responses are easy to measure and mostly used in attention and emotions related experiments [10,11].
In psychophysiology, a complex and interactive analysis of bio-signals is usually required. The application of psycho-physiological analysis range from stress to lie detection. Often, researchers use it to monitor the effect of an experiment on the user by measuring the short-term affective responses (feeling, mood, disposition, etc.) [12]. Affective responses are considered as an instinctive state of mind based on circumstances and mood. These responses are spontaneous and last for a few minutes, which makes them hard to recognize. The classical affective states used in the psycho-physiological analysis are anger, contempt, disgust, fear, happiness, neutral, sadness and surprise.
The researchers have used psychophysiological signals to estimate the cognitive state of participants. These signals have been used to analyze low order (e.g., simple visual inspection) and high order cognitive processes (e.g., attention, memory, language, problem solving) [13]. Different signal sources are used in the literature for psycho-physiological analysis such as Electrocardiogram (ECG), Skin conductance (GSR), Electroencephalography (EEG), Electromyography (EMG), respiration rate (RR), Electrooculogram (EOG), Skin temperature (ST), facial expression, etc. Some of these measures are mentioned in the next section.
To record the above mentioned psychophysiological signals, various novel technologies have been used in the past to design electrodes. These technologies have been upgraded from wet to dry electrodes with silver/silver chloride as the most commonly used plating material for these biofeedback sensors. Apart from silver/silver chloride, gold, aluminum, stainless steel and mixture of some other metals such as nickel and titanium are also utilized [14] in sensors. The wet electrodes require an electrolytic gel to increase the conduction but causes discomfort to the participants. Thus, for applications that involve real-time recording, preference was given to the dry electrodes [15]. A list of some commercially available measurement devices for recording biofeedback signals has been given in Table 1.
3. Measurement Methods
3.1. Electrocardiogram
The electrocardiogram (ECG) signal is a measure of electric potential recorded from the skin. The rise and fall of the signal identify different polarization levels of the heart over each heartbeat. The heart rate is measured by calculating the distance from R to R point (peak to peak) as shown in Figure 1. The distance increases with a decrease in heart rate. One drawback of using ECG to find a heart rate is that sometimes it becomes uncomfortable because electrodes are in direct contact with the skin [38].
3.2. Photoplethysmography
Photoplethysmography (PPG) is a low-cost non-invasive optical device used to detect changes in blood volume in the microvascular bed of tissue. The PPG signal comprises of two parts; pulsating (AC) signal that measures the changes in blood volume and it is synchronous with cardiac activity, slowly varying (DC) signal contains various low frequencies used to measure the respiration and thermoregulation. These days, it is the most common way of measuring heart-rate, oxygen saturation, and blood pressure [39]. PPG has been used in HCI and Human-robot interaction (HRI) for measuring user experience in terms of emotion and stress [40].
3.3. Heart Rate and Heart Rate Variability
Heart rate and Heart Rate Variability (HRV) are among the widely used features in detecting emotion states [41]. Autonomic Nervous System (ANS) activity can be effectively derived from the heart rate because the sympathetic and parasympathetic nervous systems govern ANS activity. Stress or activation can be related to ANS because, in a state of stress, the Sympathetic Nervous System (SNS) accelerates the heart rate. In the case of relaxation or rest, the heart rate returns to normal because of the Parasympathetic Nervous System (PNS) [41]. Heart rate is the number of heartbeats per min (bpm). Whereas, HRV is the sequence of time intervals between heart beats.
SNS activity is directly related to heart rate; an increase in heart rate is due to an increase in SNS activity. The opposite is the case with PNS; a decrease in heart rate triggers PNS activity which corresponds to the rest or relaxation states. There are some other features that can be derived from the acceleration and deceleration periods including the magnitude and slope of that period, the amount of time taken by these periods, and the mean difference over the baseline [41].
On the other hand, HRV is also sometimes useful in calculating the affect. HRV can be used to explain both time- and frequency-domain metrics. This metric can be simple, such as the standard deviation of successive heartbeats, to some complicated metric, such as short-term power spectral density [42].
A simple robust metric such as standard deviation is sometimes preferred with a short time window because of the limited information [43]. Other metrics can be the maximum and minimum difference between normal R-R wave time interval in a defined window, the successive normal R-R interval difference percentage that is greater than 50 msec (pNN50) and root mean square difference between consecutive R-R interval [44].
With the advancement in signal recording and processing algorithms, complex features such as short-time Fourier Transform (FT) or Power Spectral Density (PSD) of heart rate are becoming the more effective tools for analyzing HRV. The PNS activity has the ability to modulate the HRV in frequencies of 0.04 to 0.5 Hz. Whereas, the SNS activity has functional gain below 0.1 Hz [42,45]. The spectral domain can function as best in discriminating the SNS and PNS activity influence on HRV, this is often known as sympathovagal balance.
One easy step to calculate the sympathovagal ratio of all heart rate activity is to measure the ratio of the energy of lower frequency range (0.04–0.1 Hz) with the total energy in the band (0.04–0.5 Hz). Some research suggests that it can also be measured by comparing the energy of the low-frequency band with a variety of combination of low, medium and high-frequency bands energy [44].
Every HRV dependent measure is robust to artifacts such as noise, outliers and abnormal beats and difference in SNS vs PNS activity. In accession to selecting a suitable metric, scientists and researchers ought to also select the acceptable time frame for heart rate series over which metric needs to be calculated. The quality of heart rate series and variable of interest will define the selection of a suitable metric from the cardiac signal. Generally, a 5 min time window is recommended for an average heart rate of 60 bpm (beats per minutes) [46].
3.4. Skin Conductance
Skin conductance is the measure of a person’s sweat level in glands. Normally, the skin is an insulator but its conductance changes when there is sweat in the sweat glands. Skin conductance is sometimes referred to as Galvanic Skin Response (GSR). Skin conductivity is a non-invasive method to detect sympathetic activation, which is sweat-gland activity [47]. Karl Jung first used GSR to measure “negative complexes” in a word-connection experiment [48] which was further used as a key component in “lie detector” tests [49]. Skin conductance has been found to have a linearly varying property with respect to emotional arousal. It has been used to classify different states such as anger and fear. It is also utilized in detecting stress level in experiments that are performed on anticipatory anxiety and stress, while performing a task [50].
Skin conductance or galvanic skin response can be measured at any place on the skin, however, the highly active sweat glands for emotions are available in the hand’s palm and the foot’s sole [50]. In experimental studies, the middle and index finger’s lower portion is commonplace for skin conductance electrodes. Usually, a conductive gel is placed on the skin to ensure good conductivity of electrical signals. For measuring skin conductance, the voltage change is measured, while injecting a small amount of current into the skin [51]. By constantly monitoring the change in potential difference across the electrodes, the skin conductance can be measured continuously.
For studies that involve movements, alternate electrodes locations are used because hand placement is sometimes found to be inconvenient and the placement also distorts the signal when a person is moving. Some researchers have measured conductivity even through clothes and jewelry [52,53]. Figure 2 shows an example signal of skin conductivity that varies with time. In this figure, an audio stimulus was played to get “orienting responses” during the test. Seven skin conductance responses are labeled in the graph. The response “1” has occurred at the start of the graph was not stimulated but potentially to be caused by clicking sound made by the computer when starting the audio track. The reactions “2”, “3”, “5” and “7” has been generated by the consecutive audio burst. Another “unstimulated” response observed at “6” [41].
3.5. Electroencephalography
An electroencephalogram (EEG) corresponds to the electrical activity of the brain and is observed by measuring the electrical voltage generated by neurons. Electrodes are placed on the surface of the skull to record an EEG signal. Analysis of EEG signals is a vast field with extensive research going on in the fields of neuroscience and psychology. The pre-frontal cortex (PFC) region of the brain seems to represent emotions such as anger [54]. James and Cannon [54] gave a model of the combined working of the mind and body in processing emotion for the first time.
The EEG is the most widely used to measure brain activity because its electrodes are non-invasive and portable. A full EEG headset comprises more than 128 channels; however, some experiments use fewer electrodes in neuro-feedback practice [55]. Experimental studies have shown that the EEG has the potential to differentiate positive emotional valence from negative emotional valence. The EEG signals can also identify different arousal levels. During an experiment that involved walking, the EEG can be considered as only a raw estimate of arousal level, but new advancements have the ability to change this concept [56]. The EEG signal analysis becomes complex with the high dimensional data and the best option is to use a feature selection algorithm to select the optimal feature set for the analysis [57]. A critical review on the use of EEG in HCI was presented by Spapé et al. which discusses the shortcomings and contribution of EEG signals in HCI [58].
4. Latest Research in Psycho-Physiological Analysis
Psycho-physiological signal analysis has shown promising techniques for measuring valence and arousal level for capturing the emotional and mental state. Self-reported data interrupt the flow of interaction and does not necessarily show the actual state of the user. The psychophysiological measures help undercover the ground truth. The main problems with the psychological measures are complex equipment setting, signal analysis and controlled environment which restrict the participant’s experience of the interaction in many ways. Nevertheless, the advantages are far more than the disadvantages of psychophysiological analysis [59]. Psycho-physiological analysis has been used in the literature to recognize emotions or affective states as well as cognitive activity, but most of the research is focused on affect recognition. In the remaining sections, we will give an overview of recent trends in the use of psychophysiology in HCI.
4.1. Emotion/Affect Recognition in HCI
The research in affective phenomena focuses on detecting emotions, feelings, mood, attitude, and temperament, and so forth. A range of algorithms and techniques are available in the literature to detect emotions using different modalities. The first stage in these techniques is to generate the affective signals. This can be done in a number of ways such as by watching videos, looking at images, listening to songs, and performing a number of task, and so forth.
Our thoughts, feelings, and behavior are linked with emotions and therefore have a direct effect on decision making and thinking [60]. There are many definitions to describe primary and secondary affective states, but there is no uniform set. Six basic emotions used by many researchers are anger, joy, sadness, disgust, fear, and surprise as recommended by Ekman [10]. Another model that has been used widely to define emotions is the wheel of emotion proposed by Plutchik [61]. In the wheel of emotion, there are eight emotions. Six of those emotions are the same as defined in [10], the other two emotions are anticipation and acceptance.
Arousal and valence dimensions have been used by psychological researchers to model emotions in 2D as shown in Figure 3. In an arousal-valance model, the arousal can be “active” or “passive” and valance can be “positive” or “negative” [62]. Lang [63] labels individual pictures based on an arousal valence space which further converted into a non-verbal picture assessment called Manikin SAM [8]. Their self-assessment is used widely by advertising agencies and product designers to record affective experiences. The 2D arousal-valance model to define emotion is undoubtedly the most common model. A database named the International Affective Picture System (IAPS) is formed based on this model [64].
Emotion/affect recognition is considered to be a basic tool for the evaluation of HCIs, and the research is mainly focused on recognizing, interpreting, processing, and simulating human behavior and feelings [65]. Different research studies show that a variation in physiology is highly correlated with a variation in affects [66]. For instance, a person’s smile is mapped in positive valence, on the other side, displeasure relates to the negative valence.
Scheirer et al. [67] recognize frustration by classifying galvanic skin response and blood pressure. Klein et al. [68] also experiment with frustration by forcefully frustrating the subject using a game that involves text-based assistance for the user. The results of this experiment show that the interaction time increases significantly when textual assistance is provided, in contrast to when no assistance is given. Research studies also support the hypothesis that different stimuli can be used to generate different emotions [69], but these emotions are evoked by seeing a picture/video or listening to audio stimulus and make it hard to apply these procedures in real-world applications.
Extensive research has been done in recognizing emotions from face and voice with very high accuracy in cases where the experimental environment is controlled. The accuracy will be lower if the experiment is conducted in normal circumstances. Some researchers believe that emotions are generated due to physiological arousal, while others consider it to be a part of the emotional process [70]. In gaming research, a fuzzy approach has been used by Mandryk et al. [71] to recognize emotions using facial expressions and skin conductance, while playing NHL2003 on a Sony PS2. To record facial expressions, four electrodes have been used. Smiling and frowning are the two emotions that are recognized. The assumption is that smiling is related to positive valence and frowning is related to negative valence, but these assumptions are not enough for strong claims as it does not map the emotions to valence scale effectively [10].
In experiments on a first-person shooter game, Juma [72] worked on secondary emotions by developing a game in which the primary emotion is combined with a secondary emotion to generate an affective component. The key finding of this experiment is that secondary emotion can be of vital importance in selecting an action in an HCI environment. Emotional films have been used by Costa et al. [73] to evoke five primary emotions in participants. To estimate the valence value of emotions, a synchronization index has been calculated. Li et al. [74] used pictures to generate happiness and sadness in a subject, and record 90% classification accuracy. However, Horlings et al. [60] commented that the recognition rate will be low if the arousal and valence values are not extreme. A user-independent emotion-recognition system has been developed by Nie et al. [75]. The emotions in their experiment are generated by movies and all four emotions are extreme emotions. Frequency-domain features of EEG signals have been extracted and classification has been performed using a support vector machine (SVM).
Emotion recognition through EEG signals in brain-computer interfaces (BCI) and neuroimaging are usually carried out in a constrained environment. A small tolerance range is allowed for motor movement, which is important in object manipulation activity. Nowadays, many researchers work on using the psycho-physiological signal analysis in real-life situations such as evaluating the performance of sportsmen, game environments, etc. A review of current research in evaluating the peak performance of sportsmen has been done by Thompson et al. [76]. The study records the finding that the EEG signals are disturbed by motor movement, and it also discusses the techniques that can be used to generate reliable EEG recordings when the subjects are moving.
Nakasone and his team in 2005, presented a model to detect emotions in real time, using EMG and GSR [77] in a gaming scenario between the user and a 3D humanoid agent. Khair et al. published a review paper on human emotions in 2012 [78] in which protocols to generate and analyze human emotions, and an optimal induction method, have been proposed. According to Khair et al., music is considered to be the most popular way of inducing emotions.
The emotional response to different states of physiological signals is shown in Table 2. In another study, they found that different genders relate to different expressions of emotion [79]. Boys induce happiness and anger with faster music and upward movements, unlike girls. A combination of two approaches can be very useful in generating strong emotions such as combining music with a video or a games with strong emotional music.
Zhou et al. present a comprehensive study comparing visual and auditory stimuli to affect generation [80]. The study aims to answer the question: Can auditory stimuli be used effectively to elicit emotions instead of visual stimuli? They found that both stimuli were equally effective in inducing emotions. They also conducted a culture-specific analysis between India and China but the accuracy was more or less the same. The reason for this may be the strictly controlled experimental environment. Based on their results, we think that visual stimuli strongly backed and synced with auditory data will be much more effective as emotional elicitors in practical HCI applications.
To provide sufficient evidence in support of recognizing various factors affecting performance and to thoroughly test the developed techniques, the psychophysiological data must be sufficient. Table 3 shows the summary of the available datasets for psycho-physiological analysis accessible publicly. A substantial amount of research has been carried out in recognizing emotion from facial input. A very good review paper on facial emotion recognition on real-world user experience and mixed reality has been written by Mehta et al. [81]. Classification accuracy of almost 90% was seen in the literature using facial input which indicates that there is still room for improvement.
4.2. Cognitive States Assessment in HCI
Another major research area in psycho-physiological analysis is cognitive assessment. The literature is quite limited to cognitive assessment for multi-modal human-computer interface systems. Most of the literature is focused on the assessment of user cognition in games experience. The assessment of human-robot interaction is also popular among many researchers as well as some other HCI’s evaluation through psychophysiological signals.
4.2.1. Game Systems
The video gaming industry is one of the biggest industry in World [88]. Still, the assessment of user-game interaction and experience is primarily done by self-reported techniques [89]. With the development in measurement techniques and methods for psychophysiological system, more and more research has been carried out in measuring user experience using psychophysiological signals. A game user experience focused survey book written by Bernhaupt define various user experience and evaluation methods [90]. In a review paper, the use of the psychophysiological measure in video-games was investigated and listed the pros and cons of using psychophysiological techniques [91]. They highlighted that the field lacks useful and widely accepted game-specific theory background, research and integrated knowledge.
Drachen et al. presented a study to find a correlation between self-reported data (In-Game Experience Questionnaire (iGEQ)) and psychophysiological measures and found a direct correlation of iGEQ with heart rate [92]. Some researchers studied the correlation of psychophysiological measures and violent games and found an increase in cardiovascular activity when compared to non-violent games [93,94]. The researchers reported that the psychophysiological measures, especially heart rate, showed a strong correlation with self-reported data in both positive and negative experiences [93,95,96].
The relationship between level design parameters, user experience, and player characteristics was explored by Pedersen et al., and found a correlation between gameplay features and three emotions: Fun, challenge and frustration with an average performance of above 70% [97]. In Reference [98], McMahan et al. assessed various stimulus modalities and gaming events using an Emotive EEG device. They found a significant difference between various stimulus modalities that have increasingly difficult cognitive demands. The power of the and bands of EEG signals was increased during high-intensity events. They also suggest that Emotiv EEG headset can be used to differentiate between various cognitive processes.
Nacke et al. [99] studied the user experience in a fast-paced first-person shooter game with and without sound effects. EDA and facial EMG were recorded in addition to the questionnaire to evaluate the game experience. A significant effect of sound was observed in questionnaire results related to tension and flow and these results correlate with EMG/EDA activity. The EDA, EMG, and ECG data were used to classify two different gaming events with 80% accuracy shows that the psychophysiological signal has the capability to differentiate between different user experience [100].
Stein et al. presented a method to adjust the game difficulty using EEG signals [101]. They estimated the long term excitement of the participant to trigger the dynamic difficulty adjustment and found a correlation between excitement patterns and game events. In the literature, machine learning and evolutionary algorithms are used for clustering various gaming events [102], design new levels [103], difficulty adjustment [101,104], modeling user experience [97,105], and feedback to personalized game elements [106]. Despite these advancements, the investigation in modeling and estimating user experience for the improvement of the HCI system is still in its preliminary stages.
4.2.2. Human Robot Interaction (HRI) Studies
Psycho-physiological analysis has been applied in HRI studies that involve interacting with actual robots to evaluate the user experience [107]. The main problem with the psychophysiological analysis is to verify the accuracy and significance of the results. A research conducted by Itoh et al. used ECG, skin response, EDA, blood pressure and upper body movement to estimate the participant stress level and based on the stress level robot modify its action [108]. They found that the user’s stress level decreased when the robot shook their hand. Other researchers have found the same observation when modifying the robot’s behaviors based on participants psychophysiological state [109,110]. Kulic and Croft evaluated the feasibility of psychophysiological measure for user experience evaluation [111]. Results showed a relationship between anxiety, calmness and the speed of the robotic arm. A stronger response was seen in EDA, EMG and ECG signals. Dehais et al. study showed the same result when they evaluate the human response to different types of robot motion [112].
Researchers have used human gaze analysis to measure situation awareness in real-time in HRI [113]. The model was able to predict a standard measure of situation awareness. Podevijn et al. [114] study the psychophysiological state of the participants when they interact with a swarm of robots. A direct relationship was found between user state and number of robots which the user is exposed to and an increase in arousal value was observed when the user was exposed to 24 robots. The visual features of a robot such as an appearance and vocal properties an affect the cognitive state of the patient who is under some treatment [115]. Human response to robot motions during direct human-robot interaction using physiological signals was studied by Kulic and Croft [116,117]. The human response was estimated by fuzzy inference engine and results showed that fast robot motion induces strong arousal response. A direct relationship was found between estimated emotional arousal and robot velocity. ROBIN, a telepresence robot, design by Cortellessa et al. [118] to measure physical and psychological health of elderly people. The evaluation showed that the interaction of ROBIN with elderly people was pleasant and usable.
In a study conducted to record the response of elderly people suffering from mild cognitive impairment showed that interacting with a telepresence robot has no adverse effect in cardiovascular activity [119]. Psychophysiological measures have been used in evaluating haptic robot interaction for stroke patients in a multi-modal virtual environment [120] and observed a weak psychophysiological response compared to healthy patients. Ting et al. [121] proposed a framework of adaptive automation system based on the operator’s mental state calculated through heart-rate variability and task load index. Munih and Mihelj presented a very interesting article that summarizes the psychophysiological response in robot-assisted rehabilitation including multi-modal challenges and physical activity [122].
4.2.3. The Other HCI Systems
Psychophysiological measures are used as a tool to objectively investigate user experience in many other systems. Zhang et al. [123] studied the cognitive load measurement of a virtual reality driving system with multi-modal information fusion techniques. They found that a hybrid fusion of modalities is best suited for these kinds of difficult tasks probably because of Dual Coding Theory. Yao et al. [124] uses psychophysiological signals to evaluate the user experience of mobile applications. Participant’s physiological responses, task performance, and self-reported data were collected and they found a correlation between self-reported data and skin response, an increase in skin response in failed tasks compared to successful tasks.
Various frequency bands of EEG signal have been used to study the cognitive load of the user. Kumar and Kumar used EEG to measure cognitive load in an HCI environment and found a significant difference in spectral power between low level and high-level cognitive task [125]. Similar kind of increase in cognitive load was reported by Baig et al. in analyzing novice and expert in using a 3D modeling multi-modal HCI system compared to traditional 3D modeling system [126]. Puma et al. used theta and alpha band power of EEG to estimate the cognitive workload in a multitasking environment [127]. The results showed an increase in alpha and theta band powers when there was an increase in the involvement of cognitive resources for completing the sub-tasks.
Significant differences were found in skin response, HR and blood volume pulse (BVP) in response to a video conferencing tool [128]. An increase in GSR, HR, and decrease in BVP was observed for videos at 5 frames per second compared to 25 frames per second. Most of the subjects didn’t notice the difference in video quality, which indicates that psychophysiological measure has the capability to mine the underlying fact that cannot be found using traditional methods of measuring user experience [124]. In a comparison study between well- and ill-designed web pages, Ward et al. [129] found a decrease in GSR and HR in well-designed web pages compared to ill-designed web pages which result in an increase of stress level.
Anders Bruun presents a study where non-specialists analyze GSR data to detect user experience related events and found an accuracy of 60–80% [130]. Lin et al. present an investigation study to find the relationship between physiological measure and traditional usability index and found evidence that physiological data correlates with task performance and subjective reports assessing stress levels [131]. To study the experience in virtual reality, Meehan et al. conducted a study where they compared the participant’s physiological response to a non-threatening virtual height simulation and found a change in heart rate and skin conductance [132].
The human brain responds differently to text and multimedia stimuli; to investigate this statement, Gerě et al. [133] present a study in which they investigate cognitive processes that take place in learning information presented in a visual or text format. They use EEG signals to measure cognitive activity and found higher -band power, correspond to less mental activity in the brain, for text presentation. They also concluded that video and picture input gives a spark to visualization strategies, whereas text-induced activity is related to verbal processing. No gender-related differences were observed during this experiment. The same kind of work has been done by Madi and Khan [134]; they focused on analyzing cognitive activity and learning performance in text and multimedia comprehension. Cognitive load and emotions were monitored during the study. They found differences in -and -band power. Their study revealed that multimedia presentation, such as video and image, elicit positive emotions more than a text presentation, which induces a higher cognitive load.
To study the differences between single-task and dual-task multi-modal human-computer interaction, Novak et al. found significant changes from baseline to single and dual-task in psychophysiological signals but no differences were found between single and dual mental arithmetic task [135]. Their results suggested that different task results show different response in psychophysiological measure and it is not compulsory that the response correlates with the participant’s subjective feelings. Researchers have found significant differences in respiratory response when the participants were given high-level cognitive task. Grassmann et al. presented a systematic review of respiratory changes with respect to cognitive load [136].
Psycho-physiological analysis has also been used in the study of cognitive skills and information processing in programmers. Lee et al. [137] present a study in which they examine the differences between novices and experts in programming comprehension. They used EEG to record the neural activity and found clear differences between novices and experts. The results showed that experts have superior programming comprehension abilities and excel at digit encoding, solving simple programs in a short time, and the ability to recall program functions after an extended period of time compared to a novice. Psycho-physiological analysis has been used for assessing real-time cognitive load for younger and older adults in the situation of divided attention and task interruption with an average cognitive load assessment of 73% for younger and 70% for older adults [138].
Liu et al. [139] analyzed the psycho-physiological signals to detect affective states of engineers in CAD activities and found that the EEG results correlate with the emotions described by the engineers during that activity. In another paper, Nguyen and Zeng used heart rate and EEG signals to find the relationship between the designer’s mental efforts and stress levels [140]. They found that mental effort was the lowest at high-stress levels and no variations in the mental effort were seen in medium and low-stress level tasks. In another research work, Nguyen and Zeng found a strong association between self-rated effort and beta band power. They demonstrated that self-rating itself contribute towards mental activity [141].
Baig and Kavakli used connectivity analysis of functional brain networks to estimate the cognitive activity of designers in a 3D modeling task [142]. They used normalized transfer entropy to construct the connectivity matrix from EEG signals and found that significant changes in cognitive activity in drawing and manipulation state from the resting state. In another paper, they tried to find correlation between cognitive activities and task completion rate using a coding scheme to segment out the EEG signal with respect to design activities [143]. The results showed that the users who performed more physical action than conceptual and perceptual actions were relaxed as their alpha-band power activity of EEG signal was high.
Fairclough [144] reviews the literature related to the development of psychophysiological computing to innovate HCI and concluded that the psychophysiological measures have great potential to improve HCI, but the complex issues need to be fully tackled. Based on the literature review, we found that GSR/EDA is best suited to record arousal and mental efforts, HR is equipped to measure the arousal in emotion, likeability, and attention. HRV, EMG and respiration is mostly used for emotional state estimation. BVP is used for evaluating relaxation and facial input is applied to recognize emotions from face expression. EEG signal is widely used to detect emotions, frustration, and mental effort.
5. Conclusions
This paper presents a review of methods and measurements that are currently used in psychophysiological analysis studies to measure cognitive or mental states. There are various methods that can estimate the user’s brain states but the focus of this paper is on psycho-physiological signal analysis based cognitive state estimation. By reviewing the literature, we contribute to highlight the key parameters used to estimate the mental states and identify their advantages and limitations from an HCI perspective. In particular, there are various studies that showed the effectiveness of psychophysiological measures in indexing emotional and cognitive response of the user when interacting with HCI. However, the fast-growing field lacks acceptable theories and background research. The major findings are given below:
- The interaction time increases significantly when an assistance is provided.
- Auditory and visual stimuli are the best ways to elicit emotions in a controlled experimental settings.
- Violent games increase the cardiovascular activity compared to non-violent games.
- Psycho-physiological measures shows a strong correlation with the self-reported data.
- An increase in and -bands of EEG signals was observed during high intensity events.
- A decrease in stress level was found while interacting with a social robot.
- Psycho-physiological measure has the capability to mine the underlying fact that cannot be found using traditional methods.
- Ill-design web pages increase the stress level of the user.
- Virtual reality simulations can be used to study the relationship between brain responses and stress levels.
- Multimedia presentations such as video and image elicit positive emotion more than text presentation, which induces a higher cognitive load.
Our review reveals that previous studies did not stick to a standardized experimental setting and as a result, significant differences were observed in sample size, age, gender, experiences, sessions length, and types of participants. This nonuniform behavior makes it difficult to compare results of different settings. A basic step towards developing an acceptable theory is to test the previous findings with a more generic dataset and find answers to the questions on how existing theories perform in different modalities, social environment, and experiences. We can get an insight into determining the statistical requirements for experimental setup and design and have a better understanding of various modes of interaction.
Author Contributions
Conceptualization, M.Z.B. and M.K.; methodology, M.Z.B. and M.K.; software, M.Z.B.; validation, M.Z.B. and M.K.; formal analysis, M.Z.B. and M.K.; investigation, M.Z.B.; resources, M.Z.B. and M.K.; writing—original draft preparation, M.Z.B.; writing—review and editing, M.Z.B. and M.K.; visualization, M.Z.B.; supervision, M.K.; project administration, M.K.; funding acquisition, M.Z.B. and M.K.
Funding
This work was supported by Macquarie University postgraduate research scholarship fund.
Acknowledgments
We thank Charles Liu for his valued comments on the manuscript.
Conflicts of Interest
The authors declare no conflict of interest.
References
- Cacioppo, J.T.; Tassinary, L.G.; Berntson, G.G. Psychophysiological science: Interdisciplinary approaches to classic questions about the mind. In Handbook of Psychophysiology; Cambridge University Press: New York, NY, USA, 2007; pp. 1–16. [Google Scholar]
- Poels, K.; De Kort, Y.; Ijsselsteijn, W. It is always a lot of fun!: Exploring dimensions of digital game experience using focus group methodology. In Proceedings of the 2007 Conference on Future Play, Toronto, ON, Canada, 14–17 November 2007; ACM: New York, NY, USA, 2007; pp. 83–89. [Google Scholar]
- Jaimes, A.; Sebe, N. Multimodal human–computer interaction: A survey. Comput. Vis. Image Understand. 2007, 108, 116–134. [Google Scholar] [CrossRef]
- Maxwell, S.E.; Delaney, H.D. Designing Experiments and Analyzing Data: A Model Comparison Perspective; Psychology Press: New York, NY, USA, 2004; Volume 1. [Google Scholar]
- Field, A. Discovering Statistics Using IBM SPSS Statistics; Sage Publications: London, UK, 2013. [Google Scholar]
- Gratch, J.; Marsella, S. A domain-independent framework for modeling emotion. Cogn. Syst. Res. 2004, 5, 269–306. [Google Scholar] [CrossRef]
- Cacioppo, J.T.; Tassinary, L.G.; Berntson, G. Handbook of Psychophysiology; Cambridge University Press: New York, NY, USA, 2007. [Google Scholar]
- Bradley, M.M.; Lang, P.J. Measuring emotion: The self-assessment manikin and the semantic differential. J. Behav. Ther. Exp. Psychiatry 1994, 25, 49–59. [Google Scholar] [CrossRef]
- Glynn, L.M.; Christenfeld, N.; Gerin, W. The role of rumination in recovery from reactivity: Cardiovascular consequences of emotional states. Psychosom. Med. 2002, 64, 714–726. [Google Scholar] [PubMed]
- Ekman, P. Facial expression and emotion. Am. Psychol. 1993, 48, 384. [Google Scholar] [CrossRef] [PubMed]
- Holmqvist, K.; Nyström, M.; Andersson, R.; Dewhurst, R.; Jarodzka, H.; Van de Weijer, J. Eye Tracking: A Comprehensive Guide to Methods and Measures; OUP Oxford: Oxford, UK, 2011. [Google Scholar]
- McKee, M.G. Biofeedback: An overview in the context of heart-brain medicine. Clevel. Clin. J. Med. 2008, 75, S31. [Google Scholar] [CrossRef]
- Sterelny, K. Thought in a Hostile World: The Evolution of Human Cognition; Wiley-Blackwell: London, UK, 2003. [Google Scholar]
- Albulbul, A. Evaluating major electrode types for idle biological signal measurements for modern medical technology. Bioengineering 2016, 3, 20. [Google Scholar] [CrossRef] [PubMed]
- Zhang, X.; Li, J.; Liu, Y.; Zhang, Z.; Wang, Z.; Luo, D.; Zhou, X.; Zhu, M.; Salman, W.; Hu, G.; et al. Design of a fatigue detection system for high-speed trains based on driver vigilance using a wireless wearable EEG. Sensors 2017, 17, 486. [Google Scholar] [CrossRef] [PubMed]
- Reeves, W. System for Simultaneously Producing and Synchronizing Spectral Patterns of Heart Sounds and an ECG Signal. U.S. Patent 5,337,752, 16 August 1994. [Google Scholar]
- Data Acquisition, Loggers, Amplifiers, Transducers, Electrodes|BIOPAC. Available online: https://www.biopac.com/ (accessed on 21 May 2019).
- Lin, C.T.; Ko, L.W.; Chang, M.H.; Duann, J.R.; Chen, J.Y.; Su, T.P.; Jung, T.P. Review of wireless and wearable electroencephalogram systems and brain-computer interfaces—A mini-review. Gerontology 2010, 56, 112–119. [Google Scholar] [CrossRef] [PubMed]
- Scherr, D.; Dalal, D.; Henrikson, C.A.; Spragg, D.D.; Berger, R.D.; Calkins, H.; Cheng, A. Prospective comparison of the diagnostic utility of a standard event monitor versus a “leadless” portable ECG monitor in the evaluation of patients with palpitations. J. Interv. Card. Electrophysiol. 2008, 22, 39–44. [Google Scholar] [CrossRef]
- Jabaudon, D.; Sztajzel, J.; Sievert, K.; Landis, T.; Sztajzel, R. Usefulness of ambulatory 7-day ECG monitoring for the detection of atrial fibrillation and flutter after acute stroke and transient ischemic attack. Stroke 2004, 35, 1647–1651. [Google Scholar] [CrossRef] [PubMed]
- Park, C.; Chou, P.H.; Bai, Y.; Matthews, R.; Hibbs, A. An ultra-wearable, wireless, low power ECG monitoring system. In Proceedings of the 2006 IEEE Biomedical Circuits and Systems Conference, London, UK, 29 November–1 December 2006; pp. 241–244. [Google Scholar]
- Fiolet, E. NeuroSky MindWave Brings Brain-Computer Interface to Education. Available online: https://www.ubergizmo.com/2011/03/neurosky-mindwave/ (accessed on 21 May 2019).
- Grozea, C.; Voinescu, C.D.; Fazli, S. Bristle-sensors—Low-cost flexible passive dry EEG electrodes for neurofeedback and BCI applications. J. Neural Eng. 2011, 8, 025008. [Google Scholar] [CrossRef] [PubMed]
- Emotiv, E. Neuroheadset. 2012. Available online: https://www.emotiv.com/ (accessed on 23 April 2019).
- Hunter, D.B.; McCarraher, K.B.; Fratto, K.P.; Brueggman, R.M.; Stenstrom, T.J.; Gustafson, H.I., Jr. Headset for EEG Measurements. U.S. Patent 6,154,669, 28 November 2000. [Google Scholar]
- Amores, J.; Benavides, X.; Maes, P. Psychicvr: Increasing mindfulness by using virtual reality and brain computer interfaces. In Proceedings of the 2016 CHI Conference Extended Abstracts on Human Factors in Computing Systems, San Jose, CA, USA, 7–12 May 2016; p. 2. [Google Scholar]
- Burton, D. Vigilance Monitoring System. U.S. Patent 6,575,902, 10 Junuary 2003. [Google Scholar]
- Alam, M.; Azad, A. Development of biomedical data acquisition system in Hard Real-Time Linux environment. In Proceedings of the 2012 International Conference on Biomedical Engineering (ICoBE), Penang, Malaysia, 27–28 February 2012; pp. 436–440. [Google Scholar]
- Wong, C.; Zhang, Z.Q.; Lo, B.; Yang, G.Z. Wearable sensing for solid biomechanics: A review. IEEE Sens. J. 2015, 15, 2747–2760. [Google Scholar]
- Ishimaru, S.; Kunze, K.; Uema, Y.; Kise, K.; Inami, M.; Tanaka, K. Smarter eyewear: Using commercial EOG glasses for activity recognition. In Proceedings of the 2014 ACM International Joint Conference on Pervasive and Ubiquitous Computing: Adjunct Publication, Seattle, WA, USA, 13–17 September 2014; pp. 239–242. [Google Scholar]
- Eye Tracking Solutions by SMI. Available online: https://www.smivision.com/ (accessed on 21 May 2019).
- Garbarino, M.; Lai, M.; Bender, D.; Picard, R.W.; Tognetti, S. Empatica E3—A wearable wireless multi-sensor device for real-time computerized biofeedback and data acquisition. In Proceedings of the 2014 EAI 4th International Conference on Wireless Mobile Communication and Healthcare (Mobihealth), Athens, Greece, 3–5 November 2014; pp. 39–42. [Google Scholar]
- Burns, A.; Greene, B.R.; McGrath, M.J.; O’Shea, T.J.; Kuris, B.; Ayer, S.M.; Stroiescu, F.; Cionca, V. SHIMMER™—A wireless sensor platform for noninvasive biomedical research. IEEE Sens. J. 2010, 10, 1527–1534. [Google Scholar] [CrossRef]
- Panigrahy, S.K.; Jena, S.K.; Turuk, A.K. Study and Analysis of Human Stress Detection using Galvanic Skin Response (GSR) Sensor inWired and Wireless Environments. Res. J. Pharmacy Technol. 2017, 10, 545–550. [Google Scholar] [CrossRef]
- McKenzie, J.; Osgood, D. Validation of a new telemetric core temperature monitor. J. Ther. Biol. 2004, 29, 605–611. [Google Scholar] [CrossRef]
- Bonarini, A.; Matteucci, M.; Tognetti, S. Chest expansion reconstruction from respiration sound by using artificial neural networks. In Proceedings of the 4th IET International Conference on Advances in Medical, Signal and Information Processing—MEDSIP 2008, Santa Margherita Ligure, Italy, 14–16 July 2008. [Google Scholar]
- Jones, V.; Van Halteren, A.; Dokovsky, N.; Koprinkov, G.; Peuscher, J.; Bults, R.; Konstantas, D.; Herzog, R. Mobihealth: Mobile services for health professionals. In M-Health; Springer: Boston, MA, USA, 2006; pp. 237–246. [Google Scholar]
- McSharry, P.E.; Clifford, G.D.; Tarassenko, L.; Smith, L.A. A dynamical model for generating synthetic electrocardiogram signals. IEEE Trans. Biomed. Eng. 2003, 50, 289–294. [Google Scholar] [CrossRef] [PubMed]
- Allen, J. Photoplethysmography and its application in clinical physiological measurement. Physiol. Meas. 2007, 28, R1. [Google Scholar] [CrossRef]
- Barreto, A.; Zhai, J.; Adjouadi, M. Non-intrusive physiological monitoring for automated stress detection in human-computer interaction. In International Workshop on Human-Computer Interaction; Springer: Berlin/Heidelberg, Germany, 2007; pp. 29–38. [Google Scholar]
- Healey, J. Physiological sensing of emotion. In The Oxford Handbook of Affective Computing; Oxford University Press: Oxford, UK, 2014; pp. 204–216. [Google Scholar]
- Berntson, G.G. and interpretive caveats. Psychophysiology 1997, 34, 623–648. [Google Scholar] [CrossRef]
- van Ravenswaaij-Arts, C.M.; Kollee, L.A.; Hopman, J.C.; Stoelinga, G.B.; van Geijn, H.P. Heart rate variability. Ann. Internal Med. 1993, 118, 436–447. [Google Scholar] [CrossRef]
- Rowe, D.W.; Sibert, J.; Irwin, D. Heart rate variability: Indicator of user state as an aid to human-computer interaction. In Proceedings of the SIGCHI Conference on Human Factors in Computing Systems, Los Angeles, CA, USA, 18–23 April 1998; ACM Press/Addison-Wesley Publishing Co.: New York, NY, USA, 1998; pp. 480–487. [Google Scholar]
- Akselrod, S.; Gordon, D.; Ubel, F.A.; Shannon, D.C.; Berger, A.; Cohen, R.J. Power spectrum analysis of heart rate fluctuation: a quantitative probe of beat-to-beat cardiovascular control. Science 1981, 213, 220–222. [Google Scholar] [CrossRef] [PubMed]
- Itoh, H.; Takeda, K.; Nakamura, K.; Fujita, H.; Uchida, A.; Kuwahara, T.; Takenaka, K.; Tanaka, M.; Nakata, T.; Sasaki, S.; et al. Young borderline hypertensives are hyperreactive to mental arithmetic stress: Spectral analysis of RR intervals. J. Auton. Nerv. Syst. 1995, 54, 155–162. [Google Scholar] [CrossRef]
- Cacioppo, J.T.; Berntson, G.G.; Larsen, J.T.; Poehlmann, K.M.; Ito, T.A. The psychophysiology of emotion. In Handbook of Emotions; Guilford Press: New York, NY, USA, 1993; pp. 119–142. [Google Scholar]
- Jung, C.G. Studies in Word-Association; Taylor & Francis: Abingdon, UK, 1969. [Google Scholar]
- Marston, W.M. The Lie Detector Test; American Polygraph Association: Severna Park, MD, USA, 1989. [Google Scholar]
- Boucsein, W. Electrodermal Activity; Springer Science & Business Media: New York, NY, USA, 2012. [Google Scholar]
- Healey, J. Gsr sock: A new e-textile sensor prototype. In Proceedings of the 2011 15th Annual International Symposium on Wearable Computers, San Francisco, CA, USA, 12–15 June 2011; pp. 113–114. [Google Scholar]
- Picard, R.W.; Healey, J. Affective wearables. Pers. Technol. 1997, 1, 231–240. [Google Scholar] [CrossRef]
- Healey, J. Recording affect in the field: Towards methods and metrics for improving ground truth labels. In Proceedings of the International Conference on Affective Computing and Intelligent Interaction, Memphis, TN, USA, 9–12 October 2011; Springer: Berlin/Heidelberg, Germany, 2011; pp. 107–116. [Google Scholar]
- Coan, J.A.; Allen, J.J. Frontal EEG asymmetry as a moderator and mediator of emotion. Biol. Psychol. 2004, 67, 7–50. [Google Scholar] [CrossRef] [PubMed]
- Baig, M.Z.; Javed, E.; Ayaz, Y.; Afzal, W.; Gillani, S.O.; Naveed, M.; Jamil, M. Classification of left/right hand movement from EEG signal by intelligent algorithms. In Proceedings of the 2014 IEEE Symposium on Computer Applications and Industrial Electronics (ISCAIE), Penang, Malaysia, 7–8 April 2014; pp. 163–168. [Google Scholar]
- Levinthal, C.F. Introduction to Physiological Psychology; Prentice-Hall, Inc.: Upper Saddle River, NJ, USA, 1990. [Google Scholar]
- Baig, M.Z.; Aslam, N.; Shum, H.P.; Zhang, L. Differential evolution algorithm as a tool for optimal feature subset selection in motor imagery EEG. Expert Syst. Appl. 2017, 90, 184–195. [Google Scholar] [CrossRef]
- Spapé, M.M.; Filetti, M.; Eugster, M.J.; Jacucci, G.; Ravaja, N. Human computer interaction meets psychophysiology: A critical perspective. In Proceedings of the International Workshop on Symbiotic Interaction, Berlin, Germany, 7–8 October 2015; Springer: Berlin/Heidelberg, Germany, 2015; pp. 145–158. [Google Scholar]
- Ganglbauer, E.; Schrammel, J.; Schwarz, S.; Tscheligi, M. Applying Psychophysiological Methods for Measuring User Experience: Possibilities, Challenges and Feasibility. In Workshop on User Experience Evaluation Methods in Product Development; CiteSeerX: University Park, PA, USA, 2009. [Google Scholar]
- Horlings, R.; Datcu, D.; Rothkrantz, L.J. Emotion recognition using brain activity. In Proceedings of the 9th International Conference on Computer Systems and Technologies and Workshop for PhD Students in Computing, Gabrovo, Bulgaria, 12–13 June 2008; p. 6. [Google Scholar]
- Ekman, P.E.; Davidson, R.J. The Nature of Emotion: Fundamental Questions; Oxford University Press: Oxford, UK, 1994. [Google Scholar]
- Russel, J.A.; Weiss, A.; Mendelsohn, G.A. Affect grid: A single-item scale of pleasure and arousal. J. Pers. Soc. Psychol. 1989, 57, 493–502. [Google Scholar] [CrossRef]
- Lang, P.J. The emotion probe: Studies of motivation and attention. Am. Psychol. 1995, 50, 372. [Google Scholar] [CrossRef]
- Lang, P.J.; Bradley, M.M.; Cuthbert, B.N. International Affective Picture System (IAPS): Technical Manual and Affective Ratings; NIMH Center for the Study of Emotion and Attention: Gainesville, FL, USA, 1997; pp. 39–58. [Google Scholar]
- Partala, T.; Surakka, V. The effects of affective interventions in human–computer interaction. Interact. Comput. 2004, 16, 295–309. [Google Scholar] [CrossRef]
- Norman, D. Emotion & design: Attractive things work better. Interactions 2002, 9, 36–42. [Google Scholar]
- Haag, A.; Goronzy, S.; Schaich, P.; Williams, J. Emotion recognition using bio-sensors: First steps towards an automatic system. In Proceedings of the Tutorial and Research Workshop on Affective Dialogue Systems, Kloster Irsee, Germany, 14–16 June 2004; Springer: Berlin/Heidelberg, Germany, 2004; pp. 36–48. [Google Scholar]
- Klein, J.; Moon, Y.; Picard, R.W. This computer responds to user frustration: Theory, design, and results. Interact. Comput. 2002, 14, 119–140. [Google Scholar] [CrossRef]
- Partala, T.; Surakka, V. Pupil size variation as an indication of affective processing. Int. J. Hum.-Comput. Stud. 2003, 59, 185–198. [Google Scholar] [CrossRef]
- Frijda, N.H. The Emotions: Studies in Emotion and Social Interaction; Cambridge University Press: Cambridge, UK, 1986. [Google Scholar]
- Mandryk, R.L.; Atkins, M.S. A fuzzy physiological approach for continuously modeling emotion during interaction with play technologies. Int. J. Hum.-Comput. Stud. 2007, 65, 329–347. [Google Scholar] [CrossRef]
- Juma, L. The Role of Secondary Emotions in Action Selection and Its Effects on the Believability of a Character. Master’s Thesis, Aalborg University Copenhagen, København, Denmark, 2008. [Google Scholar]
- Costa, T.; Rognoni, E.; Galati, D. EEG phase synchronization during emotional response to positive and negative film stimuli. Neurosci. Lett. 2006, 406, 159–164. [Google Scholar] [CrossRef] [PubMed]
- Li, M.; Lu, B.L. Emotion classification based on gamma-band EEG. In Proceedings of the Annual International Conference of the IEEE Engineering in Medicine and Biology Society, 2009 (EMBC 2009), Minneapolis, MN, USA, 3–6 September 2009; pp. 1223–1226. [Google Scholar]
- Wang, X.W.; Nie, D.; Lu, B.L. EEG-based emotion recognition using frequency domain features and support vector machines. In Proceedings of the International Conference on Neural Information Processing, Shanghai, China, 13–17 November 2011; Springer: Berlin/Heidelberg, Germany, 2011; pp. 734–743. [Google Scholar]
- Thompson, T.; Steffert, T.; Ros, T.; Leach, J.; Gruzelier, J. EEG applications for sport and performance. Methods 2008, 45, 279–288. [Google Scholar] [CrossRef] [PubMed]
- Nakasone, A.; Prendinger, H.; Ishizuka, M. Emotion recognition from electromyography and skin conductance. In Proceedings of the 5th International Workshop on Biosignal Interpretation, Tokyo, Japan, 6–8 September 2005; pp. 219–222. [Google Scholar]
- Khair, N.M.; Yaacob, S.; Hariharan, M.; Basah, S.N. A study of human emotional: Review. In Proceedings of the 2012 International Conference on Biomedical Engineering (ICoBE), Penang, Malaysia, 27–28 February 2012; pp. 393–399. [Google Scholar] [CrossRef]
- Boone, R.T.; Cunningham, J.G. Children’s expression of emotional meaning in music through expressive body movement. J. Nonverbal Behav. 2001, 25, 21–41. [Google Scholar] [CrossRef]
- Zhou, F.; Qu, X.; Jiao, J.R.; Helander, M.G. Emotion prediction from physiological signals: A comparison study between visual and auditory elicitors. Interact. Comput. 2014, 26, 285–302. [Google Scholar] [CrossRef]
- Mehta, D.; Siddiqui, M.; Javaid, A. Facial emotion recognition: A survey and real-world user experiences in mixed reality. Sensors 2018, 18, 416. [Google Scholar] [CrossRef]
- Soleymani, M.; Lichtenauer, J.; Pun, T.; Pantic, M. A multimodal database for affect recognition and implicit tagging. IEEE Trans. Affect. Comput. 2012, 3, 42–55. [Google Scholar] [CrossRef]
- Abadi, M.K.; Subramanian, R.; Kia, S.M.; Avesani, P.; Patras, I.; Sebe, N. DECAF: MEG-Based Multimodal Database for Decoding Affective Physiological Responses. IEEE Trans. Affect. Comput. 2015, 6, 209–222. [Google Scholar] [CrossRef]
- Koelstra, S.; Muhl, C.; Soleymani, M.; Lee, J.S.; Yazdani, A.; Ebrahimi, T.; Pun, T.; Nijholt, A.; Patras, I. Deap: A database for emotion analysis; using physiological signals. IEEE Trans. Affect. Comput. 2012, 3, 18–31. [Google Scholar] [CrossRef]
- Zheng, W.L.; Lu, B.L. Investigating critical frequency bands and channels for EEG-based emotion recognition with deep neural networks. IEEE Trans. Auton. Ment. Dev. 2015, 7, 162–175. [Google Scholar] [CrossRef]
- Perrin, A.F.N.M.; Xu, H.; Kroupi, E.; Řeřábek, M.; Ebrahimi, T. Multimodal dataset for assessment of quality of experience in immersive multimedia. In Proceedings of the 23rd ACM international conference on Multimedia, Brisbane, Australia, 26–30 October 2015; pp. 1007–1010. [Google Scholar]
- Perrin, A.F.; Řeřábek, M.; Ebrahimi, T. Towards prediction of Sense of Presence in immersive audiovisual communications. Electron. Imaging 2016, 2016, 1–8. [Google Scholar] [CrossRef] [Green Version]
- Ruohonen, J.; Hyrynsalmi, S. Evaluating the use of internet search volumes for time series modeling of sales in the video game industry. Electron. Mark. 2017, 27, 351–370. [Google Scholar] [CrossRef]
- Bernhaupt, R.; Mueller, F.F. Game User Experience Evaluation. In Proceedings of the 2016 CHI Conference Extended Abstracts on Human Factors in Computing Systems, San Jose, CA, USA, 7–12 May 2016; pp. 940–943. [Google Scholar]
- BERNHAUPT, R. Game User Experience Evaluation; Springer: Berlin/Heidelberg, Germany, 2016. [Google Scholar]
- Kivikangas, J.M.; Chanel, G.; Cowley, B.; Ekman, I.; Salminen, M.; Järvelä, S.; Ravaja, N. A review of the use of psychophysiological methods in game research. J. Gaming Virtual Worlds 2011, 3, 181–199. [Google Scholar] [CrossRef]
- Ijsselsteijn, W.; van den Hoogen, W.; Klimmt, C.; de Kort, Y.; Lindley, C.; Mathiak, K.; Poels, K.; Ravaja, N.; Turpeinen, M.; Vorderer, P. Measuring the experience of digital game enjoyment. In Proceedings of the 6th International Conference on Methods and Techniques in Behavioral Research, Maastricht, The Netherlands, 26–29 August 2008; pp. 88–89. [Google Scholar]
- Drachen, A.; Nacke, L.E.; Yannakakis, G.; Pedersen, A.L. Correlation between heart rate, electrodermal activity and player experience in first-person shooter games. In Proceedings of the 5th ACM SIGGRAPH Symposium on Video Games, Los Angeles, CA, USA, 28–29 July 2010; pp. 49–54. [Google Scholar]
- Ballard, M.E.; Wiest, J.R. Mortal Kombat (tm): The Effects of Violent Videogame Play on Males’ Hostility and Cardiovascular Responding. J. Appl. Soc. Psychol. 1996, 26, 717–730. [Google Scholar] [CrossRef]
- Drachen, A.; Nacke, L.E.; Yannakakis, G.N.; Pedersen, A.L. Psychophysiological Correlations with Gameplay Experience Dimensions. arXiv 2010, arXiv:1004.0243. [Google Scholar]
- Yannakakis, G.N.; Hallam, J.; Lund, H.H. Entertainment capture through heart rate activity in physical interactive playgrounds. User Model. User-Adapt. Interact. 2008, 18, 207–243. [Google Scholar] [CrossRef]
- Pedersen, C.; Togelius, J.; Yannakakis, G.N. Modeling player experience in Super Mario Bros. In Proceedings of the 2009 IEEE Symposium on Computational Intelligence and Games, Milano, Italy, 7–10 September 2009; pp. 132–139. [Google Scholar]
- McMahan, T.; Parberry, I.; Parsons, T.D. Modality specific assessment of video game player’s experience using the Emotiv. Entertain. Comput. 2015, 7, 1–6. [Google Scholar] [CrossRef]
- Nacke, L.E.; Grimshaw, M.N.; Lindley, C.A. More than a feeling: Measurement of sonic user experience and psychophysiology in a first-person shooter game. Interact. Comput. 2010, 22, 336–343. [Google Scholar] [CrossRef]
- Cowley, B.; Kosunen, I.; Lankoski, P.; Kivikangas, J.M.; Järvelä, S.; Ekman, I.; Kemppainen, J.; Ravaja, N. Experience assessment and design in the analysis of gameplay. Simul. Gaming 2014, 45, 41–69. [Google Scholar] [CrossRef]
- Stein, A.; Yotam, Y.; Puzis, R.; Shani, G.; Taieb-Maimon, M. EEG-triggered dynamic difficulty adjustment for multiplayer games. Entertain. Comput. 2018, 25, 14–25. [Google Scholar] [CrossRef]
- Drachen, A.; Canossa, A.; Yannakakis, G.N. Player modeling using self-organization in Tomb Raider: Underworld. In Proceedings of the 2009 IEEE Symposium on Computational Intelligence and Games, Milano, Italy, 7–10 September 2009; pp. 1–8. [Google Scholar]
- Togelius, J.; Nardi, R.D.; Lucas, S. Making Racing Fun through Player Modeling and Track Evolution. In Proceedings of the SAB’06 Workshop on Adaptive Approaches for Optimizing Player Satisfaction in Computer and Physical Games, Rome, Italy, 1 October 2006; pp. 61–70. [Google Scholar]
- Missura, O.; Gärtner, T. Player Modeling for Intelligent Difficulty Adjustment. In Proceedings of the 12th International Conference on Discovery Science (DS ’09), Porto, Portugal, 3–5 October 2009; pp. 197–211. [Google Scholar]
- Čertický, M.; Čertický, M.; Sinčák, P.; Magyar, G.; Vaščák, J.; Cavallo, F. Psychophysiological Indicators for Modeling User Experience in Interactive Digital Entertainment. Sensors 2019, 19, 989. [Google Scholar] [CrossRef]
- Lobel, A.; Gotsis, M.; Reynolds, E.; Annetta, M.; Engels, R.C.; Granic, I. Designing and Utilizing Biofeedback Games for Emotion Regulation: The Case of Nevermind. In Proceedings of the 2016 CHI Conference Extended Abstracts on Human Factors in Computing Systems, San Jose, CA, USA, 7–12 May 2016; pp. 1945–1951. [Google Scholar]
- Bethel, C.L.; Burke, J.L.; Murphy, R.R.; Salomon, K. Psychophysiological experimental design for use in human-robot interaction studies. In Proceedings of the 2007 International Symposium on Collaborative Technologies and Systems, Orlando, FL, USA, 25–25 May 2007; pp. 99–105. [Google Scholar]
- Itoh, K.; Miwa, H.; Nukariya, Y.; Zecca, M.; Takanobu, H.; Roccella, S.; Carrozza, M.C.; Dario, P.; Takanishi, A. Development of a bioinstrumentation system in the interaction between a human and a robot. In Proceedings of the 2006 IEEE/RSJ International Conference on Intelligent Robots and Systems, Beijing, China, 9–15 October 2006; pp. 2620–2625. [Google Scholar]
- Bekele, E.; Sarkar, N. Psychophysiological feedback for adaptive human–robot interaction (HRI). In Advances in Physiological Computing; Springer: Berlin/Heidelberg, Germany, 2014; pp. 141–167. [Google Scholar]
- Rani, P.; Sarkar, N. Making robots emotion-sensitive-preliminary experiments and results. In Proceedings of the IEEE International Workshop on Robot and Human Interactive Communication (ROMAN 2005), Nashville, TN, USA, 13–15 August 2005; pp. 1–6. [Google Scholar]
- Croft, D. Estimating intent for human-robot interaction. In Proceedings of the IEEE International Conference on Advanced Robotics, Coimbra, Portugal, 30 June–3 July 2003; pp. 810–815. [Google Scholar]
- Dehais, F.; Sisbot, E.A.; Alami, R.; Causse, M. Physiological and subjective evaluation of a human–robot object hand-over task. Appl. Ergon. 2011, 42, 785–791. [Google Scholar] [CrossRef] [PubMed]
- Paletta, L.; Dini, A.; Murko, C.; Yahyanejad, S.; Schwarz, M.; Lodron, G.; Ladstätter, S.; Paar, G.; Velik, R. Towards real-time probabilistic evaluation of situation awareness from human gaze in human-robot interaction. In Proceedings of the Companion of the 2017 ACM/IEEE International Conference on Human-Robot Interaction, Vienna, Austria, 6–9 March 2017; pp. 247–248. [Google Scholar]
- Podevijn, G.; O’grady, R.; Mathews, N.; Gilles, A.; Fantini-Hauwel, C.; Dorigo, M. Investigating the effect of increasing robot group sizes on the human psychophysiological state in the context of human–swarm interaction. Swarm Intell. 2016, 10, 193–210. [Google Scholar] [CrossRef]
- Swangnetr, M.; Kaber, D.B. Emotional state classification in patient–robot interaction using wavelet analysis and statistics-based feature selection. IEEE Trans. Hum.-Mach. Syst. 2013, 43, 63–75. [Google Scholar] [CrossRef]
- Kulic, D.; Croft, E. Anxiety detection during human-robot interaction. In Proceedings of the 2005 IEEE/RSJ International Conference on Intelligent Robots and Systems, Edmonton, AB, Canada, 2–6 August 2005; pp. 616–621. [Google Scholar]
- Kulić, D.; Croft, E. Physiological and subjective responses to articulated robot motion. Robotica 2007, 25, 13–27. [Google Scholar] [CrossRef]
- Cortellessa, G.; Fracasso, F.; Sorrentino, A.; Orlandini, A.; Bernardi, G.; Coraci, L.; De Benedictis, R.; Cesta, A. ROBIN, a telepresence robot to support older users monitoring and social inclusion: Development and evaluation. Telemed. e-Health 2018, 24, 145–154. [Google Scholar] [CrossRef]
- Tiberio, L.; Cesta, A.; Cortellessa, G.; Padua, L.; Pellegrino, A.R. Assessing affective response of older users to a telepresence robot using a combination of psychophysiological measures. In Proceedings of the 2012 IEEE RO-MAN: The 21st IEEE International Symposium on Robot and Human Interactive Communication, Paris, France, 9–13 September 2012; pp. 833–838. [Google Scholar]
- Goljar, N.; Javh, M.; Poje, J.; Ocepek, J.; Novak, D.; Ziherl, J.; Olenšek, A.; Mihelj, M.; Munih, M. Psychophysiological responses to robot training in different recovery phases after stroke. In Proceedings of the 2011 IEEE International Conference on Rehabilitation Robotic, Zurich, Switzerland, 29 June–1 July 2011; pp. 1–6. [Google Scholar]
- Ting, C.H.; Mahfouf, M.; Nassef, A.; Linkens, D.A.; Panoutsos, G.; Nickel, P.; Roberts, A.C.; Hockey, G.R.J. Real-time adaptive automation system based on identification of operator functional state in simulated process control operations. IEEE Trans. Syst. Man Cybern. Part A Syst. Hum. 2010, 40, 251–262. [Google Scholar] [CrossRef]
- Munih, M.; Mihelj, M. Psychophysiological responses during robot-assisted rehabilitation. In Rehabilitation Robotics; Elsevier: Amsterdam, The Netherlands, 2018; pp. 305–317. [Google Scholar]
- Zhang, L.; Wade, J.; Bian, D.; Fan, J.; Swanson, A.; Weitlauf, A.; Warren, Z.; Sarkar, N. Multimodal Fusion for Cognitive Load Measurement in an Adaptive Virtual Reality Driving Task for Autism Intervention. In Universal Access in Human-Computer Interaction. Access to Learning, Health and Well-Being: 9th International Conference, UAHCI 2015, Held as Part of HCI International 2015, Los Angeles, CA, USA, August 2–7, 2015, Proceedings, Part III; Antona, M., Stephanidis, C., Eds.; Springer International Publishing: Cham, Switzerland, 2015; pp. 709–720. [Google Scholar] [CrossRef]
- Yao, L.; Liu, Y.; Li, W.; Zhou, L.; Ge, Y.; Chai, J.; Sun, X. Using physiological measures to evaluate user experience of mobile applications. In Proceedings of the International Conference on Engineering Psychology and Cognitive Ergonomics, Heraklion, Crete, Greece, 22–27 June 2014; Springer: Berlin/Heidelberg, Germany, 2014; pp. 301–310. [Google Scholar]
- Kumar, N.; Kumar, J. Measurement of cognitive load in HCI systems using EEG power spectrum: an experimental study. Procedia Comput. Sci. 2016, 84, 70–78. [Google Scholar] [CrossRef]
- Baig, M.Z.; Kavakli, M. Analyzing Novice and Expert User’s Cognitive Load in using a Multi-Modal Interface System. In Proceedings of the 2018 26th International Conference on Systems Engineering (ICSEng), Sydney, Australia, 18–20 December 2018; pp. 1–7. [Google Scholar] [CrossRef]
- Puma, S.; Matton, N.; Paubel, P.V.; Raufaste, É.; El-Yagoubi, R. Using theta and alpha band power to assess cognitive workload in multitasking environments. Int. J. Psychophysiol. 2018, 123, 111–120. [Google Scholar] [CrossRef]
- Wilson, G.M. Psychophysiological indicators of the impact of media quality on users. In Proceedings of the CHI’01 extended abstracts on Human Factors in Computing Systems, Seattle, WA, USA, 31 March–5 April 2001; pp. 95–96. [Google Scholar]
- Ward, R.D.; Marsden, P.H. Physiological responses to different WEB page designs. Int. J. Hum.-Comput. Stud. 2003, 59, 199–212. [Google Scholar] [CrossRef]
- Bruun, A. It’s not Complicated: A Study of Non-Specialists Analyzing GSR Sensor Data to Detect UX Related Events. In Proceedings of the 10th Nordic Conference on Human-Computer Interaction, Oslo, Norway, 29 September–3 October 2018; pp. 170–183. [Google Scholar]
- Lin, T.; Omata, M.; Hu, W.; Imamiya, A. Do physiological data relate to traditional usability indexes? In Proceedings of the 17th Australia conference on Computer-Human Interaction: Citizens Online: Considerations for Today and the Future, Canberra, Australia, 21–25 November 2005; pp. 1–10. [Google Scholar]
- Meehan, M.; Insko, B.; Whitton, M.; Brooks, F.P., Jr. Physiological measures of presence in stressful virtual environments. In Proceedings of the 29th Annual Conference on Computer Graphics and Interactive Techniques, San Antonio, TX, USA, 23–26 July 2002; Volume 21, pp. 645–652. [Google Scholar]
- Gerě, I.; Jaušcvec, N. Multimedia: Differences in cognitive processes observed with EEG. Educ. Technol. Res. Dev. 1999, 47, 5–14. [Google Scholar] [CrossRef]
- Al Madi, N.S.; Khan, J.I. Measuring learning performance and cognitive activity during multimodal comprehension. In Proceedings of the 2016 7th International Conference on Information and Communication Systems (ICICS), Irbid, Jordan, 5–7 April 2016; pp. 50–55. [Google Scholar]
- Novak, D.; Mihelj, M.; Munih, M. Dual-task performance in multimodal human-computer interaction: A psychophysiological perspective. Multimed. Tools Appl. 2012, 56, 553–567. [Google Scholar] [CrossRef]
- Grassmann, M.; Vlemincx, E.; von Leupoldt, A.; Mittelstädt, J.M.; Van den Bergh, O. Respiratory changes in response to cognitive load: A systematic review. Neural Plast. 2016, 2016, 8146809. [Google Scholar] [CrossRef] [PubMed]
- Lee, S.; Matteson, A.; Hooshyar, D.; Kim, S.; Jung, J.; Nam, G.; Lim, H. Comparing Programming Language Comprehension between Novice and Expert Programmers Using EEG Analysis. In Proceedings of the 2016 IEEE 16th International Conference on Bioinformatics and Bioengineering (BIBE), Taichung, Taiwan, 31 October–2 November 2016; pp. 350–355. [Google Scholar]
- Ferreira, E.; Ferreira, D.; Kim, S.; Siirtola, P.; Röning, J.; Forlizzi, J.F.; Dey, A.K. Assessing real-time cognitive load based on psycho-physiological measures for younger and older adults. In Proceedings of the 2014 IEEE Symposium on Computational Intelligence, Cognitive Algorithms, Mind, and Brain (CCMB), Orlando, FL, USA, 9–12 December 2014; pp. 39–48. [Google Scholar]
- Liu, Y.; Ritchie, J.M.; Lim, T.; Kosmadoudi, Z.; Sivanathan, A.; Sung, R.C. A fuzzy psycho-physiological approach to enable the understanding of an engineer’s affect status during CAD activities. Comput.-Aided Des. 2014, 54, 19–38. [Google Scholar] [CrossRef]
- Nguyen, T.A.; Zeng, Y. A physiological study of relationship between designer’s mental effort and mental stress during conceptual design. Comput.-Aided Desi. 2014, 54, 3–18. [Google Scholar] [CrossRef]
- Nguyen, T.A.; Zeng, Y. Effects of stress and effort on self-rated reports in experimental study of design activities. J. Intell. Manuf. 2017, 28, 1609–1622. [Google Scholar] [CrossRef]
- Baig, M.Z.; Kavakli, M. Connectivity Analysis Using Functional Brain Networks to Evaluate Cognitive Activity during 3D Modelling. Brain Sci. 2019, 9. [Google Scholar] [CrossRef]
- Baig, M.Z.; Kavakli, M. EEG Signal Analysis in 3D Modelling to Identify Correlations Between Task Completion in Design User’s Cognitive Activities. In Neural Information Processing; Cheng, L., Leung, A.C.S., Ozawa, S., Eds.; Springer International Publishing: Cham, Switzerland, 2018; pp. 340–352. [Google Scholar]
- Fairclough, S.H. Fundamentals of physiological computing. Interact. Comput. 2009, 21, 133–145. [Google Scholar] [CrossRef]
Figure 1.
An R-R interval time series example.

Figure 2.
An example of a skin conductance signal.

Figure 3.
Arousal-Valence Space as described by Russel et al. [62].
Figure 3.
Arousal-Valence Space as described by Russel et al. [62].


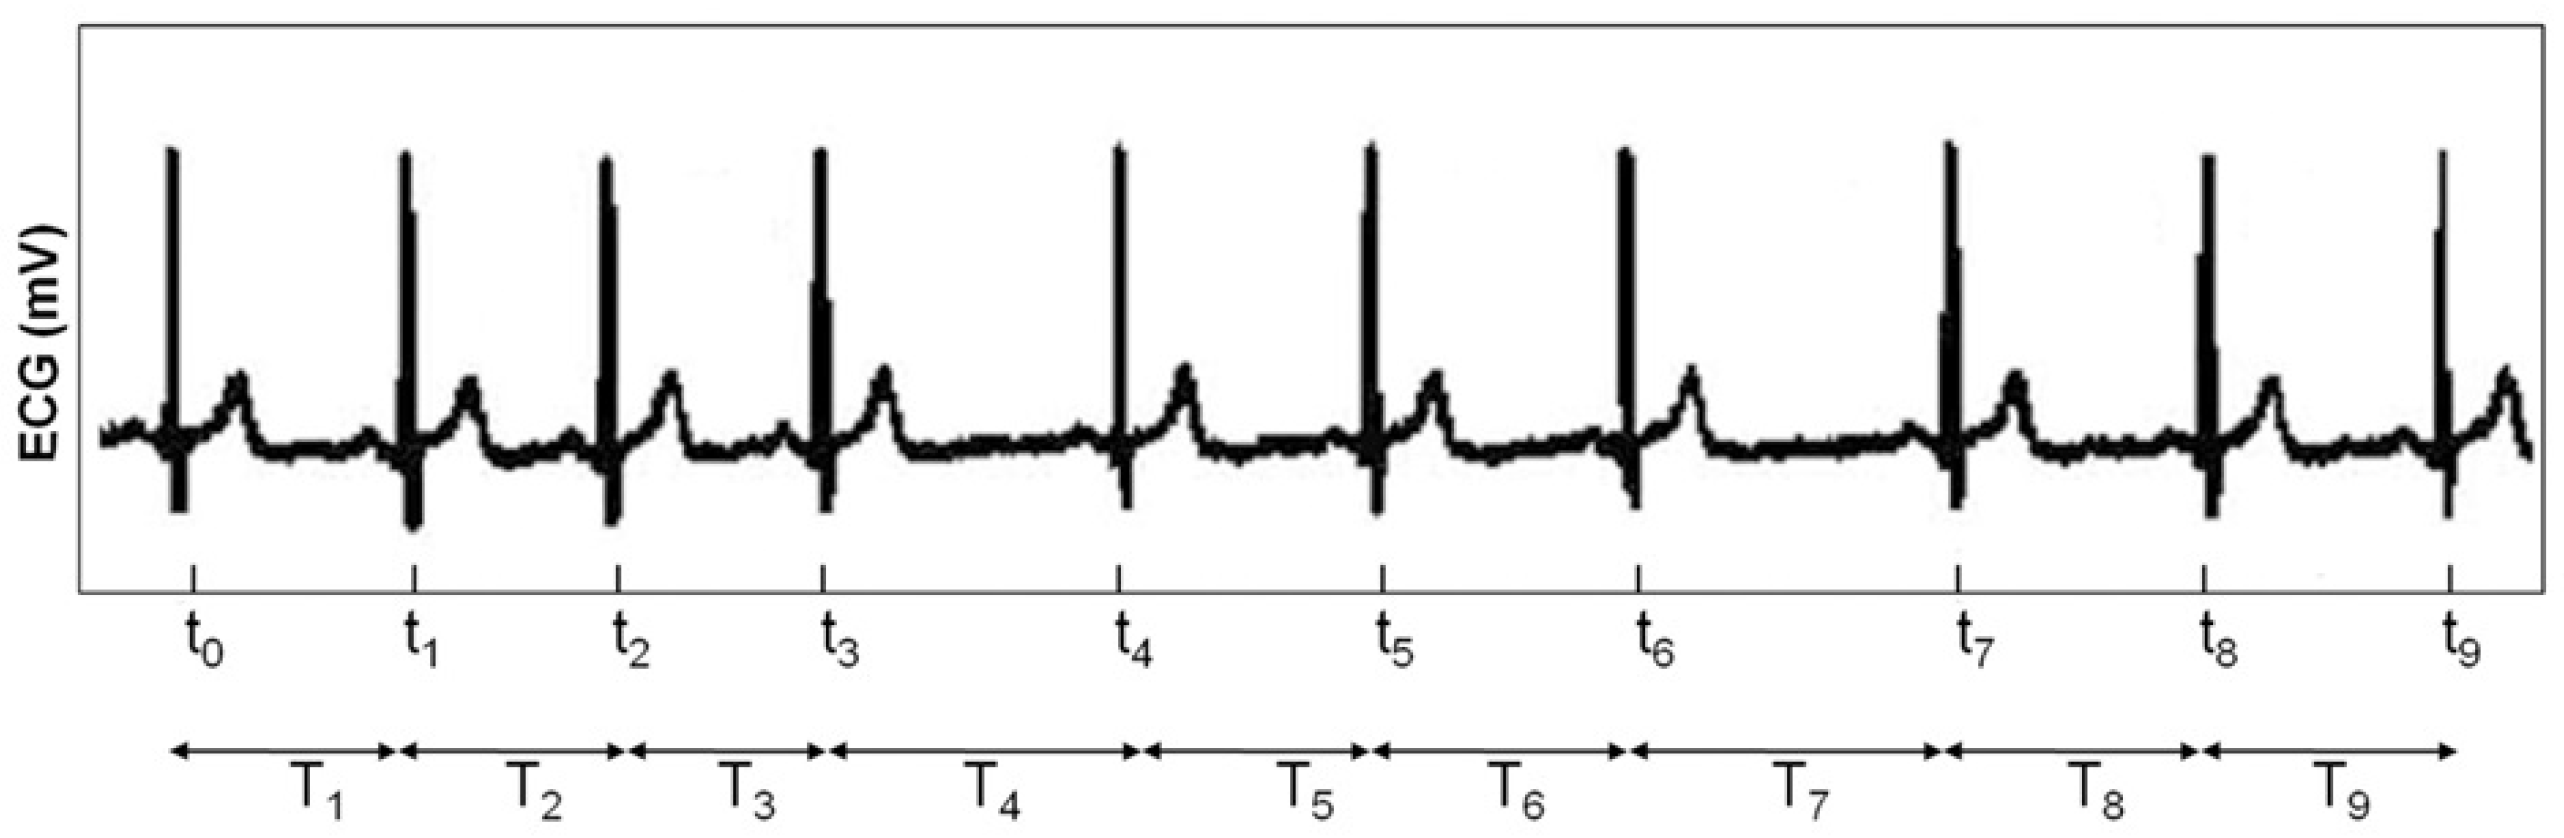
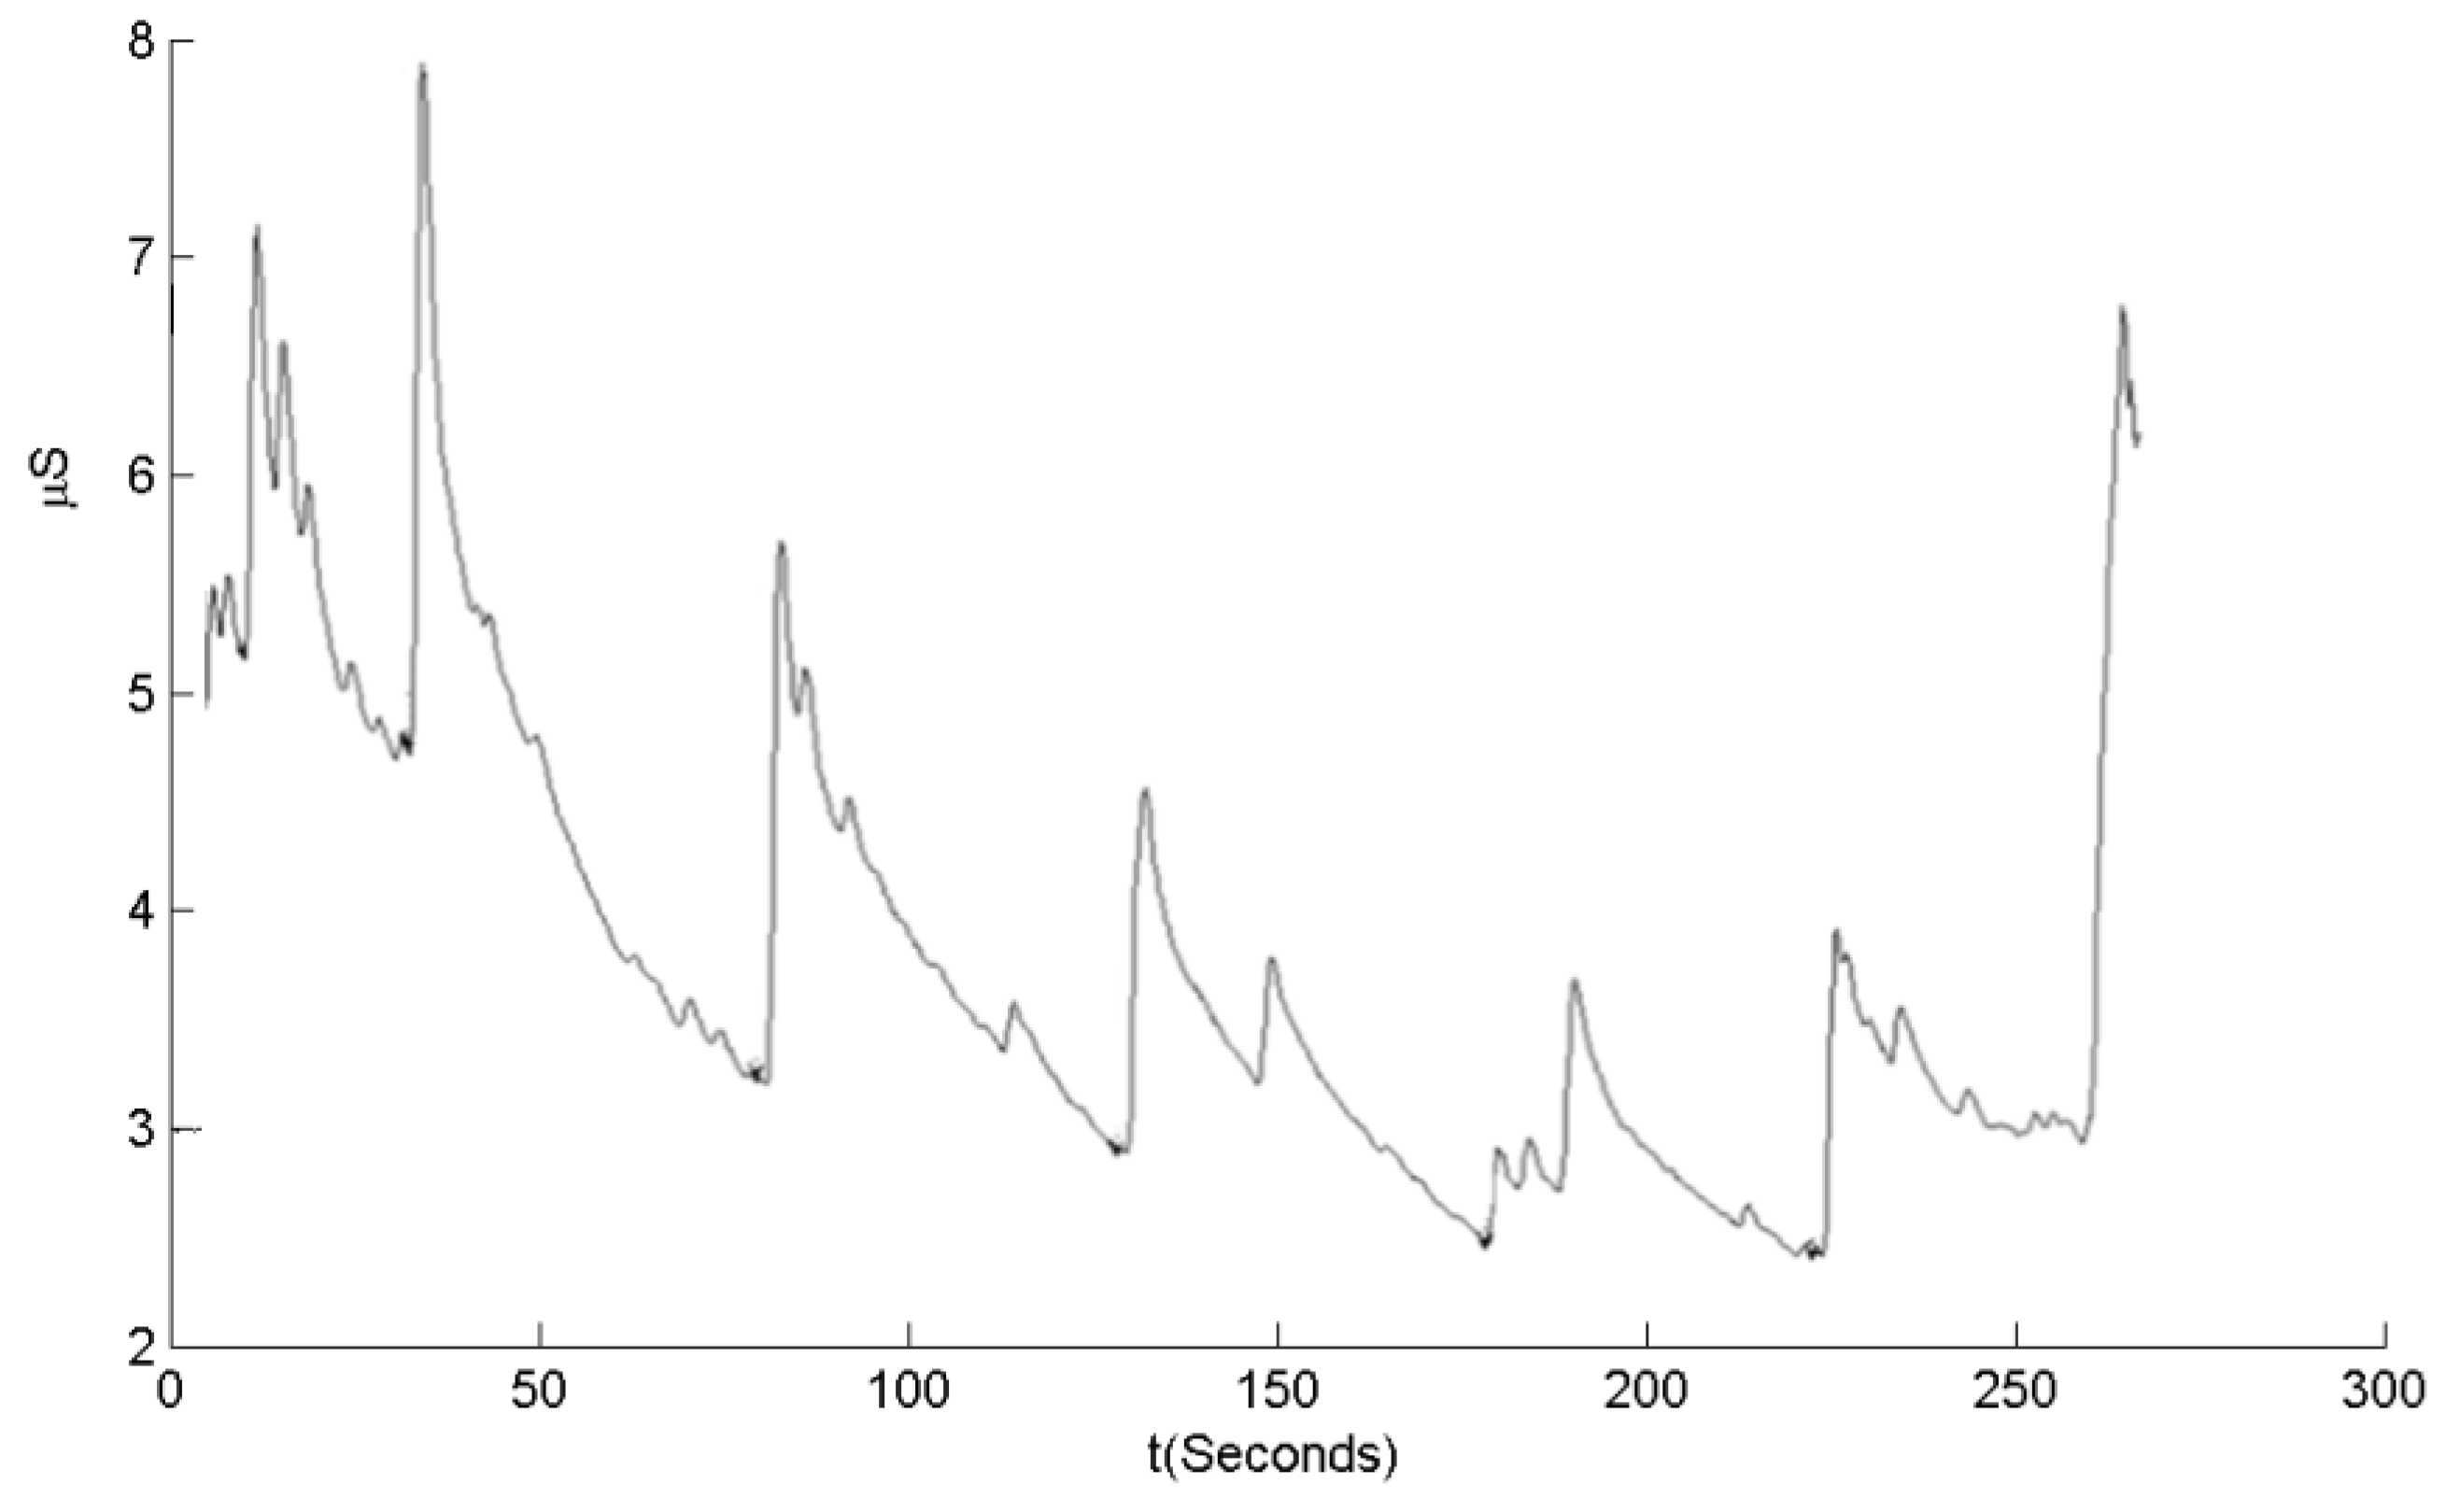
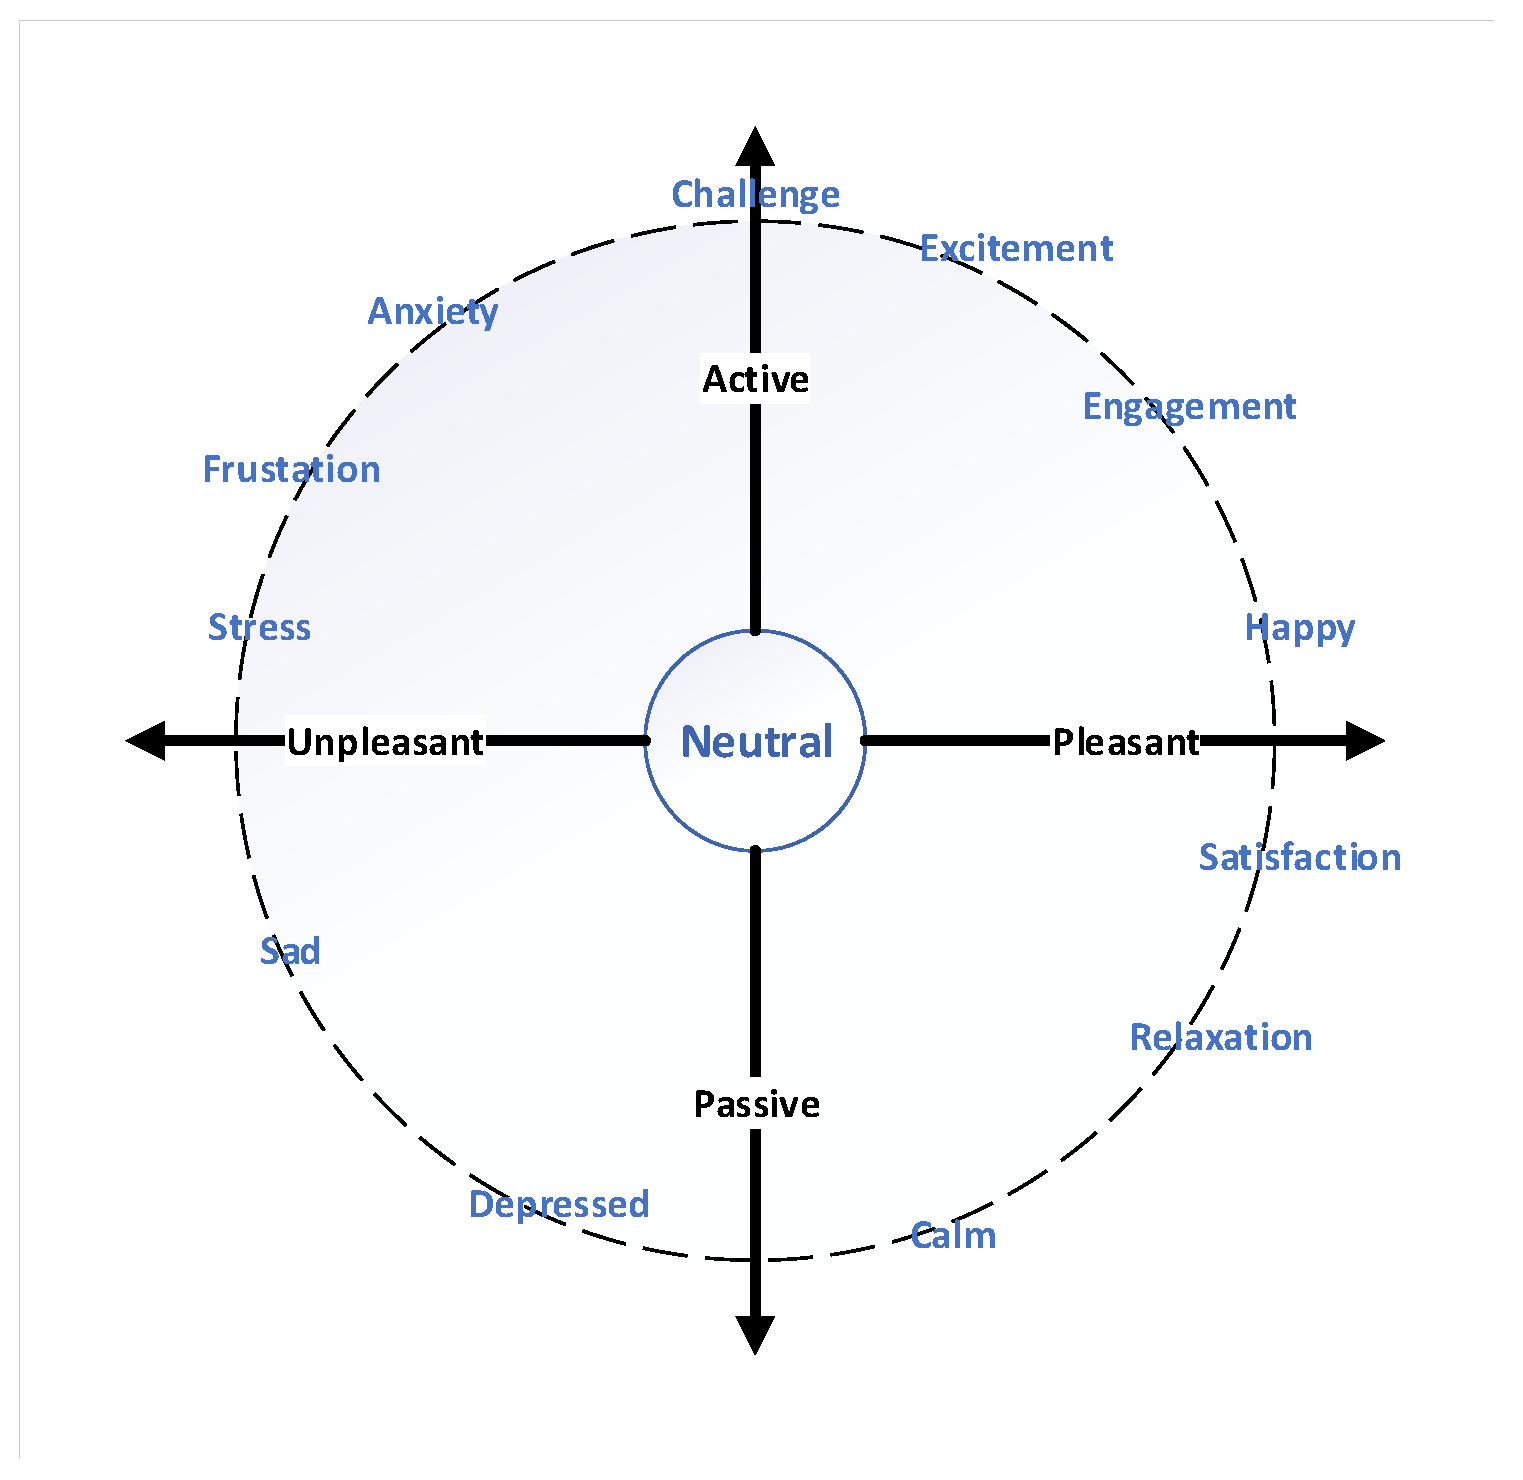
Table 1.
Commercially available psychophysiological signal measuring devices.
| Biofeedback Signals | Commercially Available Devices |
|---|---|
| ECG | Alivecor System [16], Biopac [17], EPI mini [18], Omron ECG [19], Ambulatory ECG [20], Quasar sensors [21] |
| EEG | Mindwave headset [22], Flex sensor [23], Emotiv Headset [24], Neurosky Headset [25], Muse headband [26] |
| EMG | Neuronode [27], Sx230 [28], Trigno mini sensor [29] |
| EOG | Google glass [30], SMI eye tracking glassess [31], ASL eye tracking glasses [11] |
| GSR | Empatica [32], Shimmer 3 [33], Grove-GSR [34] |
| ST | YSI 400 series temperature probe [35], TIDA-00824 by Texas Instrument |
| RR | SA9311M [36], TMSI respiration sensor [37] |
Table 2.
Relation of emotions to physiological responses.
| Emotion | Physiological Response |
|---|---|
| Pleasure and Sadness | low skin conductance and EMG, high heart rate |
| Anger | high skin conductance and EMG, flat and fast breathing |
| Joy | high skin conductance, EMG and heart rate, deep and slow breathing |
Table 3.
Summary of Publicly available datasets for emotion recognition (EDA: Electrodermal activity, GT: Gaze tracking, MEG: Magnetoencephalogram, EOG: Electrooculogram, EMG: Electromyography, RM: Respiration measurement, FT: Facial Tracking, ST: Skin temperature).
Table 3.
Summary of Publicly available datasets for emotion recognition (EDA: Electrodermal activity, GT: Gaze tracking, MEG: Magnetoencephalogram, EOG: Electrooculogram, EMG: Electromyography, RM: Respiration measurement, FT: Facial Tracking, ST: Skin temperature).
| Database | Year | No. of Subjects | Psycho-Physiological Signal | Task/Experiment |
|---|---|---|---|---|
| MAHNOB [82] | 2012 | 27 | EEG, ECG, EDA, GT, RM, FT, ST | 1st session: Emotional Videos, 2nd Session: Short Videos and Images |
| DECAF [83] | 2015 | 30 | EEG, ECG, MEG, EOG, EMG, FT | Affective Multimedia content (Movies and Music) |
| DEAP [84] | 2012 | 32 | EEG, FT | Watching Video |
| SEED [85] | 2015 | 15 | EEG, FT | Watching Video |
| Multi-modal Dataset [86] | 2015 | 20 | EEG, ECG, RM | Immersive Multimedia |
| AV communication [87] | 2016 | 20 | EEG, ECG, RM | Audiovisual Stimuli |
© 2019 by the authors. Licensee MDPI, Basel, Switzerland. This article is an open access article distributed under the terms and conditions of the Creative Commons Attribution (CC BY) license (http://creativecommons.org/licenses/by/4.0/).
Share and Cite
MDPI and ACS Style
Baig, M.Z.; Kavakli, M. A Survey on Psycho-Physiological Analysis & Measurement Methods in Multimodal Systems. Multimodal Technol. Interact. 2019, 3, 37. https://doi.org/10.3390/mti3020037
AMA Style
Baig MZ, Kavakli M. A Survey on Psycho-Physiological Analysis & Measurement Methods in Multimodal Systems. Multimodal Technologies and Interaction. 2019; 3(2):37. https://doi.org/10.3390/mti3020037
Chicago/Turabian StyleBaig, Muhammad Zeeshan, and Manolya Kavakli. 2019. "A Survey on Psycho-Physiological Analysis & Measurement Methods in Multimodal Systems" Multimodal Technologies and Interaction 3, no. 2: 37. https://doi.org/10.3390/mti3020037