1. Introduction
The mobile phone has become the world’s most pervasive and most widely used communication medium. For many around the world, the mobile phone is the only communication medium; worldwide there is some 1 billion fixed-line phones, 2.5 billion TV sets, 3 billion radios, and some 3 billion people using the internet, but over 7 billion mobile phones, more than half of them smartphones [
1]. But even in countries like the United States, people have started to spend more time on mobile apps than on watching television [
2].
Mobile apps have not only started to replace traditional communication technology, but have also started to replace human-to-human with human-machine communication (endowed with more or less artificial intelligence). Anybody who had to compete with the mobile phone of one’s communication partner at the dinner table for communicative attention can attest to this, and this is pervasive: 89% Americans used their phone during the most recent social gathering [
3].
Embracing traditional and new communication functions, digital convergence has converted the mobile phone into a true “polymedia” [
4] for “multimodal connectedness” [
5]. It essentially joins and complements previously different media. It provides a “media ecology” [
6], with the difference of being a single media platform. Despite both this recognition and the importance of the mobile phone in today’s communication landscape, to date related theoretical frameworks are still missing or mostly anecdotal and not statistically tested. The focus is set on specialized questions, which evades the bird’s eyed view required to capture the rich polymodal nature of the mobile phone.
This article presents a broad and statistically testable conceptual framework of the polymodal nature of the mobile phone in terms of how different user groups use it. For this, we work with an extensive dataset from the world’s second largest mobile market, India.
We monitored the complete mobile phone usage of 10,725 users from India during a one-month period and recorded 56,290,269 mobile app sessions for a total duration of 974,721 h of interactivity with 16,269 different mobile apps. We elaborate a theoretical framework that allows us to classify all used apps into five mediatic types. We study the technological medium embedded into the social environment of its users by collecting demographic (gender and age), social (marital status, education, occupation), and systems variables (price and screen size of the device). To strengthen this connection between the media and its social embedding, we work with both duration (extensity) and frequency (intensity) of mobile phone usage, since it has been shown that log data on both are complementary in their correlation with socioeconomic, demographic, and other behavioral traits [
7,
8]. We then explore multivariate relationships among these three main groups of variables: type of mediatic use; socio-demographic and technological characteristics; and usage ex- and intensity.
This being said, it is the declared goal of this study to provide a high-level overview and not to look deeply into any particular mediatic type or user group. Instead, we take advantage of our extensive dataset to deliver broad-based empirical evidence of the fact that the mobile phone is effectively used as a different medium by different user groups.
2. Theoretical Framework: Polymodal Media
In a classic case of what innovation theory calls a symbiotic merger of previously separated technological trajectories (e.g., [
9]), today’s mobile phones merges telecommunication, broadcasting, storage, and computation technologies. We follow the literature in the conjecture that a medium is best understood through both its different mediatic functionalities and its social adoption [
10,
11,
12].
The concept of media ecology embraces this approach. “The word ecology implies the study of environments: their structure, content, and impact on people” [
13] (p. 161). As first approximation, the concept of media ecology generalizes McLuhan’s “Understanding [of] Media: [as] The Extension of Man” [
6]. But—in contrast to other possible formulations like an ‘ecology of media’—it goes further and implies that the carrier is at the same time the environment: Media as environments, and environments as media. “We put the word ‘media’ in the front of the word ‘ecology’ to suggest that we were not simply interested in media, but in the ways in which the interaction between media and human beings give a culture” [
14] (p. 11). Concentrating on the final cultural transformations, media ecologists pursue a very holistic approach, and do not even “see any point in studying media unless one does so within a moral or ethical context” [
14] (p. 11).
Half a century later, media scholars renewed the call to “look at the entire range of media as a communicative environment” [
15] (p. 124), but felt the need for a new concept to “highlight the unprecedented plurality and proliferation of media… [and] chose ‘polymedia’ as a new term to describe the new emerging environment of proliferating communicative opportunities” [
16] (p. 125). Like its predecessor, it pursues a very comprehensive understanding of the relation between the social and the technological, with a focus on the emotional, behavioral, and moral relationships that emerge from this interaction [
4].
Several concepts have been developed in parallel. “The concept of multimodal connectedness is introduced to examine the whole range of ICTs [information and communication technologies that] complement each other” [
5] (p. 75). It “can be defined as the various modalities through which people maintain their connections with each other in everyday life” [
5] (p. 79). The concept focuses on a headcount of the number of communication channels used for social interaction among people [
17,
18]. The slightly broader concept of “media manifold” [
19] (p. 220) goes beyond the focus of social channels and also considers broadcasting media and other apps. Like multimodal connectedness it focuses on the number of different media used, in this case accounted for by the dimensionality of the figurative manifold.
In an effort to both honor and build on this previous work that spans half a century, we introduce a related, but slightly different concept for our purposes: Polymodal media. It is defined as the multiple modalities with which a single media can be used. In agreement with the literature on media ecology and polymediality, it recognizes that the study of media cannot be done in isolation from its social environment. However, we do not go as far as studying the resulting emotional-, ethical-, and moral effects and relationships that emerge from the interaction, which are the fundamental pursuit of those approaches. For one, theoretically this rather goes back to the original notion of McLuhan that technology is neither blessed nor curses, but is simply a tool [
14]. It avoids moral discussions in a first approach to characterizing a media. Furthermore, practically, we prefer to stick with rather objectively variables that allow for a quantitative statistical analysis. Therefore, much in agreement with the literature on the diffusion of innovation and the digital divide, we capture and analyze well-defined socio-demographic aspects of the adoption environment, including affordances, educational and literacy levels, and technological accessibility. In agreement with the literature on multimodal connectedness and media manifolds, the concept of polymodal media focuses on multiplicity of distinct and complementary channels and applications. In contrast to both, it goes beyond counting them, as we develop a taxonomy that qualitatively differentiates among different types such channels and media applications.
In this sense, the concept of polymodal media can be conceptualized as a subpart of the concept of the polymedia. It does not go as far as to necessarily bind the classification of media to some sort of emotional effects and moral results of media interaction. It is however more comprehensive and detailed than multimodal connectedness and media manifolds, since it not only counts, but also qualitatively distinguishes among different kinds of media, while situating them in the social context of its users. In a sense, the focus is less exhaustive with regard to social effects, but richer with regard to technological functionality.
Polymodal Media Taxonomy of Mobile Apps
We classify different mobile apps along two axis, which we derive from existing literature (for more details, see
Supporting Information S.2, Supplementary). Traditionally, a prevalent dichotomy distinguishes between passive audiences with a focus on entertainment, and active audiences with a focus on utility [
11]. Passive audiences imply an escapist model of a leisurely way to pass the time, often linked to traditional broadcast like TV or radio [
20]. Conversely, active audiences discriminate among media usages [
21], often linked to the individual’s own needs with utilitarian motives [
20,
22].
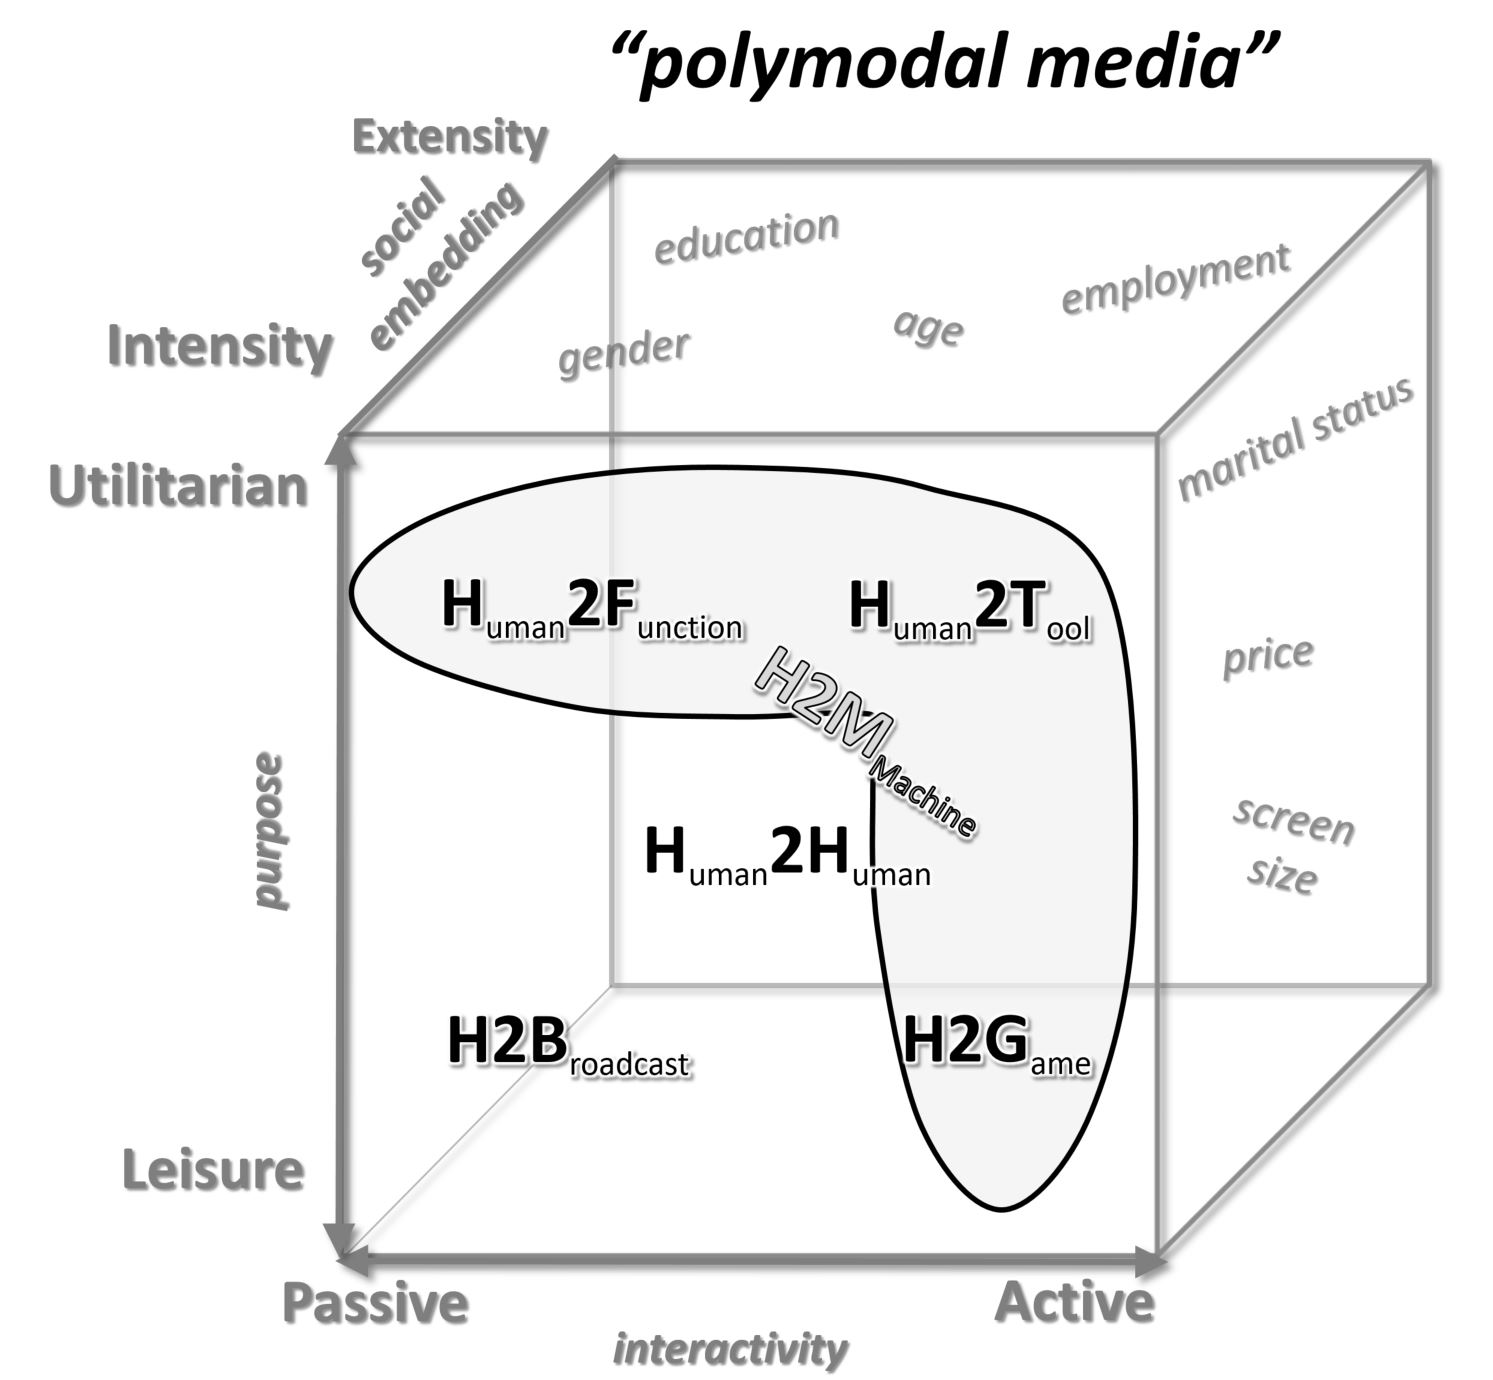
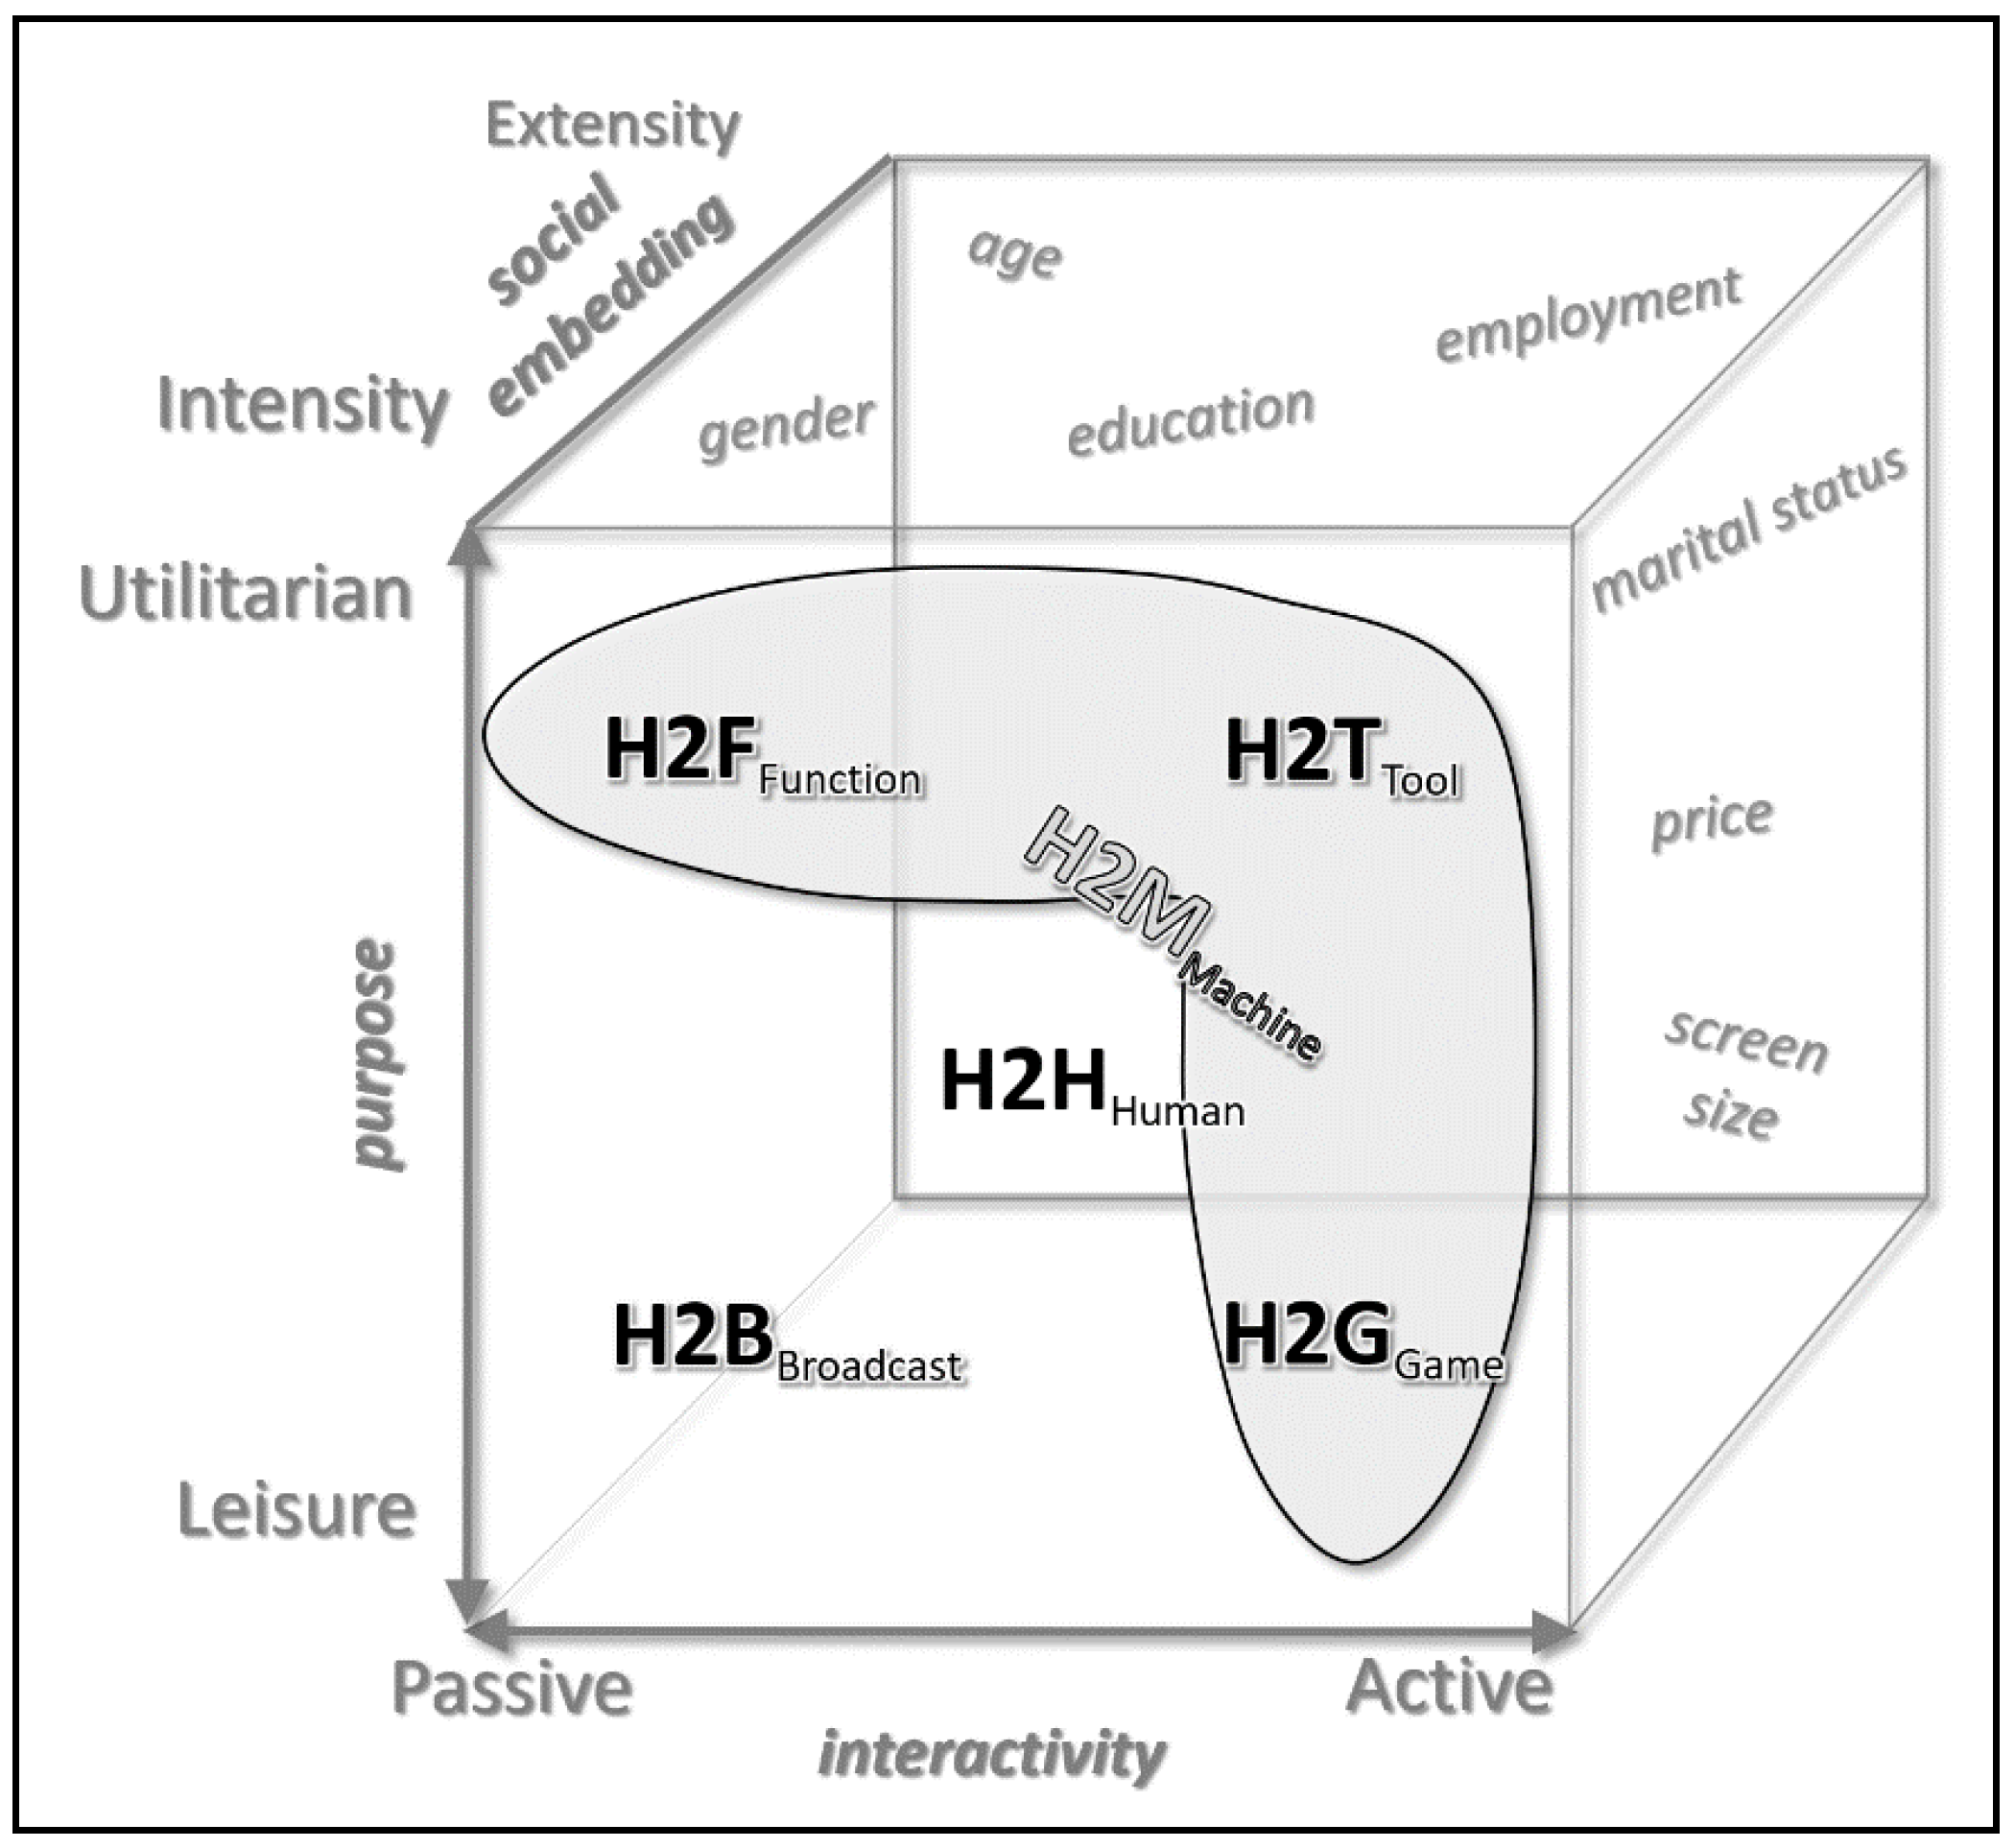
The polymodal diversity provided by the mobile phone breaks the clear tendency that passive usage focuses on leisure and interactive usage on utilitarian purposes. Therefore, we open up these well-established distinctions and split them along the two perpendicular axes as presented in
Figure 1. The vertical axis contrasts leisure- versus utilitarian communication. Research has shown that the perception of playfulness and usefulness are important determinants of users’ intention to use mobile apps [
23]. Mobile phone communication for leisure proposes essentially brings existing forms of entertainment to a mobile format, including human-to-broadcast communication (H2B, including one-directional downstream-heavy apps like music, TV and media player, news- and image apps) and gaming (H2G, including diverse offline and online games). The other side of the axis recognizes that the mobile phone has long been seen by people as a tool for specific utilitarian functions (e.g., [
24]). This includes communication with mobile apps that consists of (more or less) intelligent tools (H2T, including maps, planning, shopping, education, and office apps), and those that serve a specific functionality (H2F, including phone management and features, dictionary, time, anti-virus, and connectivity helper functions).
The horizontal axis distinguishes passive- from active communication. Similar to downstream broadcasting (H2B), the essential characteristic of passive H2F is that the interaction is limited to initial activation or solicitation, followed by a response (in the background or from a server, etc.), while both H2G and H2T require continuous interactivity. For an in-depth discussion of these four mediatic types see
Supporting Information S.2 (Supplementary).
The use of mobile phones for the mediation of human-to-human communication (H2H) is naturally placed in the middle between these different extremes. Mobile phone mediated H2H communication can be both active and passive, as well as for utilitarian and leisure purposes.
The literature has long worked with a dichotomy of communication among humans and machines, which has gone under concepts like ‘human’ and ‘media’ interactivity (e.g., [
25]), or ‘content’ and ‘interpersonal’ interactivity [
26]. Simplifying the nuances of different notions in this field, we can aggregate the five mediatic types into human-to-machine communication (H2M), and rather traditional communication functions to the mobile phone, i.e., telephony (H2H) and broadcasting (H2B) (including radio, TV and written news) (e.g., [
21]). As indicated by the gray zone in
Figure 1, H2M include H2F, H2T, and H2G, as all of them have only become possible due to the provision of storage and computational capacities by the mobile phone (and more or less artificial intelligence) (for more see
Supporting Information S.2, Supplementary).
The depth of
Figure 1 recognizes the social embedding of these different functionalities (depth of cube). Following the social stratification hypothesis, the adoption of technology reflects patterns of existing inequalities in society [
27] and follow technology appropriation theory [
12], we go beyond a binary adoption variable [
28]. We track the more fine-tuned scalar variables of communication duration (extensity of media consumption), and communication frequency (intensity of media consumption) (e.g., [
29]).
3. Research Questions
We elaborate nine research questions to understand who does what on their mobile phone. Each of them identifies some aspects of potential interest, based on anecdotal evidence from previous literature. This might not be enough to formulate strong hypotheses, but will point us to some more interesting questions in this very broad and far-fetched analysis. We follow the variables outlined in
Figure 1.
RQ1: Multivariate relationships. The first research question asks about the overall multivariate relations. We aim at identifying those variables that maximally discriminate socio-demographic communicator characteristics and different mobile phone mediatic types. Decades of research on the digital divide have shown that the most important socio-demographic characteristics for mobile phone usage are income and education, followed by age [
30,
31].
Additionally, the literature is clear on the importance of technological characteristics. These are often neglected in human communication research, but are indispensable to consider in a multivariate analysis, as they might confound the role of socio-demographic characteristics. In specific, recent literature has been quite vocal about the importance of mobile phone screen size [
32,
33]. By now mobile phone screen size variety spans a continuum that reaches from mobile phone watches to tablets.
With regard to mediatic types, previous research suggests that the use of mobile apps for more traditional communication purposes, like H2H and H2B, are used quite similarly among different user groups, while more conventional mediatic types, like H2M, shows stark differences between different socio-demographic groups (e.g., [
3,
34,
35,
36].
RQ2: Communication type diversity. If the mobile phone is multiple media in one, it might be that different groups of people appear to use it to a very similar degree when looking at the total usage ex- and intensity, while this aggregated total hides important differences when distinguishing among different mediatic types (H2H, H2M, etc.). As such, aggregated media consumption statistics would hide interesting variances on the differential usage of different types.
RQ3: Gender. Previous research suggests that women’s mobile phone usage is more extensive in voice communication and socialization [
35], while there is a male-dominance in gaming [
37]. Men also tend to use their mobile phones for business reasons, brief conversations or short information seeking tasks [
35,
38].
RQ4: Age. Mobile phone usage has traditionally been even more skewed toward younger users than other ICT like computers and the internet [
3,
29,
34]. Castells et al. hypothesize that young mobile phone users are “more predisposed toward entertainment” than older users [
39] (p. 163), but Park [
40] finds that the correlation of young users with instrumental and tool use purposes is stronger than for social-entertainment-based purposes (see also [
36]). The usage of traditional mobile phone use, such as for H2H and H2B purposes also requires fewer skills, which facilitates access for older users [
3,
36].
RQ5: Marital Status. Previous research has detected a stronger correlation of mobile phone users with married individuals than with singles [
30,
41], which might stem from the constant H2H communication among family members. Besides that, there is little understanding of this relationship until now.
RQ6: Education. The literature shows a clear positive correlation between educational attainment and mobile phone possession [
30,
31,
34,
41]. Pearce and Rice [
29] found positive correlations between education and both ex- and intensity of usage while others found a negative one [
35,
38,
41]. Users with higher education seem to use more sophisticated interactive services, including mobile app tools [
36]. It seems theoretically justified to deduce that users with very basic educational level and those who are illiterate favor mediatic types that require less input and can be passively consumed, like H2B.
RQ7: Occupation. It has been well documented that the mobile phone is an essential part of the modern workforce. The research found that it is more pervasive among the employed than the unemployed [
30], with especial utilitarian importance for workers in higher employment grades [
38]. Studies also found that the mobile phone blurs the boundaries between professional and domestic spheres and that users without formal occupation use mobile voice communication extensively for their daily purposes, such as coordination of family and social affairs [
42].
RQ8: Price of device. Decades of research on the digital divide have underlined the importance of monetary considerations for ICT usage (e.g., [
30,
31,
38]. High-income groups also use mobile phones both more often and more frequently [
29]. Additionally, around three-quarters of cellphone users consider high priced phones to be worth the costs, which suggests that some additional values are being obtained from increased adoption [
36]. Beyond overall appropriation, more fine-tuned studies show that users with lower income use their phones more extensively for utilitarian tasks, as they have special needs to solve urgent problems [
36].
RQ9: Screen size of the device. Over the lifetime of the smartphone, the variable screen size has continuously increased its importance. The literature shows evidence of more sophisticated, more productive, and longer use with larger screen size [
32,
33]. On the level of distinct app types, it can be hypothesized that smaller screen size is related to more traditional mobile communication, like H2H and H2B, while larger screens lend themselves for more processing intensive H2M (H2T, H2F, H2G).
5. Measures
The two key dependent variables in the following analyzes are the daily mean values of mobile app usage extensity, measured in the duration of sessions in seconds, and intensity, measured in the number of sessions). A session was recorded by the installed metering app when an app was activated by the user (not running in the background). The daily mean per user was calculated for all days that at least one session has been recorded for the phone (M = 27.7 days per user, SD = 4.8).
Our classification of the 16,269 used apps into the five mediatic types from
Figure 1 was guided by the rather automatically provided rubrics used in app stores, like “Productivity”, “Utility”, “Music”, and “Games” (resulting in 125 different rubrics), but was manually revised for consistency (see
Supporting Information S.2, Supplementary). We then classified those rubrics into our 5 types by hand (sometimes we had to split a rubric like “adult apps”).
For a complete list of our seven independent variables see
Table 1. Gender (N
male = 10,367), age (N
16–21 = 3013; N
22–31 = 5701; N
32–41 = 452; N
42–51 = 1503); and marital status (N
single = 7575) are standard. Seven original choices for education were merged into five groups, including illiterate (
N = 7); some school (merging up to 4 years and 5–9 years:
N = 63), Secondary and Higher School Certificate (
N = 1714), some College (but not graduated; (
N = 2713), and College graduates and Post Graduates (merging professional and general). Five occupational groups were created from originally 22 choices, and coded from lower to higher: Students (
N = 4963), housework/temporally not employed (
N = 755), salaried (
N = 3313), self-employed professional (
N = 173), and business owner/industrialist. Both price and screen size were inferred from the brand and version of the phone reported. Price of the device was classified in four groups, from low (4–6 k rupees ≈ USD 71–110;
N = 1094), medium (≈ USD 110–180,
N = 4428), expensive (≈ USD 180–270;
N = 3553), and above very expensive. Screen size was grouped in screens with less than 3 inch diagonal (small,
N = 5955), between 3 and 3.5 inch (medium,
N = 4212) and more than 3.5 inches. As a reference, 3.5 inch was the screen size of iPhones 1–4.
Statistical Tests
All bivariate correlations were far below the accepted threshold of multicollinearity [
45]. The most worrisome methodological particularity stems from the well-known fact that digital media usage usually follows a power law like distribution. After extensive tests of the data we decided to keep the entire sample and not to use log-transformations, but to employ nonparametric statistical tests (see
Supporting Information S.3.1, Supplementary). Our standard go-to test is the nonparametric Kruskal-Wallis test, which safeguards against non-normality, and for multivariate analysis we pay special attention to Pillai’s criterion, which is considered to be robust against unequal covariance matrices [
45].
6. Results
The results are summarized in
Table 1. The first line shows that rather traditional mediatic types, like H2H and H2B, are the most ex- and intensively used apps overall. This contrasts with the finding that 80% of all apps used by all users belong to H2M communication (H2T: 20%, H2F: 23%; H2G: 37%; against H2H: 7%; H2B: 13%;
p < 0.001).
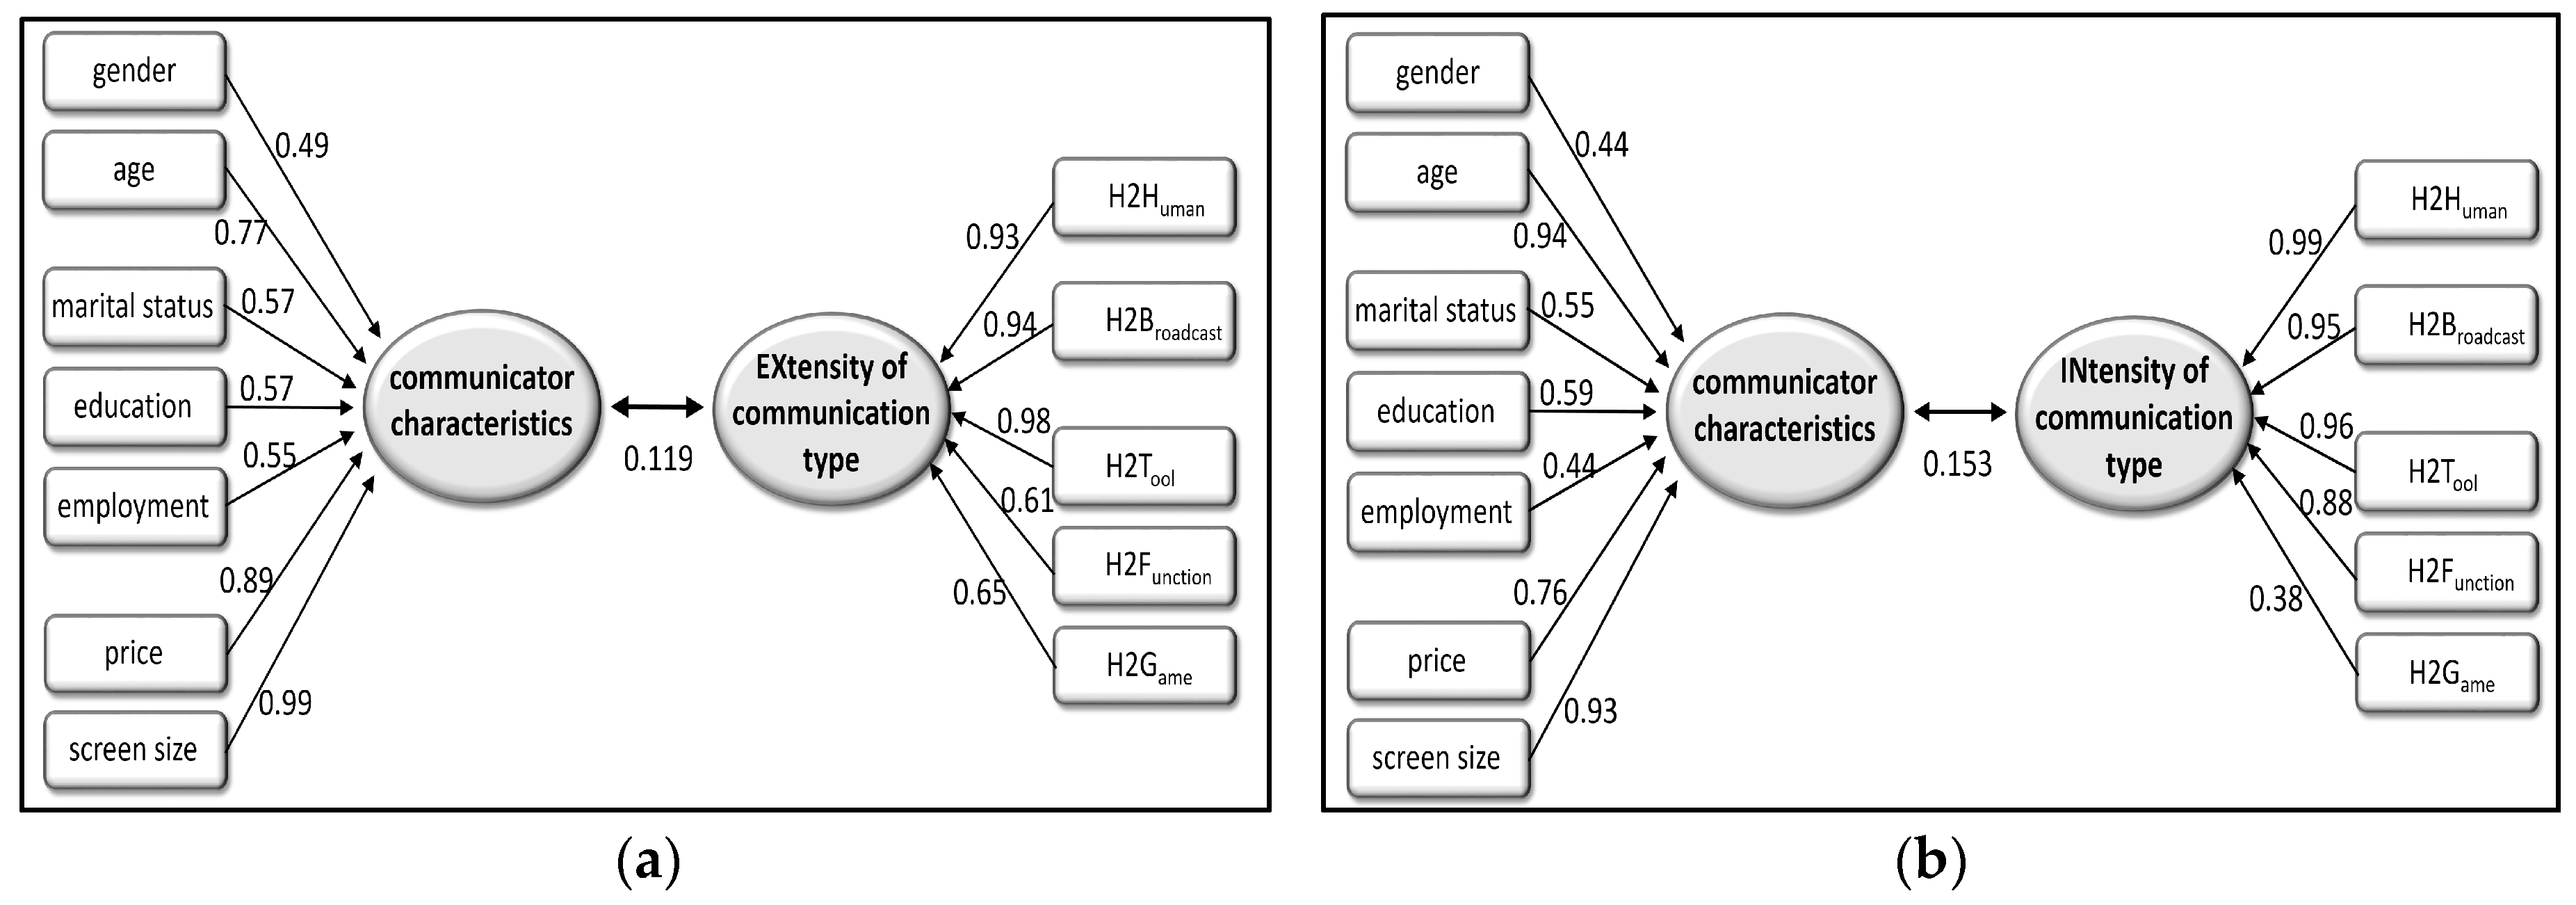
RQ1: Multivariate relationships. We chose canonical correlation analysis to evaluate the multivariate shared relationship between the chosen user characteristics and the five mediatic types. Canonical correlation analysis represents the highest level of the general linear model and subsumes both univariate and multivariate methods as special cases ([
46]; for a good overview [
47]). In essence, it creates two linear equations in such a way as to yield the largest possible correlation between the two resulting synthetic variables (in our case communicator characteristics and communication type). That is, the variance in one of the observed variables is combined to maximally correlate with the combined variance in the other observed variable set.
Both mobile app communication extensity and intensity were evaluated separately in
Figure 2a and
Figure 2b. For both tests the full model across all functions were highly significant (
p < 0.001) using Pillai’s trace (EX: Pillai’s trace = 0.12095, F(DF 35, 53,585) = 37.9; IN: Pillai’s trace = 0.1544, F(DF 35, 53,585) = 48.8). In both cases the dimension reduction analysis yielded four highly significant functions (
p < 0.001) (for more details see
Supporting Information S.3.2, Supplementary). In terms of the squared canonical correlation coefficients, the first four functions together explained 11.9% of the shared variance for extensity and 15.3% for intensity. The total canonical communality coefficients (h
2) for each variable represent the amount of variance in the observed variable that was reproducible across the four functions (
Figure 2 and
Table S6 in Supplementary).
In contrast to traditional digital divide literature [
30,
31], both the price and education are not the two main explanatory variables, even so mobile phone price plays a quite important role to explain differential usage extensity. In agreement with what was to be expected, age and screen size are the most important communicator characteristics.
In terms of the synthetic variable that discriminates among mediatic types, we see that both H2H and H2B play a prominent role (together with H2T). H2F and (somewhat surprisingly) H2G are not as useful to maximally discriminate among different user profiles and usage types.
RQ2: Communication type diversity. As shown in
Table 1, of the 14 univariate ANCOVAs, which test the relation between a chosen fixed factor the total ex- and intensity (controlling for the remaining six socio-demographic variables), more than 1 in 3 is not significant (5 out of 14), while 50% of them at the
p < 0.001 mark. For the 70 multivariate MANCOVAs, which test the relation between a chosen fixed factor the ex- and intensity among the five different mediatic types (controlling for the remaining six socio-demographic variables), less than 1 in 4 are not significant, while over 70% are at the
p < 0.001 mark. As such, we can confirm that on average the relationships between socio-demographic variables and ex- and intensity are less significant for total mobile phone usage than for the different mediatic types used on mobile phones.
RQ3: Gender.
Table 1 shows that the univariate ANCOVA found no significant difference in marginal means of both total ex- and intensity with regard to gender (EX: F = 2.8,
p = 0.097; IN: F = 4.5,
p = 0.033), that is, after all the effects of all six other socio-demographic variables have been accounted for. At the same time, women make more ex- and intensive use of H2H communication (EX: F = 71,
p < 0.001; IN: F = 52,
p < 0.001) (see
Table 1 for details on the F and
p values).
RQ4: Age. In contrary to expectations, young users do not show more usage. Also contrary to previous findings, our digital footprint shows that young users use the mobile phone more extensively for more traditional H2H and H2B, while older users use mobile tools (H2T) and are avid gamers (H2G).
RQ5: Marital Status. For both ex- and intensity of usage, we find a highly significant difference in the opposite direction than what was suggested by previous literature (see
Table 1 for F and
p values): singles use H2H more than married couples. None of the other mediatic types shows significant differences when controlling for the remaining six socio-demographic variables.
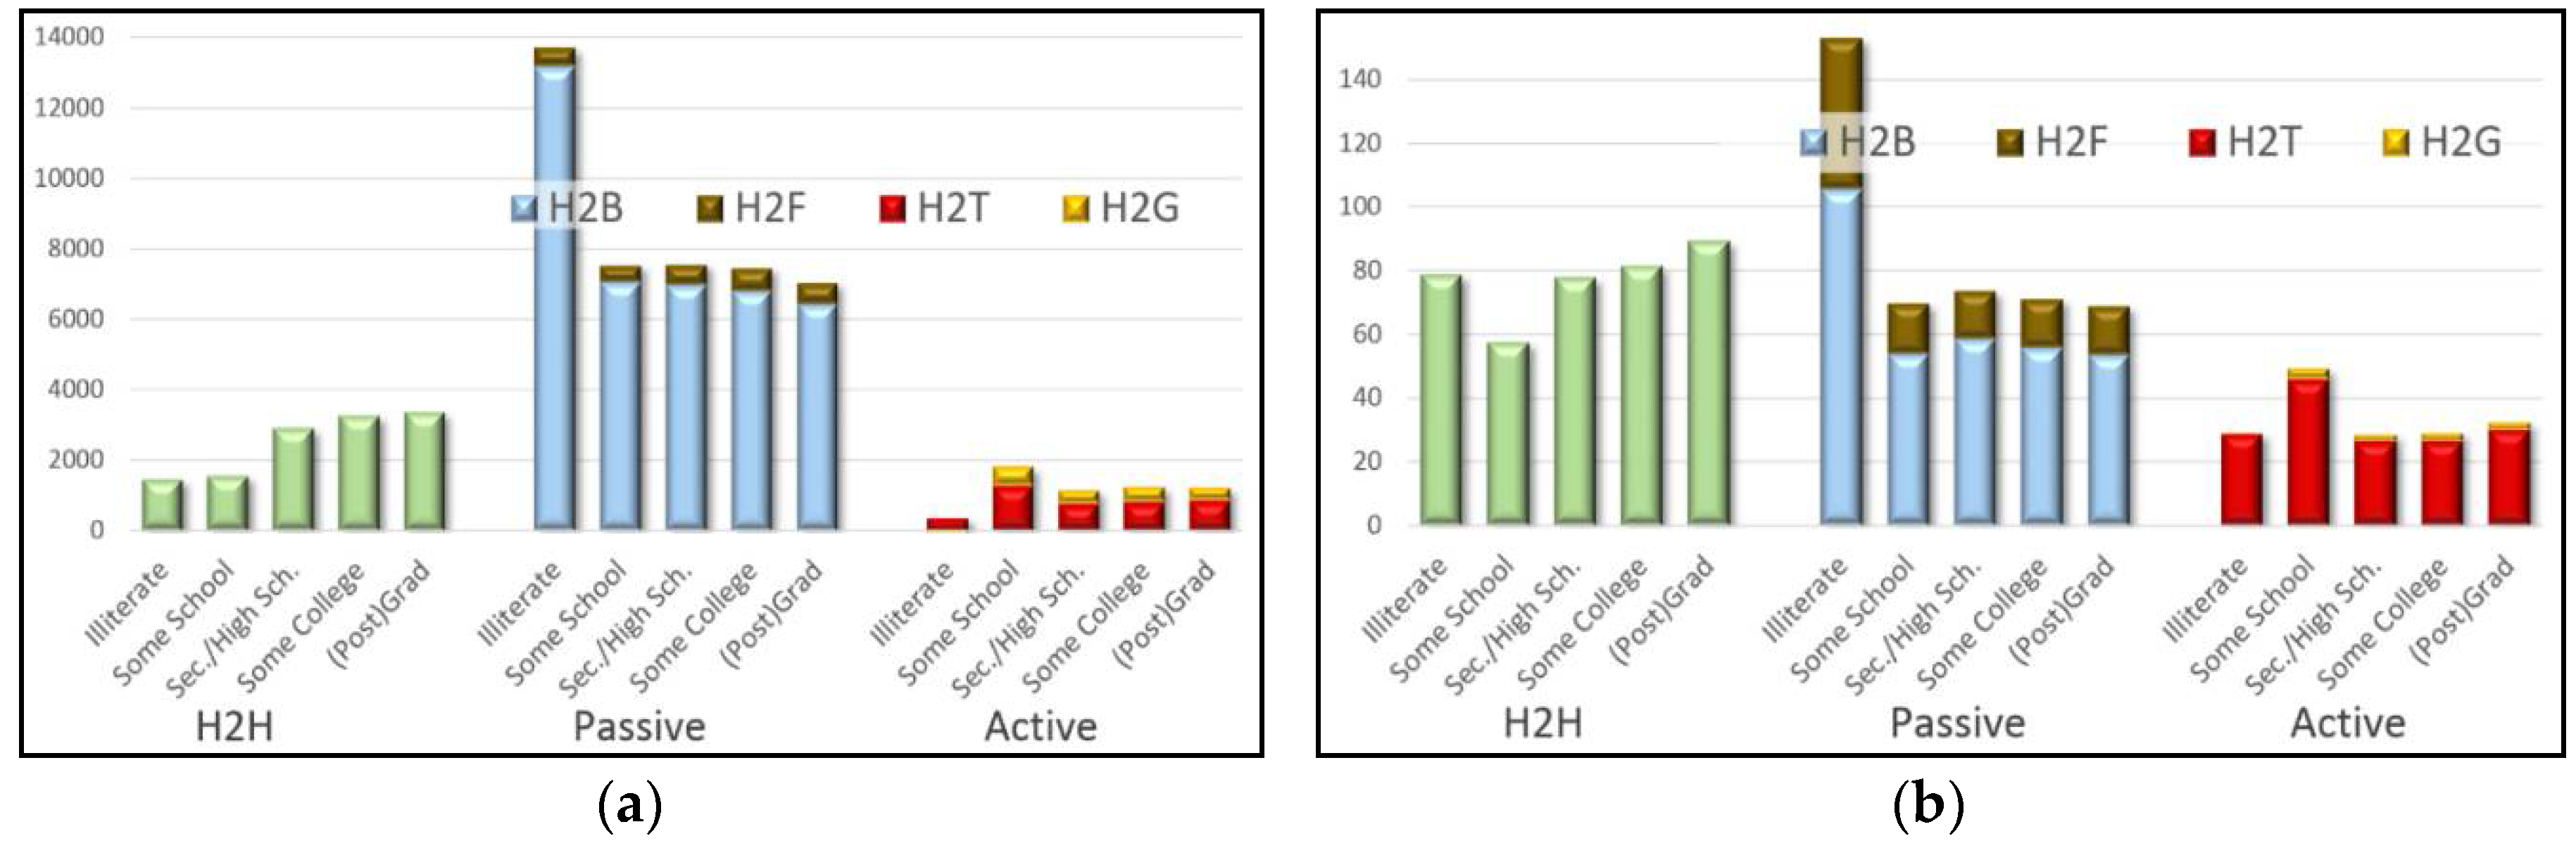
RQ6: Education.
Table 1 shows that the MANCOVA detects significantly different estimated marginal means for H2T (except IN H2G), but
Table 1 and
Figure 3 shows that there is no monotone in- or decreasing tendency among educational levels. A posthoc partial correlation between increasing educational level and H2T (controlling for the remaining six socio-demographic variables) is significant and shows a positive correlation with extensity (r
part(10,717) = 0.027,
p = 0.005) and intensity (r
part(10,717) = 0.043,
p < 0.001) and a negative correlation with H2B for both extensity (r
part(10,717) = 0.043,
p = < 0.001) and intensity (r
part(10,717) = −0.032,
p = 0.001).
Figure 3 reveals a striking difference in mobile phone uses by the illiterate. Unfortunately, only 7 of our 10,725 subjects are illiterate (illiteracy faces obvious challenges for study recruitment), which does not lead to significant results.
RQ7: Occupation. In general, higher occupational grades have more ex- and intensive H2T (extensity: rpart(10,717) = −0.018, p = 0.060; intensity: rpart(10,717) = 0.051, p < 0.001). Contrary to expectations, we also find that higher occupational groups use H2H more ex- and intensively (controlled for income and education, etc.).
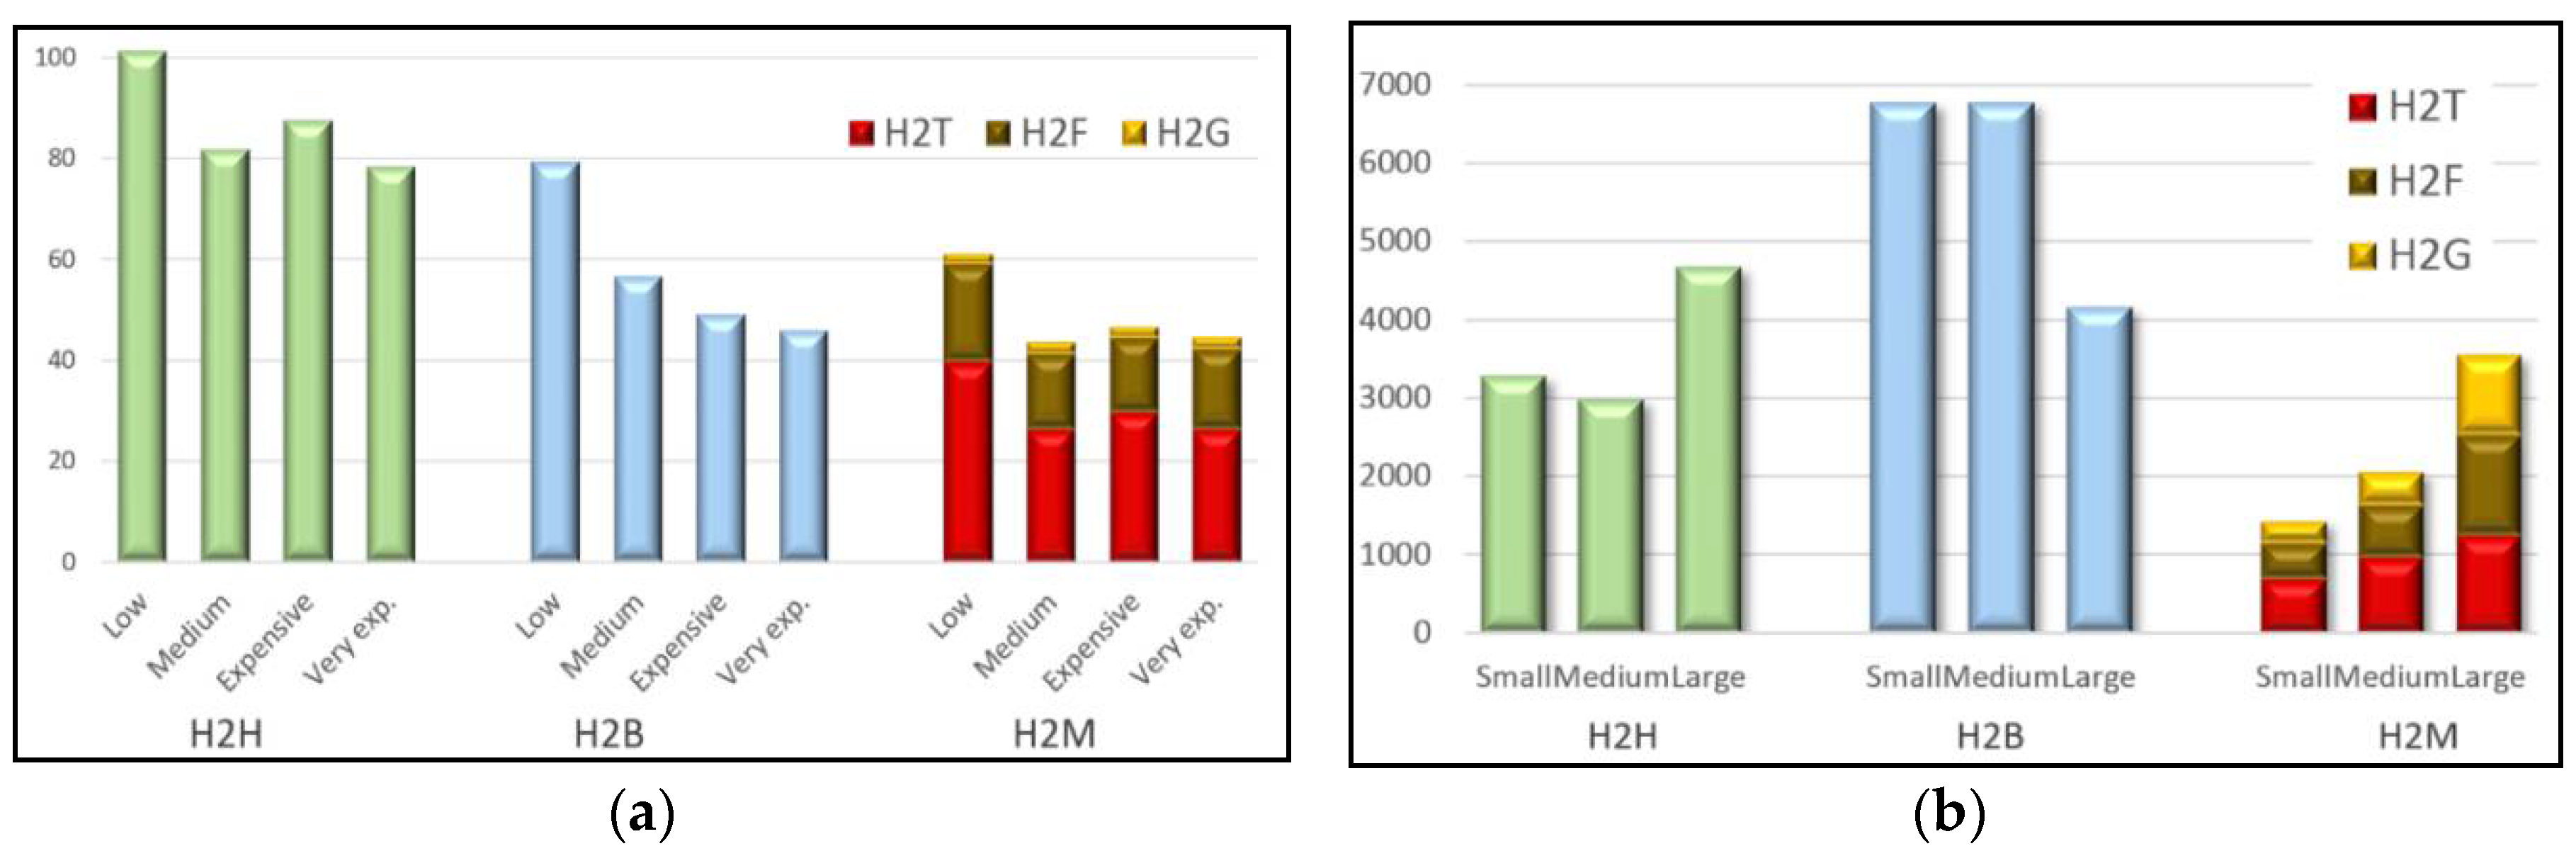
RQ8: Price of device. Surprisingly, we find that more expensive mobile phones do not show more ex- and intensive usage (extensity: r
part(10,717) = −0.078,
p < 0.001; intensity: r
part(10,717) = −0.096,
p < 0.001) (see also
Figure 4a). At the same time we find that cheaper phones are employed more for utilitarian tool use (with H2T: extensity: r
part(10,717) = −0.021,
p < 0.021; intensity: r
part(10,717) = −0.074,
p < 0.001).
RQ9: Screen size of device. The partial controlled correlation shows a negative relation between screen size and communication intensity (9aIN r
part(10,717) = −0.024,
p = 0.012). The main culprit is the role of traditional H2H and H2B (extensity: r
part(10,717) = −0.036,
p < 0.001; intensity: r
part(10,717) = −0.006,
p < 0.001). We find the largest effect size among all of our tests by the finding that larger screens are linked to more ex- and intensive H2M (extensity: r
part(10,717) = 0.227,
p < 0.001; intensity: r
part(10,717) = 0.106,
p < 0.001) (
Figure 4b). Post hoc tests show that this relationship is also significant for each of the members of H2M, namely H2T, H2F and H2G.
7. Discussion
Our study has provided broad-based and diverse empirical evidence that the mobile phone is clearly used as a different media by different user groups.
Table 2 presents a rather qualitative interpretation of the quantitative results presented in
Table 1. For example, it illustrates that the mobile phone is used as a traditional H2H medium by women, young users, singles, highly educated, with an independent occupation, while men and the less educated use it as a H2B entertainment medium.
Table 2 underlines the unexpected finding that none of the H2M usages (H2T + H2F + H2G) is significantly male dominated, and that tool use (H2T) is mainly used by lower occupational grades. Also, the profile of the user group that uses the mobile phone as a gaming medium (H2G) is unexpected, as it is not made of young, single men. Additionally,
Table 2 shows that our two technological variables (price and screen size) are the only ones that allow to distinguish between differences in ex- and intensity of mobile phone usage. For example, for all types but H2G, a large screen size is related to extensive long sessions, while a small screen size is related to intensive frequent usage. Socio-demographic characteristics do not allow to distinguish among these differences in social adoption.
The summary of
Table 2 underlines our finding from RQ2, which has shown that any attempt to aggregate its heterogeneous communication functionality into one single indicator will miss important aspects of user diversity and communication variety. For example, our univariate tests of aggregate ex- and intensity of general mobile phone usage for gender and marital status turned out to not detect any significant differences between men and women, or between married and singles. By developing and applying a taxonomy of different mediatic types we were able to show that this seeming homogeneity was hiding significant differences in terms of different kinds of apps that are used by different user groups. Women use their phone much more often for human-to-human communication while men use it more for broadcasting purposes (see
Figure 5). On the aggregate level, both tendencies counterbalance each other, which leads to a deceptive homogeneity if we neglect the inherent polymodal nature of the mobile phone.
Our study has shown that mobile apps both extend some well-known aspects of media use while they also introduce just as many unexpected and surprising patterns. While it is beyond the scope of this broad study to delve deeper into the details, several of the counter-intuitive findings are yet to be explored by more in depth research.
8. Limitations
The first and unavoidable limitation is inherently linked to the main goal of this study: the development of a broad and statistically testable conceptual framework. Any chosen theoretical framework will inevitably influence the result of the subsequent tests. We followed insights from established theoretical literature, but are very aware that other taxonomies could have been developed, which would have shed a different light on the issue. After much back and forth, we feel that the incipient stage of our understanding results in a typical chicken and egg problem. Developing adequate taxonomies to describe the phenomena goes hand in hand with deepening our understanding of it, which is what this study aims at. Based on the gained insights, future studies might develop a modified framework. Unsupervised machine learning tools might be useful in this task. Based on our particular theoretical framework, we also found that there are important aspects we must have missed. The squared canonical correlation coefficients that maximally discriminates between mediatic types and communicator characteristics captured only 12–15% of the shared variance. This must not be the fault of the mobile app taxonomy, but can also stem from the lack of inclusion of further socio-demographic variables (e.g., like ethnic origin and culture). We suspect that the additional of complementary technological characteristics can quickly boost the strength of this overall correlation.
Third, our dataset stems from India. There might be important cultural characteristics that influence our results. These are not considered here and therefore the results might not be generalizable to other countries. On the upside, India is the second biggest mobile phone market in the world, and therefore deserves its own treatment.
Finally yet importantly, the most obvious limitation refers to the incessant technological progress of mobile telephony. Shortly after our sample period, the iPhone took over the world market. User behavior might have changed since then and it is probable that it is still changing. We still consider our findings very insightful for two reasons. For one, any kind of smartphone shares important similarities with future generation smartphones, including the hardware-independent operating system and the possibility to install third party apps. Besides, our main contributions aims to push conceptual frameworks. While the fast pace technological change will surely change the proportional importance and the specificity of particular findings, it should not as easily alter the proposed theoretical framework for the polymodal media constituted by the mobile phone. In this sense, this study provides a benchmark for future generations of studies.


