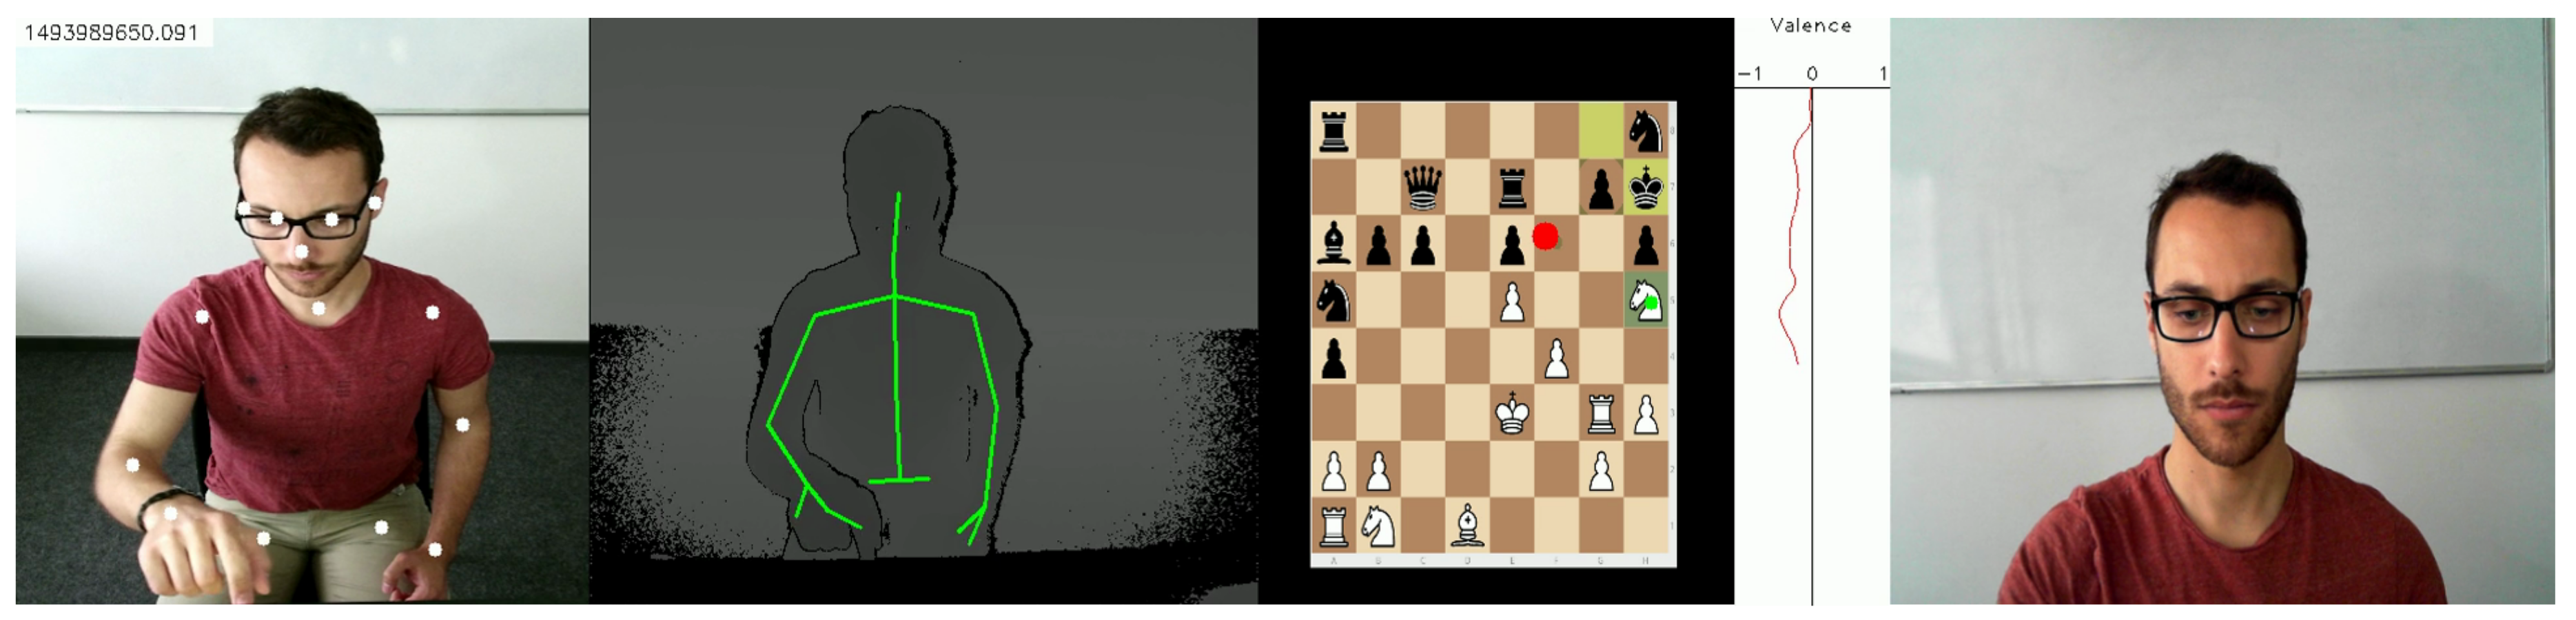
Synchronous data for every feature, depicted in
Table 1, have been extracted from all sensors. Several tasks, like regression over
Elo ratings or over the time needed to perform a task, could be addressed using these data. Among them, we chose to analyze a classification problem that can be interpreted by a human: Is it possible, by the use of gaze, body and/or facial emotion features, to detect if a chess player is an expert or not? This problem is used as example to obtain a first validation of our data relevancy. It is correlated with whether a chess player is challenging beyond his abilities or not. This section presents unimodal and multimodal analysis of extracted features to determine chess expertise of players. Only the data recorded for the 11 N-Check-Mate tasks are considered here, outcomes for participants are presented in
Table 2.
4.2. Statistical Classification and Features Selection
To demonstrate the potential benefit of a multimodal approach, a supervised machine learning algorithm has been used to quantify accuracy of different modalities for classification.
Support Vector Machines (SVM) have been built for each modality and for each possible combination of modalities. For this purpose, we computed statistical analysis in respect to the nature of our data: discrete (count, duration) or continuous (mean, variance, standard deviation) over our features of interest. Giving us a total of 3 features for the gaze modality, 30 for the emotion modality and 14 for body modality. (see
Table 3). Then, we constructed input samples as the following: one input sample would be the instantiation of one participant for one particular task, given a total number of 23 × 11 = 253 input samples.
A 10-fold stratified cross-validation procedure has been used on every SVM to compute their accuracy. An exhausting grid search over different set of hyper parameters is used to explore and find the best parameters for each SVM to consider. Two grids were explored, one kernel and one kernel. The C parameter for both kernels took values in and the for kernel ranged in . To compute accuracy for one SVM, each stratification is randomly shuffled before splitting into batches and before computing accuracy. This process is repeated 100 times and the final accuracy for the SVM is the average of all randomly shuffled stratification.
Accuracy results over all features are depicted in the first line of
Table 4. First observation is that emotion and body modalities reached good accuracies,
and
respectively, confirming that theses features capture relevant information. Gaze modality performed less than expected, only
, this could be explained by the way the metric have been chosen. Indeed, we decided first to analyze fixations for only 2 AOIs without considering scan path order. More work has to been performed to improve gaze interpretation.
Secondly, modality fusion varied between and for any possible combination which is less than a unimodal approach. To perform expertise classification, one might be tempted to choose only body or emotions features. However, a system relying on a unique modality may face unreliable or noisy data in real life conditions. For example, an emotion detection can not be performed if there is occlusions in front of the subject head. Being able to rely on multi modalities to build a robust system is essential. Now, as several features characterize each modality and our system takes into account 47 features, we propose to evaluate the most relevant for the expertise classification task.
For this purpose, among existing methods in the literature, we selected two different techniques, the first one is the Minimum Redundancy Maximum Relevance (mRMR) technique [
32] for the expressiveness of the selected features we experienced formerly [
33] and the second is the Fisher Feature Selection [
34,
35]. These algorithms allow a dimensionality reduction of the feature space according to the maximal statistical dependency criterion based on mutual information. Both techniques search to maximize features relevance and effectiveness, however, they differ in their redundancy policy. Indeed, mRMR will try to reduce redundancy as much as possible even if its impact the overall effectiveness, on the other hand, Fisher may keep redundancy if it can improve effectiveness. We propose here to use both techniques separately on our data and compare results.
Using these techniques, we expect to reduce drastically the feature space to improve the data fusion performed by the SVM classifier. Both mRMR and Fisher techniques have been used on all our features and the resulting ranking are listed in
Table 5 and
Table 6. A key information here is that among the top rated selected features, all three modalities are present. It confirmed that all modalities bring relevant information. Fisher’s selection rather prefer to keep body and emotion information as its maximize effectiveness, this has been observed with SVM accuracy (see
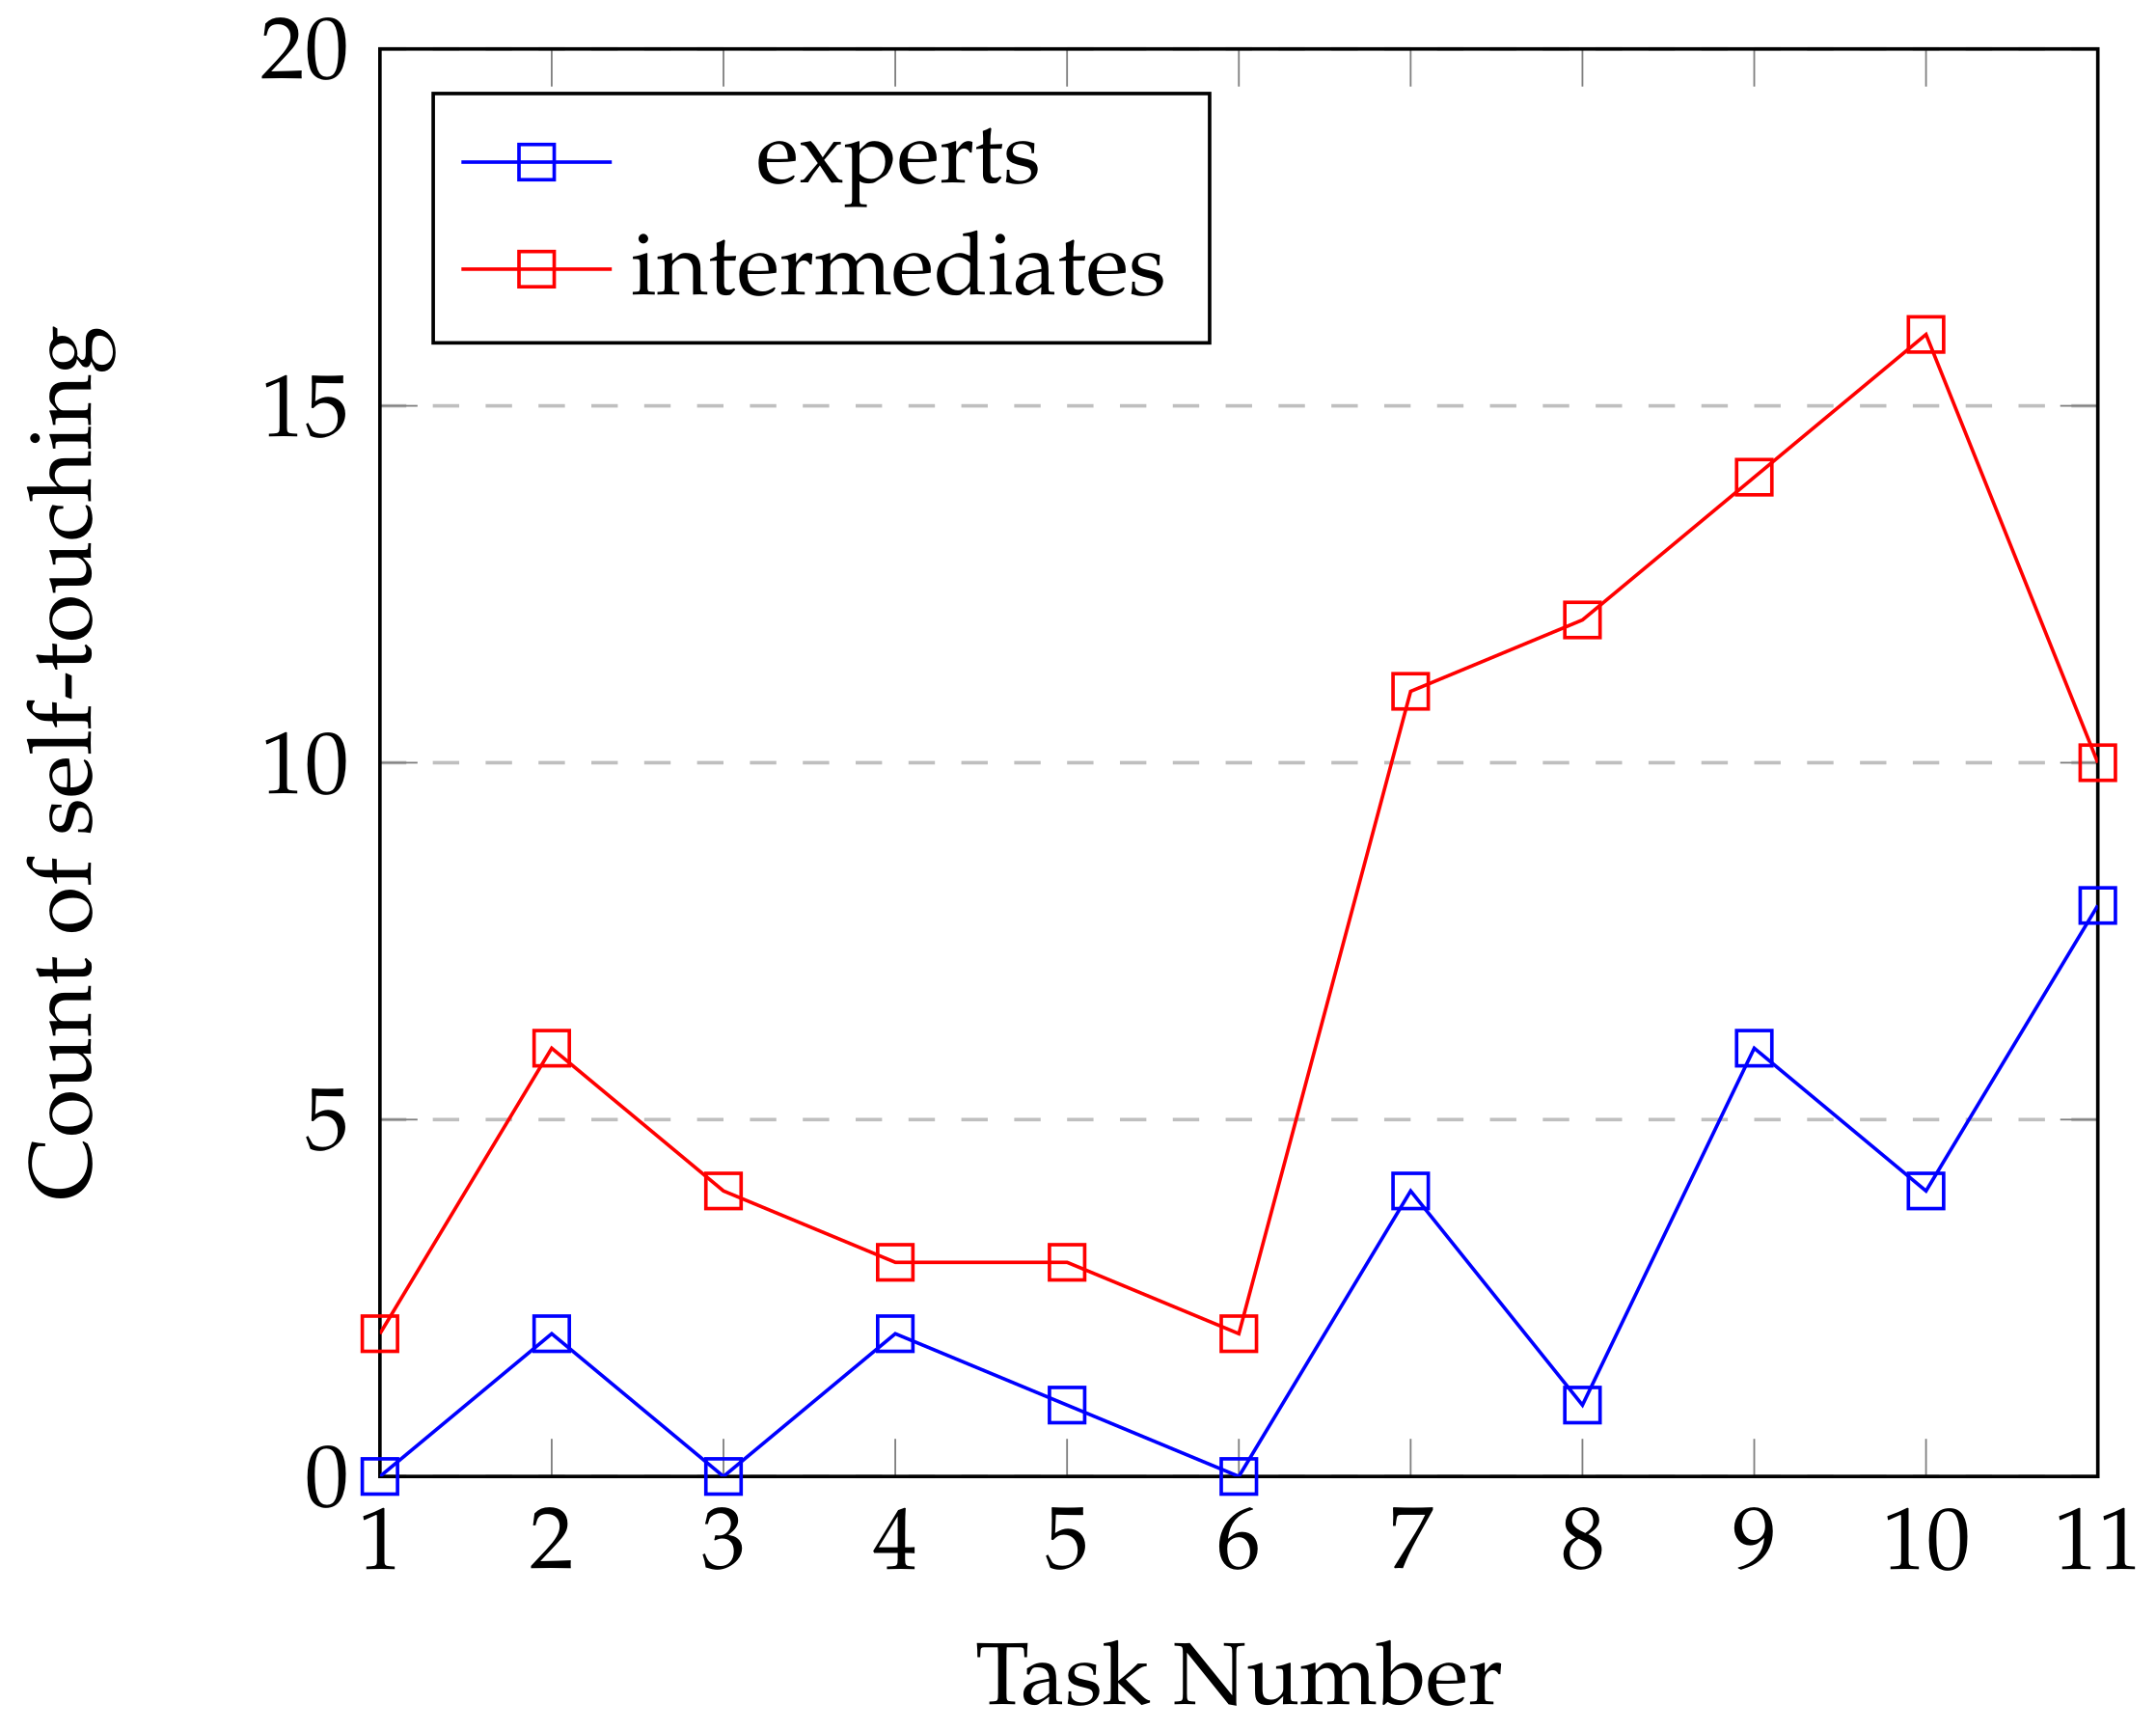
Table 4), even if some features are redundant (like agitation in x, y, z) where mRMR preferred to keep only one of them. It is interesting to observe that both techniques agreed to select top feature for each modality. Variance about agitation and volume combined with the number of self-touches give us significant information about body behavior. Variance, standard deviation and mean about valence, heart rate and —negatives—basics emotions (disgusted, scared and angry) capture emotional reactions the participants when being challenged. Finally, as specified in
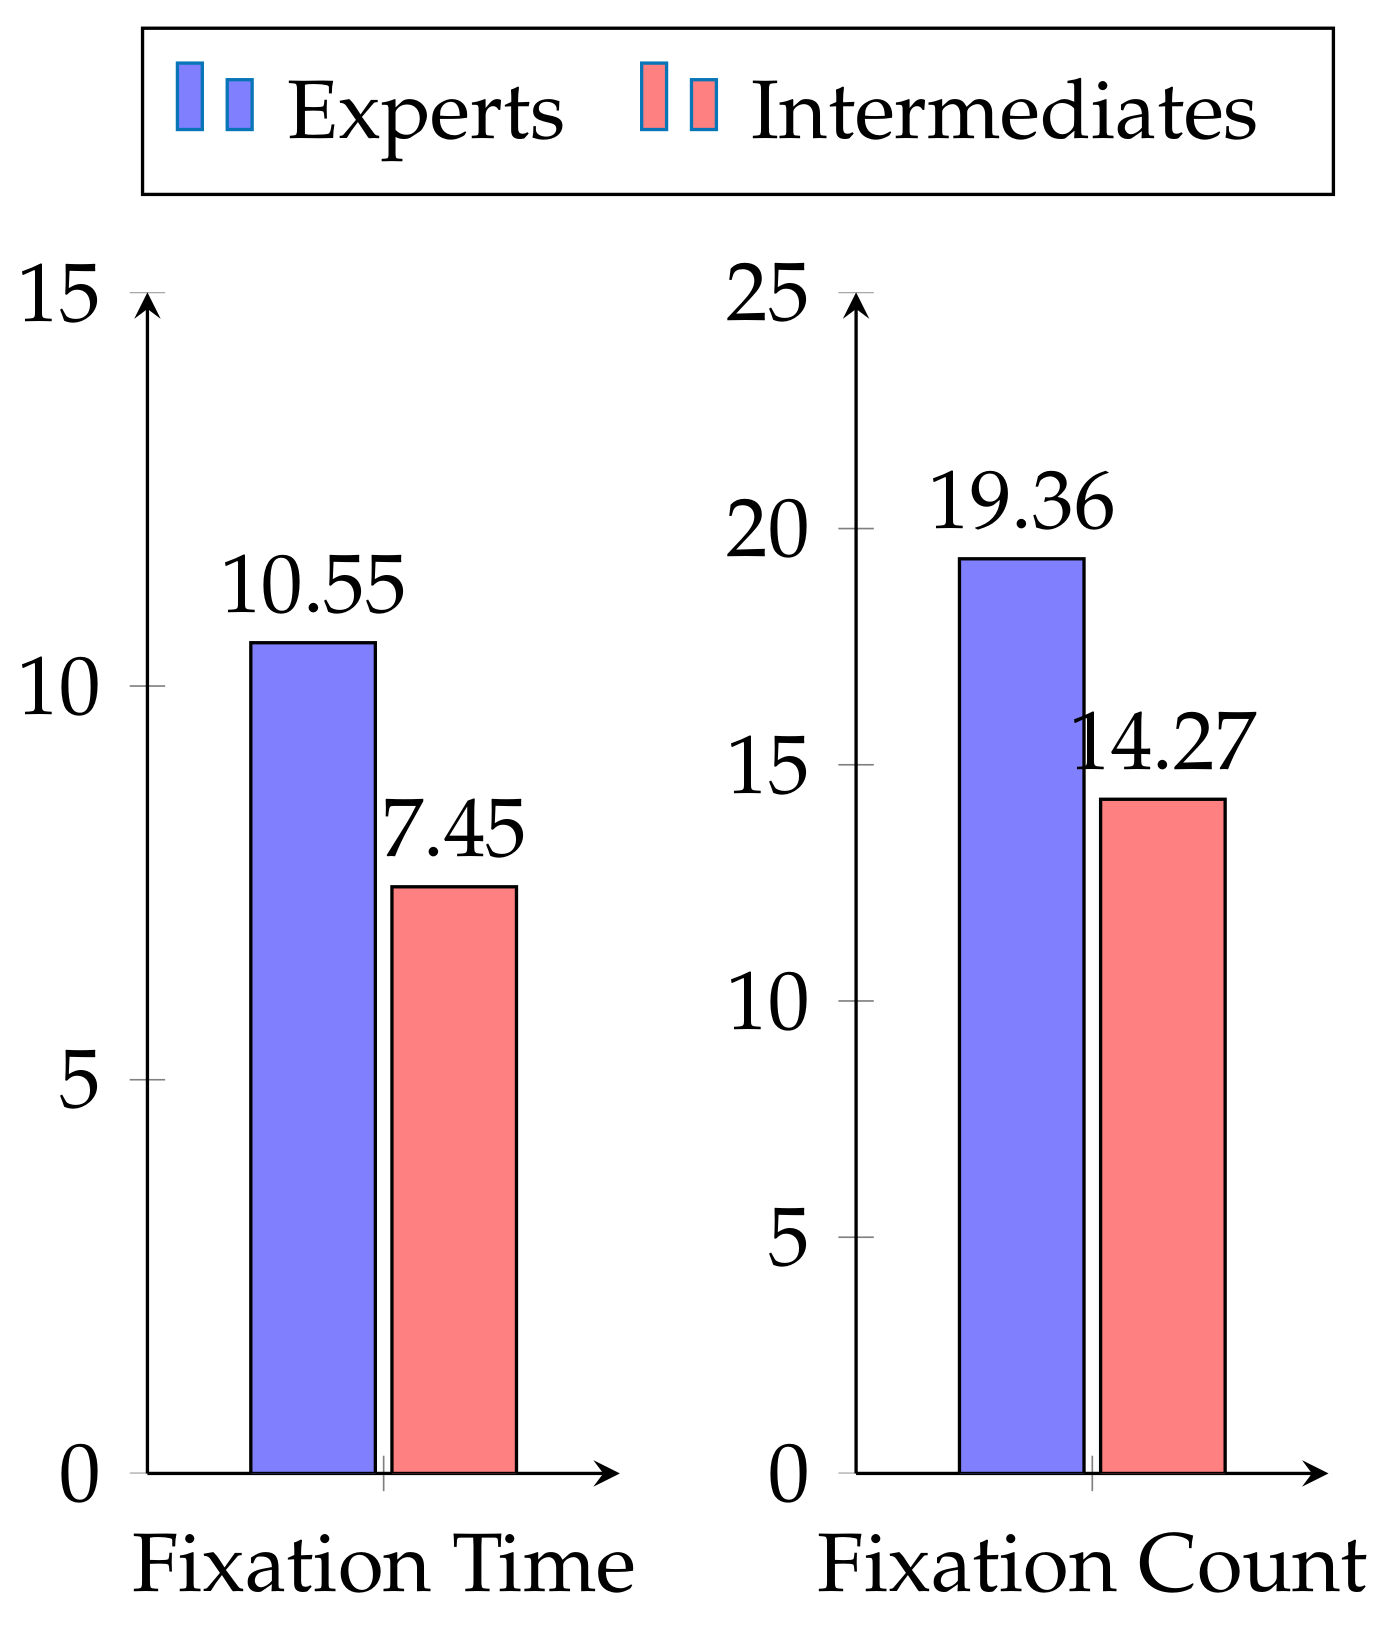
Section 4.1.3, fixation duration is relevant to classify a participant as expert or intermediate.
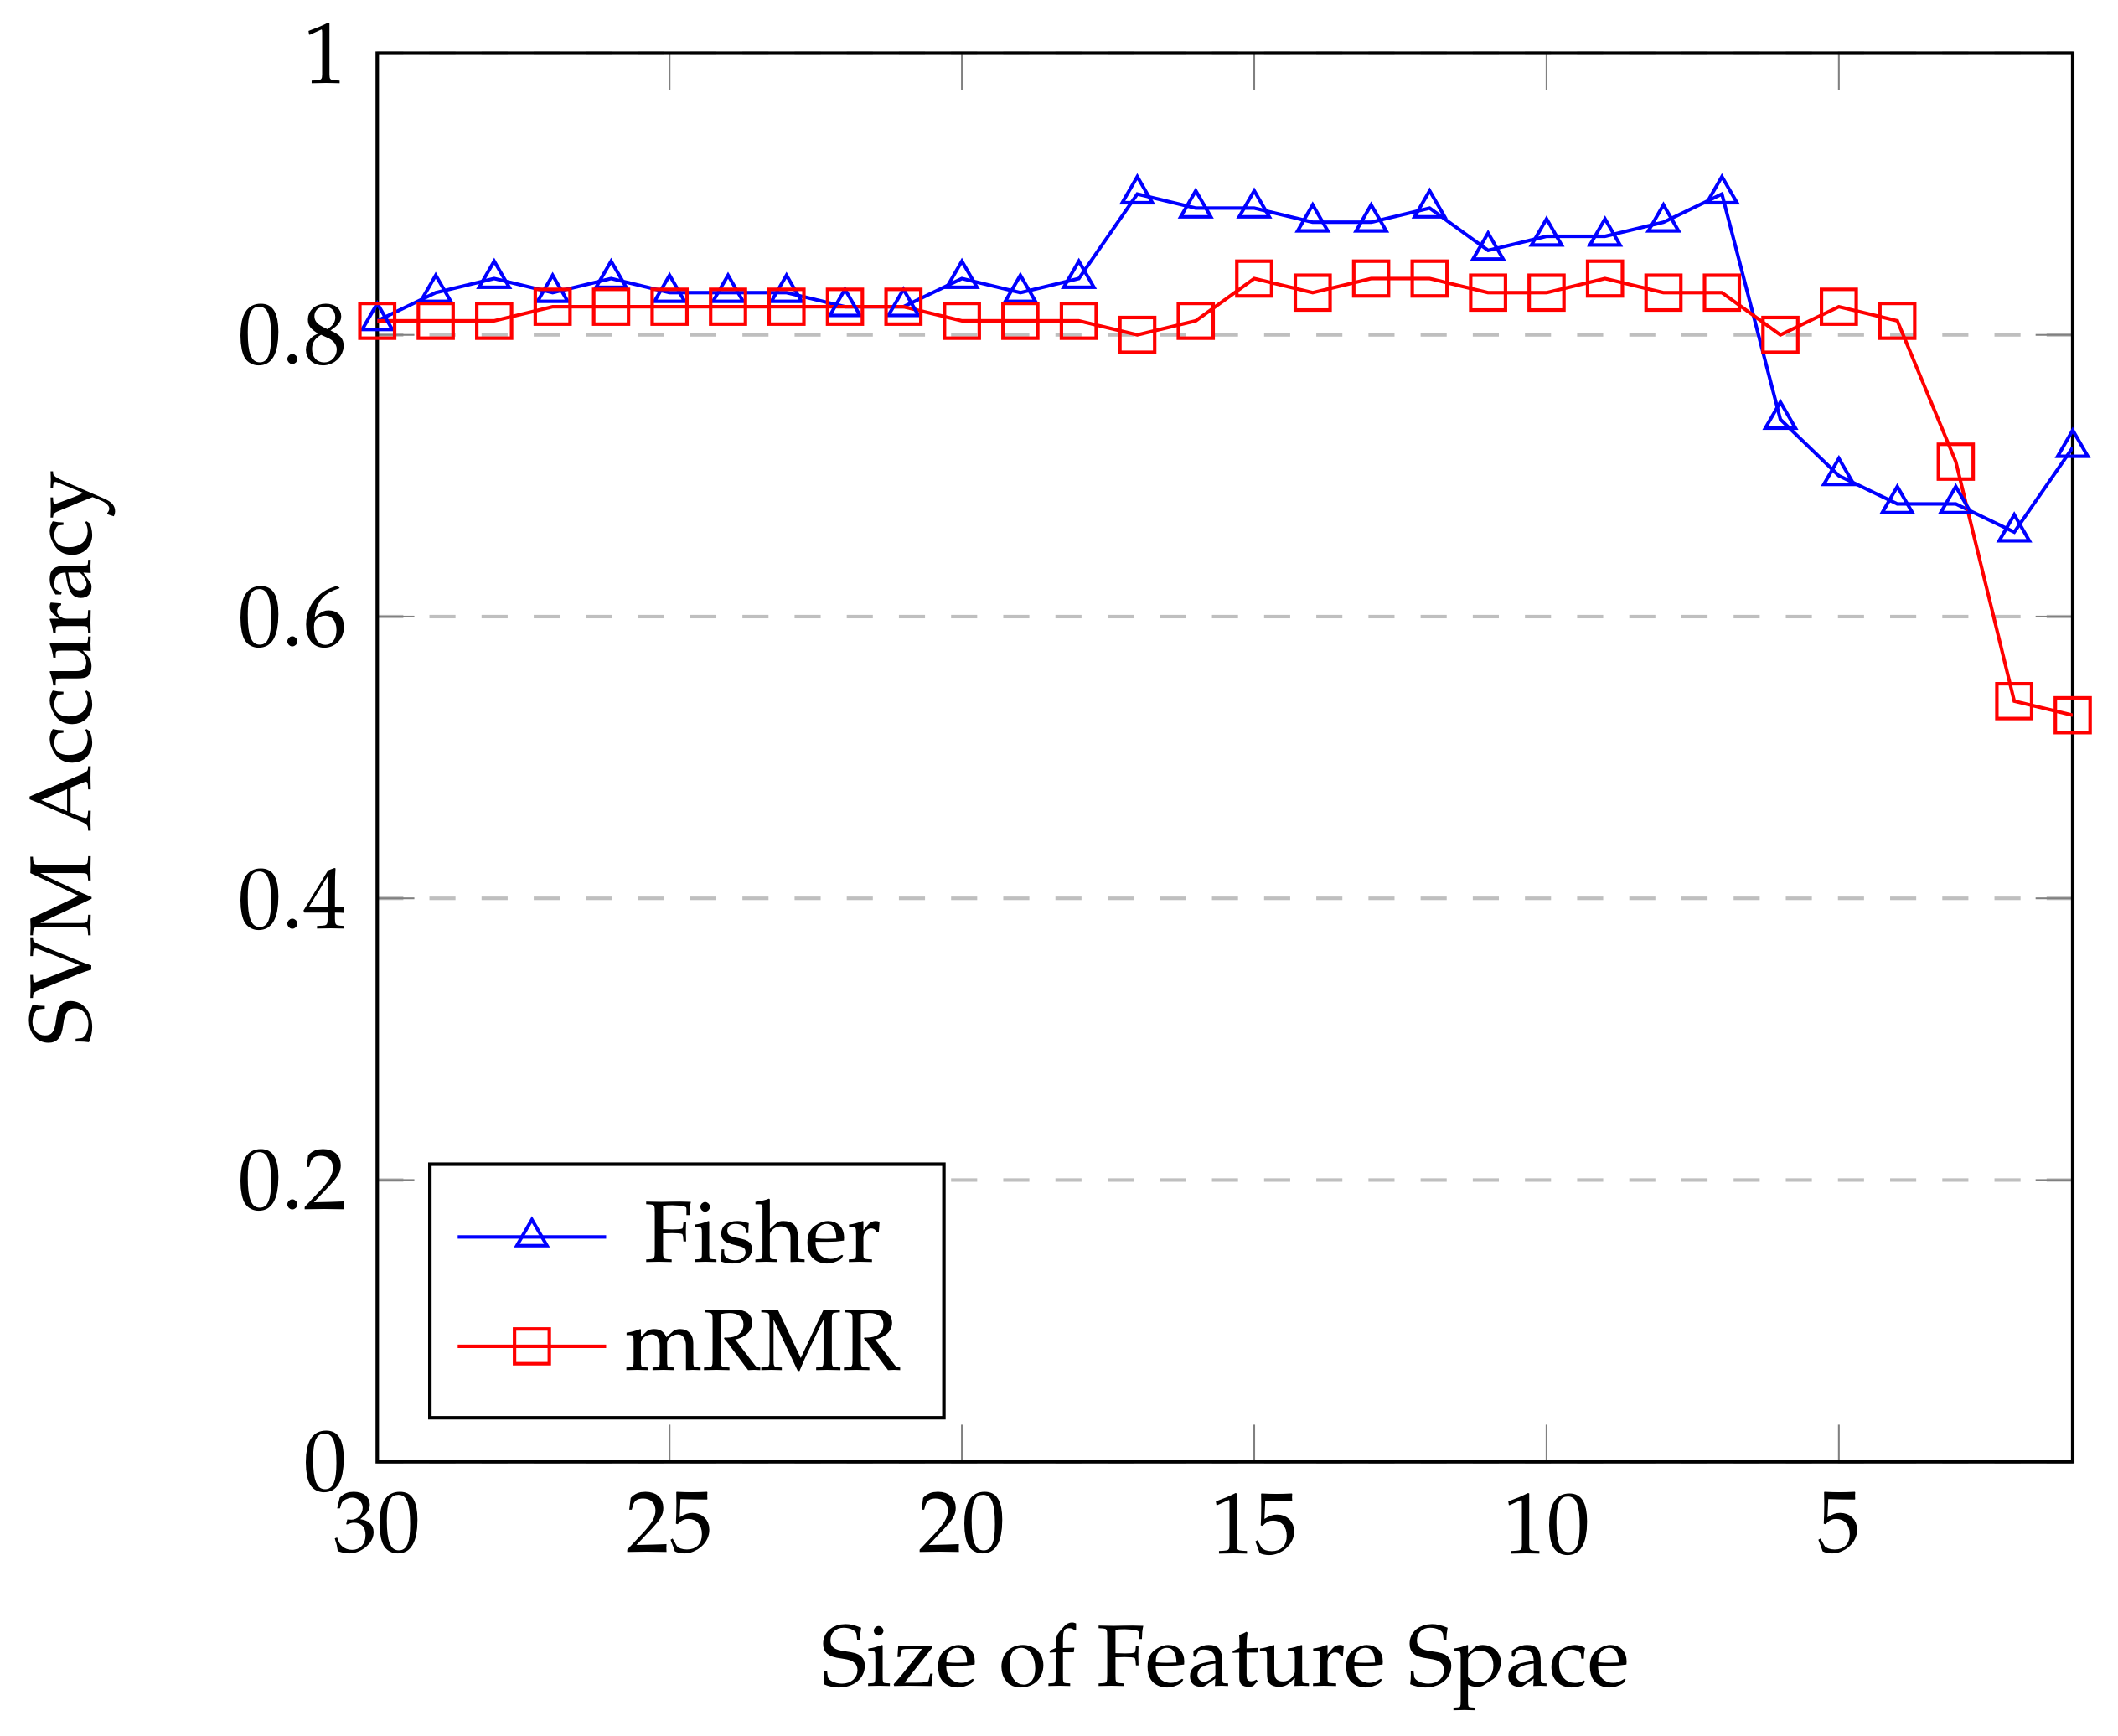
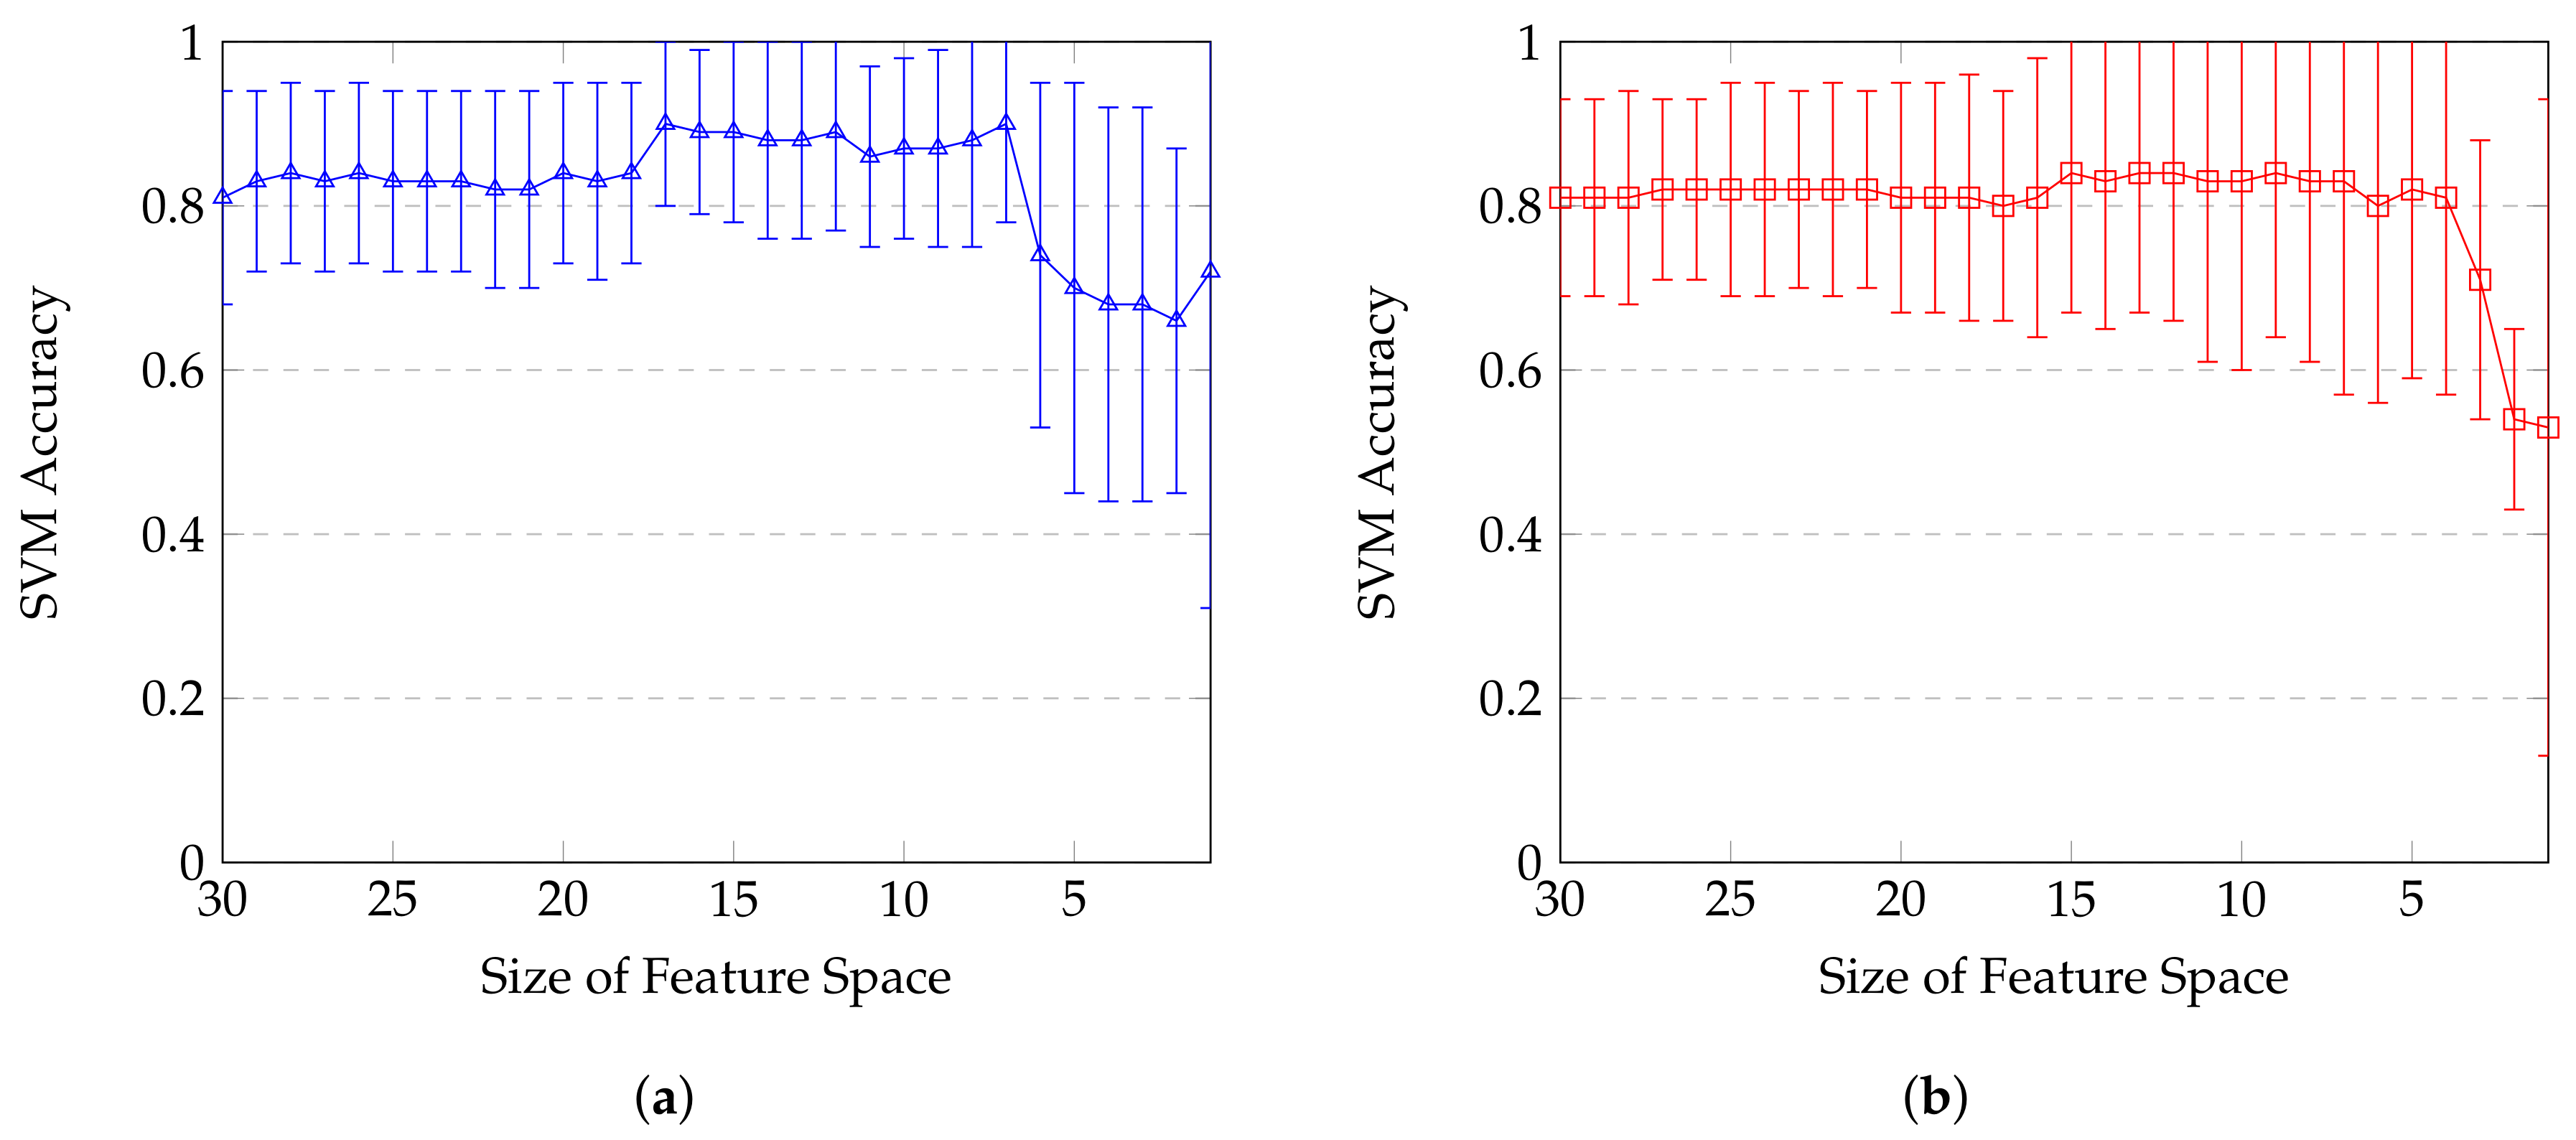
With the aim of benefit from both feature selections, the impact on accuracy is showed on
Figure 7 and
Figure 8. Highest accuracy score for mRMR selection is
using its top 9 ranked features. Using Fisher features selection, accuracy can reach up to
with its top 7 ranked features. One interesting observation from these plots is the two different paces for accuracies to reach their maximum. Only 4 non redundant features combined from mRMR ranking are enough to reach more than
of accuracy where the slowly but steady curve from Fisher needs to combine 7 features to go beyond this
threshold (and going even way higher with
). 8 firsts features are enough to reach up to
, which is close from the one achieved earlier (
) by using all features.
These results show that features from different modalities are not equally relevant.
Figure 7 illustrates that after certain amount of features, performance stagnates or even decreases slightly. This phenomena starts after 15 and 17 features for mRMR and Fisher techniques respectively. This can have 2 explanations. The first one is that the number of input data is not high enough to take advantage of these features. The second explanation is that these last features do not actually provide new information for classification. This hypothesis is consistent with the ranking results from both mRMR and Fisher techniques which classified them last and therefore shows that thy contain a large amount of redundant information already included in top features.


