

Topographic Measurements and Statistical Analysis in Static Load Testing of Railway Bridge Piers

1
Department of Engineering and Geology (InGeo), “G. d’Annunzio” University of Chieti-Pescara, Viale Pindaro, 42, 65127 Pescara, Italy
2
Dipartimento di Ingegneria Civile, Ambientale, del Territorio, Edile e di Chimica, Polytechnic University of Bari, Via E. Orabona 4, 70125 Bari, Italy
*
Author to whom correspondence should be addressed.
Infrastructures 2024, 9(1), 4; https://doi.org/10.3390/infrastructures9010004
Submission received: 24 November 2023
/
Revised: 18 December 2023
/
Accepted: 20 December 2023
/
Published: 22 December 2023
(This article belongs to the Special Issue Advances in Structural Health Monitoring of the Built Environment)
Abstract
:The aim of the paper is to identify a suitable method for assessing the deformation of structures (buildings, bridges, walls, etc.) by means of topographic measurements of significant targets positioned on the infrastructure under consideration. In particular, the paper describes an approach to testing a bridge in a mixed structure (concrete and steel). The methodological approach developed can be schematised into the following main phases: (i) surveying using total stations (TSs) in order to obtain the spatial coordinates of the targets by means of the three-dimensional intersection technique (planimetric and altimetric measurements); (ii) least-squares compensation for the measurements performed; (iii) displacement analysis; and (iv) statistical evaluation of the reliability of the results. This method was evaluated on a case study of a newly built double-track railway bridge, located near the metropolitan area of the city of Bari, Italy, during various loading and unloading activities. The results obtained, evaluated by means of certain statistical tests, made it possible to verify the structural suitability of the bridge.
1. Introduction
The monitoring of structures plays an important role in the field of civil engineering, especially in the testing phase, as it allows for the verification of its structural behaviour in the different load phases [1,2,3]. The monitoring of civil engineering or buildings can be performed using several geomatics techniques [4,5,6]. For example, Global Navigation Satellite System (GNSS) technology has been widely applied as an essential part of a Structural Health Monitoring (SHM) system [7]. Its first applications in monitoring bridges were carried out by Roberts et al. [8], attaching Ashtech ZXII GPS receivers onto the “Humber Bridge” parapet and gathering and further analysing the resulting 1 Hz Real-Time Kinematic (RTK) GNSS data; in this way, certain authors have performed several experiments on the Humber Bridge (Kingston upon Hull, England), the Millennium Bridge (London, England), the Forth Road Bridge (from Edinburgh to Fife, England), the Severn Suspension Bridge (South West England/South East Wales), and the Avonmouth Viaduct (Avonmouth—Bristol, England). In the literature, several applications based on the GNSS approach have been carried out [9,10]. This is due to the ease of application and the ability to quickly, reliably, and continuously obtain and store data on the structure’s movements. However, GNSS-based approaches require an unobstructed environment to receive satellites; as a result, monitoring certain parts of the structure may not be possible since good satellite coverage cannot be obtained. For this reason, the use of total stations (TSs) is widely used for monitoring structures [11]. In addition, TSs allow for higher precision than satellite techniques, especially in specific parts of infrastructure. With the technological development of increasingly accurate total stations and least-squares adjustment using computer programs, deformation control and monitoring activities become increasingly available and accurate [12].
Costantino et al. [13] discussed about 12 survey campaigns performed using total stations in order to verify the movements of a building located in the city of Lecce (Italy). Lienhart et al. [14] wrote about the monitoring of bridge vibrations using Robotic Total Stations (RTSs); in particular, the authors discussed several methods to increase the measurement frequency of commercially available total stations. Marendić et al. [15] discussed the use of RTSs for measuring displacements in the Sava railway bridge (Croatia). Jankauskiene et al. [16] discussed an analysis of the results achieved by using TSs in the process of diagnostics of the geometrical position of the pier structures built at Klaipeda Seaport (Lithuania). Considering this latest research [11,12,13,14,15,16], it is evident that the use of TSs for the structural monitoring of infrastructures continues to be a useful technology due to the flexibility and precision achievable in the determination of possible displacements. Therefore, the research to be discussed in this paper concerns a topographic approach based on the use of least-squares approach and specific statistical criteria for analysing the measurements performed with the use of TS.
2. Methods
In order to determine and evaluate the displacements and/or deformations of a structure, it is first necessary to carry out a survey with the appropriate topographical instrumentation in order to obtain the spatial coordinates of the targets using the three-dimensional intersection technique (planimetric and altimetric measurements). The values of the topographic measurements obtained during the survey phase are LS-compensated; the reliability of these values, analyses, and results obtained are validated through appropriate statistical tests. The approach used in monitoring with the LS method for the topographic measurements and the statistical analyses for the reliability of the results and observed values are discussed in the following sections.
The following pipeline (Figure 1) describes the operational approach to the verification of the deformation and possible displacement/rotation of the bridge piers by means of topographical survey activities connected to the static testing of this construction.
2.1. Least-Squares Approach to the Topographic Measurements
Topographical monitoring is performed using a TS, which is an electronic/optical instrument that combines an electronic distance measuring (EDM) device with an electronic theodolite and a computer. The TS measures the angle on two planes, the X–Y (horizontal plane) and the X–Z plane (vertical). The EDM measures the slope distance from the prisms it is pointed at, while the on-board computer stores and calculates a large number of values from these three measurements. Two different methods of measurement can be distinguished: “phase shift” and “time of flight” (TOF), also known as “impulse” [17]. In phase shift measurements, by measuring the phase shift between the emitted and received wave, more accurate measurements are obtained but with the disadvantage of reduced ranges. TOF measurements, on the other hand, are characterised by higher ranges but lower accuracy than the previous ones [18]. Consequently, in the monitoring of structures, it is preferred to adopt a phase-based TS. In addition, the TS to be used for monitoring must have a high accuracy in angular and distance measurements. In fact, it is desirable to have a TS with an angular accuracy less than or equal to 1” in order to obtain accurate measurements [19,20]; however, the choice of TS must take into account the order of magnitude of the expected displacements and/or deformations under specific loading conditions and the required specifications in terms of the quality of the results.
The measurements (angles and distances, i.e., the polar coordinates) of the targets positioned on the structure are transformed into Cartesian coordinates. The position of the targets is chosen in relation to the specific parts of the structure to be investigated; furthermore, in order to have redundant and reliable measurements, a scheme similar to the forward intersection scheme is adopted, i.e., each point to be determined must be collimated by at least two vertices, according to the scheme illustrated in Figure 2.
According to the scheme shown in Figure 2, the coordinates of the two vertices are known and, without loss of generality, let us assume that S1 is the origin of the considered reference system. In addition, it is necessary to measure the angles , and the distances , . The target coordinates are determined by means of a plano-altimetric compensation with the implementation of the least-squares approach (see Appendix A).
2.2. Statistical Analysis
The results for the object to be investigated are typically represented by a cluster of points, whose positions are fixed using topographic processing at different epochs. The displacement of the clusters is consequent to any displacement of the points; however, the observed differences should be the same order of magnitude as the observational errors. To this end, it is necessary to perform a series of statistical analyses to reasonably identify significant shifts in each individual control point, generally materialised through reflecting prisms (also called targets). In the present case study, two statistical approaches were applied: the classical approach and the Bayesian approach (Appendix B). Specifically, in the first approach, the data are considered realisations of random variables, and the unknown parameters deterministic. In the second approach, the data are considered constant, and the unknown parameters are considered random variables characterised by . Therefore, the Bayesian approach allows the a priori information of the parameters to be updated and, consequently, the update is reflected in the definition of a .
3. Case Study
The bridge to be tested is located in the Apulia region, Italy (Figure 3a), and was built for the Bari–Taranto railway line. In particular, the structure under investigation is located in the municipality of Bitetto, near the city of Bari (Figure 3b,c). The deck consists of a mixed steel–concrete structure, as shown in Figure 3d.
The bridge consists of a sequence of eight spans with a static scheme of simply supported beams. The central spans have a span of 40 m in the pile axis, while the bank spans have a span of 39 m between the pile axis and the abutment axis.
The verifications were carried out for the testing activities relating to the commissioning of a newly constructed railway bridge. For such verifications, the load is usually applied by means of the transit and stationing at known positions of suitably loaded heavy vehicles whose real weight is certified using electronic weighing or, as in the present case, by means of loads consisting of layers of concrete blocks, each weighing 21 kN (Figure 3e). In accordance with the Italian network guidelines: “Guidelines for the static testing of works of art on a railway line”, which envisage at least one test every five spans, separate load tests were carried out on spans n.2 and n.6.
In order to plan the survey activities, it was necessary to carry out an accurate inspection of the infrastructure to be surveyed and the relative landscape and environmental context into which it is inserted. In fact, in this phase, it is important to precisely define the positions of the station vertices and the points to be surveyed, in order to guarantee optimal visibility between them, excluding all the elements that may possibly create disturbance or interference to the subsequent survey activities.
Regarding the design of the topographical network, the installation of four prisms was planned, two for each span, as shown in Figure 4, with respect to which the reference axes were defined; in particular, the x-axis is identified by the conjunction of the two station vertices, the y-axis normal to that direction, and finally the z-axis, coinciding with the local vertical of the station point.
In general, as a reference system, to measure three-dimensional displacements, a local reference system referring to the topographical field was used, given the minimal planimetric extensions of the structure.
Furthermore, the materialisation of the points to be measured and the station vertices is as such to allow the correct interpretation of the structure’s behaviour in terms of three-dimensional displacements. The materialisation of points includes all those construction operations that allow the various topographical operations to be carried out accurately: pillars for the materialisation of station vertices and the installation of mini prisms on the points to be monitored. For each vertex, it was decided to build a foundation with a square base (1 m × 1 m base and 0.20 m height); a pillar with a circular cross-section (0.20 m diameter, 1.60 m height) was realised on this type of foundation (Figure 5a,b).
In the centre of the top plane of the pillar, an aluminium plate was installed for the fixed anchorage. The plate contains, in its geometric centre, the exact vertical of the station vertex and the invitation for the instrumentation base (Figure 5c).
In the design phase, the targets were located on the structure to ensure visibility from the two station vertices. The targets were materialised on the structural elements of the bridge through the installation of miniature monitoring prisms anchored to the piers (Figure 5d). The survey scheme was carried out in order to perform a rigorous least-squares compensation starting from the two station vertices visible from each other.
The survey was carried out using a total station characterised by an accuracy of 1 mm + 1.5 ppm for the EDM measurements and, thanks to a four-axis compensator, allowed for reliable angular measurements with an angular accuracy of 1” (Table 1).
In order to obtain a functional dataset, each collimation direction was uniquely identified by a pair of numbers consisting of, in order, the station vertex number and the collimated vertex number. In addition, in order for the accuracy of the measurement to depend only on accidental errors, it was necessary to define surveying operating procedures, which consist of carrying out the measurements in a condition where there are no systematic errors. For this reason, the survey was conducted using the methodology of direct and conjugate measurements, allowing the measurements to be averaged and a result unaffected by any systematic errors to be obtained.
Once the topographical operations were completed, the surveyed data were exported in ASCII format in order to carry out subsequent processing in suitably prepared spreadsheets. In particular, the algorithms and processes were implemented in Microsoft Excel, in which the measurements of the azimuth angles (with respect to the instrument zero whose direction, in turn, is treated as an unknown in the problem), distances, zenith angles, and elevation differences, each with the a priori root mean square error (RMS), were reported in precise order. In addition, the approximate coordinates of the points and constraints were assigned, i.e., the coordinates of the known points (coordinates calculated a priori) and the azimuths of the known directions, which define the reference system. Once the input data were defined, it was possible to compensate for the topographical network using the method of least squares. In addition, iteration processes were set up in order to assess the convergence of the results as a function of the error factor. Generally, after three iterations, the result showed convergence.
According to the project for the testing of the structure, the load test of each of the two decks was to be preceded by a 24 h unloaded deck thermal monitoring during which eight reading cycles were to be performed. At the end of the thermal monitoring, the decks were to be loaded and unloaded in 14 steps. Two reading cycles were required for each step. The structure was monitored under different environmental and load conditions. Regarding monitoring under different environmental conditions, referred to as “thermal monitoring”, eight measurement cycles were carried out over a 24 h period under visibility conditions and from the minimum to maximum temperature (temperature range). Specifically, the eight cycles were performed every 3 h starting at 06:00 a.m.
4. Results
The monitoring sessions were carried out taking into account specific planning (see Table 2 and Table 3). Regarding the thermal monitoring that preceded (eight measurement sessions) and concluded (six measurement sessions) the topographical tasks, the relative spatial coordinates of the points investigated, were obtained, as shown in Table 4 for span 6 and Table 5 for span 2.
The results of the several measurements can be summarised in the following tables and, in particular, the data for the span n.6 are summarised in Table 6, Table 7, Table 8, Table 9, Table 10, Table 11, Table 12 and Table 13, while, for span n.2, the data are shown in Table 14, Table 15, Table 16, Table 17, Table 18, Table 19, Table 20 and Table 21.
For each table, the IDs attributed to each reflector relative to each span, the planimetric x and y coordinates, and the relative elevation value, relative to the monitoring base, the origin of the reference system, are shown.
As can be seen from Table 4 and Table 5, no significant changes in displacements were detected during the thermal monitoring.
In terms of the statistical analysis, two different approaches were conducted on the spans under investigation. In particular, the analyses were carried out considering the elaborations performed in the case of zero load and the respective elaborations in the case of the maximum load. The values obtained from the classical statistical approach are shown below (Table 22 and Table 23).
5. Discussion
The analysis of the differences between the coordinates in the different measurement cycles confirmed the displacements intrinsic to the structure and the different phases of the loading/unloading conditions. In fact, the points taken into consideration, relative to each span and to the different piers, show dispersion values contained in the order of a few millimetres, as shown in Figure 6.
From the analysis in Figure 6, it was found that the differences between the different measurement cycles are in the order of a few millimetres. In fact, for span no. 2, 60% of the measurements are below one millimetre, and 40% show a difference of between 1 and 2 mm. On the other hand, for span no. 6, 23% of the measurements are below one millimetre, 36% show a difference of between 1 and 2 mm, 31% show a difference of between 2 and 3 mm, and the remaining 10% show values of more than 3 mm but less than 4 mm. As far as the reliability of the measurements is concerned, for an a priori estimate of the mean and the variance, respectively, equal to = 0.005 and = 0.006, values close to 1 are obtained. Also, by varying the estimate of the mean and variance under worst-case assumptions, it can be seen that the statistics confirm the reliability of the results as the values obtained are, again, close to 1.
The estimates made indicate the reliability of the topographical differences obtained in the different measurement cycles relative to the analysis of the possible displacements of the bridge piers. This approach is necessary in order to validate the data, especially if the displacements can be compared with or exceed the accuracy of the topographic method adopted, which takes instrumental accuracy into account.
6. Conclusions
The proposed method, based on the use of TSs and the calculation of coordinates using the LS approach, made it possible to monitor the displacements of the structure taken into consideration under different loading conditions.
The measurement errors of each planimetric and altimetric compensation are less than one millimetre. In relation to the results obtained, no important displacements of the piles were verified under any loading and unloading conditions. To obtain further confirmation of the metric data acquired and processed, two different types of statistical approaches were conducted. For both approaches, the values obtained confirm the reliability of the results obtained and therefore support the hypothesis of the insignificant displacements and deformations of the analysed infrastructure.
To validate the results of monitoring for deformations and displacements, the statistical approach cannot be ignored, which must take into account the type of structure and any expected movements. Lastly, the paper described the topographical and statistical contribution to the verification of a bridge; this method can also be applied to other infrastructures (dams, buildings, slabs, etc.), guaranteeing the reliability of the results obtained.
Author Contributions
Conceptualisation: M.P., D.C. and V.S.A.; methodology: M.P., D.C. and V.S.A.; software: M.P., D.C. and V.S.A.; formal analysis: M.P., D.C. and V.S.A.; investigation: M.P., D.C. and V.S.A.; writing—original draft: M.P., D.C. and V.S.A.; visualisation: M.P., D.C. and V.S.A. All authors have read and agreed to the published version of the manuscript.
Funding
This research received no external funding.
Data Availability Statement
Data are contained within the article.
Acknowledgments
We want to thank the reviewers for their careful reading of the manuscript and their constructive remarks.
Conflicts of Interest
The authors declare no conflict of interest.
Appendix A. Theoretical Approach to the Method of Least Squares
The methodological approach involves solving the problem separately from a planimetric and altimetric point of view. In particular, for the planimetric resolution, it is necessary to calculate the approximate coordinates of the point P:
After calculating the approximate coordinates of the point P, it is possible to build a system in which the number of equations is greater than the number of unknowns (the coordinates of the targets-xP, yP); consequently, the least-squares principle can be applied [21,22]. From an algebraic point of view, it is possible to write two equations to calculate the approximate direction angles:
and two equations to calculate the approximate distances, as follow:
The system to be solved with LS is [23]:
where:
- A—design matrix;
- x—vector of corrections to be applied to point P
- l0—vector of sample value, i.e., difference between calculated and measured values;
- v—vector of residuals.
Therefore, the LS system (Equation (A4)) becomes:
Since the measurements are characterised by different accuracies, a weight matrix must be taken into consideration, called P, which is the diagonal weight matrix of the observations. While the terms on the diagonal can be expressed in relation to distance, the angles depend only on the angular accuracy of the TS., i.e:
where:
- —a priori weight unit variance and can be set equal to 1;
- —accuracy angle measurement;
- —accuracy distance measurement with reflector.
To solve the system (Equation (A5)), it is necessary to determine the values that minimise the quantity , i.e.:
The system is called a “normal equation system” and, written in matrix form, takes the following form:
where:
- —normal matrix;
- —vector of unknown parameters ;
- —normalised vector of known terms.
Rewriting Equation (A8) with respect to the vector , we have:
In addition, and can be written as follow:
It is now possible to calculate the a posteriori estimate reference variance value:
where:
- m—number of equations, i.e., number of measurements performed (equal to 4, in the case under consideration);
- n—number of unknowns;
- —vector of deviation .
In this way, the new weights with the new value can be set; in an iterative manner, the process is continued until the and values approach each other. The final coordinates of point P are:
Regarding the elevation of point P, it is possible to write two equations related to the height differences obtained from the two station vertices, called S1 and S2:
where:
- , —height of point P measured from station 1 and 2, respectively;
- , —height of station and reflector 1 and 2 (forced centring, i.e., a system that is able to install the TS in the same position during the entire monitoring duration);
- , —the zenith angle measured, respectively, from station 1 and 2.
The approximate value will be obtained by averaging the values calculated with Equation (A13), and therefore can be defined as:
Assuming there is an error in the measurement, the above equation can be written as:
where:
- , —the difference in height between station points (station 1 and 2) and point P measured.
Taking into account Equation (A4), it is possible to write an LS system where the unknown vector is represented by the height and the design matrix. The weights were assigned inversely proportional to distance.
Using Equations (A9) and (A10), it is possible to obtain an estimate of . Therefore, we obtain:
Once the rigorously compensated coordinates of the targets were obtained, it was possible to compare the results obtained with the different measurement campaigns.
Appendix B. Theoretical Approach to Statistical Tests
In classical statistics, it is initially assumed that the compensated coordinates obtained are uncorrelated, both in the spatial domain and in the temporal domain, between different measurement sessions. Furthermore, the point coordinates estimated in the different measurement repetitions are assumed to be:
with a difference equal to:
normally distributed with respective variances equal to:
Based on these assumptions, it is possible to define:
where:
- N—Gaussian distribution;
- —unknowns;
- —known from the least-squares adjustment of the observation.
The null and alternative hypothesis for congruency testing are:
- -
- no significant deformation occurred for a point between two epochs;
- -
- existence of a significant deformation.
The null hypothesis is accepted at the significance level if the test statistic (Equation (A21)) does not exceed the critical threshold of the Z distribution, that is, the standardised random variable, and calculated as:
In particular, in the case study, a significance level of p = 5% was applied, which gave a 1.96 [24].
In order to better discriminate whether the differences in point positions were due to actual shifts or random errors and/or random movements of the control points, the test was applied to the analysed infrastructure [25].
For the application of Bayesian analysis, a simplified approach was adopted by analysing the three coordinates separately (one-dimensional approach), where each individual coordinate, called , is obtained from the compensation procedure at different times. With this approach, the quantities to be considered are the displacements h between the different sessions, referring to all control points :
with:
where represents the variance relative to each coordinate.
Assuming and considering as dependent on the parameter , it is possible to write the Bayes formula as follows:
In the equation above, the function represents the a priori probability distribution of the parameters . Considering a modified version of a normal distribution and the probability of the interval [] being all concentrated in the origin , it is possible to express the probability distribution of as [26]:
where and are the a priori parameters of normal distributions; is the Dirac delta function, which is a generalised function that depends on a real parameter such that it is null for all parameter values except zero; and is the Heaviside step function, which assumes values of:
Based on the previous assumptions, the general formulation can be defined as follows [27]:
with:
where:
- —mean of the variances between two epochs and ;
- m—mean of the displacements in the two epochs;
- —mean value of the coordinate in the two epochs;
- erf—error function.
Analysis of the significance of the motion using the Bayesian approach makes possible the reduction into a comparison of the two equations in (A26). In this case, the interpretation of the results is carried out remembering that in planimetry, the expected accuracies are in the order of a millimetres, while in altimetry, this constitutes sub-millimetres, with a significance level = 5%.
References
- Mazurek, D.F.; DeWolf, J.T. Experimental study of bridge monitoring technique. J. Struct. Eng. 1990, 116, 2532–2549. [Google Scholar] [CrossRef]
- Singh, P.; Mittal, S.; Sadhu, A. Recent Advancements and Future Trends in Indirect Bridge Health Monitoring. Pract. Period. Struct. Des. Constr. 2023, 28, 03122008. [Google Scholar] [CrossRef]
- Xue, C.; Psimoulis, P.A. Monitoring the dynamic response of a pedestrian bridge by using low-cost GNSS receivers. Eng. Struct. 2023, 284, 115993. [Google Scholar] [CrossRef]
- Pehlivan, H. The Analysis Methodology of Robotic Total Station Data for Determination of Structural Displacements. Adv. Geomat. 2021, 1, 1–7. [Google Scholar]
- Tjahjadi, M.E.; Parsamardhani, L.A.; Suhari, K.T. Bridge Structural Deformation Monitoring Using Digital Camera. In IOP Conference Series: Earth and Environmental Science; IOP Publishing: Bristol, UK, 2022; Volume 1051, No. 1; p. 012009. [Google Scholar]
- Trani, M.; Longo, S.; Conti, M. 4D approach for urban tunnelling in a BIM environment. Appl. Geomat. 2023, 15, 333–347. [Google Scholar] [CrossRef]
- Shen, N.; Chen, L.; Liu, J.; Wang, L.; Tao, T.; Wu, D.; Chen, R. A review of global navigation satellite system (GNSS)-based dynamic monitoring technologies for structural health monitoring. Remote Sens. 2019, 11, 1001. [Google Scholar] [CrossRef]
- Roberts, G.W.; Brown, C.J.; Tang, X.; Meng, X.; Ogundipe, O. A Tale of Five Bridges; the use of GNSS for Monitoring the Deflections of Bridges. J. Appl. Geod. 2014, 8, 241–264. [Google Scholar] [CrossRef]
- Yu, J.; Yan, B.; Meng, X.; Shao, X.; Ye, H. Measurement of bridge dynamic responses using network-based real-time kinematic GNSS technique. J. Surv. Eng 2016, 142, 04015013. [Google Scholar] [CrossRef]
- Wang, X.; Zhao, Q.; Xi, R.; Li, C.; Li, G. Review of bridge structural health monitoring based on GNSS: From displacement monitoring to dynamic characteristic identification. IEEE Access 2021, 9, 80043–80065. [Google Scholar] [CrossRef]
- Zhou, H.; Xu, C.; Tang, X.; Wang, S.; Zhang, Z. A Review of Vision-Laser-Based Civil Infrastructure Inspection and Monitoring. Sensors 2022, 22, 5882. [Google Scholar] [CrossRef]
- Beshr, A.A.E.W.; Kaloop, M.R. Monitoring bridge deformation using auto-correlation adjustment technique for total station observation. Sci. Res. 2013, 4, 28338. [Google Scholar] [CrossRef]
- Costantino, D.; Angelini, M.G. Structural monitoring with geodetic survey of Quadrifoglio condominium (Lecce). Int. Arch. Photogramm. Remote Sens. Spat. Inf. Sci. 2013, 5, W3. [Google Scholar] [CrossRef]
- Lienhart, W.; Ehrhart, M.; Grick, M. High frequent total station measurements for the monitoring of bridge vibrations. J. Appl. Geod. 2017, 11, 1–8. [Google Scholar] [CrossRef]
- Marendić, A.; Paar, R.; Damjanović, D. Measurement of bridge dynamic displacements and natural frequencies by RTS. Građevinar 2017, 69, 281–294. [Google Scholar]
- Jankauskiene, D.; Dorosevas, V.; Pukite, V. Monitoring and Analysis of Seaport Piers Structural Elements Displacements. MAPAN 2021, 36, 509–514. [Google Scholar] [CrossRef]
- Alfio, V.S.; Costantino, D.; Pepe, M.; Restuccia Garofalo, A. A Geomatics Approach in Scan to FEM Process Applied to Cultural Heritage Structure: The Case Study of the “Colossus of Barletta”. Remote Sens. 2022, 14, 664. [Google Scholar] [CrossRef]
- Coaker, L.H. Reflector-Less Total Station Measurements and Their Accuracy, Precision and Reliability. Bachelor’s Thesis, University of Southern Queensland, Toowoomba, Australia, October 2009. [Google Scholar]
- Mikhail, E.M. Observations and Least Squares; Mikhail, E.M., Ackermann, F., Eds.; Dun-Donelly: New York, NY, USA, 1976; p. 497. [Google Scholar]
- Azeez, A.K. Deformation monitoring using Total Stations: An evaluation of system performance. J. Geomat. Environ. Res. 2018, 1, 1–13. [Google Scholar]
- How to Use Total Stations Effectively in Deformation Monitoring. Available online: https://blog.hexagongeosystems.com/how-to-use-total-stations-effectively-in-deformation-monitoring/ (accessed on 16 December 2023).
- Balletti, C.; Boscato, G.; Buttolo, V.; Guerra, F.; Russo, S. Integrated topographical and inclinometric procedures for long term monitoring of complex civil structures. In Proceedings of the Architectural, Energy and Information Engineering: Proceedings of the 2015 International Conference on Architectural, Energy and Information Engineering (AEIE 2015), Xiamen, China, 19–20 May 2015. [Google Scholar]
- Frank, S. Elementary Surveying: An Introduction to Geomatics. Surv. Land Inf. Sci. 2002, 62, 136. [Google Scholar]
- Baarda, W. A testing procedure for use in the geodetic network. Neth. Geod. Comm. 1968, 5, 64–71. [Google Scholar]
- Costantino, D.; Angelini, M.G. Geodetic monitoring applied to a mine area. Appl. Geomat. 2011, 3, 61–74. [Google Scholar] [CrossRef]
- Guarnieri, A.; Masiero, A.; Vettore, A.; Pirotti, F. Evaluation of the dynamic processes of a landslide with laser scanners and Bayesian methods. Geomat. Nat. Hazards Risk 2015, 6, 614–634. [Google Scholar] [CrossRef]
- Beyer, W.H. CRC Standard Mathematical Tables, 25th ed.; CRC: Boca Raton, FL, USA, 1987. [Google Scholar]
Figure 1.
Methodological workflow.
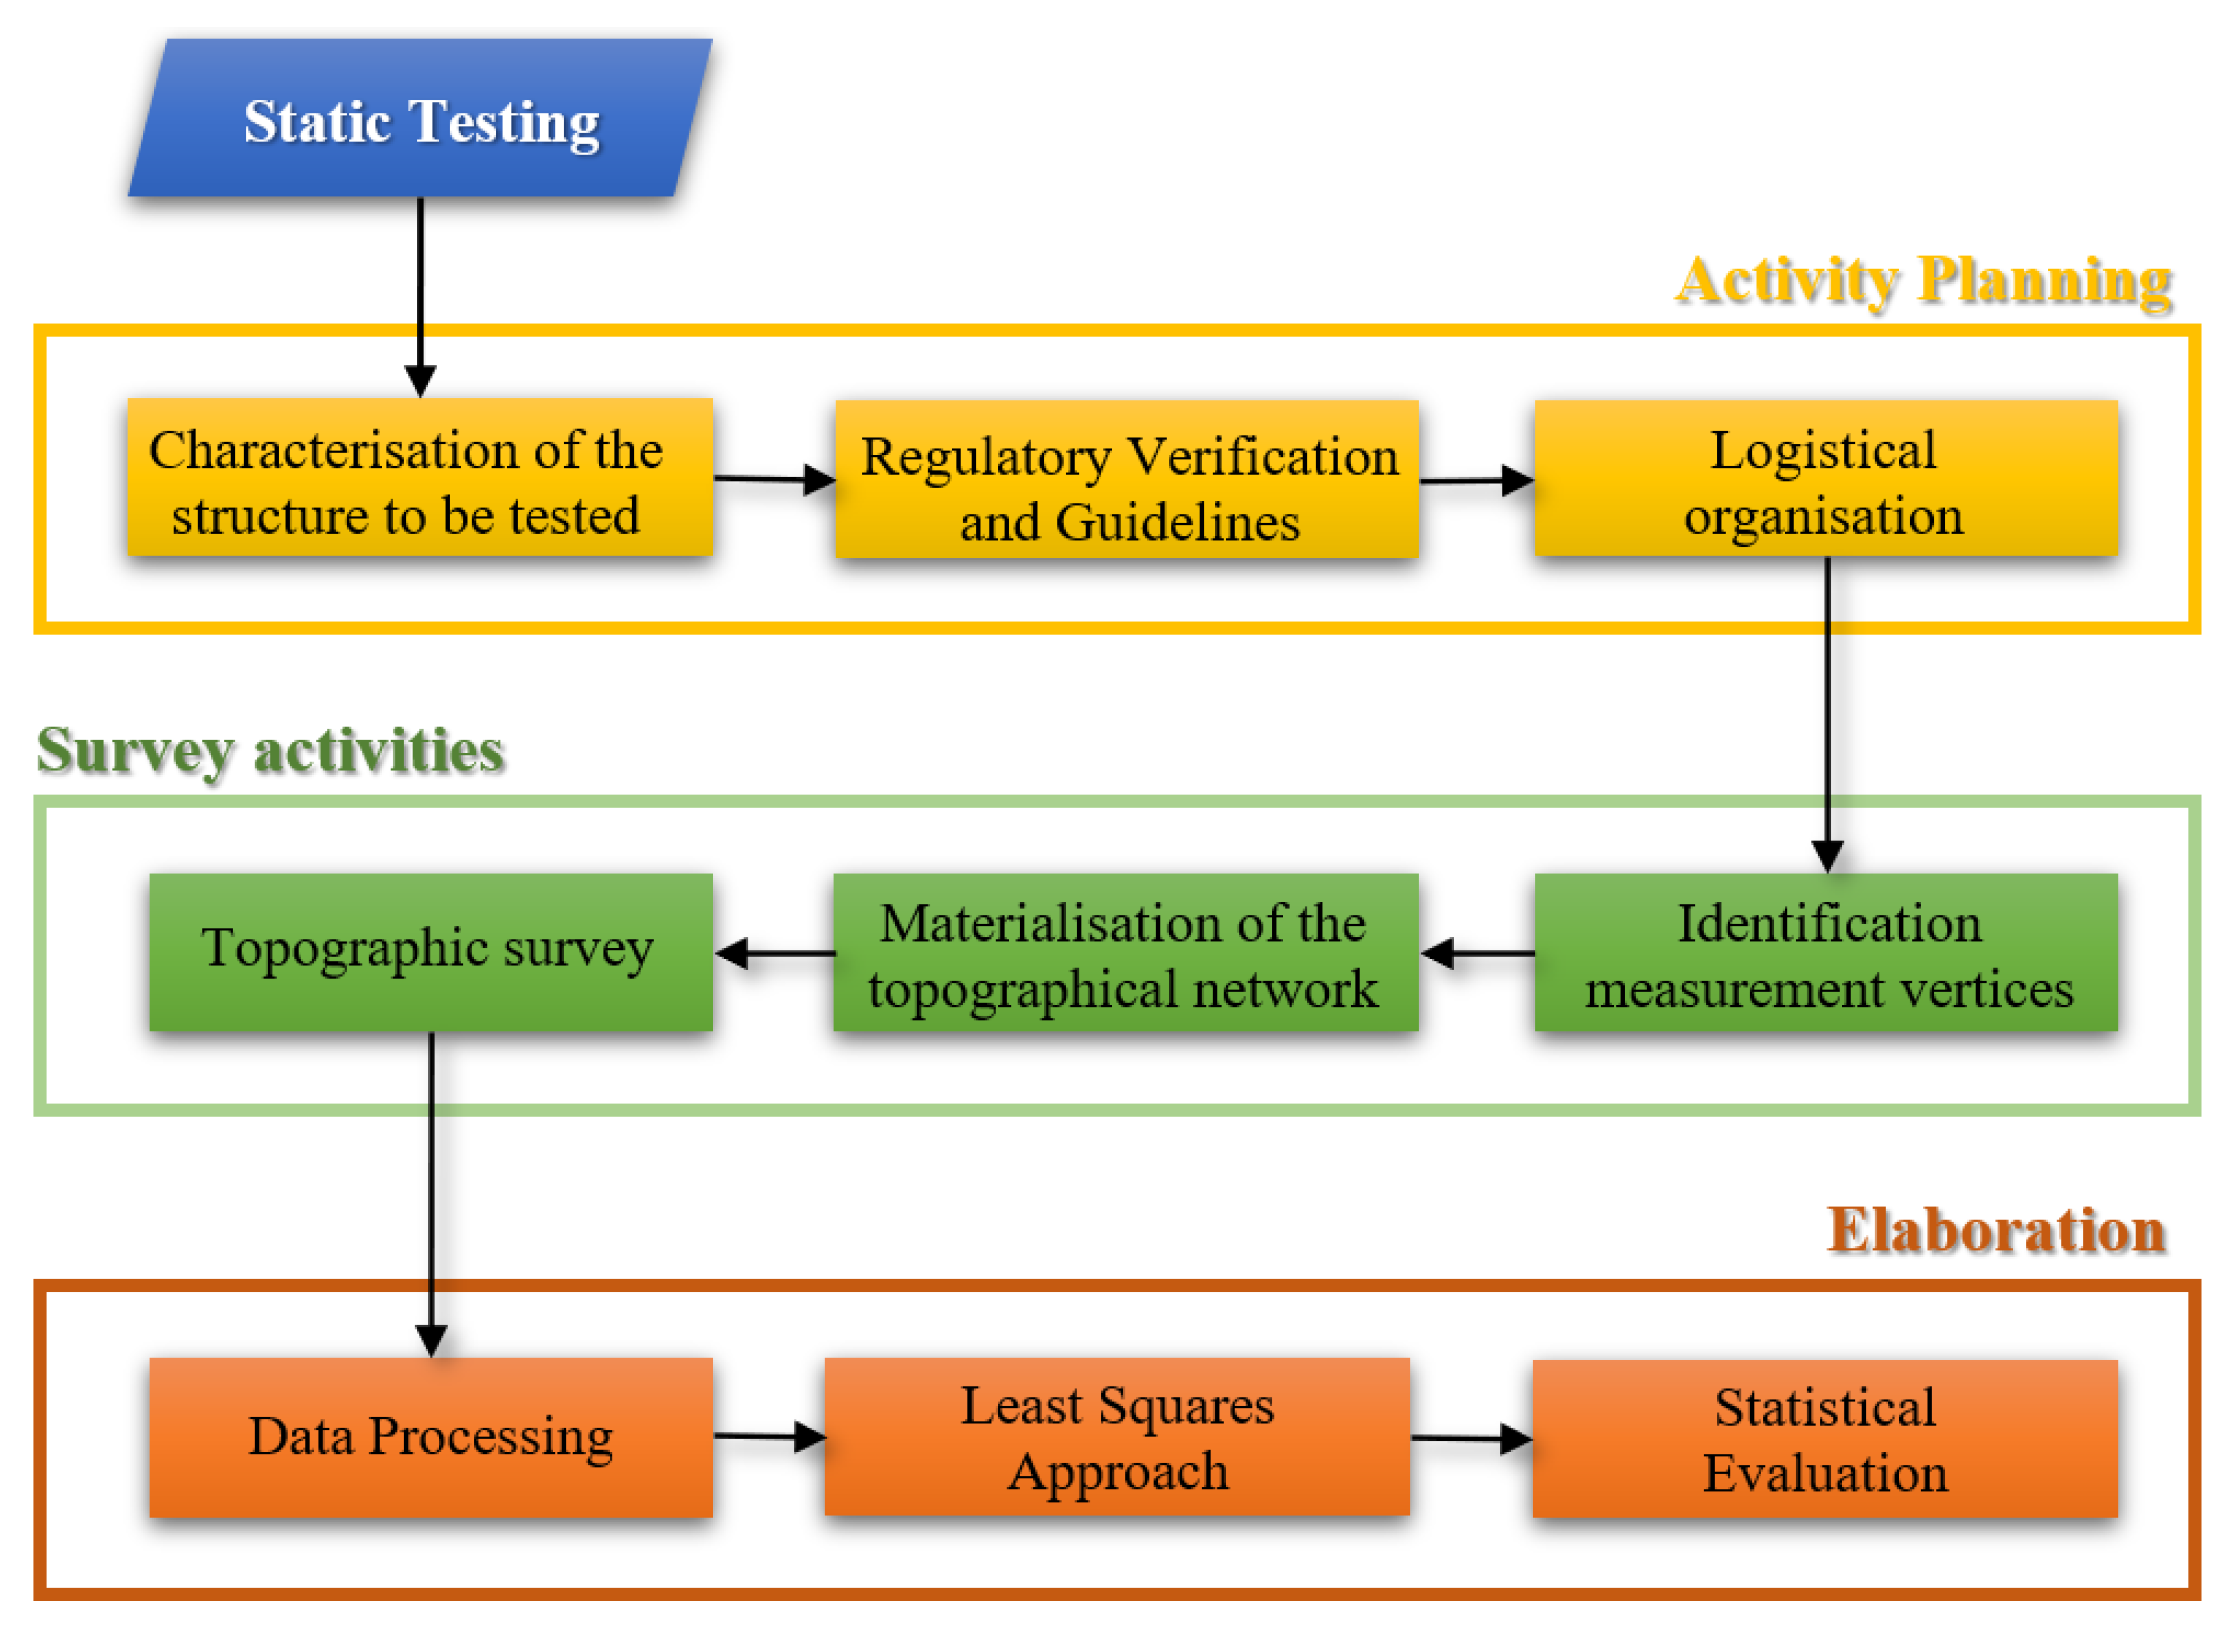
Figure 2.
Acquisition scheme: planimetric (a) and 3D sketch (b).
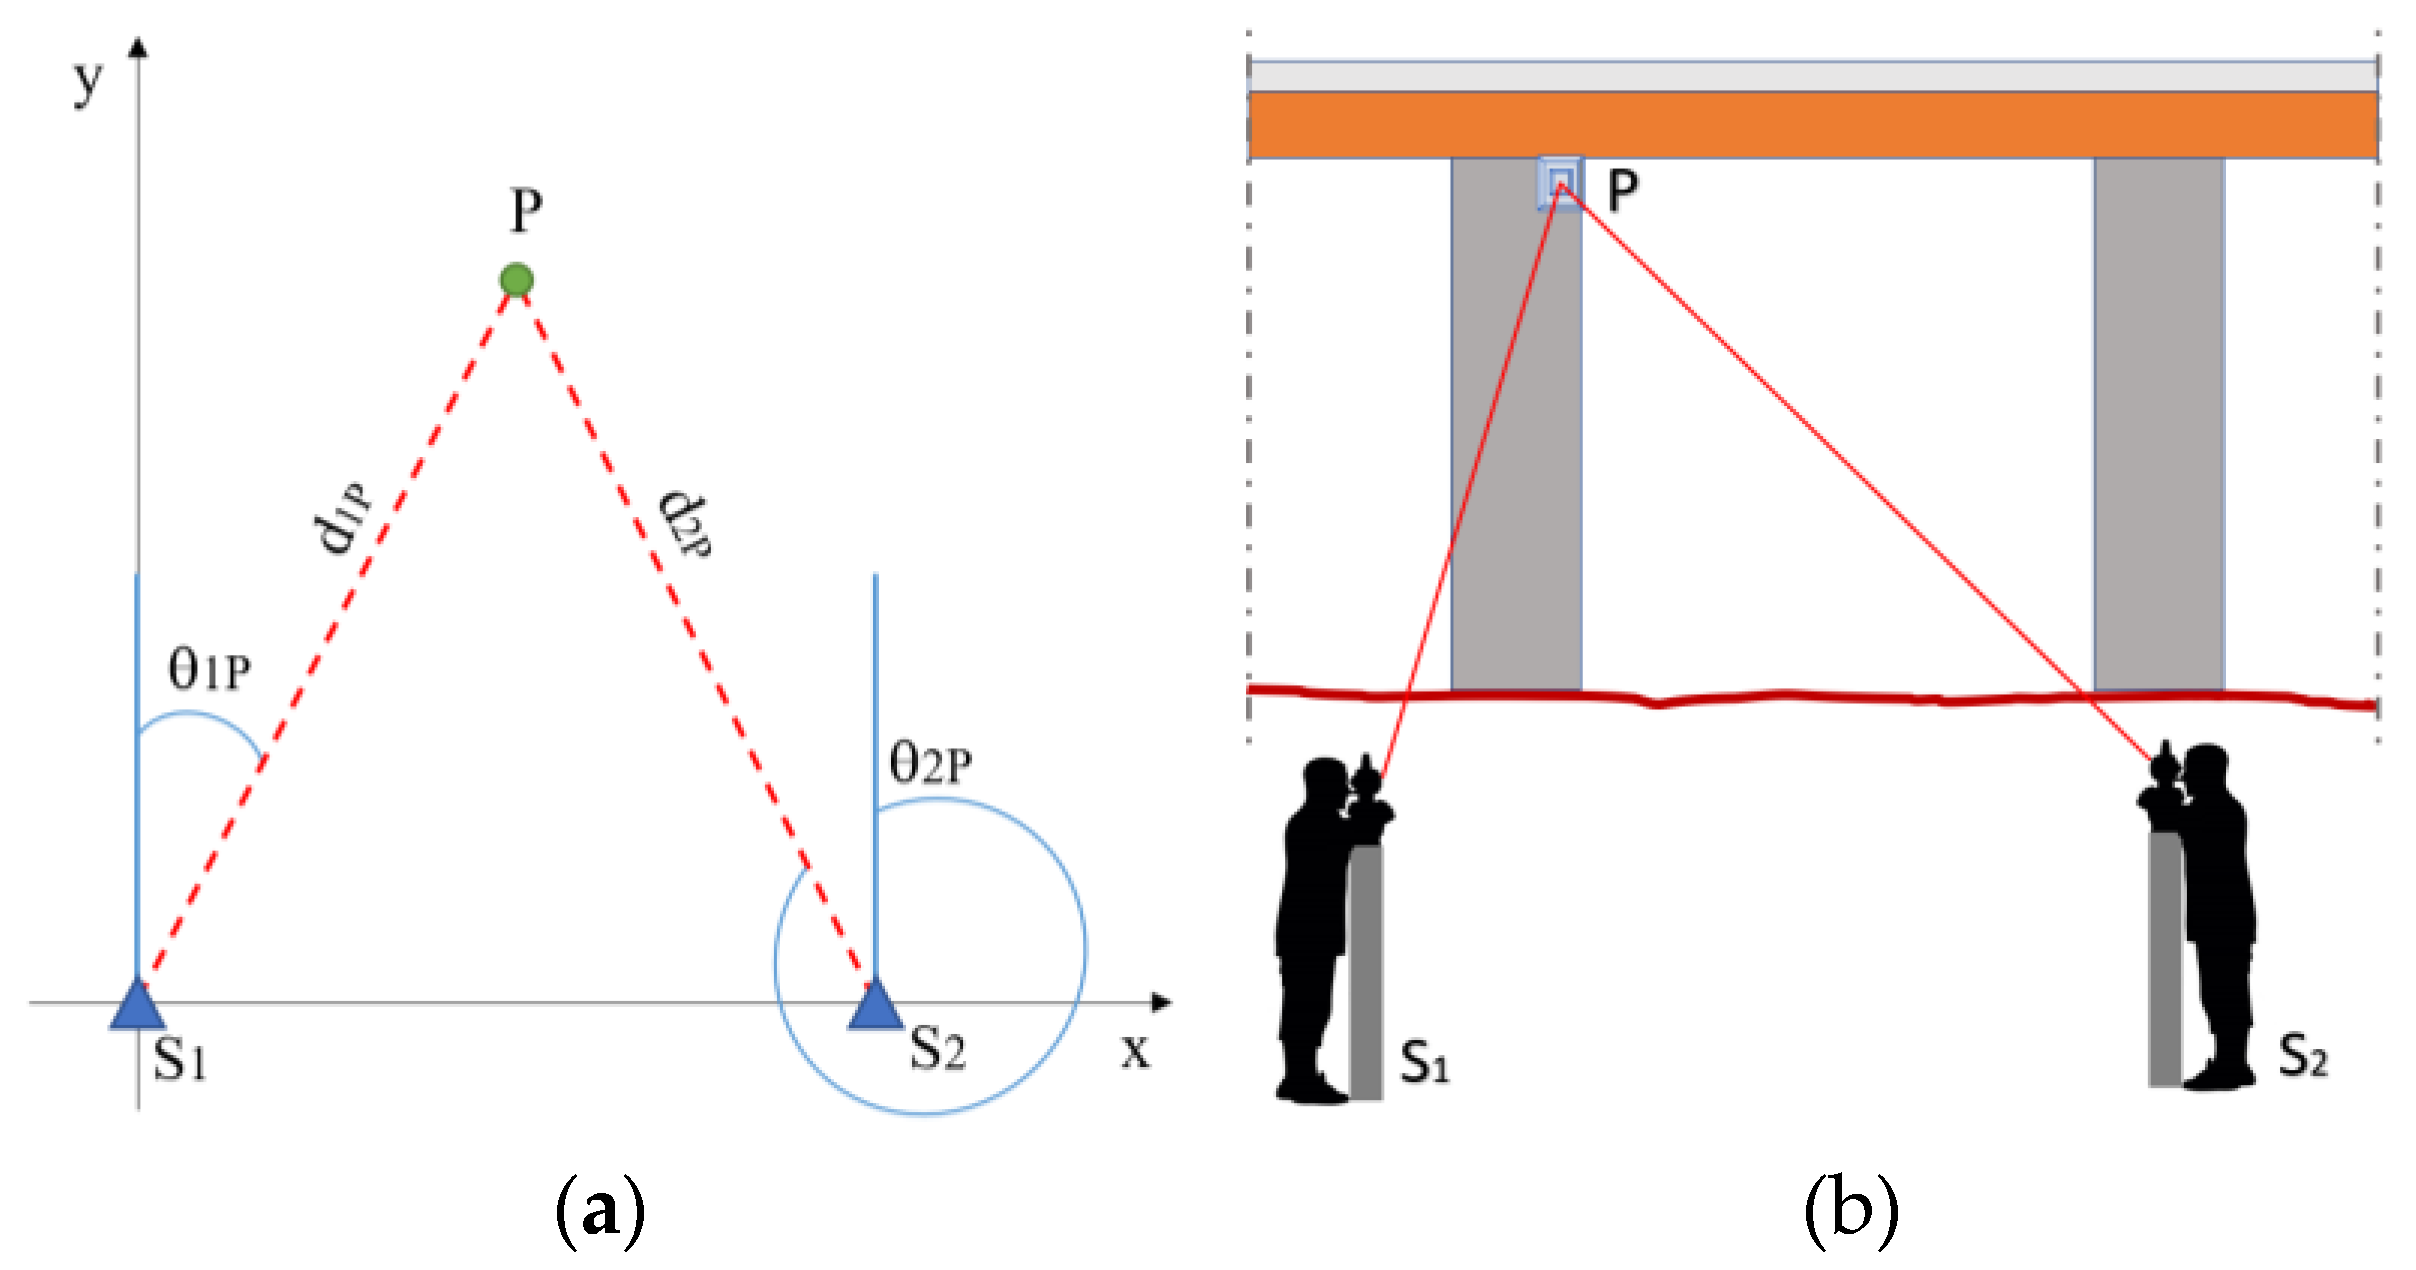
Figure 3.
Bridge under investigation: keymap (a), orthophoto of the study area indicated in red circle (b) orthophoto of infrastructure (c), view of the bridge (d), survey activities during loading and unloading of the bridge (e).
Figure 3.
Bridge under investigation: keymap (a), orthophoto of the study area indicated in red circle (b) orthophoto of infrastructure (c), view of the bridge (d), survey activities during loading and unloading of the bridge (e).
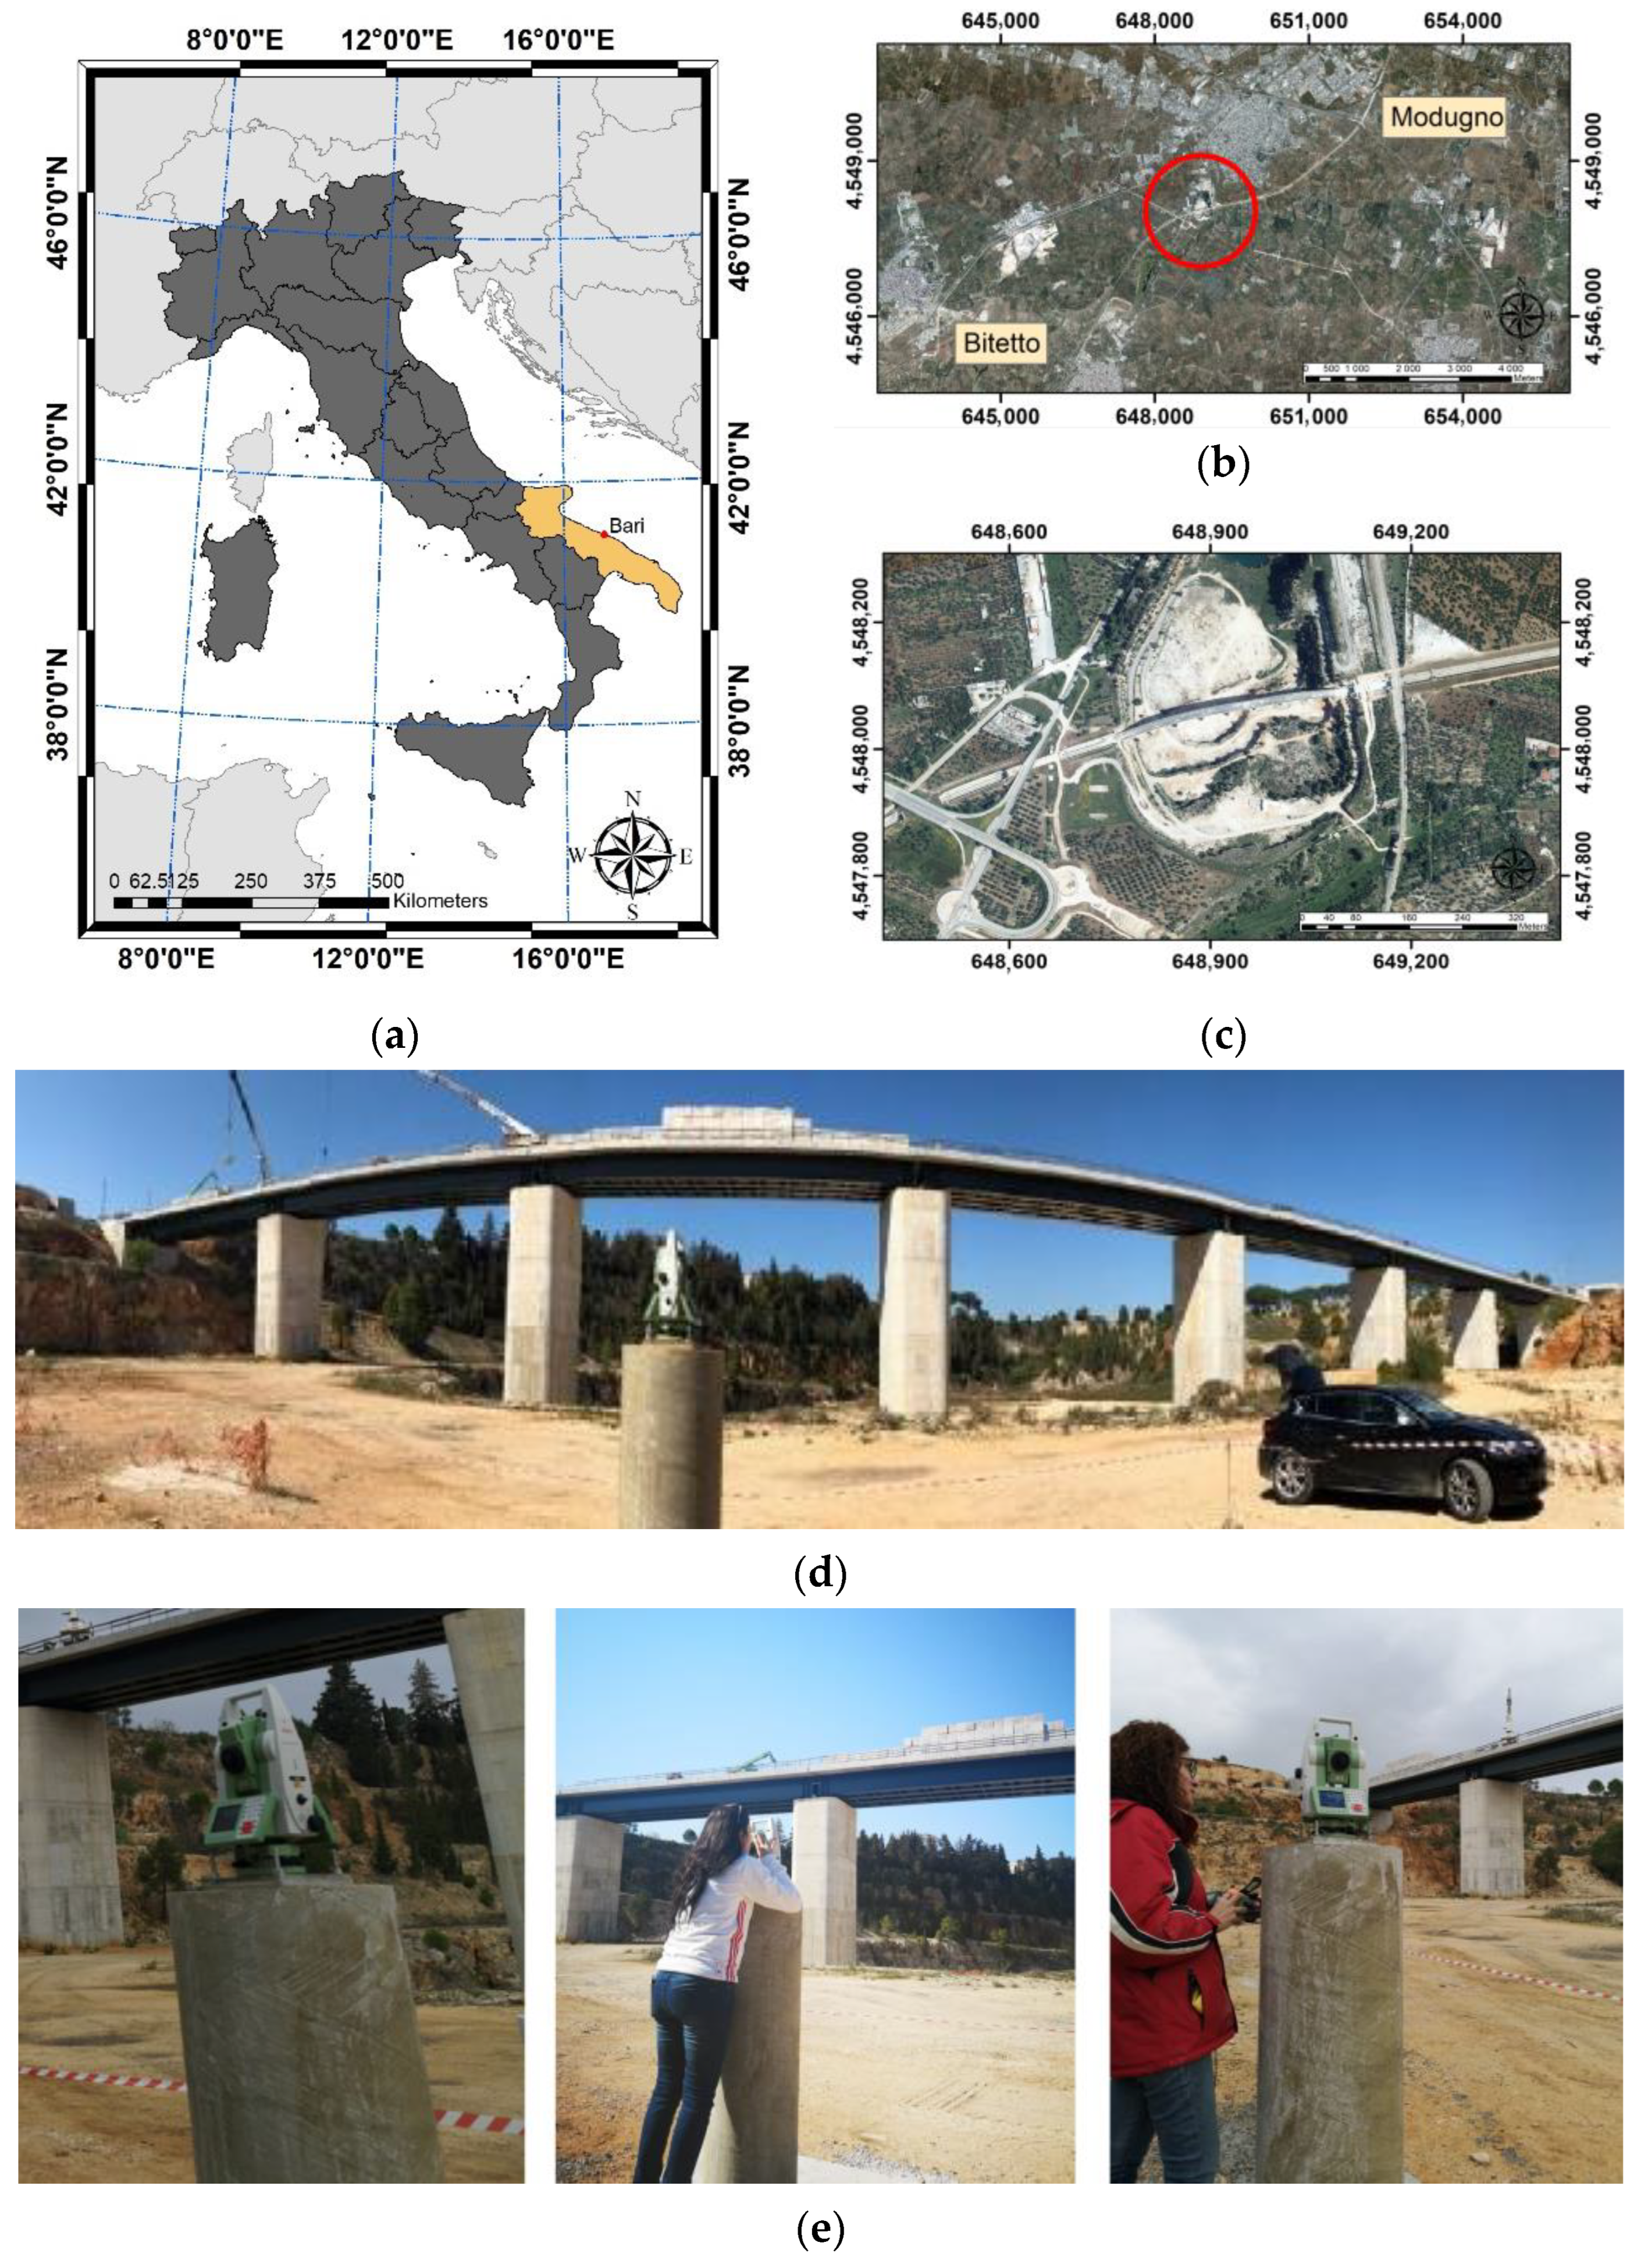
Figure 4.
Sketch of the topographical network.
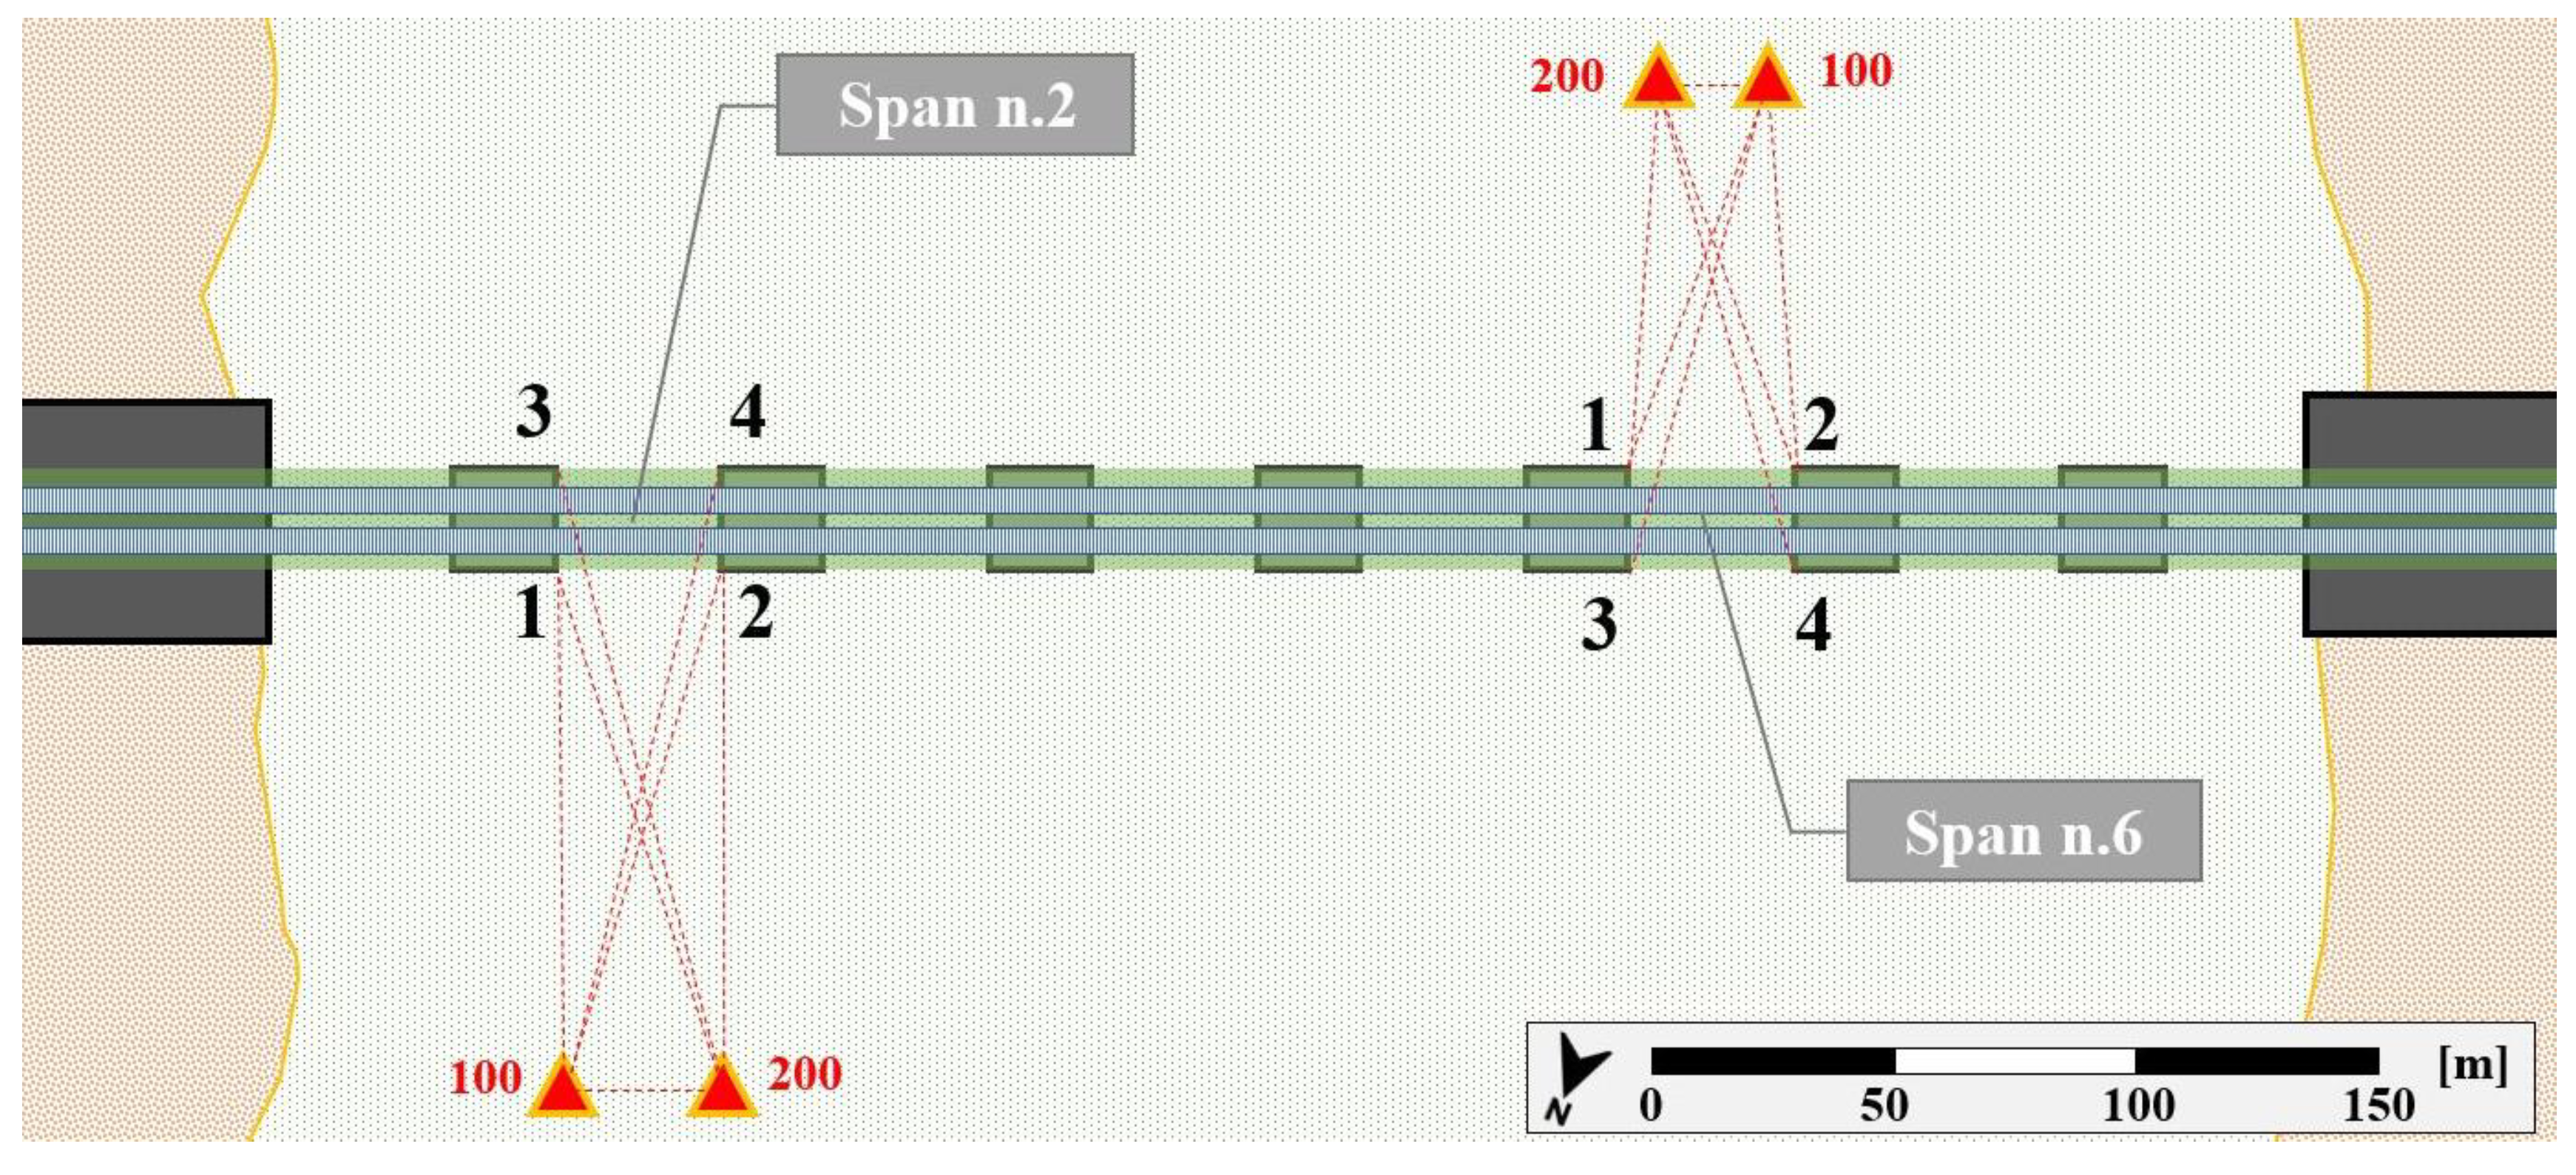
Figure 5.
Materialisation of the vertex: design (a), on-site realisation (b), aluminium plate for the fixed anchorage, housing for the plinth (c), monitoring prism used (d).
Figure 5.
Materialisation of the vertex: design (a), on-site realisation (b), aluminium plate for the fixed anchorage, housing for the plinth (c), monitoring prism used (d).

Figure 6.
Scatter plot of the differences obtained in the several measurement cycles: span n.6 (a) and span n.2 (b).
Figure 6.
Scatter plot of the differences obtained in the several measurement cycles: span n.6 (a) and span n.2 (b).


Table 1.
Technical characteristics of the total station TS11.
| Image | Angle Measurement | |
|---|---|---|
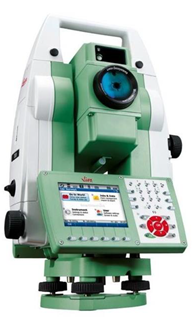 Leica Viva TS11 | Accuracy | 1″ (0.3 mgon) |
| Method | Absolute, continuous, diametrical | |
| Compensator setting accuracy | Quadruple-axis compensation | |
| Distance Measurement with Reflector | ||
| Range round prism | 3500 m | |
| Accuracy | Standard: 1.0 mm + 1.5 ppm Fast: 2.0 mm + 1.5 ppm Tracking: 3.0 mm + 1.5 ppm | |
| Measurement time | 1.0 s | |
| Enhanced measurement accuracy to prism | 1.0 mm + 1.5 ppm | |
| Distance Measurement without Reflector | ||
| Range PinPoint R1000 | >1000 m | |
| Accuracy | 2 mm + 2 ppm | |
Table 2.
Load test span n.6.
| Step n° | Date | Time I° Session | Time II° Session |
|---|---|---|---|
| 0 (Zero Load) | Day 2 | 09:30 | 10:00 |
| 2 (1/3 Load) | Day 3 | 06:45 | 07:15 |
| 6 (2/3 Load) | Day 3 | 13:45 | 14:30 |
| 10 (Max Load) | Day 4 | 10:00 | 10:30 |
| 10 (Max Load) | Day 5 | 07:00 | 07:30 |
| 6 (2/3 Load) | Day 5 | 15:15 | 15:50 |
| 2 (1/3 Load) | Day 6 | 09:30 | 11:20 |
| 0 (Zero Load) | Day 7 | 09:40 | 10:10 |
Table 3.
Load test span n.2.
| Step n° | Date | Time I° Session | Time II° Session |
|---|---|---|---|
| 0 (Zero Load) | Day 7 | 12:10 | 12:50 |
| 0 (Zero Load) | Day 7 | 16:00 | 16:30 |
| 2 (1/3 Load) | Day 8 | 09:30 | 10:15 |
| 6 (2/3 Load) | Day 8 | 17:15 | 17:45 |
| 10 (Max Load) | Day 9 | 11:30 | 12:30 |
| 6 (2/3 Load) | Day 10 | 08:30 | 09:00 |
| 2 (1/3 Load) | Day 11 | 09:45 | 10:30 |
| 0 (Zero Load) | Day 11 | 15:15 | 15:45 |
Table 4.
Thermal monitoring—span n.6.
| ID | Day 1–Cycle 1 | Day 1–Cycle 2 | Day 1–Cycle 3 | Day 1–Cycle 4 | ||||||||
| x [m] | y [m] | Q [m] | x [m] | y [m] | Q [m] | x [m] | y [m] | Q [m] | x [m] | y [m] | Q [m] | |
| 1 | 58.235 | −10.373 | 15.681 | 58.235 | −10.373 | 15.681 | 58.235 | −10.373 | 15.681 | 58.233 | −10.373 | 15.682 |
| 2 | 65.040 | −10,214 | 15.603 | 65.040 | −10.214 | 15.603 | 65.040 | −10.214 | 15.603 | 65.039 | −10.213 | 15.603 |
| 3 | 63.906 | 23.665 | 16.173 | 63.906 | 23.665 | 16.173 | 63.906 | 23.665 | 16.173 | 63.905 | 23.665 | 16.173 |
| 4 | 57.112 | 23.359 | 16.216 | 57.112 | 23.359 | 16.216 | 57.112 | 23.359 | 16.216 | 57.111 | 23.358 | 16.216 |
| ID | Day 1–Cycle 5 | Day 1–Cycle 6 | Day 2–Cycle 7 | Day 2–Cycle 8 | ||||||||
| x [m] | y [m] | Q [m] | x [m] | y [m] | Q [m] | x [m] | y [m] | Q [m] | x [m] | y [m] | Q [m] | |
| 1 | 58.233 | −10.373 | 15.681 | 58.235 | −10.373 | 15.681 | 58.233 | −10.373 | 15.681 | 58.235 | −10.373 | 15.681 |
| 2 | 65.039 | −10.213 | 15.603 | 65.040 | −10.214 | 15.602 | 65.040 | −10.214 | 15.603 | 65.040 | −10.214 | 15.603 |
| 3 | 63.905 | 23.665 | 16.173 | 63.906 | 23.665 | 16.173 | 63.906 | 23.665 | 16.173 | 63.906 | 23.665 | 16.173 |
| 4 | 57.111 | 23.358 | 16.216 | 57.112 | 23.359 | 16.215 | 57.112 | 23.359 | 16.216 | 57.112 | 23.359 | 16.216 |
Table 5.
Thermal monitoring—span n.2.
| ID | Day 13–Cycle 17 | Day 13–Cycle 18 | Day 13–Cycle 19 | |||||||
| x [m] | y [m] | Q [m] | x [m] | y [m] | Q [m] | x [m] | y [m] | Q [m] | ||
| 1 | 85.458 | −9.060 | 24.605 | 85.457 | −9.060 | 24,605 | 85.458 | −9.059 | 24.605 | |
| 2 | 92.227 | −8.705 | 24.521 | 92.227 | −8.705 | 24.521 | 92.227 | −8.705 | 24.521 | |
| 3 | 90.856 | 25.035 | 24.006 | 90.856 | 25.035 | 24.006 | 90.856 | 25.035 | 24.006 | |
| 4 | 83.891 | 24.785 | 24.171 | 83.891 | 24.785 | 24.171 | 83.891 | 24.785 | 24.171 | |
| ID | Day 14–Cycle 20 | Day 14–Cycle 21 | Day 14–Cycle 22 | |||||||
| x [m] | y [m] | Q [m] | x [m] | y [m] | Q [m] | x [m] | y [m] | Q [m] | ||
| 1 | 85.459 | −9.060 | 24.605 | 85.458 | −9.060 | 24.605 | 85.458 | −9.060 | 24.605 | |
| 2 | 92.227 | −8.705 | 24.521 | 92.227 | −8.705 | 24.521 | 92.226 | −8.705 | 24.521 | |
| 3 | 90.856 | 25.035 | 24.005 | 90.856 | 25.035 | 24.006 | 90.856 | 25.035 | 24.006 | |
| 4 | 83.890 | 24.785 | 24.171 | 83.891 | 24.785 | 24.171 | 83.891 | 24.785 | 24.171 | |
Table 6.
Load test step 0—span n.6.
| ID | Day 2–Cycle 9 | Day 2–Cycle 10 | ||||
|---|---|---|---|---|---|---|
| x [m] | y [m] | Q [m] | x [m] | y [m] | Q [m] | |
| 1 | 58.234 | −10.373 | 15.681 | 58.233 | −10.372 | 15.681 |
| 2 | 65.041 | −10.214 | 15.603 | 65.041 | −10.214 | 15.603 |
| 3 | 63.906 | 23.665 | 16.173 | 63.906 | 23.665 | 16.173 |
| 4 | 57.112 | 23.359 | 16.216 | 57.112 | 23.359 | 16.216 |
Table 7.
Load test step 2—span n.6.
| ID | Day 3–Cycle 11 | Day 3–Cycle 12 | ||||
|---|---|---|---|---|---|---|
| x [m] | y [m] | Q [m] | x [m] | y [m] | Q [m] | |
| 1 | 58.233 | −10.373 | 15.683 | 58.233 | −10.373 | 15.678 |
| 2 | 65.039 | −10.213 | 15.602 | 65.039 | −10.213 | 15.602 |
| 3 | 63.905 | 23.665 | 16.173 | 63.905 | 23.665 | 16.170 |
| 4 | 57.111 | 23.358 | 16.216 | 57.111 | 23.358 | 16.215 |
Table 8.
Load test step 6—span n.6.
| ID | Day 3–Cycle 13 | Day 3–Cycle 14 | ||||
|---|---|---|---|---|---|---|
| x [m] | y [m] | Q [m] | x [m] | y [m] | Q [m] | |
| 1 | 58.233 | −10.373 | 15.680 | 58.233 | −10.373 | 15.681 |
| 2 | 65.039 | −10.213 | 15.603 | 65.039 | −10.213 | 15.602 |
| 3 | 63.905 | 23.665 | 16.173 | 63.905 | 23.665 | 16.173 |
| 4 | 57.111 | 23.358 | 16.216 | 57.111 | 23.358 | 16.215 |
Table 9.
Load test step 10—span n.6.
| ID | Day 4–Cycle 15 | Day 4–Cycle 16 | ||||
|---|---|---|---|---|---|---|
| x [m] | y [m] | Q [m] | x [m] | y [m] | Q [m] | |
| 1 | 58.233 | −10.373 | 15.681 | 58.233 | −10.373 | 15.681 |
| 2 | 65.039 | −10.213 | 15.604 | 65.039 | −10.213 | 15.603 |
| 3 | 63.905 | 23.665 | 16.172 | 63.905 | 23.665 | 16.173 |
| 4 | 57.111 | 23.358 | 16.216 | 57.111 | 23.358 | 16.216 |
Table 10.
Load test step 10—span n.6.
| ID | Day 4–Cycle 17 | Day 4–Cycle 18 | ||||
|---|---|---|---|---|---|---|
| x [m] | y [m] | Q [m] | x [m] | y [m] | Q [m] | |
| 1 | 58.233 | −10.373 | 15.681 | 58.233 | −10.373 | 15.681 |
| 2 | 65.039 | −10.213 | 15.602 | 65.039 | −10.213 | 15.602 |
| 3 | 63.905 | 23.665 | 16.173 | 63.905 | 23.665 | 16.173 |
| 4 | 57.111 | 23.358 | 16.216 | 57.111 | 23.358 | 16.216 |
Table 11.
Load test step 6—span n.6.
| ID | Day 5–Cycle 19 | Day 5–Cycle 20 | ||||
|---|---|---|---|---|---|---|
| x [m] | y [m] | Q [m] | x [m] | y [m] | Q [m] | |
| 1 | 58.233 | −10.373 | 15.681 | 58.232 | −10.373 | 15.681 |
| 2 | 65.039 | −10.213 | 15.602 | 65.038 | −10.213 | 15.602 |
| 3 | 63.905 | 23.665 | 16.173 | 63.903 | 23.664 | 16.173 |
| 4 | 57,111 | 23.358 | 16.216 | 57.111 | 23.358 | 16.216 |
Table 12.
Load test step 2—span n.6.
| ID | Day 6–Cycle 21 | Day 6–Cycle 22 | ||||
|---|---|---|---|---|---|---|
| x [m] | y [m] | Q [m] | x [m] | y [m] | Q [m] | |
| 1 | 58.233 | −10.373 | 15.680 | 58.233 | −10.373 | 15.680 |
| 2 | 65.039 | −10.213 | 15.603 | 65.039 | −10.213 | 15.603 |
| 3 | 63.905 | 23.665 | 16.173 | 63.905 | 23.665 | 16.173 |
| 4 | 57.111 | 23.358 | 16.216 | 57.111 | 23.358 | 16.216 |
Table 13.
Load test step 0—span n.6.
| ID | Day 7–Cycle 23 | Day 7–Cycle 24 | ||||
|---|---|---|---|---|---|---|
| x [m] | y [m] | Q [m] | x [m] | y [m] | Q [m] | |
| 1 | 58.232 | −10.373 | 15.680 | 58.232 | −10.373 | 15.681 |
| 2 | 65.038 | −10.213 | 15.603 | 65.038 | −10.213 | 15.603 |
| 3 | 63.903 | 23.664 | 16.172 | 63.903 | 23.664 | 16.171 |
| 4 | 57.110 | 23.358 | 16.216 | 57.110 | 23.358 | 16.217 |
Table 14.
Load test step 0—span n.2.
| ID | Day 7–Cycle 1 | Day 7–Cycle 2 | ||||
|---|---|---|---|---|---|---|
| x [m] | y [m] | Q [m] | x [m] | y [m] | Q [m] | |
| 1 | 85.458 | −9.060 | 24.605 | 85.458 | −9.060 | 24.605 |
| 2 | 92.227 | −8.705 | 24.521 | 92.227 | −8.705 | 24.521 |
| 3 | 90.856 | 25.035 | 24.006 | 90.856 | 25.035 | 24.006 |
| 4 | 83.890 | 24.785 | 24.171 | 83.890 | 24.785 | 24.171 |
Table 15.
Load test step 0—span n.2.
| ID | Day 7–Cycle 3 | Day 7–Cycle 4 | ||||
|---|---|---|---|---|---|---|
| x [m] | y [m] | Q [m] | x [m] | y [m] | Q [m] | |
| 1 | 85.459 | −9.060 | 24.605 | 85.458 | −9.060 | 24.605 |
| 2 | 92.227 | −8.705 | 24.521 | 92.227 | −8.705 | 24.521 |
| 3 | 90.856 | 25.035 | 24.006 | 90.856 | 25.035 | 24.006 |
| 4 | 83.891 | 24.785 | 24.171 | 83.891 | 24.785 | 24.171 |
Table 16.
Load test step 2—span n.2.
| ID | Day 8–Cycle 5 | Day 8–Cycle 6 | ||||
|---|---|---|---|---|---|---|
| x [m] | y [m] | Q [m] | x [m] | y [m] | Q [m] | |
| 1 | 85.458 | −9.060 | 24.605 | 85.459 | −9.060 | 24.605 |
| 2 | 92.227 | −8.705 | 24.521 | 92.227 | −8.705 | 24.521 |
| 3 | 90.856 | 25.035 | 24.006 | 90.856 | 25.035 | 24.006 |
| 4 | 83.891 | 24.785 | 24.171 | 8.891 | 24.785 | 24.171 |
Table 17.
Load test step 6—span n.2.
| ID | Day 8–Cycle 7 | Day 8–Cycle 8 | ||||
|---|---|---|---|---|---|---|
| x [m] | y [m] | Q [m] | x [m] | y [m] | Q [m] | |
| 1 | 85.458 | −9.060 | 24.605 | 85.459 | −9.060 | 24.605 |
| 2 | 92.228 | −8.705 | 24.521 | 92.227 | −8.705 | 24.521 |
| 3 | 90.856 | 25.035 | 24.006 | 90.856 | 25.035 | 24.006 |
| 4 | 83.891 | 24.785 | 24.171 | 83.891 | 24.785 | 24.171 |
Table 18.
Load test step 10—span n.2.
| ID | Day 9–Cycle 9 | Day 9–Cycle 10 | ||||
|---|---|---|---|---|---|---|
| x [m] | y [m] | Q [m] | x [m] | y [m] | Q [m] | |
| 1 | 85.458 | −9.060 | 24.605 | 85.458 | −9.060 | 24.605 |
| 2 | 92.227 | −8.705 | 24,521 | 92.226 | −8.705 | 24.521 |
| 3 | 90.857 | 25.035 | 24.006 | 90.856 | 25.035 | 24.006 |
| 4 | 83.891 | 24.785 | 24.171 | 83.890 | 24.785 | 24.171 |
Table 19.
Load test step 6—span n.2.
| ID | Day 10–Cycle 11 | Day 10–Cycle 12 | ||||
|---|---|---|---|---|---|---|
| x [m] | y [m] | Q [m] | x [m] | y [m] | Q [m] | |
| 1 | 85.459 | −9.060 | 24.605 | 85.458 | −9.060 | 24,605 |
| 2 | 92.227 | −8.705 | 24.521 | 92.227 | −8.705 | 24.521 |
| 3 | 90.856 | 25.035 | 24.006 | 90.856 | 25.035 | 24.006 |
| 4 | 83.890 | 24.785 | 24.171 | 83.890 | 24.785 | 24.171 |
Table 20.
Load test step 2—span n.2.
| ID | Day 11–Cycle 13 | Day 11–Cycle 14 | ||||
|---|---|---|---|---|---|---|
| x [m] | y [m] | Q [m] | x [m] | y [m] | Q [m] | |
| 1 | 85.460 | −9.060 | 24.605 | 85.459 | −9060 | 24,605 |
| 2 | 92.227 | −8.705 | 24.521 | 92.228 | −8.705 | 24.521 |
| 3 | 90.856 | 25.035 | 24.006 | 90.856 | 25.035 | 24.006 |
| 4 | 83.891 | 24.785 | 24.171 | 83.891 | 24.785 | 24.171 |
Table 21.
Load test step 0—span n.2.
| ID | Day 11–Cycle 15 | Day 11–Cycle 16 | ||||
|---|---|---|---|---|---|---|
| x [m] | y [m] | Q [m] | x [m] | y [m] | Q [m] | |
| 1 | 85.459 | −9.060 | 24.605 | 85.459 | −9060 | 24.605 |
| 2 | 92.226 | −8.705 | 24.521 | 92.227 | −8.705 | 24.521 |
| 3 | 90.856 | 25.035 | 24.006 | 90.856 | 25.035 | 24.006 |
| 4 | 83.891 | 24.785 | 24.171 | 83.890 | 24.785 | 24.171 |
Table 22.
Ztest of span n.6.
| ID | Day 2–Day 5 | |||||
|---|---|---|---|---|---|---|
| [m] | [m] | [m] | ||||
| 1 | 0.0001 | 0.0002 | 0.0003 | 0.997 | 0.998 | 0.968 |
| 2 | 0.0014 | 0.0002 | 0.0016 | 0.587 | 0.977 | 0.635 |
| 3 | 0.0013 | 0.0005 | 0.0016 | 1.298 | 2.678 | 0.618 |
| 4 | 0.0013 | 0.0005 | 0.0003 | 0.847 | 0.042 | 0.977 |
Table 23.
Ztest of span n.2.
| ID | Day 7–Day 9 | |||||
|---|---|---|---|---|---|---|
| [m] | [m] | [m] | ||||
| 1 | 0.0001 | 0.0000 | 0.0000 | 0.999 | 1.000 | 1.000 |
| 2 | 0.0006 | 0.0002 | 0.0000 | 0.859 | 0.988 | 1.000 |
| 3 | 0.0002 | 0.0001 | 0.0000 | 4.851 | 2.992 | 1.100 |
| 4 | 0.0003 | 0.0001 | 0.0000 | 0.988 | 0.251 | 1.000 |
Table 24.
Bayesian analysis with prior data ( = 0.005; = 0.006) of span n.6.
| ID | Day 2–Day 5 | ||
|---|---|---|---|
| 1 | 1.000 | 1.000 | 1.000 |
| 2 | 0.998 | 1.000 | 1.000 |
| 3 | 0.996 | 1.000 | 1.000 |
| 4 | 0.999 | 1.000 | 1.000 |
Table 25.
Bayesian analysis with prior data ( = 0.010; = 0.006) of span n.6.
| ID | Day 2–Day 5 | ||
|---|---|---|---|
| 1 | 1.000 | 1.000 | 1.000 |
| 2 | 0.995 | 1.000 | 1.000 |
| 3 | 0.993 | 0.999 | 1.000 |
| 4 | 0.998 | 1.000 | 1.000 |
Table 26.
Bayesian analysis with prior data ( = 0.008; = 0.006) of span n.6.
| ID | Day 2–Day 5 | ||
|---|---|---|---|
| 1 | 1.000 | 1.000 | 1.000 |
| 2 | 0.995 | 1.000 | 1.000 |
| 3 | 0.993 | 0.999 | 1.000 |
| 4 | 0.998 | 1.000 | 1.000 |
Table 27.
Bayesian analysis with prior data ( = 0.005; 0.006) of span n.2.
| ID | Day 2–Day 5 | ||
|---|---|---|---|
| 1 | 1.000 | 1.000 | 1.000 |
| 2 | 0.998 | 1.000 | 1.000 |
| 3 | 0.996 | 1.000 | 1.000 |
| 4 | 0.999 | 1.000 | 1.000 |
Table 28.
Bayesian analysis with prior data ( = 0.010; = 0.006) of span n.2.
| ID | Day 2–Day 5 | ||
|---|---|---|---|
| 1 | 1.000 | 1.000 | 1.000 |
| 2 | 0.995 | 1.000 | 1.000 |
| 3 | 0.993 | 0.999 | 1.000 |
| 4 | 0.998 | 1.000 | 1.000 |
Table 29.
Bayesian analysis with prior data ( = 0.008; = 0.006) of span n.2.
| ID | Day 2–Day 5 | ||
|---|---|---|---|
| 1 | 1.000 | 1.000 | 1.000 |
| 2 | 0.995 | 1.000 | 1.000 |
| 3 | 0.993 | 0.999 | 1.000 |
| 4 | 0.998 | 1.000 | 1.000 |
Disclaimer/Publisher’s Note: The statements, opinions and data contained in all publications are solely those of the individual author(s) and contributor(s) and not of MDPI and/or the editor(s). MDPI and/or the editor(s) disclaim responsibility for any injury to people or property resulting from any ideas, methods, instructions or products referred to in the content. |
© 2023 by the authors. Licensee MDPI, Basel, Switzerland. This article is an open access article distributed under the terms and conditions of the Creative Commons Attribution (CC BY) license (https://creativecommons.org/licenses/by/4.0/).
Share and Cite
MDPI and ACS Style
Pepe, M.; Costantino, D.; Alfio, V.S. Topographic Measurements and Statistical Analysis in Static Load Testing of Railway Bridge Piers. Infrastructures 2024, 9, 4. https://doi.org/10.3390/infrastructures9010004
AMA Style
Pepe M, Costantino D, Alfio VS. Topographic Measurements and Statistical Analysis in Static Load Testing of Railway Bridge Piers. Infrastructures. 2024; 9(1):4. https://doi.org/10.3390/infrastructures9010004
Chicago/Turabian StylePepe, Massimiliano, Domenica Costantino, and Vincenzo Saverio Alfio. 2024. "Topographic Measurements and Statistical Analysis in Static Load Testing of Railway Bridge Piers" Infrastructures 9, no. 1: 4. https://doi.org/10.3390/infrastructures9010004