
Design of an Energy Pile Based on CPT Data Using Soft Computing Techniques

Department of Civil Engineering, National Institute of Technology, Patna 800005, India
*
Author to whom correspondence should be addressed.
Infrastructures 2022, 7(12), 169; https://doi.org/10.3390/infrastructures7120169
Submission received: 21 November 2022
/
Revised: 9 December 2022
/
Accepted: 9 December 2022
/
Published: 12 December 2022
(This article belongs to the Special Issue Artificial Intelligence in Infrastructure Geotechnics)
Abstract
:The present study focused on the design of geothermal energy piles based on cone penetration test (CPT) data, which was obtained from the Perniö test site in Finland. The geothermal piles are heat-capacity systems that provide both a supply of energy and structural support to civil engineering structures. In geotechnical engineering, it is necessary to provide an efficient, reliable, and precise method for calculating the group capacity of the energy piles. In this research, the first aim is to determine the most significant variables required to calculate the energy pile capacity, i.e., the pile length (L), pile diameter (D), average cone resistance (), minimum cone resistance (), average of minimum cone resistance (), cone resistance (), Young’s modulus (), coefficient of thermal expansion (), and temperature change (). The values of qc0, qc1, qc2, qc, and E are then employed as model inputs in soft computing algorithms, which includes random forest (RF), the support vector machine (SVM), the gradient boosting machine (GBM), and extreme gradient boosting (XGB) in order to predict the pile group capacity. The developed soft computing models were then evaluated by using several statistical criteria, and the lowest system error with the best performance was attained by the GBM technique. The performance parameters, such as the coefficient of determination (R2), root mean square error (RMSE), mean absolute error (MAE), mean biased error (MBE), median absolute deviation (MAD), weighted mean absolute percentage error (WMAPE), expanded uncertainty (U95), global performance indicator (GPI), Theil’s inequality index (TIC), and the index of agreement (IA) values of the testing data for the GBM models are 0.80, 0.10, 0.08, −0.01, 0.06, 0.21, 0.28, −0.00, 0.11, and 0.94, respectively, demonstrating the strength and capacity of this soft computing algorithm in evaluating the pile’s group capacity for the energy pile. Rank analysis, error matrix, Taylor’s diagram, and the reliability index have all been developed to compare the proposed model’s accuracy. The results of this research also show that the GBM model developed is better at estimating the group capacity of energy piles than the other soft computing models.
1. Introduction
Geothermal energy, energy obtained from the interior of the Earth, has enormous potential for heating and cooling production almost everywhere. It has been considered as one of the most reliable and clean energy sources. Geothermal energy combined with heat pumps may contribute significantly to the decarbonization of the heating and cooling industries [1,2]. In recent times, ground-source heat pump (GSHP) systems have become a feasible technology for both cooling and heating buildings, with a coefficient of performance (COP) higher than one, specifically, from three to five. The GSHP is a system that transfers heat from the earth into a building in the winter and heat out of the building in the summer. Fluid is circulated between the heat pump and the ground. The earth temperature beyond a depth of 1 m is mostly unaffected by the daily cycle of air temperature and solar radiation and its yearly variability extends to a depth of 9–12 m [3,4]. The method for heat transmission between a structure and the earth may be incorporated into the foundational components because concrete has a high thermal conductivity and thermal-storage capacity. It is an ideal medium for the heat absorber in the ground and has a wide range of applications as heat exchangers inside the earth [5]. A ground-heat exchanger (GHE) consists of loops made of high-density polyethylene (HDPE) pipes with a fluid flowing (usually water) which serves as a heat conductor. Although continuous monitoring and control systems are used to avoid the freezing of the piles and stop thaw-induced defects, they occur in any case [6]. Ground-heat exchangers can generally take various shapes, such as horizontal trenches as well as vertical boreholes. It is known that these systems may typically operate at a coefficient of performance (COP) of around four, which signifies that they will produce 4 kW of heating or cooling energy for each 1 kW of power used [7,8,9]. However, among the several direct geothermal energy uses, GSHP systems are the most popular [10] and they have received a lot of attention over the past 10 years to better understand how they might be used and designed most appropriately and effectively [11,12,13,14,15]. A GSHP system is used to minimize the capital cost of cooling and heating geostructures. The GHE loops are embedded inside the pile foundations, and the heating and cooling process is shown in Figure 1 [16,17,18].
Piles are structural foundation components that are relatively long and usually slender and transport loads from superstructures to deep layers of soil. These days, a wide variety of piles are being made, and the building sector uses them widely; however, depending on the kind of soil and the site conditions, different pile systems will have different functions. The majority of piles are designed to fulfill end-bearing-capacity requirements [19]. In this paper, we will try to fulfill the energy requirements of the building by using renewable ground energy. For the design of an energy pile, first the load-carrying capacity of the pile is determined based on cone penetration test (CPT) data by the use of IS code [20]. As with other in situ testing, the CPT eliminates laboratory test uncertainties, such as sample disruption, sample preparation, and the reapplication of the in situ test conditions, as well as the potential errors associated with carrying out laboratory tests [21]. Cone tip resistance () and side skin friction (), two soil strength parameters evaluated by the CPT, are very comparable to the factors affecting the pile capacity [22].
Due to the enormous amounts of energy used for different purposes nowadays, the significance of energy conservation is being emphasized more and more. The building industry consumes a significant portion of energy (more than 30%) globally [23]. Many engineers created various predictive and evaluative tools to provide the best approximate building energy consumption. There have been many past attempts to simulate the building’s energy [24,25]. In general, there are two common methodologies for evaluating the energy performance of buildings (EPBs): forward modeling and inverse modeling [26]. The drawbacks associated with using this strategy necessitate a lot of time and accuracy owing to the numerous parameters involved. Additionally, using various simulation programs might result in varied accuracy [27]. Numerous scholars have urged the use of machine learning techniques in response to the disadvantages of these simulations [28]. The main advantage of using machine learning techniques is how simple they are to use and how powerful they are computationally. Furthermore, the best machine-learning-based approach can handle the development of the variables (in this case, changes to the building design parameters), which is valuable work for architects and designers. The next paragraph of the paper provides a thorough overview of earlier studies that examined the viability of various machine learning approaches in the design of geothermal energy piles and geotechnical engineering problems.
Recently, machine learning (ML) methods, such as support vector machines (SVM), multiple linear regression (MLR), and artificial neural networks (ANN), have been applied to several geotechnical engineering designs and were shown to be significant and successful [29,30,31,32,33,34]. An increasingly popular artificial intelligence method for solving geotechnical problems is the support vector machine (SVM), which has produced good results [35,36,37,38,39]. The SVM’s attempt to identify the functions governing a phenomenon with only a set of data is a key component. As a result, unlike many traditional approaches, no assumptions are required to be made in order to simplify the problem. Pal and Deswal [40] proposed the SVM model to predict the pile capacity based on stress wave data, and determine the static axial capacity of high-strength-concrete spun pipe piles. Z. Zhao et al. [41] explained how to use the soft computing techniques of multivariate adaptive regression splines (MARSs) and random forest (RF) to assess the drivability of a pile in estimating the maximum compressive stresses. Z. Zhao et al. [42] aimed to develop a CPT-based fully probabilistic framework that combines the advantage of the XGB algorithm and Bayesian theorem to predict the probability of liquefaction. The direct measurement of parameters is difficult and expensive to achieve on-site. The gradient boosting tree (GBT) model was presented as a new, effective way for estimating the pile capacity in actual projects [43].
As it is seen, in the design of geothermal energy piles and geotechnical engineering problems, machine learning techniques are used effectively. Nevertheless, there are still large knowledge gaps in this field. To be clear, previous research has demonstrated the applicability of soft computing modes, but few researchers have examined models that are not often employed. Furthermore, to the authors’ knowledge, no prior study has offered a thorough examination of machine learning techniques for this topic. Consequently, the novel aspects of this study can be summed up as follows: (i) evaluating a number of new machine learning algorithms that have never been applied in the field before, (ii) offering an extensive comparison of several prediction techniques, and (iii) implementing feature selection to provide the ideal input combination for the design of energy piles.
This study uses a variety of machine learning algorithms, including RF, SVM, GBM, and XGB to develop a highly precise and computationally efficient machine-learning (ML)-based model for designing geothermal energy piles by using CPT data and thermal conditions. A significant variation in the static behavior of an energy pile is shown due to the practical application of a thermal load. In this paper, first we have to explain how the pile group capacity of an energy pile is determined on the basis of the thermal load and CPT profile data. Then, the modeling approach and application of the soft computing model employed are discussed. We built the dataset for training and validating the model for this purpose, using 200 random CPT distributions from the aimed site in Finland. The predicted model is then validated by comparing the reported results from the tests that took into account various CPTs, isolated and group piles, model shapes, and material characteristics. Finally, the evaluation of the performance of the proposed model is also discussed.
2. Data Analysis
2.1. Database and Soil Characteristics
A dataset of the Perniö test site conducted by Tampere University has been used for several research studies. The test site is situated in Finland along the southwestern coast, which is 140 km from the city of Helsinki. The deposit’s lithostratigraphic state contains an 8–10 m thick layer of soft clay with high plasticity under a 1–1.5 m thick dry crust. All tests have been carried out in line with ISO standards (ISO/TS 17892-4:2004 [44] for laboratory testing and ISO 22476-1:2002 [45] for piezocone testing). The soil categorization test, index properties test, and CRS consolidation test are all part of the laboratory testing program. Di Buo [46] states that all the tests have been carried out in the soil laboratory. Specifically, and are assessed using the fall cone (FC) test for Atterberg’s limits evaluation, while is determined using the rolling test. The clay fraction is determined using the hydrometer analysis. Figure 2 depicts the geotechnical engineering features of the investigated site [46].
Figure 3a depicts the CPT results from the test site, which is obtained from the piezocone sounding test. The soil stratum shows a homogeneous soft clay layer from 2 to 10 m in depth, characterized by increasing from 114 to 566 kPa. The sensor resolution (which is 2 kPa) causes the value to lack precision, as illustrated in Figure 3b [46].
2.2. Energy Pile Characteristics
A bored or cast onsite concrete pile (length 8 m and diameter 700 mm) was used in our study with the L/D ratio of 11.5 (i.e., less than 15), which is suitable for a short pile to avoid buckling failure [47]. A GSHP system was used for heating or cooling operations. Table 1 displays the geometry and physical properties of the pile and the GSHPs, where the distance between the adjacent energy piles was adequate (s = 965 mm) to avoid the thermal overlapping effects among the piles. The high-density poly-ethylene/poly-propylene (HDPE/HDPP) plastic pipes with a U shape that carry the heat carrier fluid (HCF) within the geothermal energy pile (GEP) are utilized in the energy pile design, which have been called the energy loops or absorber pipes, and have a diameter of 40 mm. The soil type was stated to be of a clayey nature and the heat carrier fluid (HCF) in the tubes was stated to be pure water [48] or water mixed with an antifreeze- or biocide (ethylene or propylene glycol)-based solution [17]. The freezing point is decreased by ethylene glycol, whereas its viscosity increases, which results in higher input energy for pumping [49]. Inside the U-tubes, there are two distinct fluid-flow regimes: steady-state, with a hydrodynamic and thermal profile, and transient zone, with velocities fluctuating and a thermal profile throughout the length of the pile [50]. Due to the prominence of the steady-state zone in the U-tubes and the fact that it can only be reached within a short distance of the tube inlets, a laminar flow was considered in this study. The HDPE U-tubes which have been used in the piling shaft were chosen for their material based on Gashti et al. [50], and the software’s material library was used to acquire the thermal values of the materials used in the model, as indicated in Table 2.
2.3. Thermal Characteristics
Kukkonen [52] states that the surface temperatures in the Finland area range from around +5 °C in the south to about +2 °C in the north on a yearly basis. Based on the studies of many researchers in the Finland area, we can say that the average annual ground temperature rises slightly with the depth. A concrete pile of length 8 m has been used in our study for simulation for this purpose, and we have to make an assumption that the average annual ground temperature is about 13 °C.
As per the recent literary works, the temperature changes brought on by the energy pile operation have no negative consequences on the geotechnical soil qualities [53]. Therefore, changes in the soil properties that might have a significant influence on the geotechnical failure in the energy piles have not been considered. Due to the symmetry of the research object and the avoidance of the thermal overlap effects from nearby piles, the vertical ground surfaces were considered to be adiabatic, while the bottom surface of the soil domain was chosen to be a constant temperature [51]. Table 3 displays the mechanical characteristics of the materials utilized in the model (concrete properties from Laloui et al. [18] and clay properties from Gashti et al. [51]).
3. Methodology
This section offers a comprehensive overview of the energy pile design concepts, nomenclature, and formulas. Following the acquisition of the various CPT profile data at various depths for specific locations, an IS code method was used to calculate the group capacity of the pile, which is followed by the application of suitable machine learning (ML) algorithms and the evaluation of the performance of the pile capacity.
3.1. Pile-Load-Capacity Determination
The axial capacity of the pile determination is difficult even under ideal conditions. The engineering profession has created several techniques to address uncertainty in the design and analysis of piles. However, the methodologies produce qualitative conclusions rather than precise quantitative values that may be used to build piles because of simplifying assumptions about soil stratum, the distribution of shaft resistance along the pile, and the interaction of the soil with piles. In recent years, the cone penetration test (CPT) has become the in situ test of preference for pile design and analysis because the CPT offers continuous data with depth that can be evaluated using both analytical and empirical approaches, and also because it is simple, quick, affordable, and easy to use.
Indian Standard (Code of Practice for Design and Construction Pile Foundations), Part 1: Concrete Piles, Section 1: Driven Cast In-Situ Concrete Piles [20]
For cohesive soils, the ultimate load capacity () is determined by:
where is the ultimate end-bearing resistance (kPa), is the skin friction resistance of the pile (kPa), is the cross-sectional area of the pile tip (m2), and is the surface area of the pile shaft (m2).
Essentially, the cone penetration test data (CPT) is a small version of a pile load test. Therefore, the parameters required for the design of piles under vertical load may be derived from the results of this test [54]. It is recommended by Schmertmann [55,56] that a single method be used for calculating the point-bearing capacity of piles in all types of soil. The method utilized here entails calculating a representative cone point penetration value (), which is 2D below the pile’s tip level and 8D above the pile’s tip.
The ultimate end bearing resistance (kPa) of the pile is
where is the average value of the static cone resistance up to a depth of below the pile tip (kPa), is the minimum static cone resistance value up to the same depth below the pile tip (kPa), is the average value of the envelope of minimum cone resistance values up to a length of the pile of above the pile tip (kPa), and D is the diameter of the pile (m).
Table 4 shows the ultimate skin friction resistance approximately calculated as local side friction () obtained from the static cone resistance ().
The area of the cross-sectional of the pile tip () and the pile shaft surface area can be calculated as:
3.2. Thermal Load Determination
When a pile is heated without a head load, it will expand. A free-standing column will expand and the corresponding thermal properties are determined by the Equation [5]
where corresponds to the unconstrained free axial thermal strain, gives the coefficient of thermal expansion or contraction of concrete, and is the overall change in the temperature of the pile.
Due to the mobilization of side restraints of the pile–soil interface and each end-restraint at the pile head or toe, a pile that is buried in the earth will not be able to spread freely. The observed strain change as a result of the temperature change () will thus be lower than that predicted by Equation (6).
The restrained axial strain can be estimated as
In structural design, the thermal stress caused by the restrained strain should be taken into account. For estimating the thermally induced axial load for a specific increment of strain due to a change in the temperature, the equation below can be used
where is the pile materials Young’s modulus (kPa) and is the area of the cross-section of the pile (m2). The negative sign in Equation (8) suggests that the pile–soil-interaction-induced restrained strain acts as a counterforce to restrain the pile deformation.
3.3. Group Capacity of Pile
Piles combined in groups or clusters are the most effective. The combination of the pile into a group makes the analysis more difficult, since the interactions between the other group’s piles make the features of a single pile invalid. When a single pile is combined with other piles to form a cluster or group, the allowable load of that pile will be different and the pile group acts as a block.
The pile group functions as a block, hence the block’s total capacity is calculated by adding the base resistance and shaft resistance. The behavior of the pile group operating as a block frequently limits the capacity of the block with closely spaced piles (spacing between the piles in a block is always less than equal to three times the width of the block, i.e., ). The block’s group capacity is determined by
where is the unit point resistance (kPa), is the cross-sectional area of the block (m2), is the undrained cohesion (kPa), is the adhesion factor ( = 1.0 for soft clays), is the perimeter of the block (m), and is the length of the pile embedded (m).
The group capacity, considering the piles as an individual pile, is given by
where is the number of piles in the group and is the single pile load capacity (kN).
Since the ultimate group pile capacity is not necessarily equal to the total of the individual pile load capacities within the group, the group efficiency is necessary. The group efficiency of the piles is given by
3.4. Allowable Load on Piles
The allowable load is obtained from the ultimate load given by Equation (12):
where represents the factor of safety.
3.5. Reliability Analysis
The reliability index () is a simple way of expressing the probability of failure in terms of capacity and demand [57]. In this study, capacity is defined as the load-carrying capacity () of energy piles and the demand is defined as the sum of mechanical and thermal load (). The performance function can be defined as
The reliability index is given by Figure 4
where is the mean of capacity, is the mean of demand, is the standard deviation of capacity, and is the standard deviation of demand.
3.6. Soft Computing Algorithms
In this study, four soft computing models, namely, the RF, SVM, GBM, and XGB, have been developed to predict the group capacity of an energy pile. The provided soft computing models have impressive capabilities for learning and they are able to accurately estimate the pile group capacity even when subjected to a wide range of influencing factors, such as the size of the datasets and the number of features. The detailed descriptions of these models are introduced as follows.
3.6.1. Random Forest (RF) Algorithms
RF refers to a group of machine learning (ML) techniques, such as the Breiman Forest algorithm, which [58] first introduced and that is frequently cited in the literature as a benchmark model, are used to generate a collection of decision trees. The bagging and random feature selection techniques of “randomization” are applied in this algorithm. Therefore, the learning stage creates a collection of decision trees that are driven by a ‘bootstrap’ subgroup from the initial learning dataset, i.e., utilizing the bagging principle and the random tree induction approach. The classification and regression trees (CART) algorithm serves as the basis for such an induction algorithm [59] and modifies the way the tree’s nodes are divided so that the feature used as the criterion for dividing is chosen in a partially random manner.
3.6.2. Support Vector Machine (SVM) Algorithms
Vapnik [60] introduced an alternative -insensitive loss function to develop the -support vector regression (SVR). This loss function permits the usage of margins for regression problems, where a margin is defined as the sum of the distances between the nearest points of the two classes and the hyperplane, as seen in Figure 5 [38]. The objective of the SVR is to develop a function that deviates from the actual target vectors by no more than for all training data and is as flat as is feasible [61]. Vapnik [60] presented the kernel function technique for nonlinear support vector regression.
Based on Vapnik’s statistical learning theory, the SVM was introduced in the 1990s [62,63]. The structural risk minimization (SRM) principle is used to reduce model errors, whereas other approaches, such as ANNs, use empirical risk minimization (ERM) [31,64]. The simultaneous maximization of the model’s generalizability and minimization of empirical risk is the main objective of the SRM. The SRM has therefore been discovered to be more effective than the ERM principle [21,31].
Figure 5.
SV regression with an intensive loss function (ε) and slack variable (ξ) (Obtained from Samui and Dixon [65]).
Figure 5.
SV regression with an intensive loss function (ε) and slack variable (ξ) (Obtained from Samui and Dixon [65]).

3.6.3. Gradient Boosting Machine (GBM) Algorithms
One of the most effective algorithms in the area of machine learning is the gradient boosting technique, which is used in classification and regression tasks. The GBM is an ensemble machine learning (ML) technique that uses weak learners to create a robust prediction model. The GBM utilizes a boosting technique in which predictors are built sequentially (i.e., step-by-step), but not independently [66]. As with supervised learning in general, the GBM’s objective is to define and minimize a cost function.
3.6.4. Extreme Gradient Boosting (XGB) Algorithms
Due to its benefits of high effectiveness and sufficient flexibility, XGB, an improved and supervised approach by Chen and Guestrin [67] under the Gradient Boosting Machine (GBM) framework, has received a lot of interest in Kaggle machine learning contests. It is also a gradient-boosted decision tree implementation. However, the XGB uses a more regularized model formalization to control over-fitting; hence, over-fitting results in improved performance [68]. As shown below, the objective function (f) for XGB consists of a cost function and a term of regularization.
where is the indicator of parameters, is the cost function, and is the term of regularization. Commonly, the mean squared error (MSE) is selected as the cost function. The helps to prevent over fitting by regulating the model’s complexity with a bias-variance trade-off to maintain it as simple and predictive. It penalizes the development of a complicated tree with many leaf nodes in order to restrict the hypothesis space of the base functions throughout each iteration. At the same cost, the model favors a simple function over a complicated function at every iteration [69].
3.7. Performance Assessment
To evaluate and compare expected and observed values, ten important statistical indices are introduced: the coefficient of determination (), root mean square error (RMSE), mean absolute error (MAE) [70], mean biased error (MBE), median absolute deviation (MAD), weighted mean absolute percentage error (WMAPE), expanded uncertainty () [71], global performance indicator (GPI) [72], Theil’s inequality index (TIC), and the index of agreement (IA) [73]. These parameters can be mathematically written as
where is the actual value of the sample points, is the predicted value of the ith sample points, is the mean of the actual value, and is the number of the data sample. Calculating , the difference between the predicted value and the actual value is assessed term-by-term, and the short-term effectiveness of the formula is examined. The (Equation (22)) indicates uncertainty up to a 95% confidence level, where 1.96 is the confidence level coverage factor, and SD is the standard deviation of the difference between the predicted and actual data. GPI is the mathematical relation between the five statistical factors, as shown in Equation (23). The GPI value determines how accurate a model is; a higher GPI value yields a more accurate model, whereas a lower GPI value yields a less accurate model. TIC (Equation (24)) is a measurement of how well an estimated model value compares to a corresponding model of actual value. The TIC value is 0 (total equality) and 1 (total inequality). The lower the value of the index, the less unequal the distribution. The ratio of the mean square error to the potential error is the index of agreement (IA), as shown in Equation (25). There is complete agreement if the value is 1, and no error if it is 0.
4. Data Preparation and Statistics
A dataset of the Perniö test site conducted by Tampere University has been used for several research studies [46]. The records presented have five inputs and one output. Contributions were regarded as the ,,,, and of an energy pile. Similarly, using the previously mentioned inputs, one parameter of the pile group capacity () of the proposed energy pile was aimed to be forecasted.
The obtained dataset is plotted statistically in detail in the following sections.
Statistical Plotting of the Variables
To comprehend the problem more clearly, it is necessary to have an appropriate statistical report of the data. Usually, to achieve this objective, the relationship between the inputs and outputs is expressed. Various charts can show two or more parameters depending on the specifics of the problem. This section presents a thorough schematic distribution of the samples. To display the marginal relationship between each input and the outputs in the regression model, a marginal histogram was created. In this regard, Figure 6 shows ,, ,, and on the X-axis versus on the Y-axes.
To better understand the distribution of each variable in a scatter plot, marginal histograms are shown around the outside edges of the axes. This is helpful to understand the distribution’s intensity throughout a range of values for the independent variables.
5. Data Preprocessing
In order to develop a soft computing model, the dataset is separated into two subsets, training and testing [31,36]. The model is trained using the training set, and its performance is estimated utilizing the testing set. Seventy percent (140) of the data in this research are used for training, while thirty percent (70) are employed for testing.
The variables are preprocessed by scaling them to acceptable form after subdividing the available data into respective subgroups. Scaling ensures that all inputs approximately fall within the same range of values by eliminating the dimension of the variables [35,74]. By normalizing all variables (input and output) in this study against their maximum values by using Equation (26), they are all scaled in the range of .
where represents standardized input and output variables, represents the actual input and output variables, and and represent the optimum variables.
6. Results and Discussion
The following section includes the results of the group capacity of the energy piles obtained by the application of soft computing based on the CPT data from the Perniö test site conducted at Tampere University, Finland. Figure 3 shows the profile of the cone tip resistance and the side skin resistance with the depth of the proposed test site. Boreholes sunk to a depth of 10 m were used to collect soil samples at various locations on the site. For obtaining the index properties, such as Atterberg’s limits (i.e., LL, PL, etc.), hydrometer analysis, natural moisture content (), bulk density , specific gravity , shear strength characteristics, which are cohesion () and angle of internal friction (), etc., was used. The plasticity index was computed using LL and PL data from different depths. Ultimate end bearing resistance () was obtained using Equation (2). Afterwards, Equation (1) was used to determine the ultimate load capacity () of the piles for the Perniö test site. The thermal strain () was measured by finding out the () and () using Equations (5)–(7). After obtaining the (), the thermal load (PT) was determined by using Equation (8) for the Perniö test site, Finland, as explained in Section 3.2. Additionally, the group capacity of the piles () was calculated using Equation (10). Afterwards, the group efficiency of the piles () and allowable load () were obtained by using Equations (11) and (12).
Table 5 demonstrates the values of several input parameters as well as the predicted group capacity of the piles at different depths from the ground surface. This table also includes the values of Young’s modulus for these locations. The value at these locations lies between 30 Gpa and 40 Gpa (average 35 Gpa), which is good for concrete piles. The axial thermal load () was calculated from E, , , and data from the proposed site, and the profile of then thermal load with the depth is shown in Figure 7, with an imposed mechanical load of 1000 kN. It is seen that the profile of is almost the same along the depth of the pile because of the small variation in and the constant value of all other parameters. The coefficient of thermal expansion () has been taken to be equal to (°C−1), which is mentioned in Table 3, and is the difference between the average ground temperature and the average surface temperature of a test site throughout the year. Kukkonen [52] states that the average surface temperature in Finland is about 5 °C and the temperatures at 500 m below the surface are usually between 8 and 14 °C. In our case, the length of the piles was 8 m, so we have to use the average ground temperature of about 13 °C. Therefore, the value of is taken as the 8 °C for the Perniö test site, Finland. The observed thermal strain was calculated on the basis of the degree-of-freedom (DOF), the , which lies between 0 and 1 when the ratio is less than 1 [75]. From this evidence, we assume that the value of the DOF is 0.75 for the proposed site in Finland.
Figure 7 depicts the variation of thermal load () with the depth (m) for the proposed site. It also demonstrates that the thermal load () ranges from 230 to 320 kN.
6.1. Models Regression Plot
In this study, four machine learning models have been developed. The first model, the RF, utilizes less training time and gives output with higher precision. It also maintains accuracy for large numbers of dataset runs. The SVM model is the best model to reduce model error and simultaneously maximize the model’s generalizability and minimize empirical risk. The GBM and XGB models are applied to enhance the data structures for quicker and better support for multicore processing, hence reducing the overall training time.
Figure 8, Figure 9, Figure 10 and Figure 11 represent the plots between the actual data and the predicted data of the load capacity of the pile groups obtained from the RF, SVM, GBM, and XGB regression-based algorithms, respectively. Figure 8 and Figure 9 represent the plots between the actual and predicted values for 140 training cases, and Figure 10 and Figure 11 represent the plots between the actual and predicted values for 70 testing cases. When the results are compared, it is clear that the pile capacities predicted by all of the ML regression techniques are very close to the experimental results. Despite the models not being specifically trained for this data, the predicted values for the test dataset generally agree well with the observed values. This indicates that the model has a nonlinear relationship between the input parameters and .
Four ideal ML models can be built, and their performance may be assessed if the hyperparameters of each model can be definitely recognized. To evaluate the accuracy of each model, the statistical indices R2, RMSE, MAE, MBE, MAD, WMAPE, U95, GPI, TIC, and IA are adopted. The correctness of these models is difficult to assess on the basis of the value of these statistical indices. Consequently, in order to describe the ideal model, the index values of the training and testing datasets were computed. Table 6 and Table 7, respectively, present the statistical index values of the predicted back-to-break for training sets and testing sets for the four best models. Table 6 and Table 7 show the coefficient of determination (R2) of the training datasets for different ML algorithms as 0.957, 0.829, 0.991, and 0.998, and also for testing datasets as 0.785, 0.734, 0.808, and 0.792, respectively. These values are close to one, indicating that the models are the most accurate. The RMSE for the training and testing datasets is observed as 0.065, 0.092, 0.020, 0.0124, and 0.135, and 0.122, 0.104, and 0.107, respectively. The mean absolute error (MAE) for training and testing datasets is 0.049, 0.064, 0.001, and 0.008, and 0.109, 0.018, 0.084, and 0.086, respectively. The performance parameters of the proposed ML models (MBE, MAD, WMAPE, TIC, and IA) for the training and testing datasets are shown in Table 6 and Table 7. The RMSE, MAE, MBE, MAD WMAPE, TIC, and IA should all be as small as possible for a model to be deemed accurate. Table 6 and Table 7 show the outcomes of the statistical index of the soft computing models, and they show that the model is acceptable. This table also shows that each ML model’s prediction error is rather low, indicating that the four best ML models created by the R software have promising performance.
The U95 is the uncertainty up to a 95% confidence level, and it is found as 0.180, 0.257, 0.057, and 0.034 for the training datasets and 0.376, 0.340, 0.288, and 0.298 for the testing datasets for the different ML models. The model with lower U95 values is presumed to be the superior model. By comparing several statistical indices at the same time, it was found that the global performance indicator (GPI) is the best performance parameter of all. It is found as 3.09 × 10⁻⁸, −4.0 × 10⁻⁶, 1.72 × 10⁻⁸, and 3.85 × 10⁻⁹ for training datasets and −4.9×10⁻⁸, −1.0 × 10⁻⁴, −1.0 × 10⁻⁴, and 1.88 × 10⁻⁵ for the testing datasets. The higher value of the GPI represents the better model performance.
Overall performance is quantified in terms of the R2 value, which can be determined by using Equation (16). As the R2 values approach one, it shows an enhancement in the model results. The line of best fit in the actual versus predicted plot and the corresponding R2 value is calculated using conventional least squares regression technique, and the outputs are represented in Figure 8, Figure 9, Figure 10 and Figure 11. It can be seen that both the GBM and XGB models with an R2 = 0.991 and 0.998 for the training datasets and an R2 = 0.808 and 0.792 for the testing datasets achieve the best results; consequently, these models frequently understate the actual ultimate group capacity. Finally, on the basis of the second column of Table 6 and Table 7, it can be concluded that the GBM models outperform the conventional methods based on the CPT data.
6.2. Rank Analysis for Different Soft Computing Models
Using a simple rank analysis method, the proposed models’ performances are compared. Each predictive model’s rank value is calculated for training and testing, respectively. An overall rank index (RI) is employed to examine the overall performance of the proposed model and every conventional, CPT-based technique. The RI is calculated as the addition of the individual ranks obtained from different parameters of statistical analysis. The better performance of the model occurs when the RI value is lower. Table 8 summarizes the rank index of different performance parameters for different ML models, which are RF, SVM, GBM, and XGB. The rank index (RI) is observed as 3, 4, 1, and 2, respectively.
6.3. Error Matrix for Different Soft Computing Models
An error matrix is a type of matrix that evaluates the performance of the proposed model considering the different parameters of statistical analysis separately for training and testing cases. It also shows the error value as a heat pump matrix, which is a new graphical concept [76]. Finally, the total error of each model is compared, which varies from 0 to 38%. In the training and testing cases, the GBM obtained the minimum error (0%), whereas the RF model attained a maximum error (38%), as shown in Figure 12. On the basis of both training and testing cases, it is concluded that the GBM model has the lowest error. This means the GBM models perform better compared to all the other models.
6.4. Taylor’s Diagram
To visually summarise how well a pattern (or group of patterns) fits observations, Taylor diagrams are used. Two patterns’ similarities are measured by their correlation, centred root mean square difference, and the amplitude of their fluctuations (represented by their standard deviations).
Figure 13 and Figure 14 are particularly helpful when comparing the relative abilities of several models or when examining multiple facets of complex models. The predicted value for the provided model is near to the reference data, indicating a greater level of accuracy. Higher correlation indicates more agreement between the observed and simulated data. For the provided models, i.e., the RF, SVM, GBM, and XGB, the correlation coefficient between the observed and anticipated results are 0.97, 0.91, 0.99, and 0.99 for the training data and 0.88, 0.86, 0.90, and 0.89 for the testing datasets, respectively. The findings of this research also indicate that, when predicting the ultimate group capacity of a pile, the GBM regression performs better than the other models.
6.5. Reliability Analysis
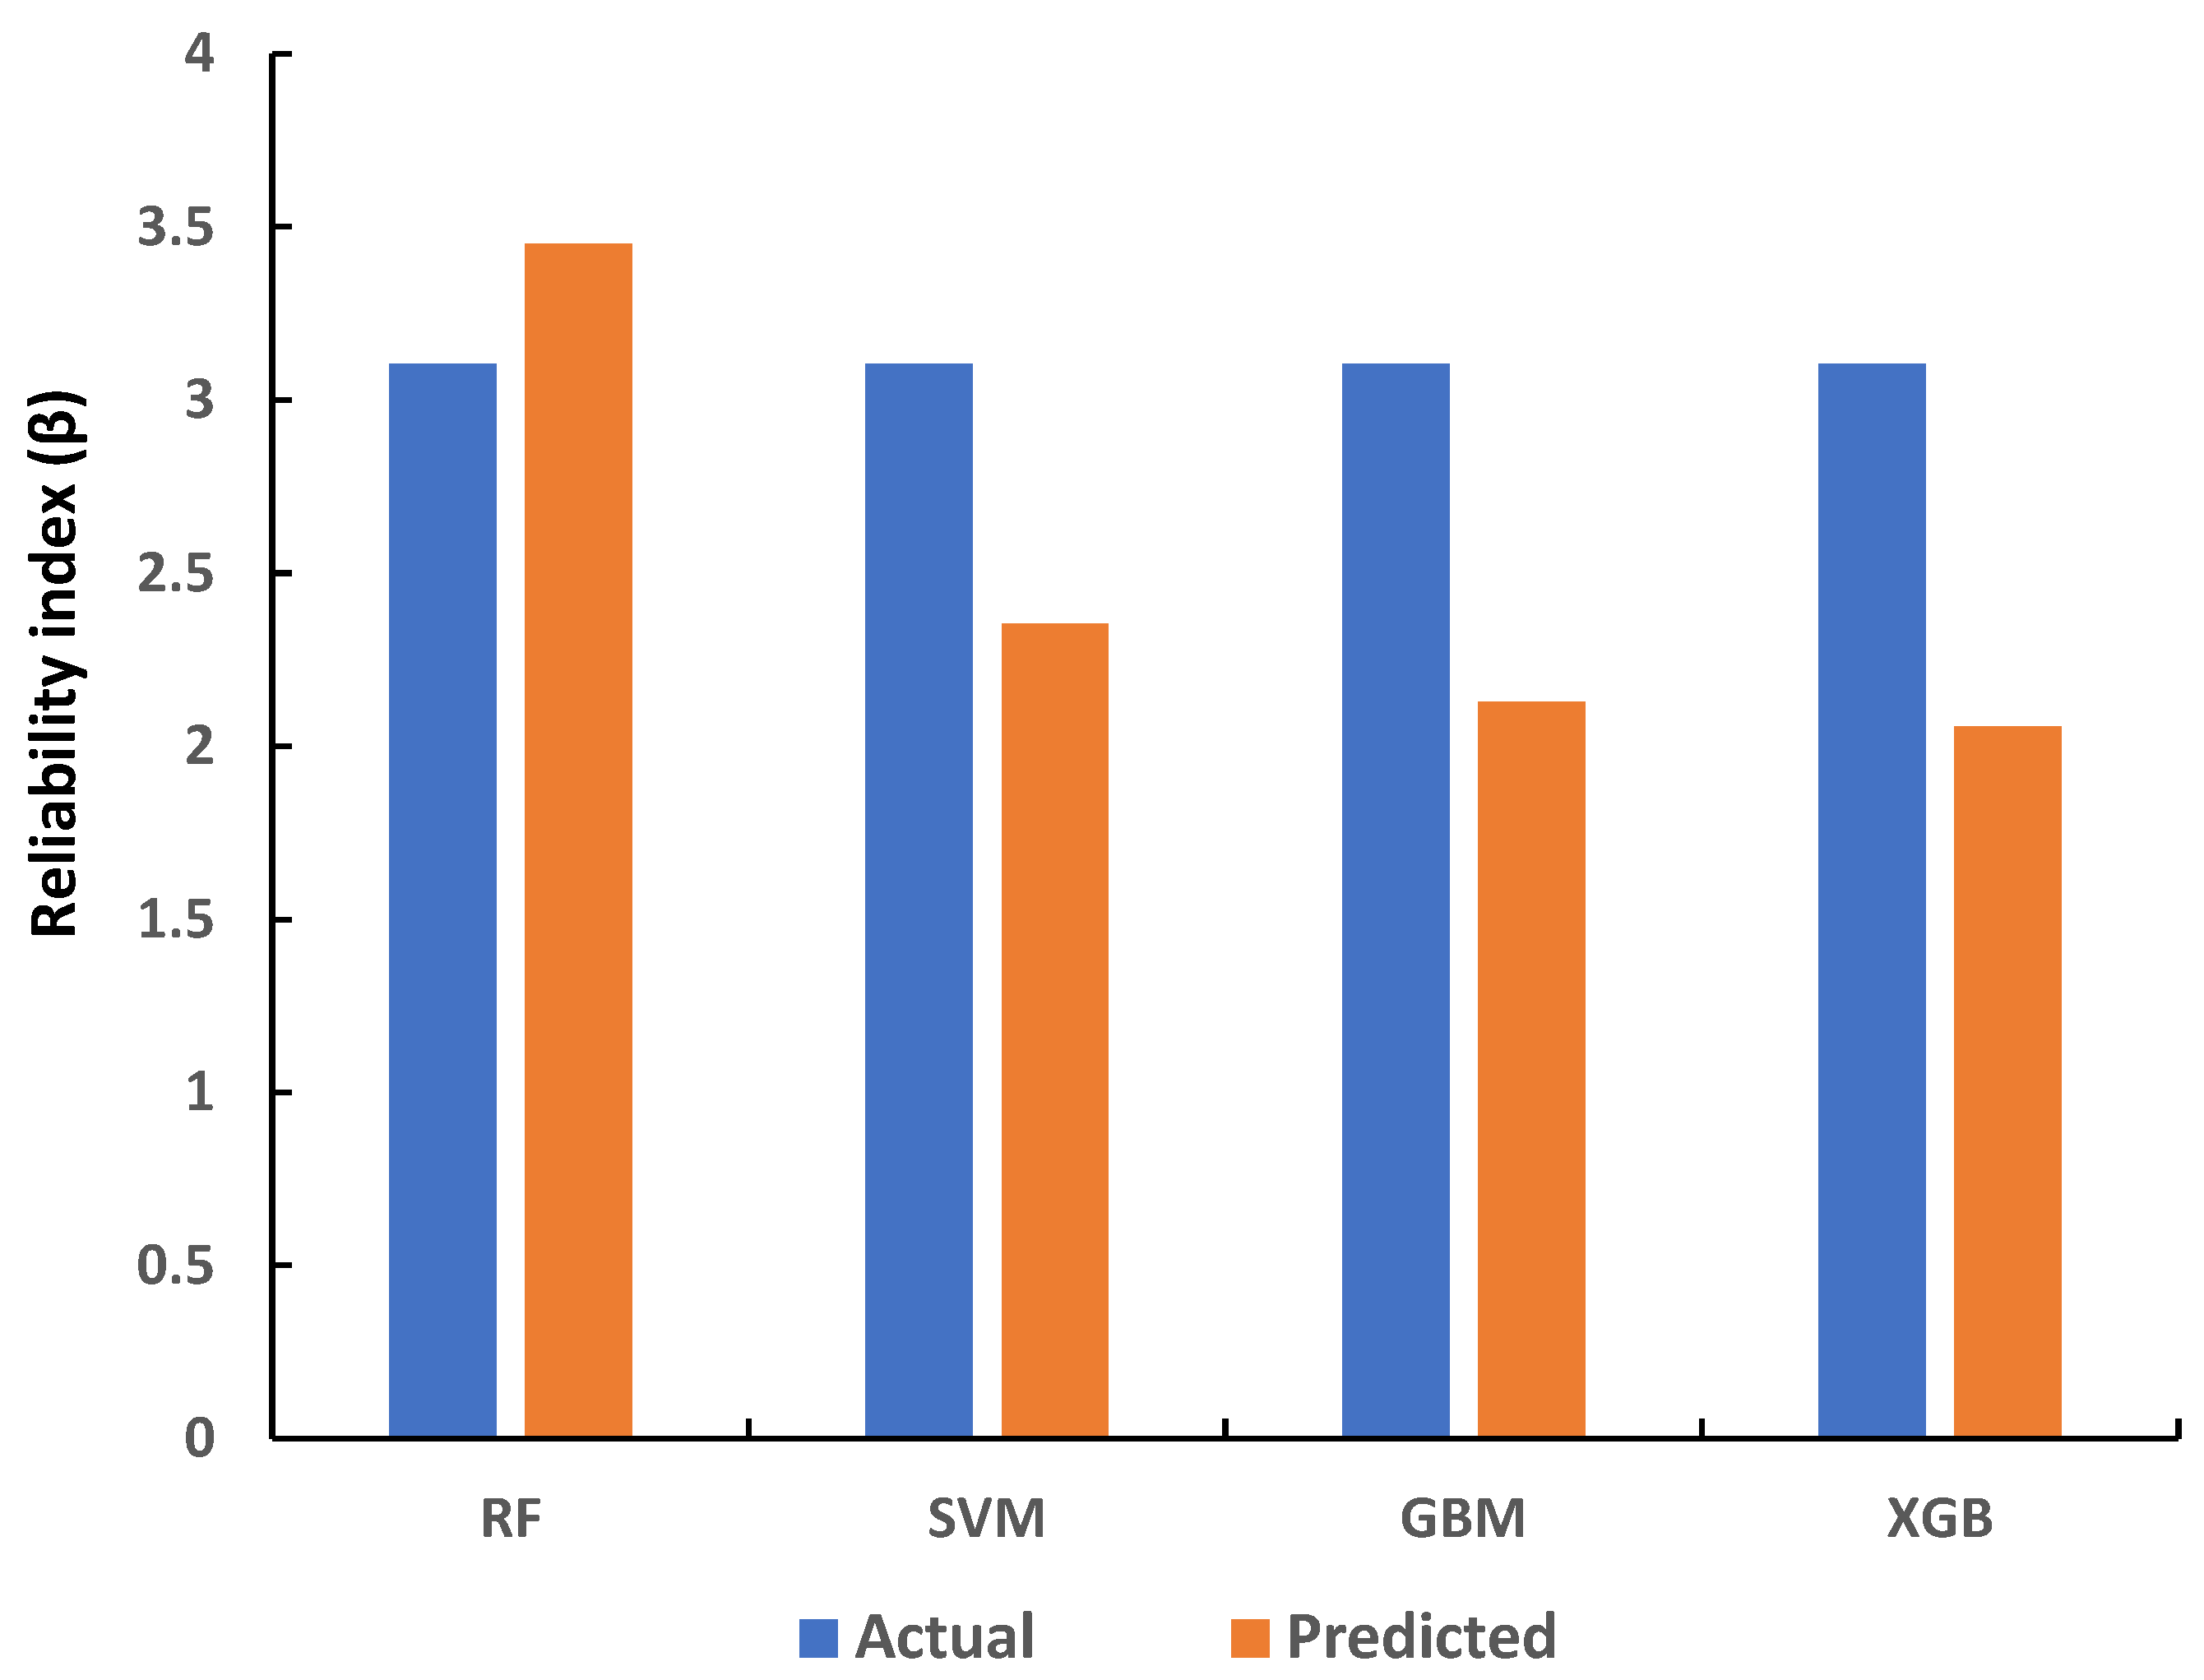
Figure 15 shows the comparison of the reliability index values for the actual and predicted models for the testing dataset, separately. For the computation of the reliability index, the first-order reliability method (FORM) is used. It is observed that the reliability index values for the proposed model are close to the actual value. Therefore, the GBM model is reliable for use in designing the energy pile.
7. Conclusions
The use of heat exchanger piles presents a promising potential for building heating and cooling with renewable energy. There have been hundreds of installations of this kind, but there is currently no design process that takes into account the complex interaction between the heat storage and the mechanical behavior of geostructures. This paper deals with the application of ground energy along with the CPT data to evaluate the group capacity of energy piles and applies soft computing to the data obtained from the Perniö test site in Finland. An R programing language has been developed for statistical computing and graphics presentation. It is a great resource for data analysis, data visualization, data science, and machine learning. The study shows that the ultimate capacity (Qu) of a single pile varies in the range from 196 to 900 kN, respectively. The thermal load () values are found to lie in the range from 230 to 310 kN and the mechanical load () was 1000 kN at the proposed site. For energy piles, the group capacity () lies in the range from 1590 to 7300 kN, which can be regarded as the piles being safe against the block and individual pile failure, as per the requirements of design codes and standards. For this purpose, the factor of safety (FOS) is taken as 2.5, the group efficiency () is 0.9, and the corresponding group spacing of the piles is 965 mm. For all design aspects, IS:2911 (part 1) [20], used to determine group capacity (), has been carried out on the CPT data collected from the Perniö site in Finland.
Furthermore, the group capacity of the energy piles has been analyzed through several soft computing models, i.e., the RF, SVM, GBM, and XGB. The graph of the actual versus predicted group capacity of a pile has been plotted according to the CPT data. The R2 values close to 1 in the plots have revealed the best models. Several statistical error measurement parameters, including RMSE, MAE, MBE, MAD, WMAPE, U95 GPI, TIC, and IA, have been primarily used to examine the biases between the actual and predicted data. The estimated values for all of these parameters indicate a high degree of concordance with their ideal values, indicating that the error between actual and predicted data is quite small. Finally, in order to compare all the developed models, rank analysis, the error matrix, Taylor’s diagram, and the reliability index have been used to quantify the performance of the proposed models, and it was found that the GBM model had the highest rank, with an almost 5–6% error, a correlation coefficient value of 0.99 and 0.89 for the training and testing, and a reliability index () value of 3.10 and 2.12 for the actual and predicted datasets, which demonstrates that the GBM is a better model. This study also concluded that the created GBM model is more accurate in predicting the group capacity of energy piles than the other soft computing models. Further, this study can be used for the prediction of the group capacity of other types of piles.
Author Contributions
Conceptualization, P.K.; Research methodology, P.K.; Resources, P.K.; Software, P.K.; Validation, P.K.; Visualization, P.K.; Data curation, P.K.; Original Draft, P.K.; Review & Editing Writing, P.K.; Supervision, P.S. All authors have read and agreed to the published version of the manuscript.
Funding
This research received no external funding.
Institutional Review Board Statement
Not applicable.
Informed Consent Statement
Not applicable.
Data Availability Statement
Data will be provided by corresponding author on reasonable request from the reader.
Conflicts of Interest
The authors declare no conflict of interest.
Nomenclature
| CPT | Cone Penetration Test |
| RF | Random Forest |
| SVM | Support Vector Machine |
| GBM | Gradient Boosting Machine |
| XGB | Extreme Gradient Boosting |
| RMSE | Root Mean Square Error |
| MAE | Mean Absolute Error |
| MBE | Mean Biased Error |
| MAD | Median Absolute Deviation |
| WMAPE | Weighted Mean Absolute Percentage Error |
| GPI | Global Performance Indicator |
| TIC | Theil’s Inequality Index |
| IA | Index of Agreement |
| GSHP | Ground-Source Heat Pump |
| GHE | Ground-Heat Exchanger |
| HDPE | High-Density Polyethylene |
| COP | Coefficient of Performance |
| ML | Machine Learning |
| MLR | Multiple Linear Regression |
| ANN | Artificial Neural Networks |
| MARS | Multivariate Adaptive Regression Splines |
| HCF | Heat Carrier Fluid |
| GEP | Geothermal Energy Pile |
| TRT | Thermal Response Test |
| CART | Classification and Regression Trees |
| SRM | Structural Risk Minimization |
| ERM | Empirical Risk Minimization |
| DOF | Degree-of-Freedom |
| RI | Rank Index |
| FOS | Factor of Safety |
References
- Ahmed, A.A.; Assadi, M.; Kalantar, A.; Sliwa, T.; Sapińska-Śliwa, A. A Critical Review on the Use of Shallow Geothermal Energy Systems for Heating and Cooling Purposes. Energies 2022, 15, 4281. [Google Scholar] [CrossRef]
- Anongphouth, A. Investigating the Performance of Geothermal Energy Piles Using Coupled Thermo-Hydro-Mechanical Finite Element Analyses. Master’s Thesis, University of Manitoba, Winnipeg, MB, Canada, 2019. [Google Scholar]
- Kalogirou, S.A.; Florides, G.A. Measurements of Ground Temperature at Various Depths. In Proceedings of the 3rd International Conference on Sustainable Energy Technologies, Nottingham, UK, 28–30 June 2004. [Google Scholar]
- Çuhac, C.; Mäkiranta, A.; Välisuo, P.; Hiltunen, E.; Elmusrati, M. Temperature Measurements on a Solar and Low Enthalpy Geothermal Open-Air Asphalt Surface Platform in a Cold Climate Region. Energies 2020, 13, 979. [Google Scholar] [CrossRef] [Green Version]
- Amatya, B.L.; Soga, K.; Bourne-Webb, P.J.; Amis, T.; Laloui, L. Thermo-Mechanical Behaviour of Energy Piles. Géotechnique 2012, 62, 503–519. [Google Scholar] [CrossRef]
- Knellwolf, C.; Peron, H.; Laloui, L. Geotechnical Analysis of Heat Exchanger Piles. J. Geotech. Geoenviron. Eng. 2011, 137, 890–902. [Google Scholar] [CrossRef]
- Preene, M.; Powrie, W. Ground Energy Systems: From Analysis to Geotechnical Design. Géotechnique 2009, 59, 261–271. [Google Scholar] [CrossRef]
- Johnston, I.W.; Narsilio, G.A.; Colls, S. Emerging Geothermal Energy Technologies. KSCE J. Civ. Eng. 2011, 15, 643–653. [Google Scholar] [CrossRef]
- Narsilio, G.A.; Johnston, I.W.; Bidarmaghz, A.; Colls, S.; Mikhaylovaa, O.; Kivi, A.; Aditya, R. Geothermal Energy: Introducing an Emerging Technology. In Proceedings of the International Conference on Advances in Civil Engineering for Sustainable Development, Nakhon Ratchasima, Thailand, 27–29 August 2014. [Google Scholar]
- Lund, J.W.; Boyd, T.L. Direct Utilization of Geothermal Energy 2015 Worldwide Review. Geothermics 2016, 60, 66–93. [Google Scholar] [CrossRef]
- Bayer, P.; de Paly, M.; Beck, M. Strategic Optimization of Borehole Heat Exchanger Field for Seasonal Geothermal Heating and Cooling. Appl. Energy 2014, 136, 445–453. [Google Scholar] [CrossRef]
- Retkowski, W.; Thöming, J. Thermoeconomic Optimization of Vertical Ground-Source Heat Pump Systems through Nonlinear Integer Programming. Appl. Energy 2014, 114, 492–503. [Google Scholar] [CrossRef]
- Bidarmaghz, A. 3D Numerical Modelling of Vertical Ground Heat Exchangers. Ph.D. Thesis, University of Melbourne, Melbourne, Australia, 2014. [Google Scholar]
- Huang, S.; Ma, Z.; Wang, F. A Multi-Objective Design Optimization Strategy for Vertical Ground Heat Exchangers. Energy Build. 2015, 87, 233–242. [Google Scholar] [CrossRef]
- Sivasakthivel, T.; Murugesan, K.; Thomas, H.R. Optimization of Operating Parameters of Ground Source Heat Pump System for Space Heating and Cooling by Taguchi Method and Utility Concept. Appl. Energy 2014, 116, 76–85. [Google Scholar] [CrossRef]
- Moreni, M.; Vulliet, L.; Laloui, L. Behavior of a Dual-Purpose Pile as Foundation and Heat Exchanger [Comportement d’un Pieu Bi-Fonction, Fondation et Échangeur de Chaleur]. Can. Geotech. J. 2003, 40, 388–402. [Google Scholar]
- Brandl, H. Energy Foundations and Other Thermo-Active Ground Structures. Géotechnique 2006, 56, 81–122. [Google Scholar] [CrossRef]
- Laloui, L.; Nuth, M.; Vulliet, L. Experimental and Numerical Investigations of the Behaviour of a Heat Exchanger Pile. Int. J. Numer. Anal. Methods Geomech. 2006, 30, 763–781. [Google Scholar] [CrossRef]
- Elsamee, W.N.A. New Method for Prediction Pile Capacity Executed by Continuous Flight Auger (CFA). Engineering 2013, 5, 344–354. [Google Scholar] [CrossRef] [Green Version]
- ISO 2911-1-1. B.I.S. Bureau of I. Design and Construction of Pile Foundations-Code of Practice. ISO: Geneva, Switzerland, 2010.
- Kordjazi, A.; Nejad, F.P.; Jaksa, M.B. Prediction of Ultimate Axial Load-Carrying Capacity of Piles Using a Support Vector Machine Based on CPT Data. Comput. Geotech. 2014, 55, 91–102. [Google Scholar] [CrossRef]
- Abu-Farsakh, M.Y.; Titi, H.H. Assessment of Direct Cone Penetration Test Methods for Predicting the Ultimate Capacity of Friction Driven Piles. J. Geotech. Geoenviron. Eng. 2004, 130, 935–944. [Google Scholar] [CrossRef]
- Gao, W.; Alsarraf, J.; Moayedi, H.; Shahsavar, A.; Nguyen, H. Comprehensive Preference Learning and Feature Validity for Designing Energy-Efficient Residential Buildings Using Machine Learning Paradigms. Appl. Soft Comput. 2019, 84, 105748. [Google Scholar] [CrossRef]
- Dogan, T.; Reinhart, C. Shoeboxer: An Algorithm for Abstracted Rapid Multi-Zone Urban Building Energy Model Generation and Simulation. Energy Build. 2017, 140, 140–153. [Google Scholar] [CrossRef]
- Egan, J.; Finn, D.; Soares, P.H.D.; Baumann, V.A.R.; Aghamolaei, R.; Beagon, P.; Neu, O.; Pallonetto, F.; O’Donnell, J. Definition of a Useful Minimal-Set of Accurately-Specified Input Data for Building Energy Performance Simulation. Energy Build. 2018, 165, 172–183. [Google Scholar] [CrossRef] [Green Version]
- Zhao, H.; Magoulès, F. A Review on the Prediction of Building Energy Consumption. Renew. Sustain. Energy Rev. 2012, 16, 3586–3592. [Google Scholar] [CrossRef]
- Yezioro, A.; Dong, B.; Leite, F. An Applied Artificial Intelligence Approach towards Assessing Building Performance Simulation Tools. Energy Build. 2008, 40, 612–620. [Google Scholar] [CrossRef]
- Catalina, T.; Virgone, J.; Blanco, E. Development and Validation of Regression Models to Predict Monthly Heating Demand for Residential Buildings. Energy Build. 2008, 40, 1825–1832. [Google Scholar] [CrossRef]
- Shahin, M.A. Intelligent Computing for Modeling Axial Capacity of Pile Foundations. Can. Geotech. J. 2010, 47, 230–243. [Google Scholar] [CrossRef] [Green Version]
- Lee, I.-M.; Lee, J.-H. Prediction of Pile Bearing Capacity Using Artificial Neural Networks. Comput. Geotech. 1996, 18, 189–200. [Google Scholar] [CrossRef]
- Dibike, Y.B.; Velickov, S.; Solomatine, D.; Abbott, M.B. Model Induction with Support Vector Machines: Introduction and Applications. J. Comput. Civ. Eng. 2001, 15, 208–216. [Google Scholar] [CrossRef]
- Shahin, M.A.; Maier, H.R.; Jaksa, M.B. Predicting Settlement of Shallow Foundations Using Neural Networks. J. Geotech. Geoenviron. Eng. 2002, 128, 785–793. [Google Scholar] [CrossRef]
- Nejad, F.P.; Jaksa, M.B.; Kakhi, M.; McCabe, B.A. Prediction of Pile Settlement Using Artificial Neural Networks Based on Standard Penetration Test Data. Comput. Geotech. 2009, 36, 1125–1133. [Google Scholar] [CrossRef] [Green Version]
- Makasis, N.; Narsilio, G.A.; Bidarmaghz, A. A Machine Learning Approach to Energy Pile Design. Comput. Geotech. 2018, 97, 189–203. [Google Scholar] [CrossRef]
- Goh, A.T.C.; Goh, S.H. Support Vector Machines: Their Use in Geotechnical Engineering as Illustrated Using Seismic Liquefaction Data. Comput. Geotech. 2007, 34, 410–421. [Google Scholar] [CrossRef]
- Samui, P. Support Vector Machine Applied to Settlement of Shallow Foundations on Cohesionless Soils. Comput. Geotech. 2008, 35, 419–427. [Google Scholar] [CrossRef]
- Samui, P.; Sitharam, T.G.; Kurup, P.U. OCR Prediction Using Support Vector Machine Based on Piezocone Data. J. Geotech. Geoenviron. Eng. 2008, 134, 894–898. [Google Scholar] [CrossRef]
- Pal, M.; Deswal, S. Modelling Pile Capacity Using Gaussian Process Regression. Comput. Geotech. 2010, 37, 942–947. [Google Scholar] [CrossRef]
- Adarsh, S.; Dhanya, R.; Krishna, G.; Merlin, R.; Tina, J. Prediction of Ultimate Bearing Capacity of Cohesionless Soils Using Soft Computing Techniques. Int. Sch. Res. Not. 2012, 2012, 628496. [Google Scholar] [CrossRef] [Green Version]
- Pal, M.; Deswal, S. Modeling Pile Capacity Using Support Vector Machines and Generalized Regression Neural Network. J. Geotech. Geoenviron. Eng. 2008, 134, 1021–1024. [Google Scholar] [CrossRef]
- Zhang, W.; Wu, C.; Li, Y.; Wang, L.; Samui, P. Assessment of Pile Drivability Using Random Forest Regression and Multivariate Adaptive Regression Splines. Georisk Assess. Manag. Risk Eng. Syst. Geohazards 2021, 15, 27–40. [Google Scholar] [CrossRef]
- Zhao, Z.; Duan, W.; Cai, G.; Wu, M.; Liu, S. CPT-Based Fully Probabilistic Seismic Liquefaction Potential Assessment to Reduce Uncertainty: Integrating XGBoost Algorithm with Bayesian Theorem. Comput. Geotech. 2022, 149, 104868. [Google Scholar] [CrossRef]
- Huat, C.Y.; Moosavi, S.M.H.; Mohammed, A.S.; Armaghani, D.J.; Ulrikh, D.V.; Monjezi, M.; Hin Lai, S. Factors Influencing Pile Friction Bearing Capacity: Proposing a Novel Procedure Based on Gradient Boosted Tree Technique. Sustainability 2021, 13, 11862. [Google Scholar] [CrossRef]
- ISO/TS 17892-4. Geotechnical Investigation and Testing–Laboratory Testing of Soil—Part 4: Determination of Particle Size Distribution. ISO: Geneva, Switzerland, 2004.
- ISO E.N. 22476-1. Geotechnical Investigation and Testing—Field Testing—Part 1: Electrical Cone and Piezocone Penetration Test. ISO: Geneva, Switzerland, 2012.
- Di Buo, B. Evaluation of the Preconsolidation Stress and Deformation Characteristics of Finnish Clays Based on Piezocone Testing. Ph.D. Thesis, Tampere University, Tampere, Finland, 2020. [Google Scholar]
- Bhattacharya, S.; Carrington, T.M.; Aldridge, T.R. Buckling Considerations in Pile Design. In Proceedings of the International Symposium on Frontiers in Offshore Geotechnics, Perth, Australia, 19–21 September 2005; pp. 815–821. [Google Scholar]
- Gao, J.; Zhang, X.; Liu, J.; Li, K.; Yang, J. Numerical and Experimental Assessment of Thermal Performance of Vertical Energy Piles: An Application. Appl. Energy 2008, 85, 901–910. [Google Scholar] [CrossRef]
- Sani, A.K.; Singh, R.M.; Amis, T.; Cavarretta, I. A Review on the Performance of Geothermal Energy Pile Foundation, Its Design Process and Applications. Renew. Sustain. Energy Rev. 2019, 106, 54–78. [Google Scholar] [CrossRef]
- Gashti, E.H.N.; Uotinen, V.-M.; Kujala, K. Numerical Modelling of Thermal Regimes in Steel Energy Pile Foundations: A Case Study. Energy Build. 2014, 69, 165–174. [Google Scholar] [CrossRef]
- Gashti, E.H.N.; Malaska, M.; Kujala, K. Evaluation of Thermo-Mechanical Behaviour of Composite Energy Piles during Heating/Cooling Operations. Eng. Struct. 2014, 75, 363–373. [Google Scholar] [CrossRef]
- Kukkonen, I.T. Geothermal Energy in Finland. In Proceedings of the World Geothermal Congress 2000, Kyushu-Tohoku, Japan, 28 May–10 June 2000; pp. 277–282. [Google Scholar]
- Laloui, L. Thermo-Mechanical Behaviour of Soils. Rev. Fr. Génie Civ. 2001, 5, 809–843. [Google Scholar] [CrossRef]
- Murthy, V.N.S. Geotechnical Engineering: Principles and Practices of Soil Mechanics and Foundation Engineering; CRC Press: Boca Raton, FL, USA, 2002; ISBN 0824708733. [Google Scholar]
- Schmertmann, J.H. Guidelines for Cone Penetration Test: Performance and Design; Federal Highway Administration: Washington, DC, USA, 1978. [Google Scholar]
- 4-I.S. 2911-Part 1. Section Design and Construction of Pile Foundations–Code of Practice. ISO: Geneva, Switzerland, 2010.
- Xue, J.-F.; Gavin, K. Simultaneous Determination of Critical Slip Surface and Reliability Index for Slopes. J. Geotech. Geoenviron. Eng. 2007, 133, 878–886. [Google Scholar] [CrossRef]
- Breiman, L. Random Forests. Mach. Learn. 2001, 45, 5–32. [Google Scholar] [CrossRef] [Green Version]
- Breiman, L.; Friedman, J.; Stone, C.J.; Olshen, R.A. Classification and Regression Trees; Taylor & Francis: Abingdon, UK, 1984. [Google Scholar]
- Vapnik, V. The Nature of Statistical Learning Theory; Springer Science & Business Media: Cham, Switzerland, 1999; ISBN 0387987800. [Google Scholar]
- Smola, A.J. Regression Estimation with Support Vector Learning Machines. Master’s Thesis, Technische Universität München, Munich, Germany, 1996. [Google Scholar]
- Cortes, C.; Vapnik, V. Support-Vector Networks. Mach. Learn. 1995, 20, 273–297. [Google Scholar] [CrossRef]
- Smola, A.J.; Schölkopf, B. A Tutorial on Support Vector Regression; Rep. No; NC2-TR-1998-030. NeuroCOLT2 Technical Report Series; Springer: Berlin/Heidelberg, Germany, 1998. [Google Scholar]
- Cristianini, N.; Shawe-Taylor, J. An Introduction to Support Vector Machines and Other Kernel-Based Learning Methods; Cambridge University Press: Cambridge, UK, 2000; ISBN 0521780195. [Google Scholar]
- Samui, P.; Dixon, B. Application of Support Vector Machine and Relevance Vector Machine to Determine Evaporative Losses in Reservoirs. Hydrol. Process. 2012, 26, 1361–1369. [Google Scholar] [CrossRef]
- Chen, T.; He, T.; Benesty, M.; Khotilovich, V.; Tang, Y.; Cho, H.; Chen, K. Xgboost: Extreme Gradient Boosting; R Package Version 0.4-2; R Foundation for Statistical Computing: Vienna, Austria, 2015; Volume 1, pp. 1–4. [Google Scholar]
- Chen, T.; Guestrin, C. Xgboost: A Scalable Tree Boosting System. In Proceedings of the 22nd ACM SIGKDD International Conference on Knowledge Discovery and Data Mining, San Francisco, CA, USA, 13–17 August 2016; pp. 785–794. [Google Scholar]
- Chen, X.; Huang, L.; Xie, D.; Zhao, Q. EGBMMDA: Extreme Gradient Boosting Machine for MiRNA-Disease Association Prediction. Cell Death Dis. 2018, 9, 1–16. [Google Scholar] [CrossRef] [Green Version]
- Kardani, N.; Zhou, A.; Nazem, M.; Shen, S.-L. Estimation of Bearing Capacity of Piles in Cohesionless Soil Using Optimised Machine Learning Approaches. Geotech. Geol. Eng. 2020, 38, 2271–2291. [Google Scholar] [CrossRef]
- Chai, T.; Draxler, R.R. Root Mean Square Error (RMSE) or Mean Absolute Error (MAE)?–Arguments against Avoiding RMSE in the Literature. Geosci. Model Dev. 2014, 7, 1247–1250. [Google Scholar] [CrossRef] [Green Version]
- Behar, O.; Khellaf, A.; Mohammedi, K. Comparison of Solar Radiation Models and Their Validation under Algerian Climate–The Case of Direct Irradiance. Energy Convers. Manag. 2015, 98, 236–251. [Google Scholar] [CrossRef]
- Despotovic, M.; Nedic, V.; Despotovic, D.; Cvetanovic, S. Review and Statistical Analysis of Different Global Solar Radiation Sunshine Models. Renew. Sustain. Energy Rev. 2015, 52, 1869–1880. [Google Scholar] [CrossRef]
- Zhao, E.; Sun, S.; Wang, S. New Developments in Wind Energy Forecasting with Artificial Intelligence and Big Data: A Scientometric Insight. Data Sci. Manag. 2022, 5, 84–95. [Google Scholar] [CrossRef]
- Nejad, F.P.; Jaksa, M.B. Prediction of Pile Behavior Using Artificial Neural Networks Based on Standard Penetration Test Data. In Proceedings of the 13th International Conference of the IACMAG, Melbourne, Australia, 9–11 May 2011; pp. 564–569. [Google Scholar]
- Rotta Loria, A.F. Performance-Based Design of Energy Pile Foundations. DFI J. J. Deep Found. Inst. 2018, 12, 94–107. [Google Scholar] [CrossRef]
- Kumar, D.R.; Samui, P.; Burman, A. Prediction of Probability of Liquefaction Using Soft Computing Techniques. J. Inst. Eng. India Ser. A 2022, 103, 1195–1208. [Google Scholar] [CrossRef]
Figure 1.
Representation of geothermal energy pile system.
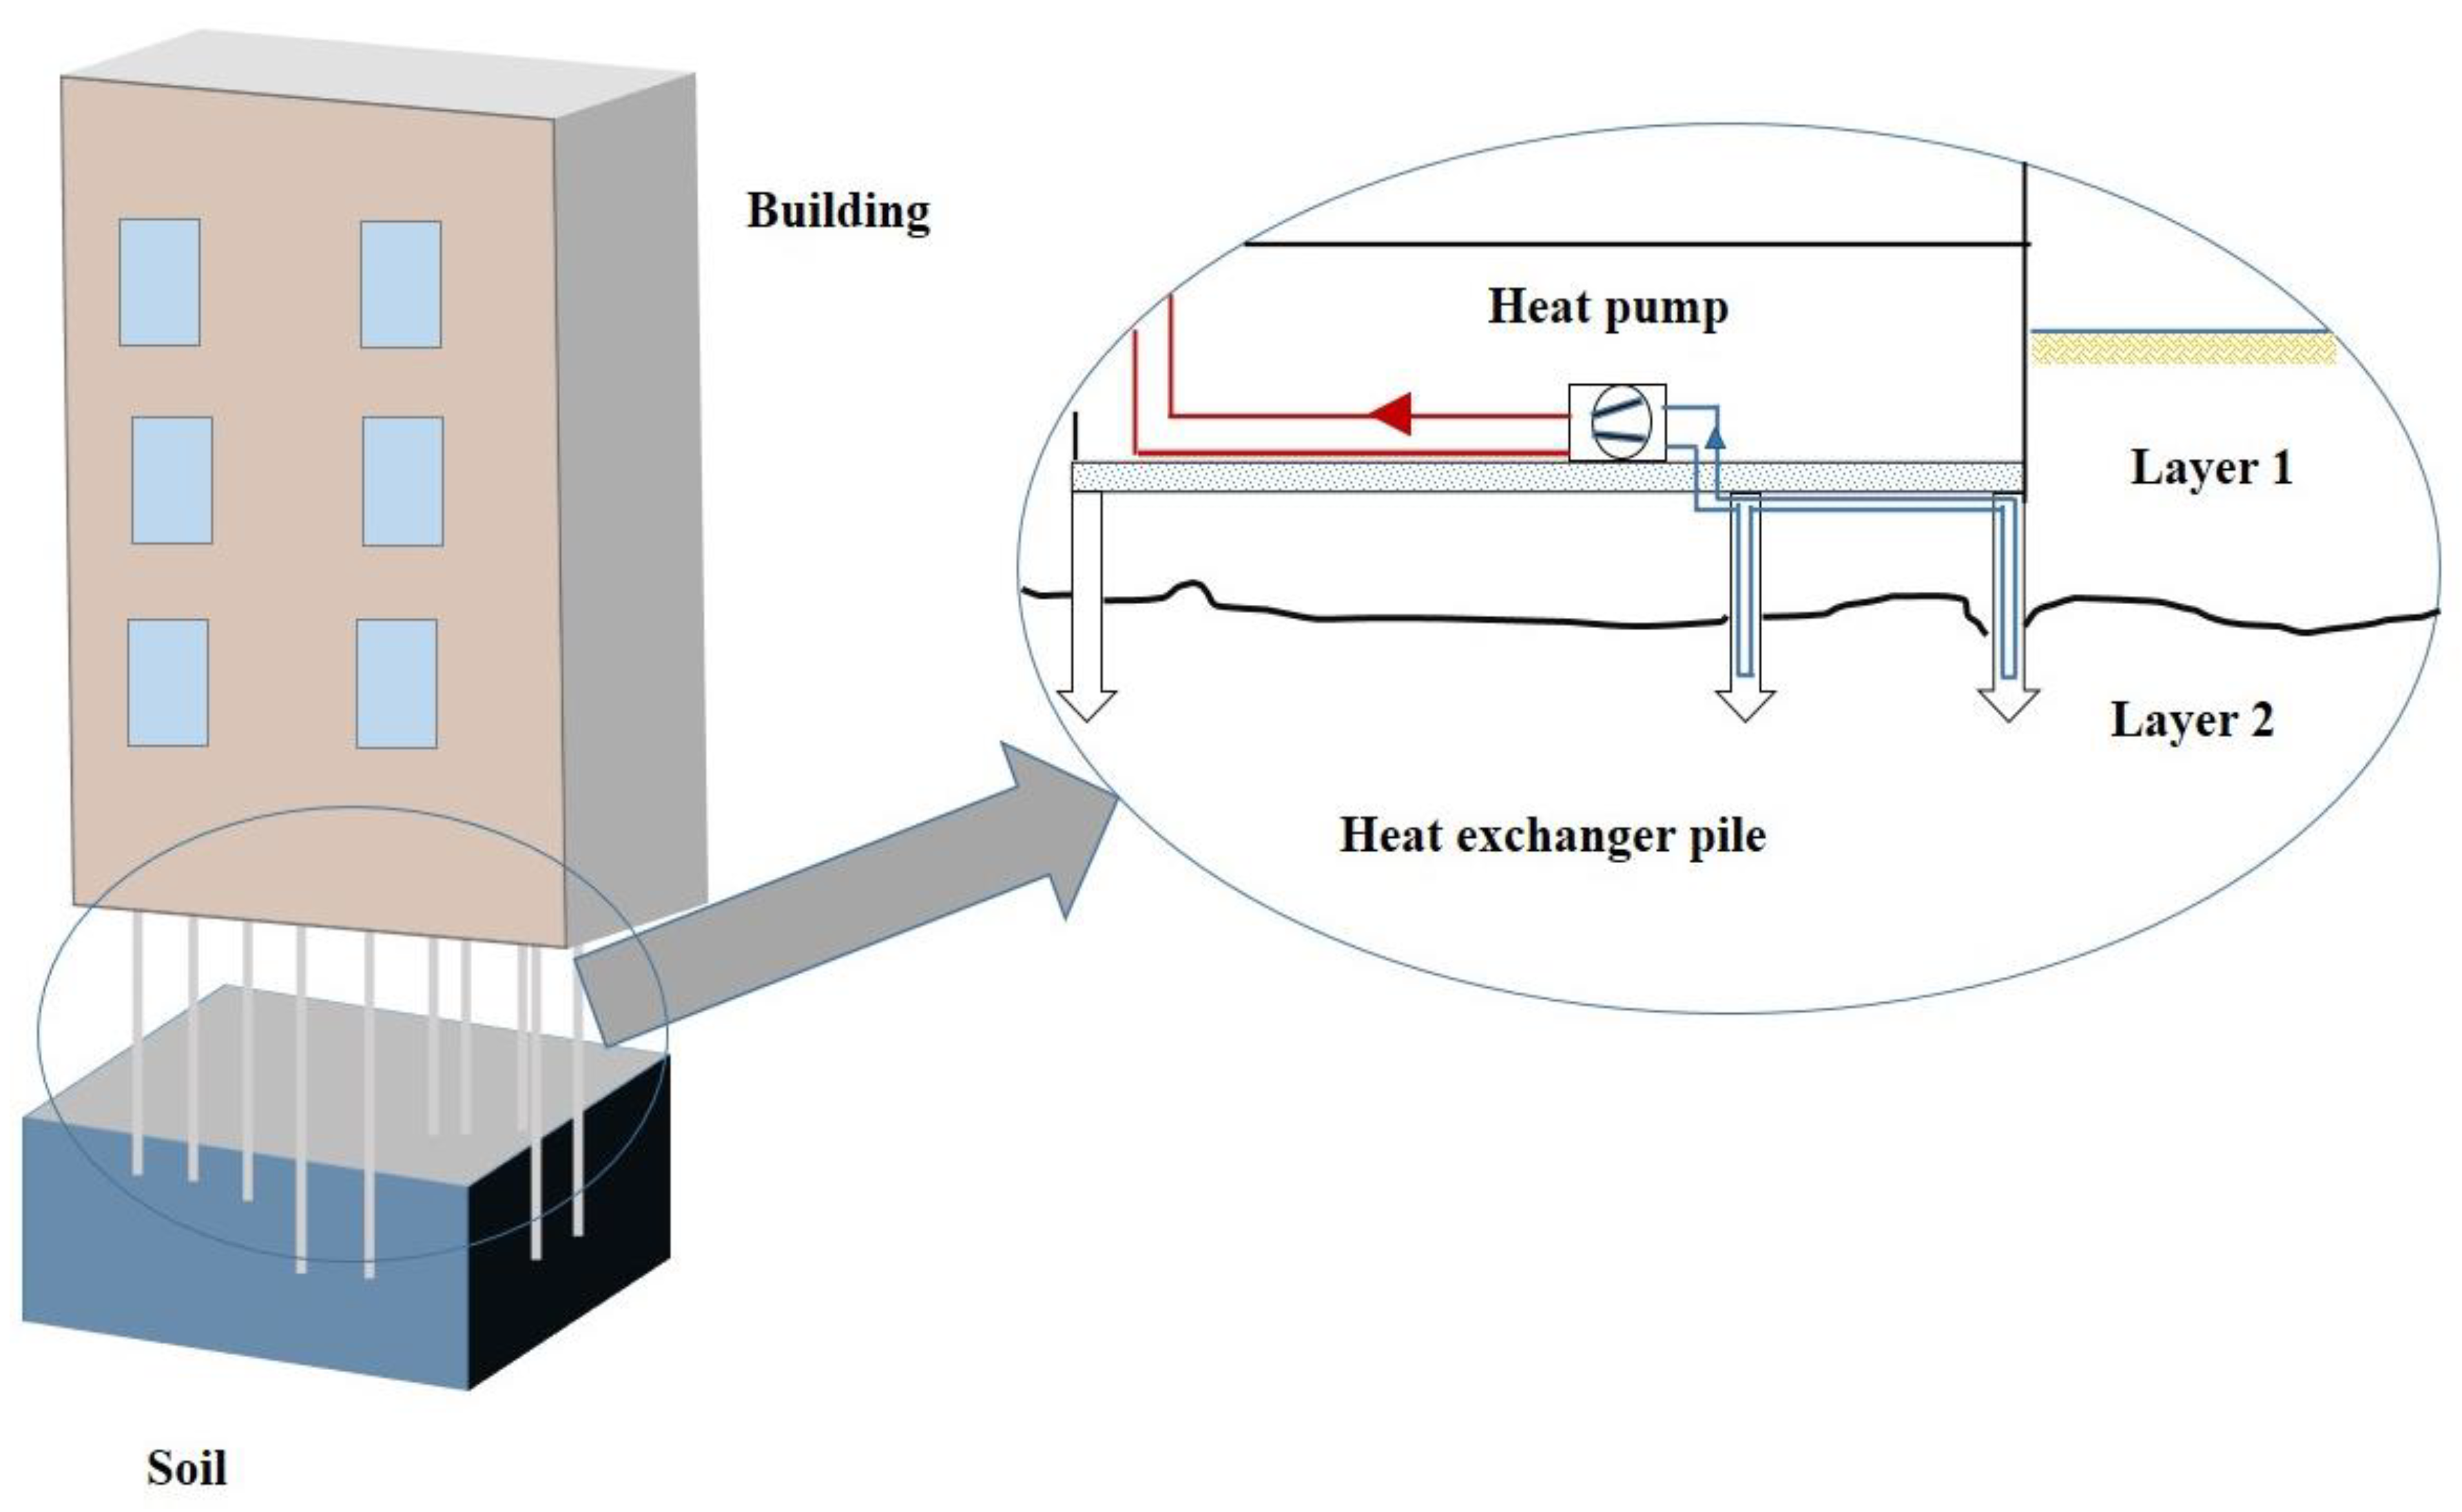
Figure 2.
Variation of geotechnical properties; (a) soil profile with depth (m); (b) moisture content w (%) with depth (m); (c) liquid limit (%) with depth (m); (d) plasticity index (%) with depth (m); (e) sensitivity (kPa) with depth (m); (f) clay fraction (%) with depth (m) [46].
Figure 2.
Variation of geotechnical properties; (a) soil profile with depth (m); (b) moisture content w (%) with depth (m); (c) liquid limit (%) with depth (m); (d) plasticity index (%) with depth (m); (e) sensitivity (kPa) with depth (m); (f) clay fraction (%) with depth (m) [46].
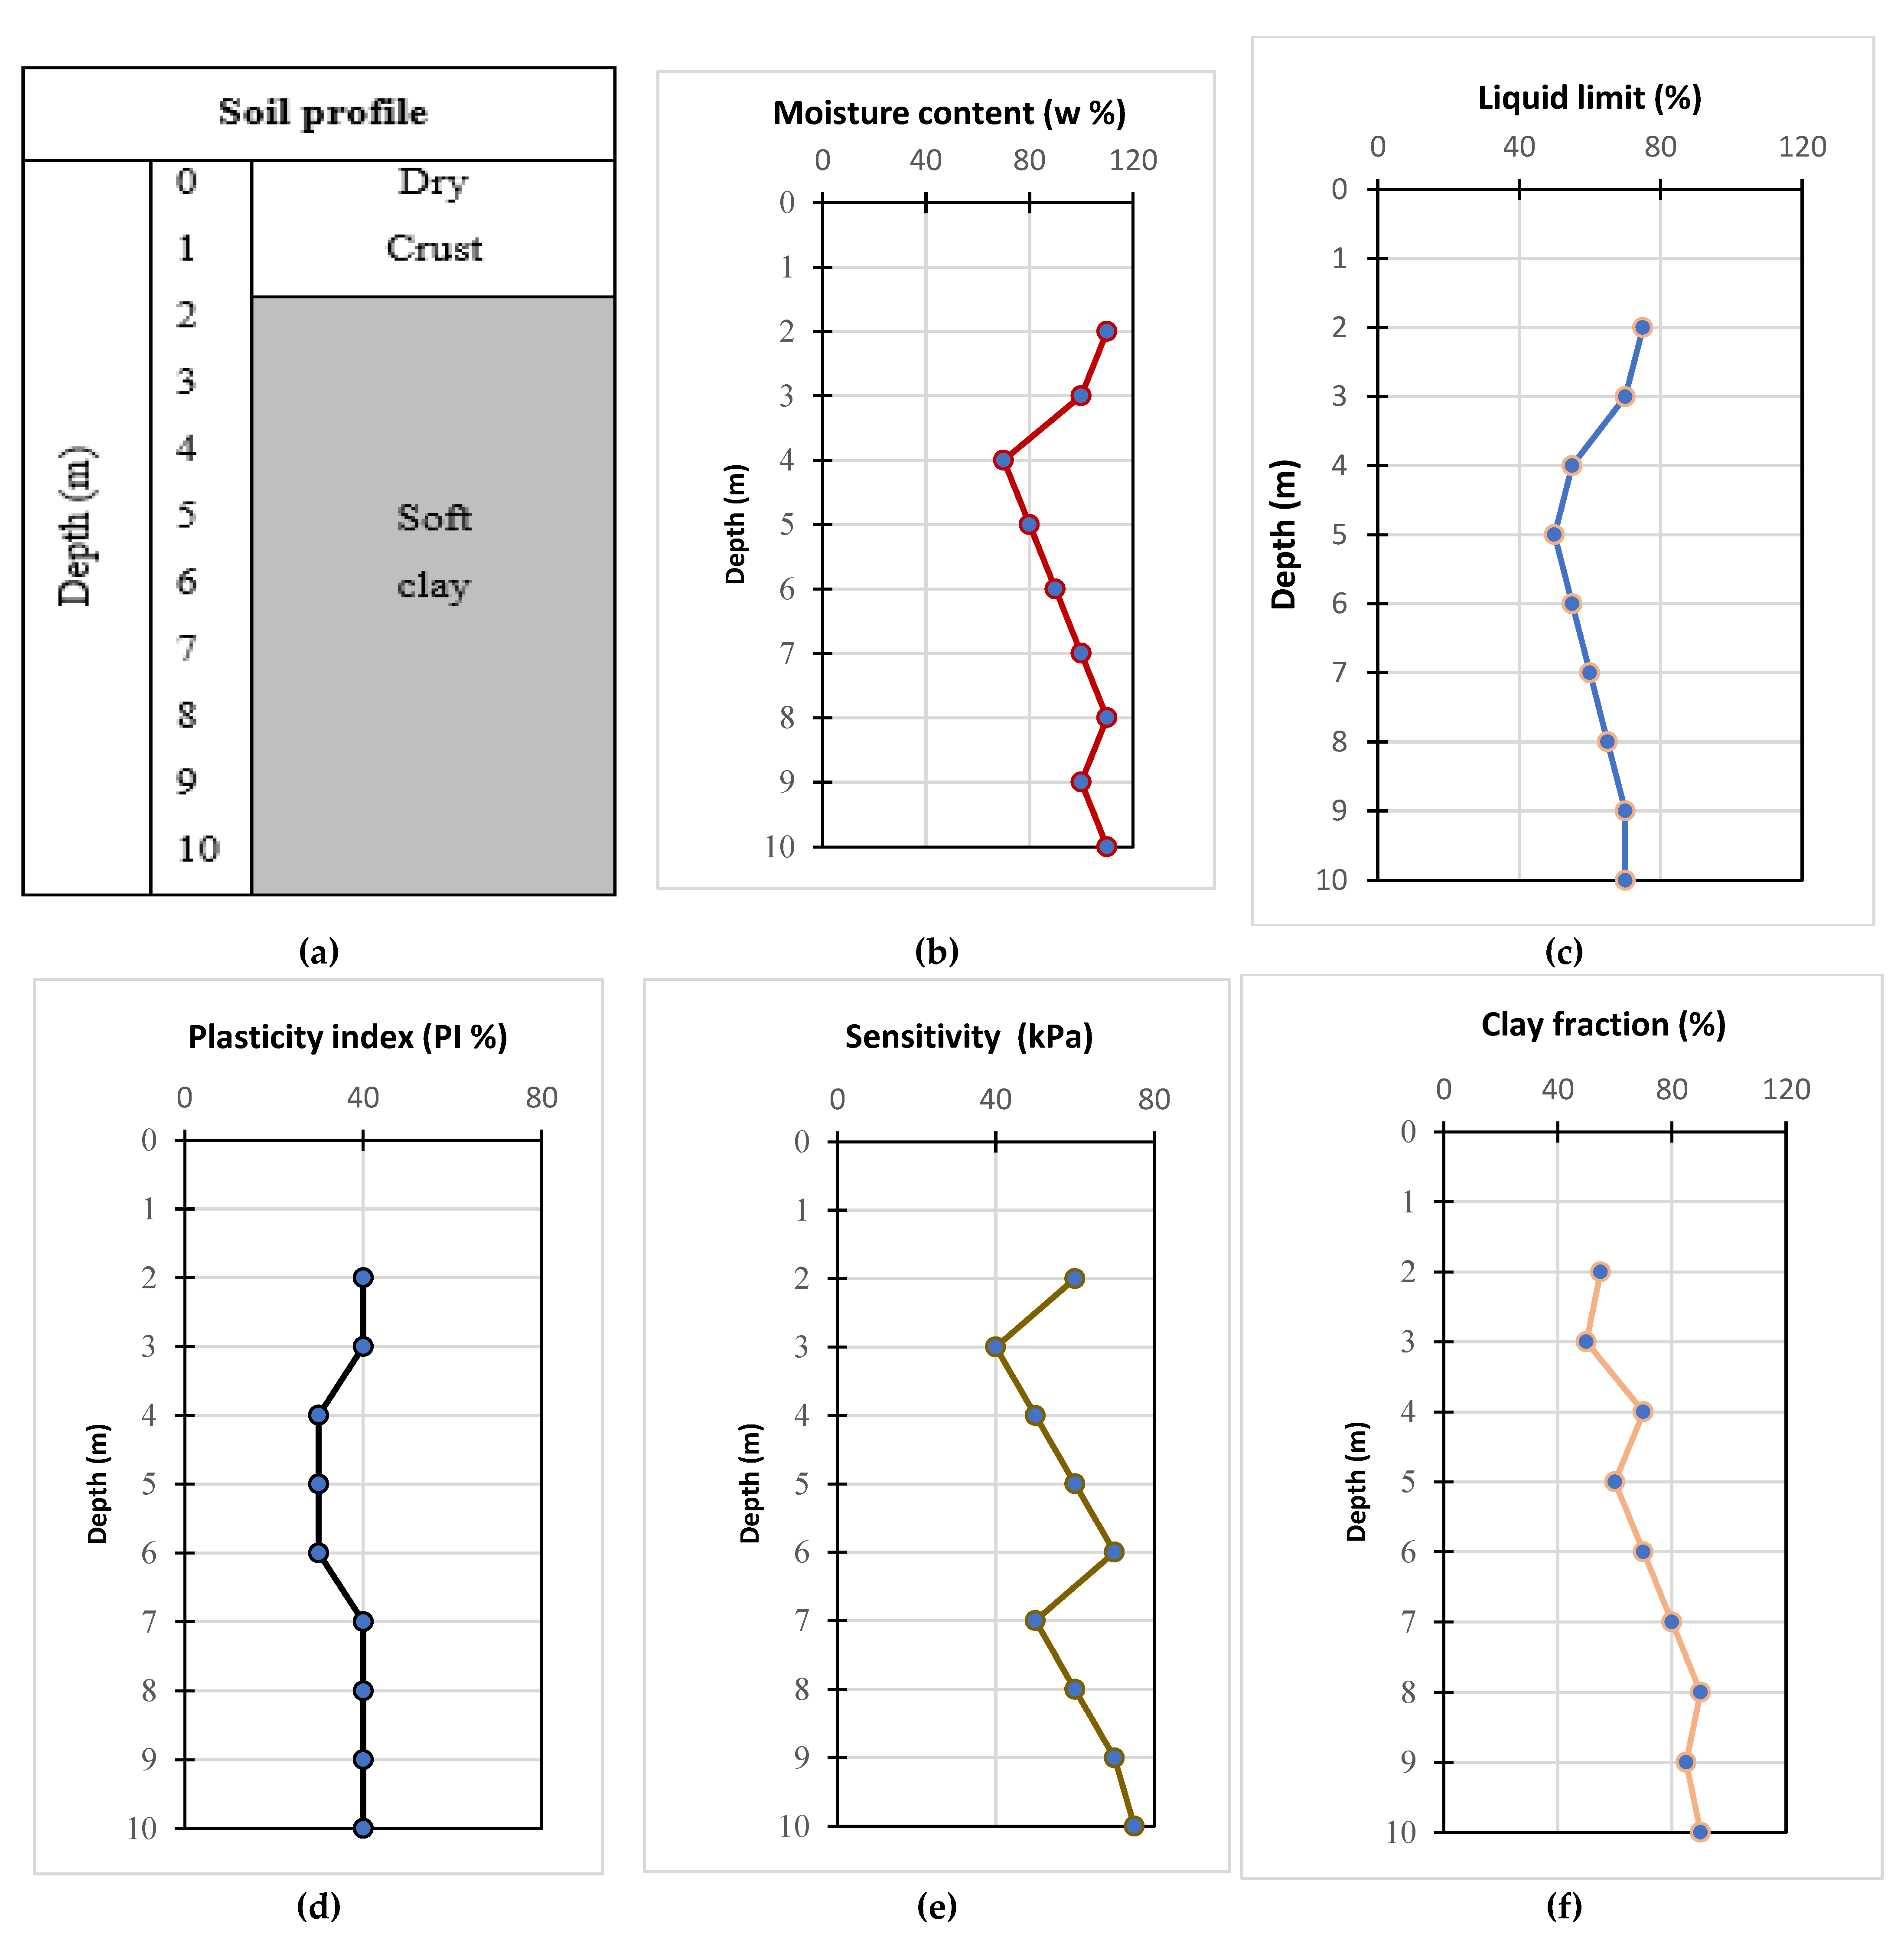
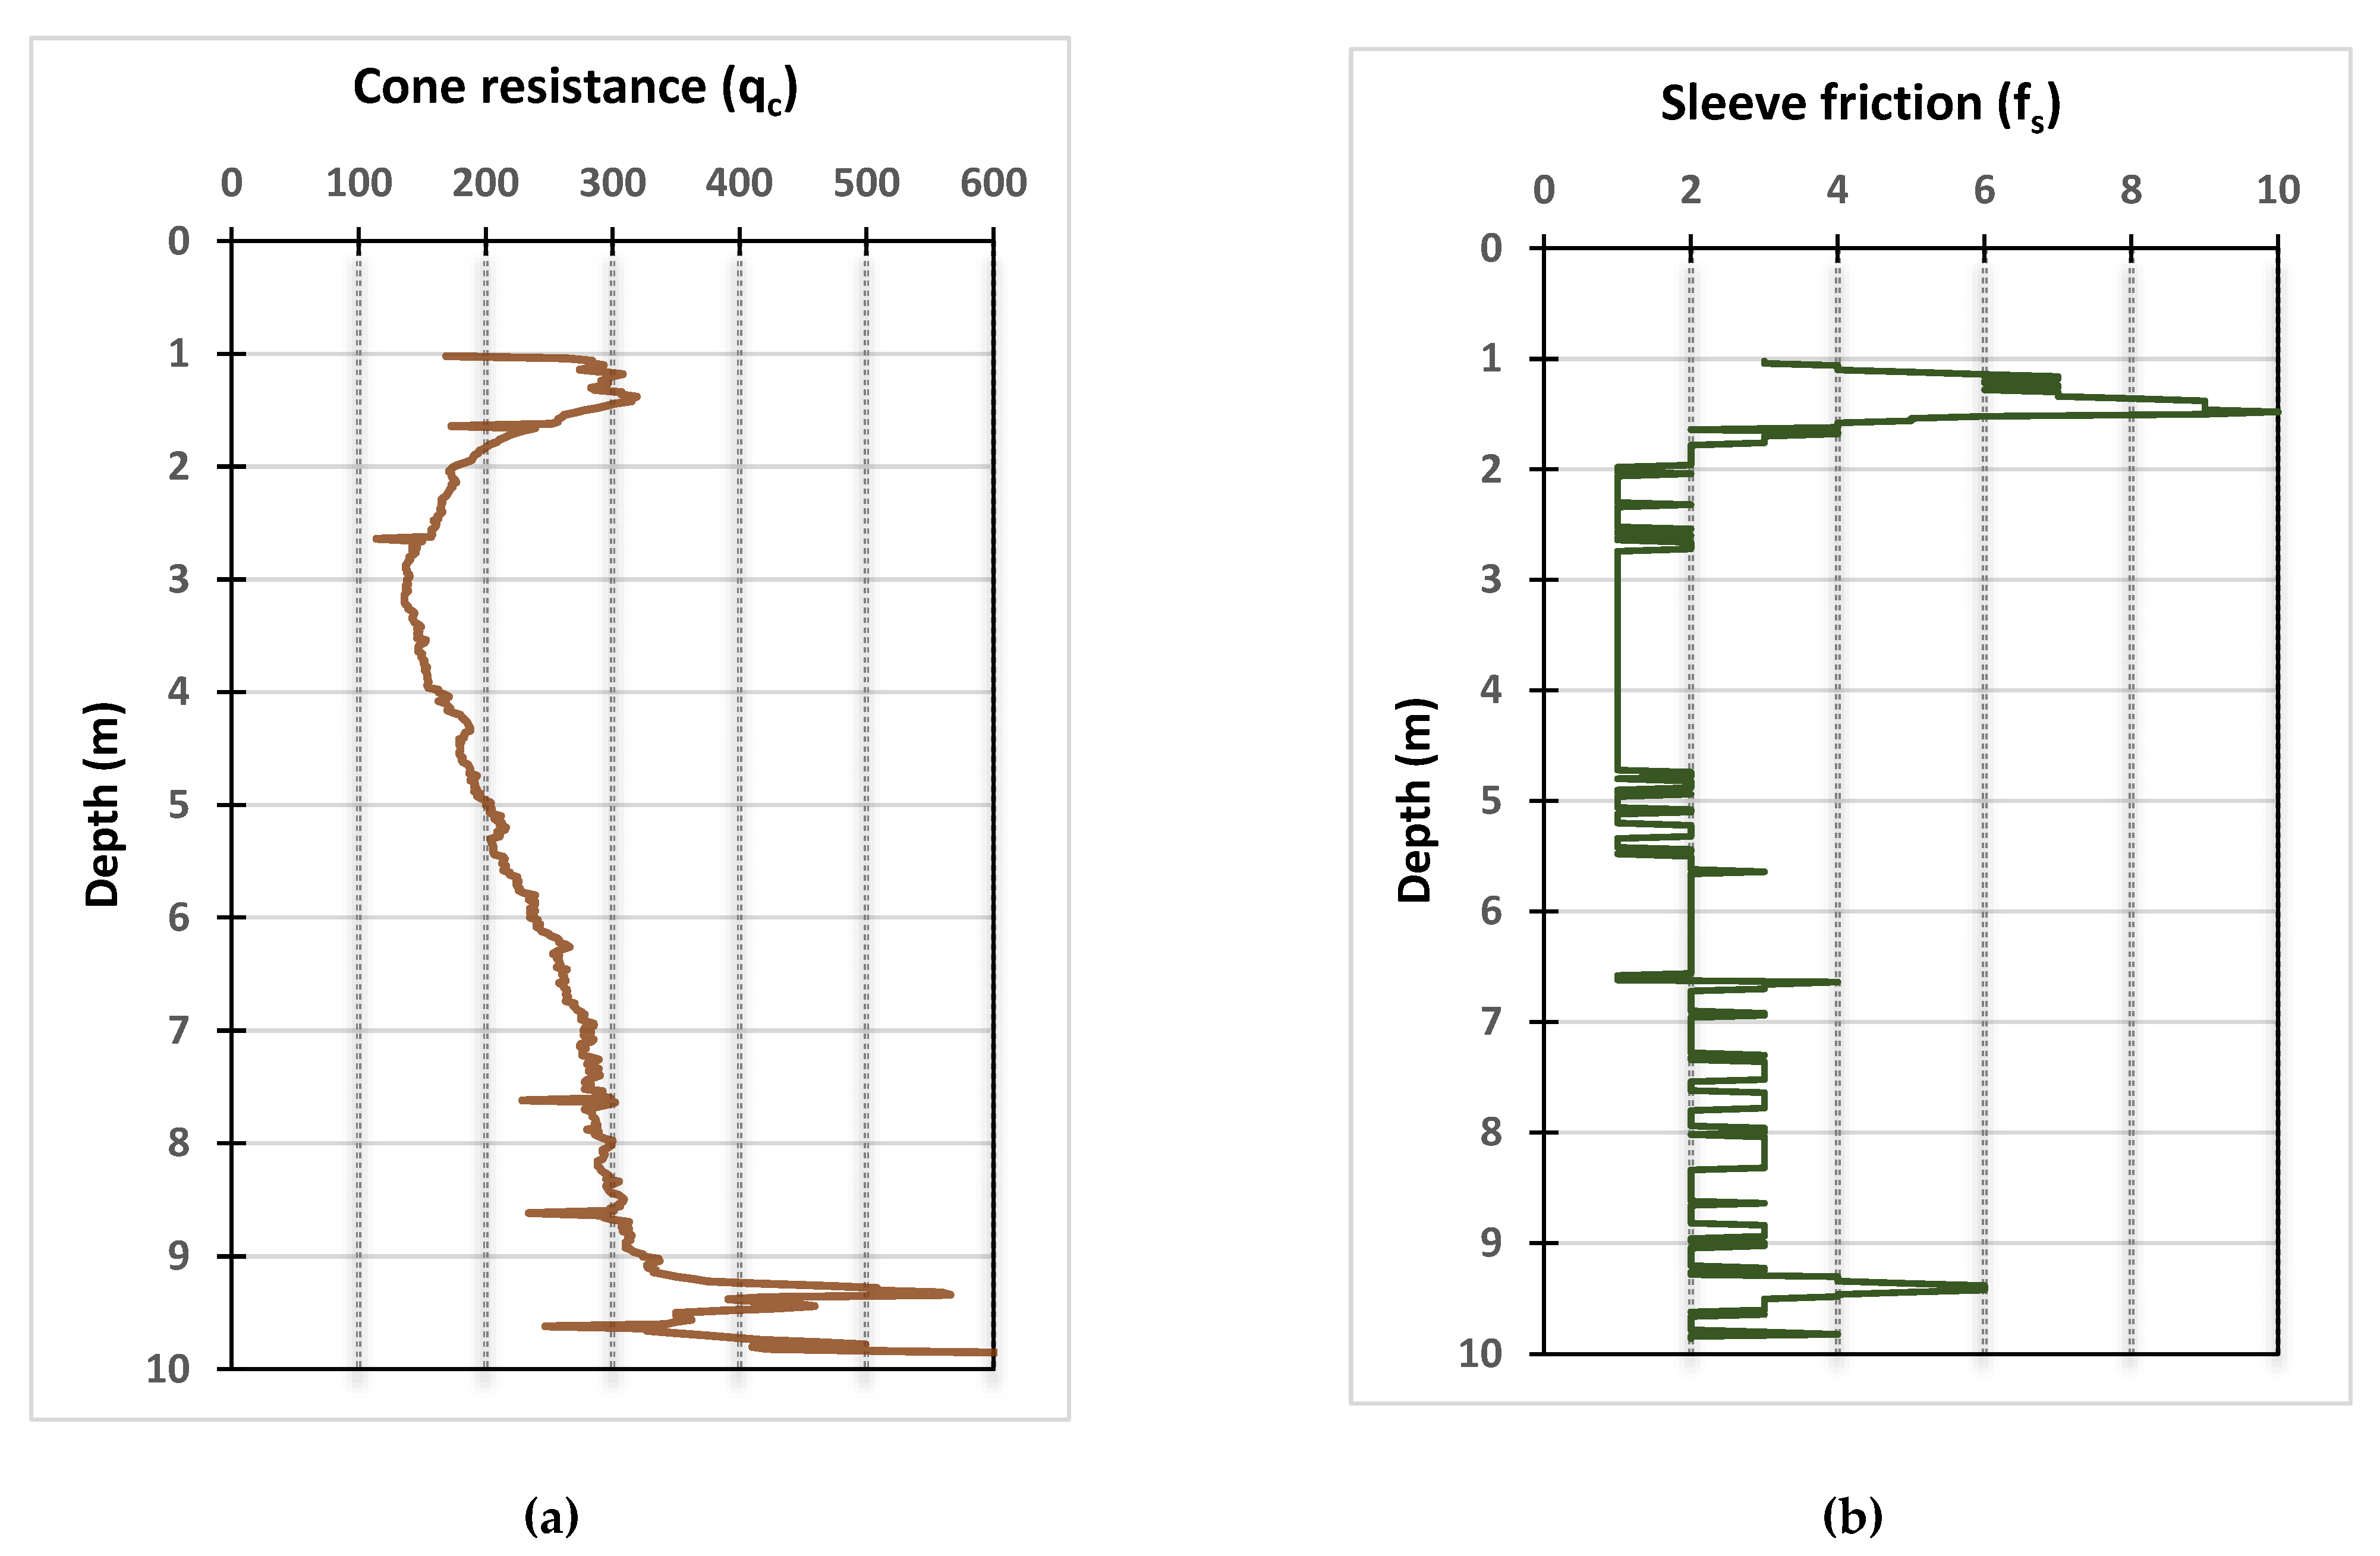
Figure 4.
Geometrical representation of reliability index.
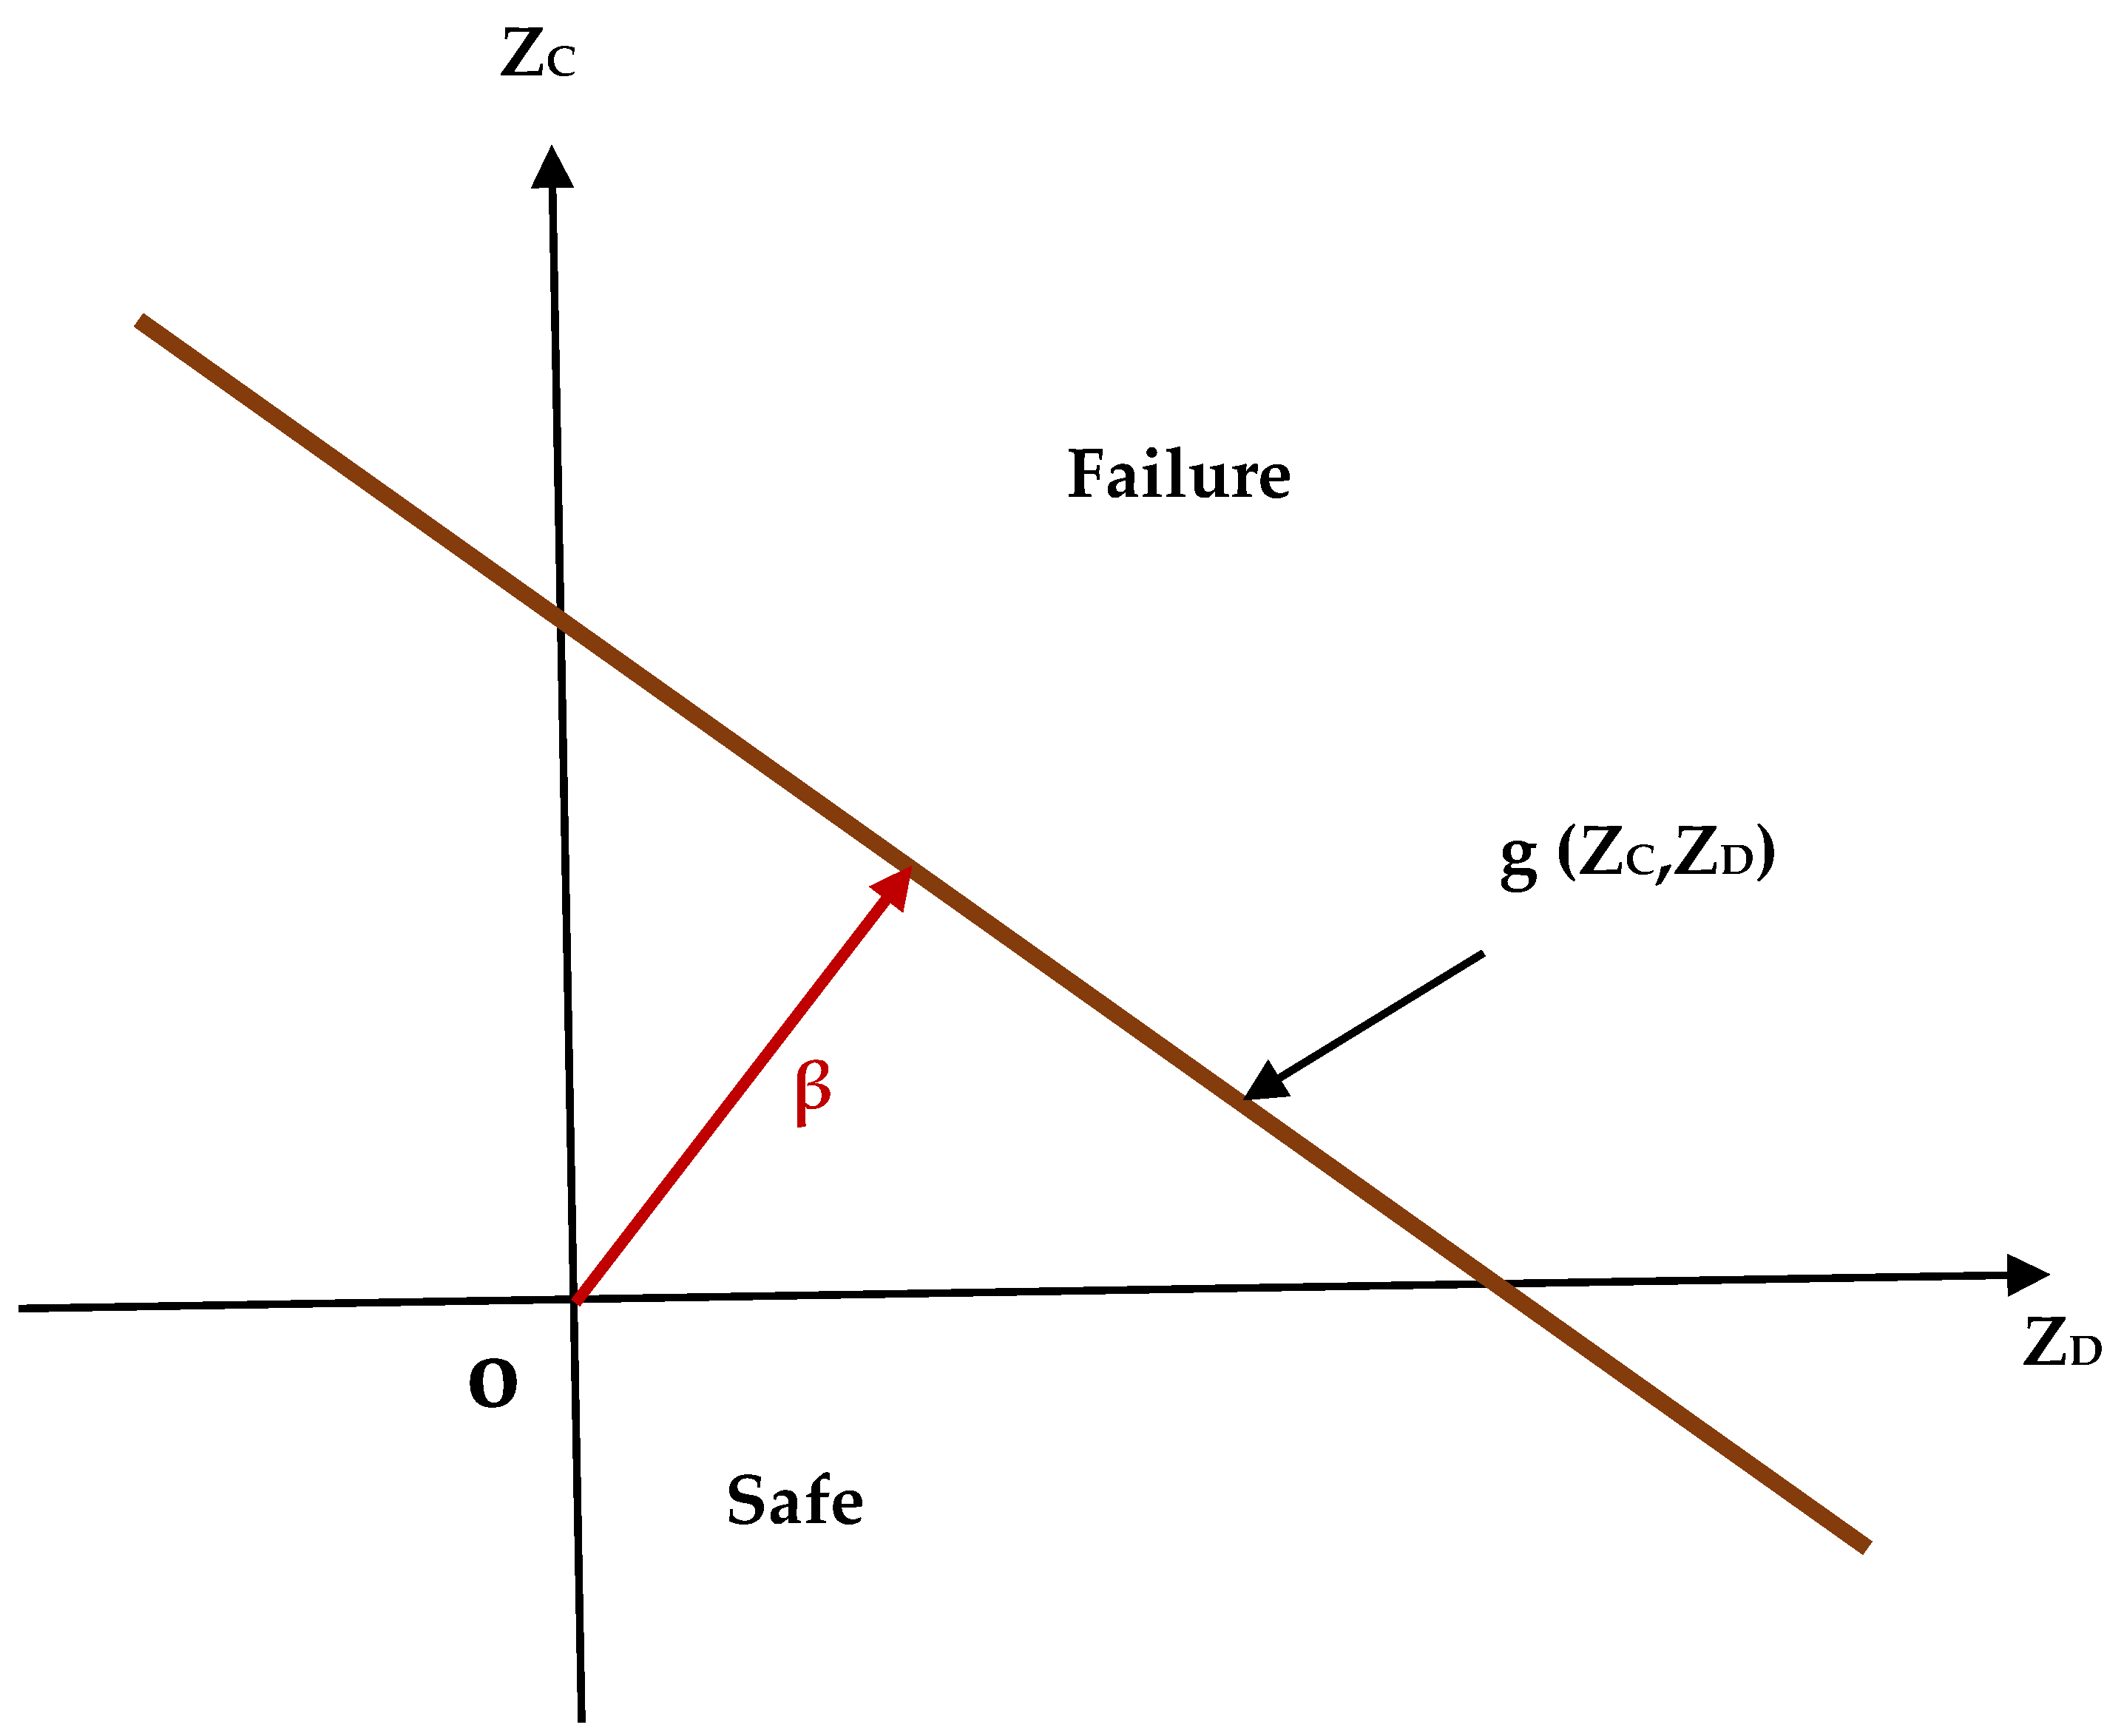
Figure 6.
Marginal plot for the pile group capacity (Qug) with (a) qc0, (b) qc1, (c) qc2, (d) qc, and (e) E.
Figure 6.
Marginal plot for the pile group capacity (Qug) with (a) qc0, (b) qc1, (c) qc2, (d) qc, and (e) E.
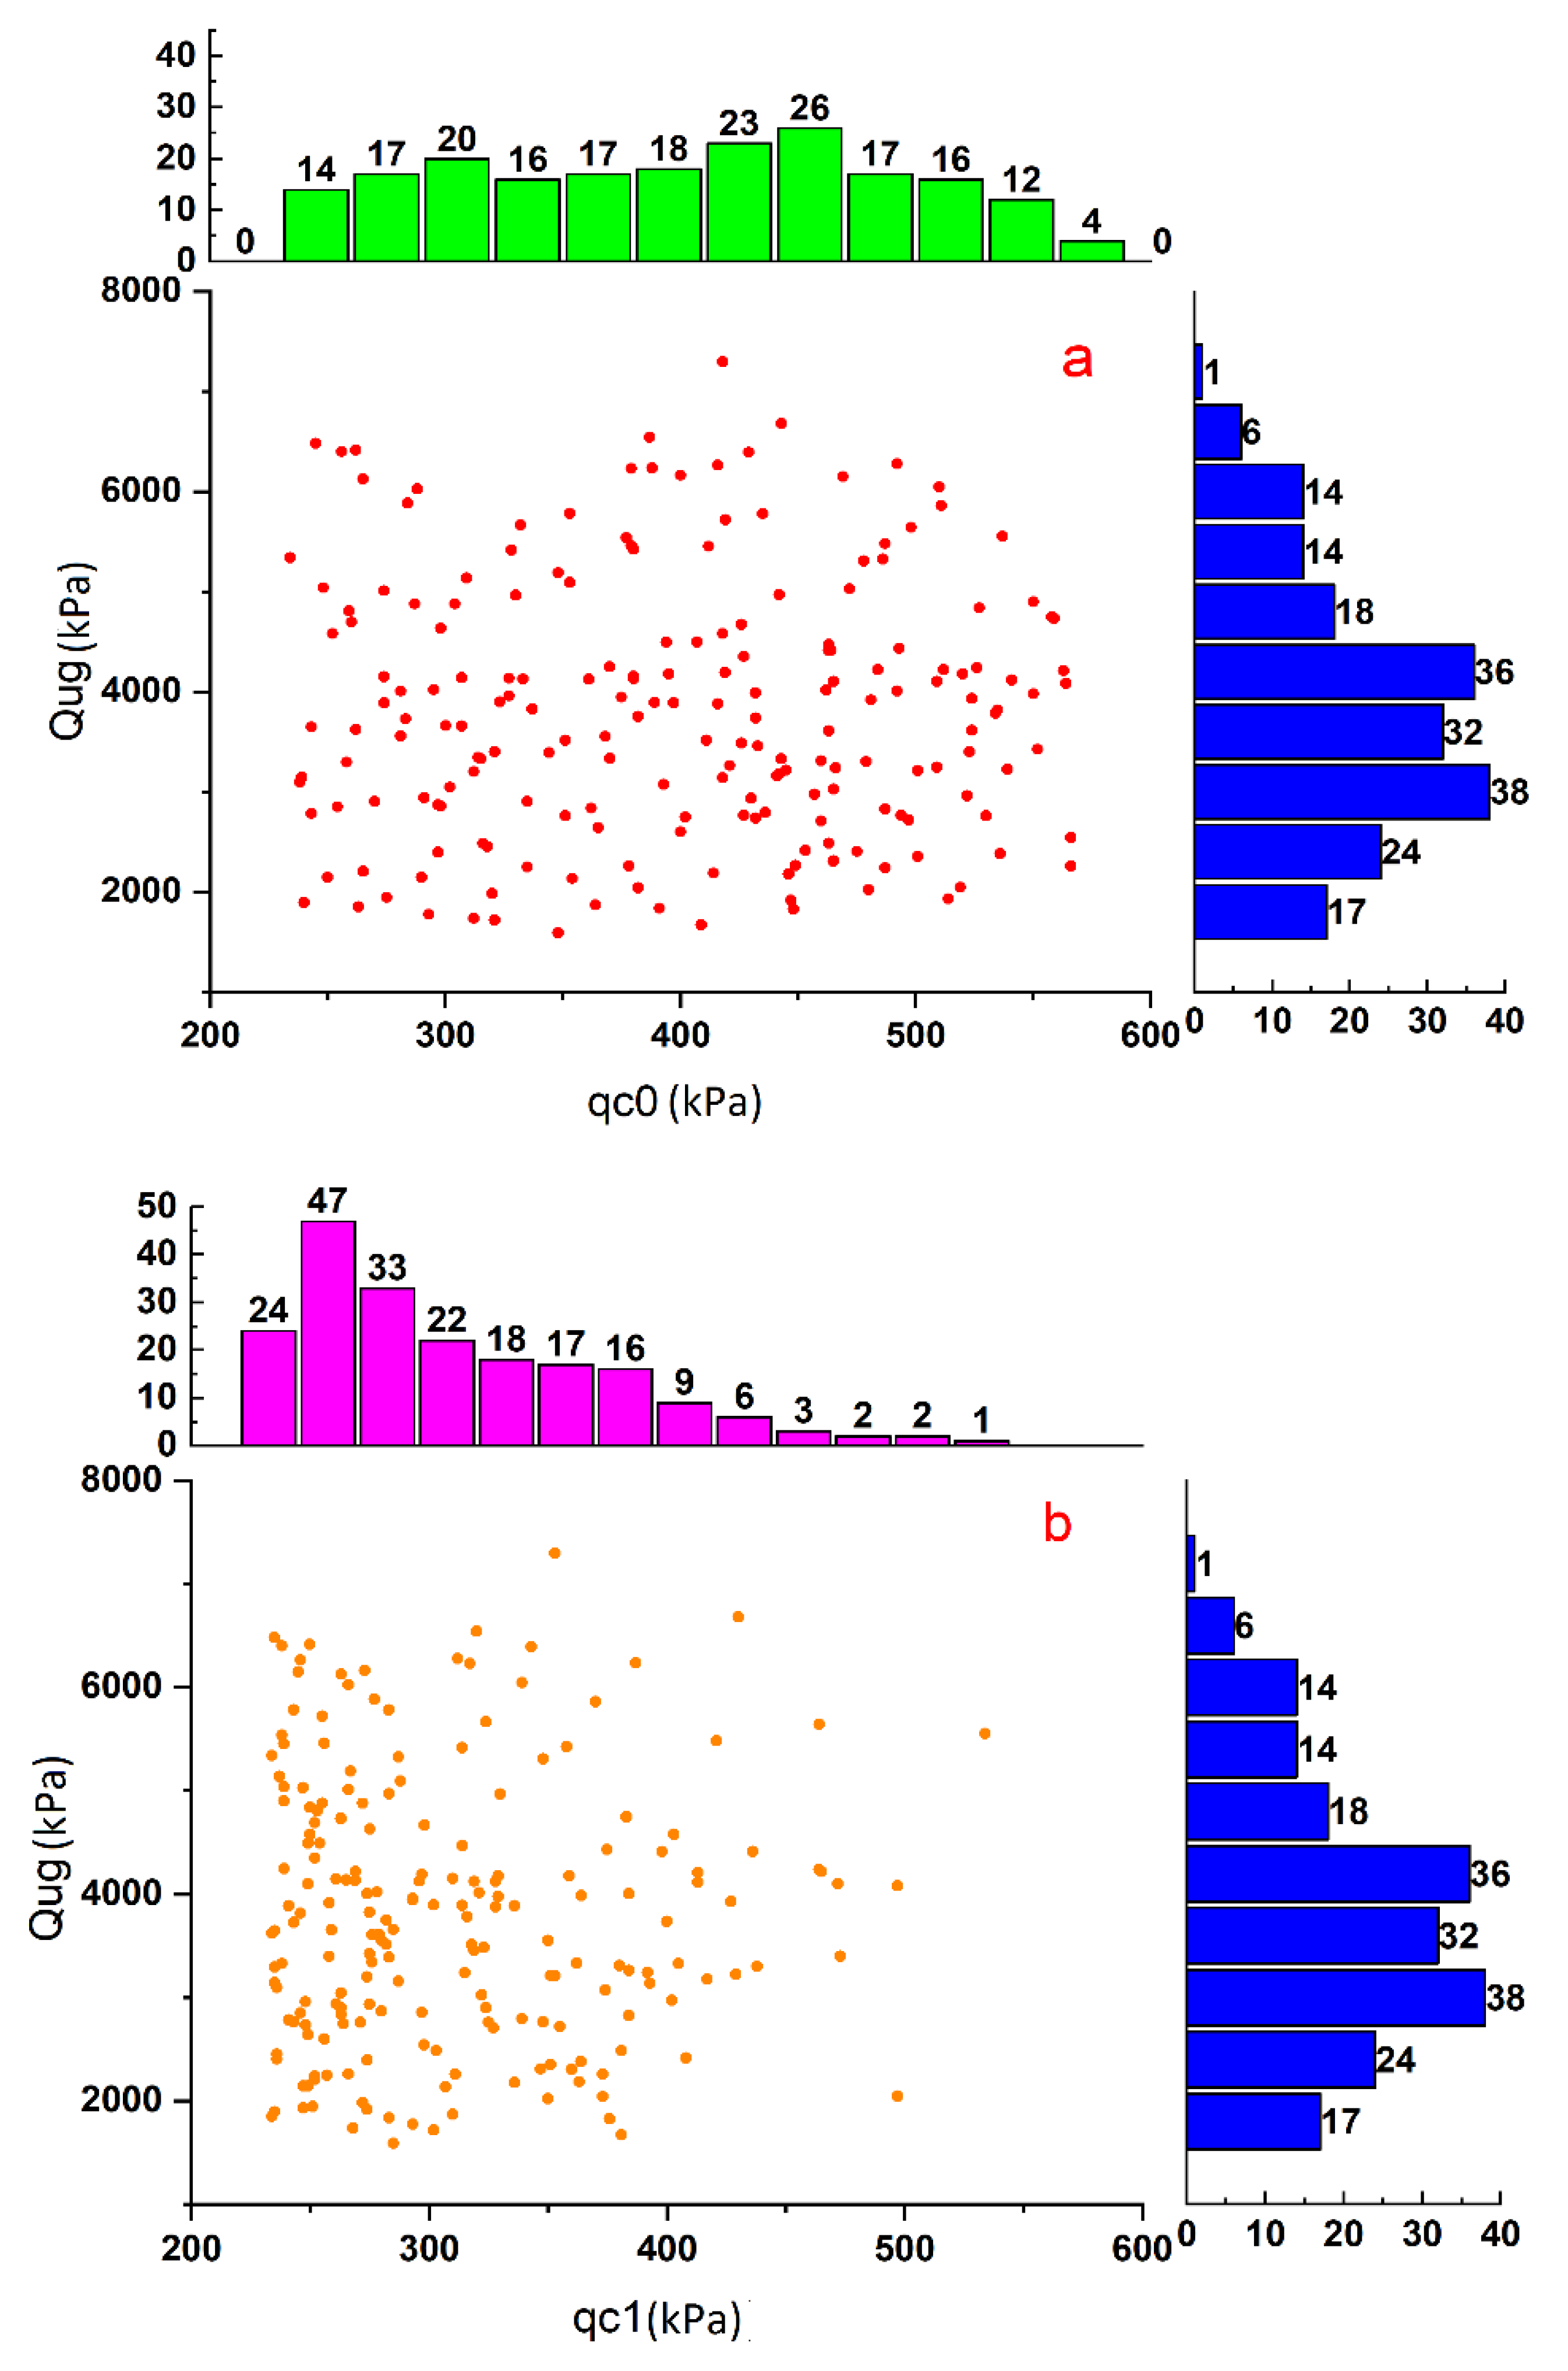


Figure 7.
Variation of thermal load (kN) with depth (m) of soil.
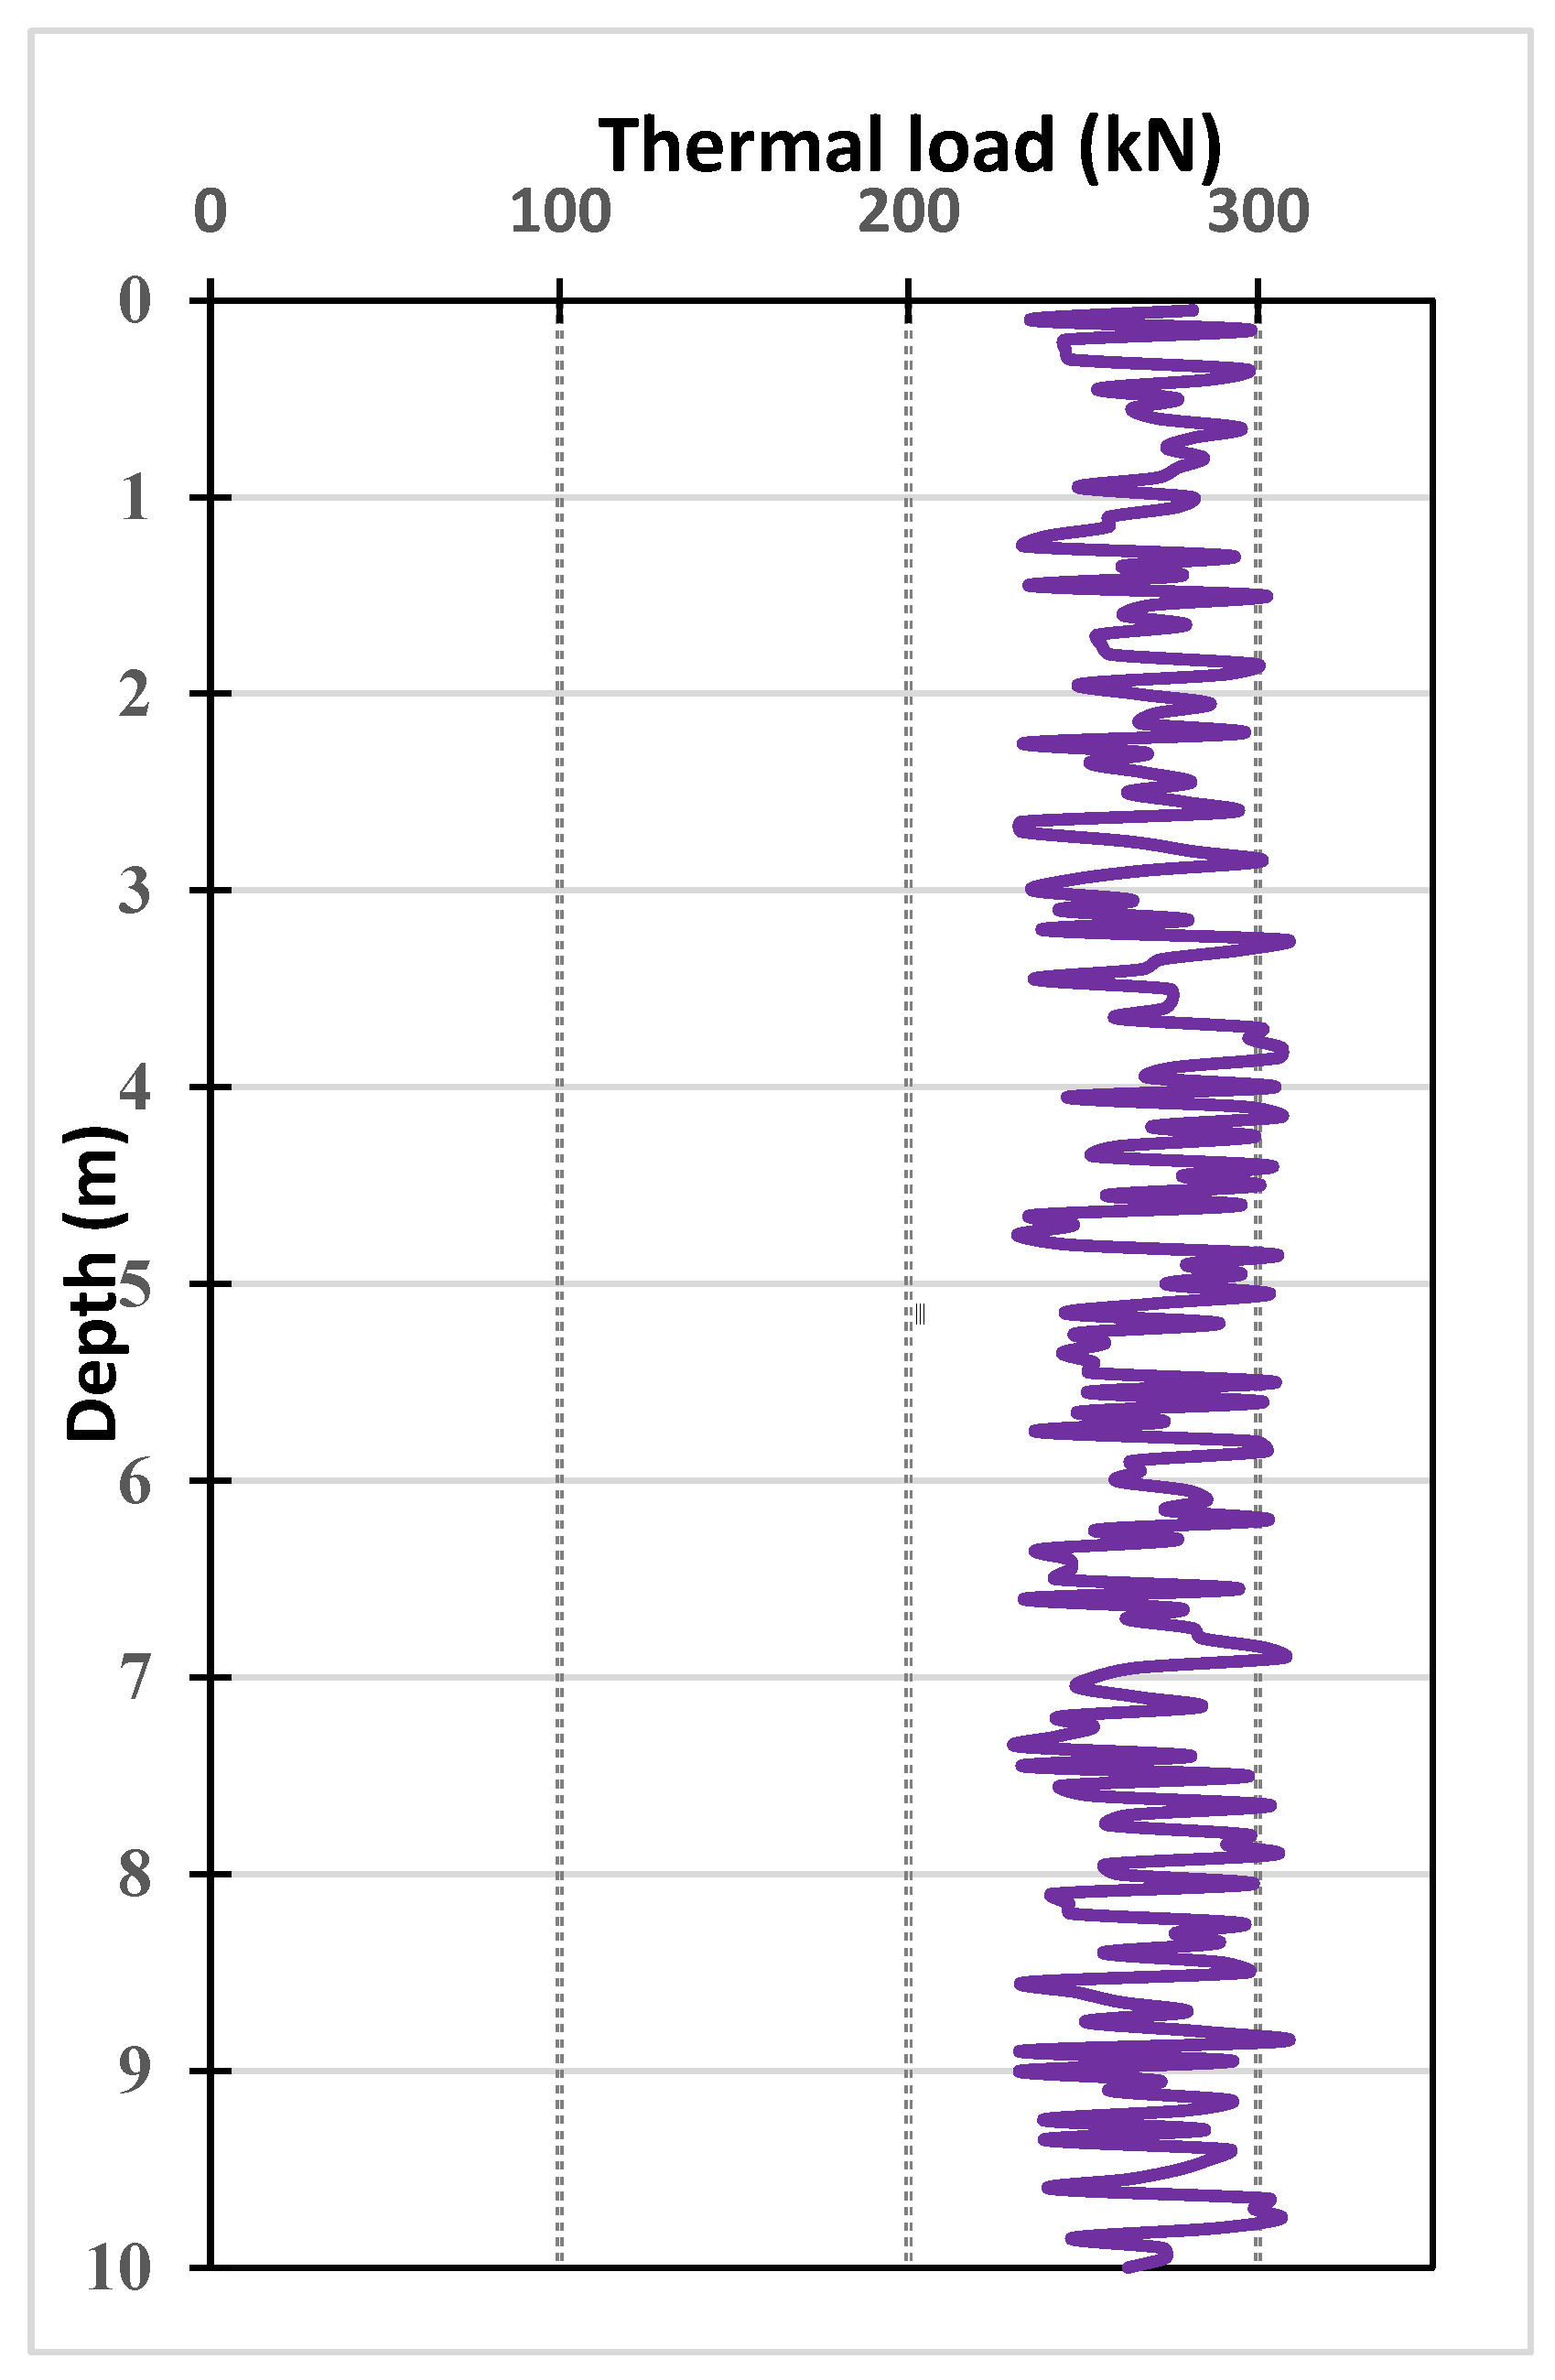
Figure 8.
Trend for actual capacity and predicted capacity for RF model: (a) training data; (b) testing data.
Figure 8.
Trend for actual capacity and predicted capacity for RF model: (a) training data; (b) testing data.
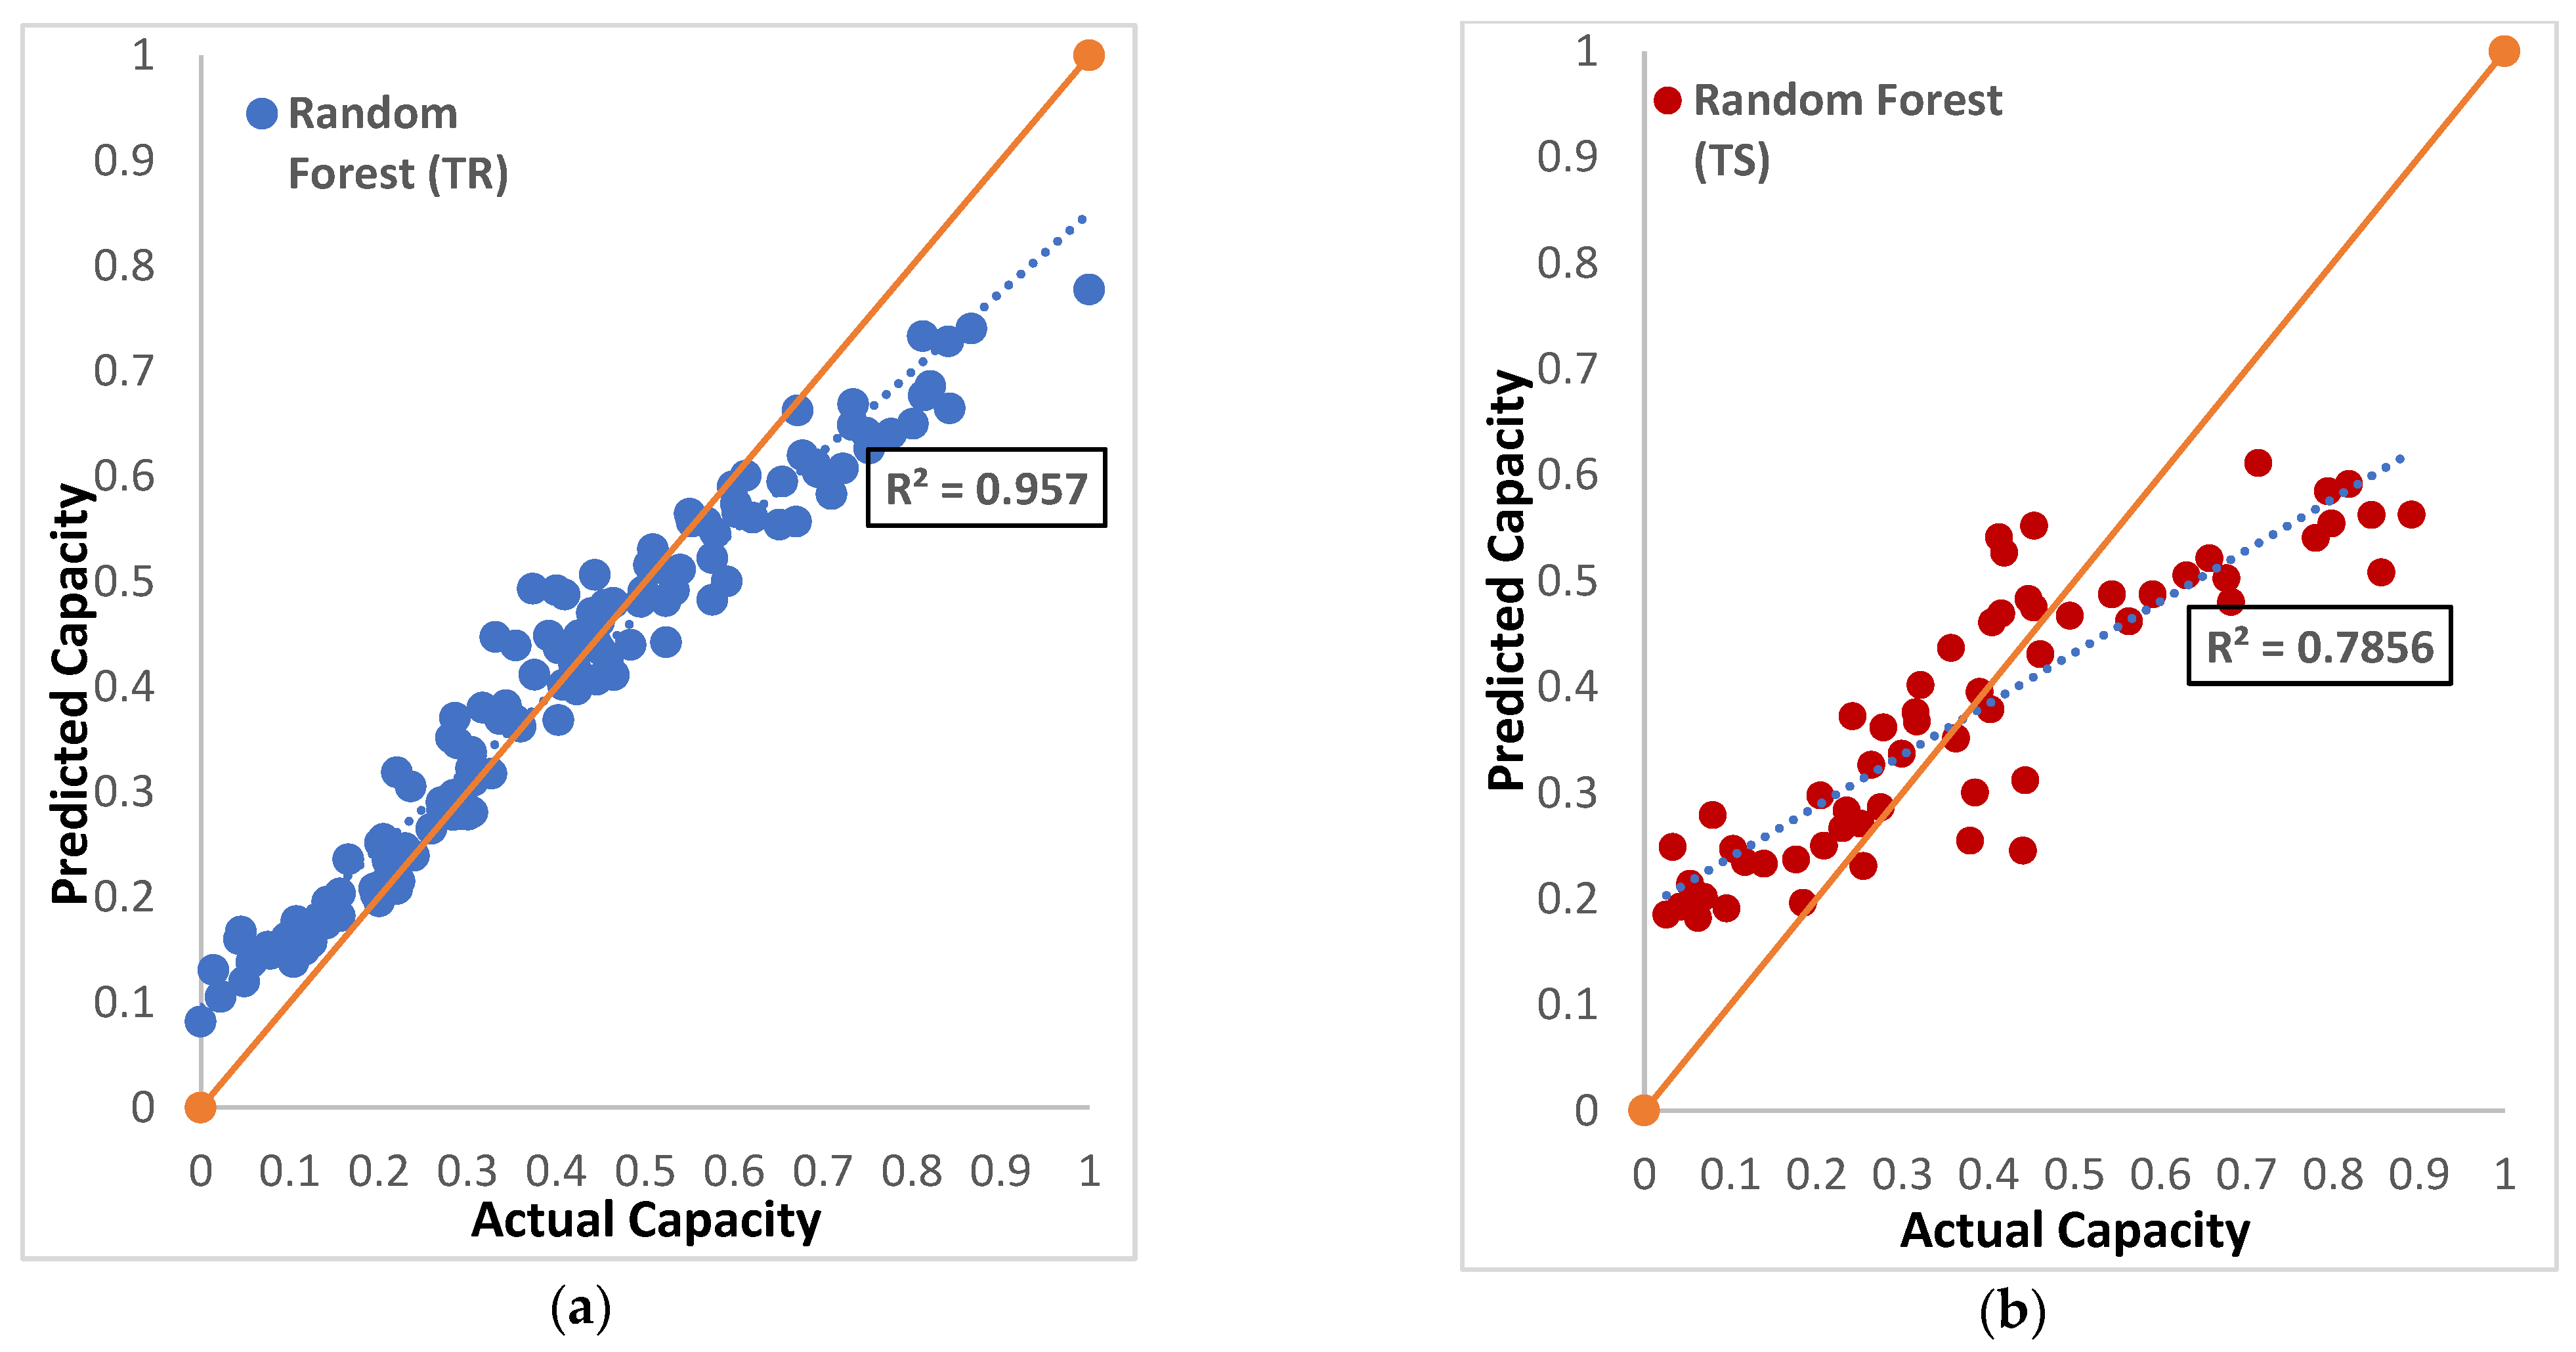
Figure 9.
Trend for actual capacity and predicted capacity for SVM model: (a) training data; (b) testing data.
Figure 9.
Trend for actual capacity and predicted capacity for SVM model: (a) training data; (b) testing data.
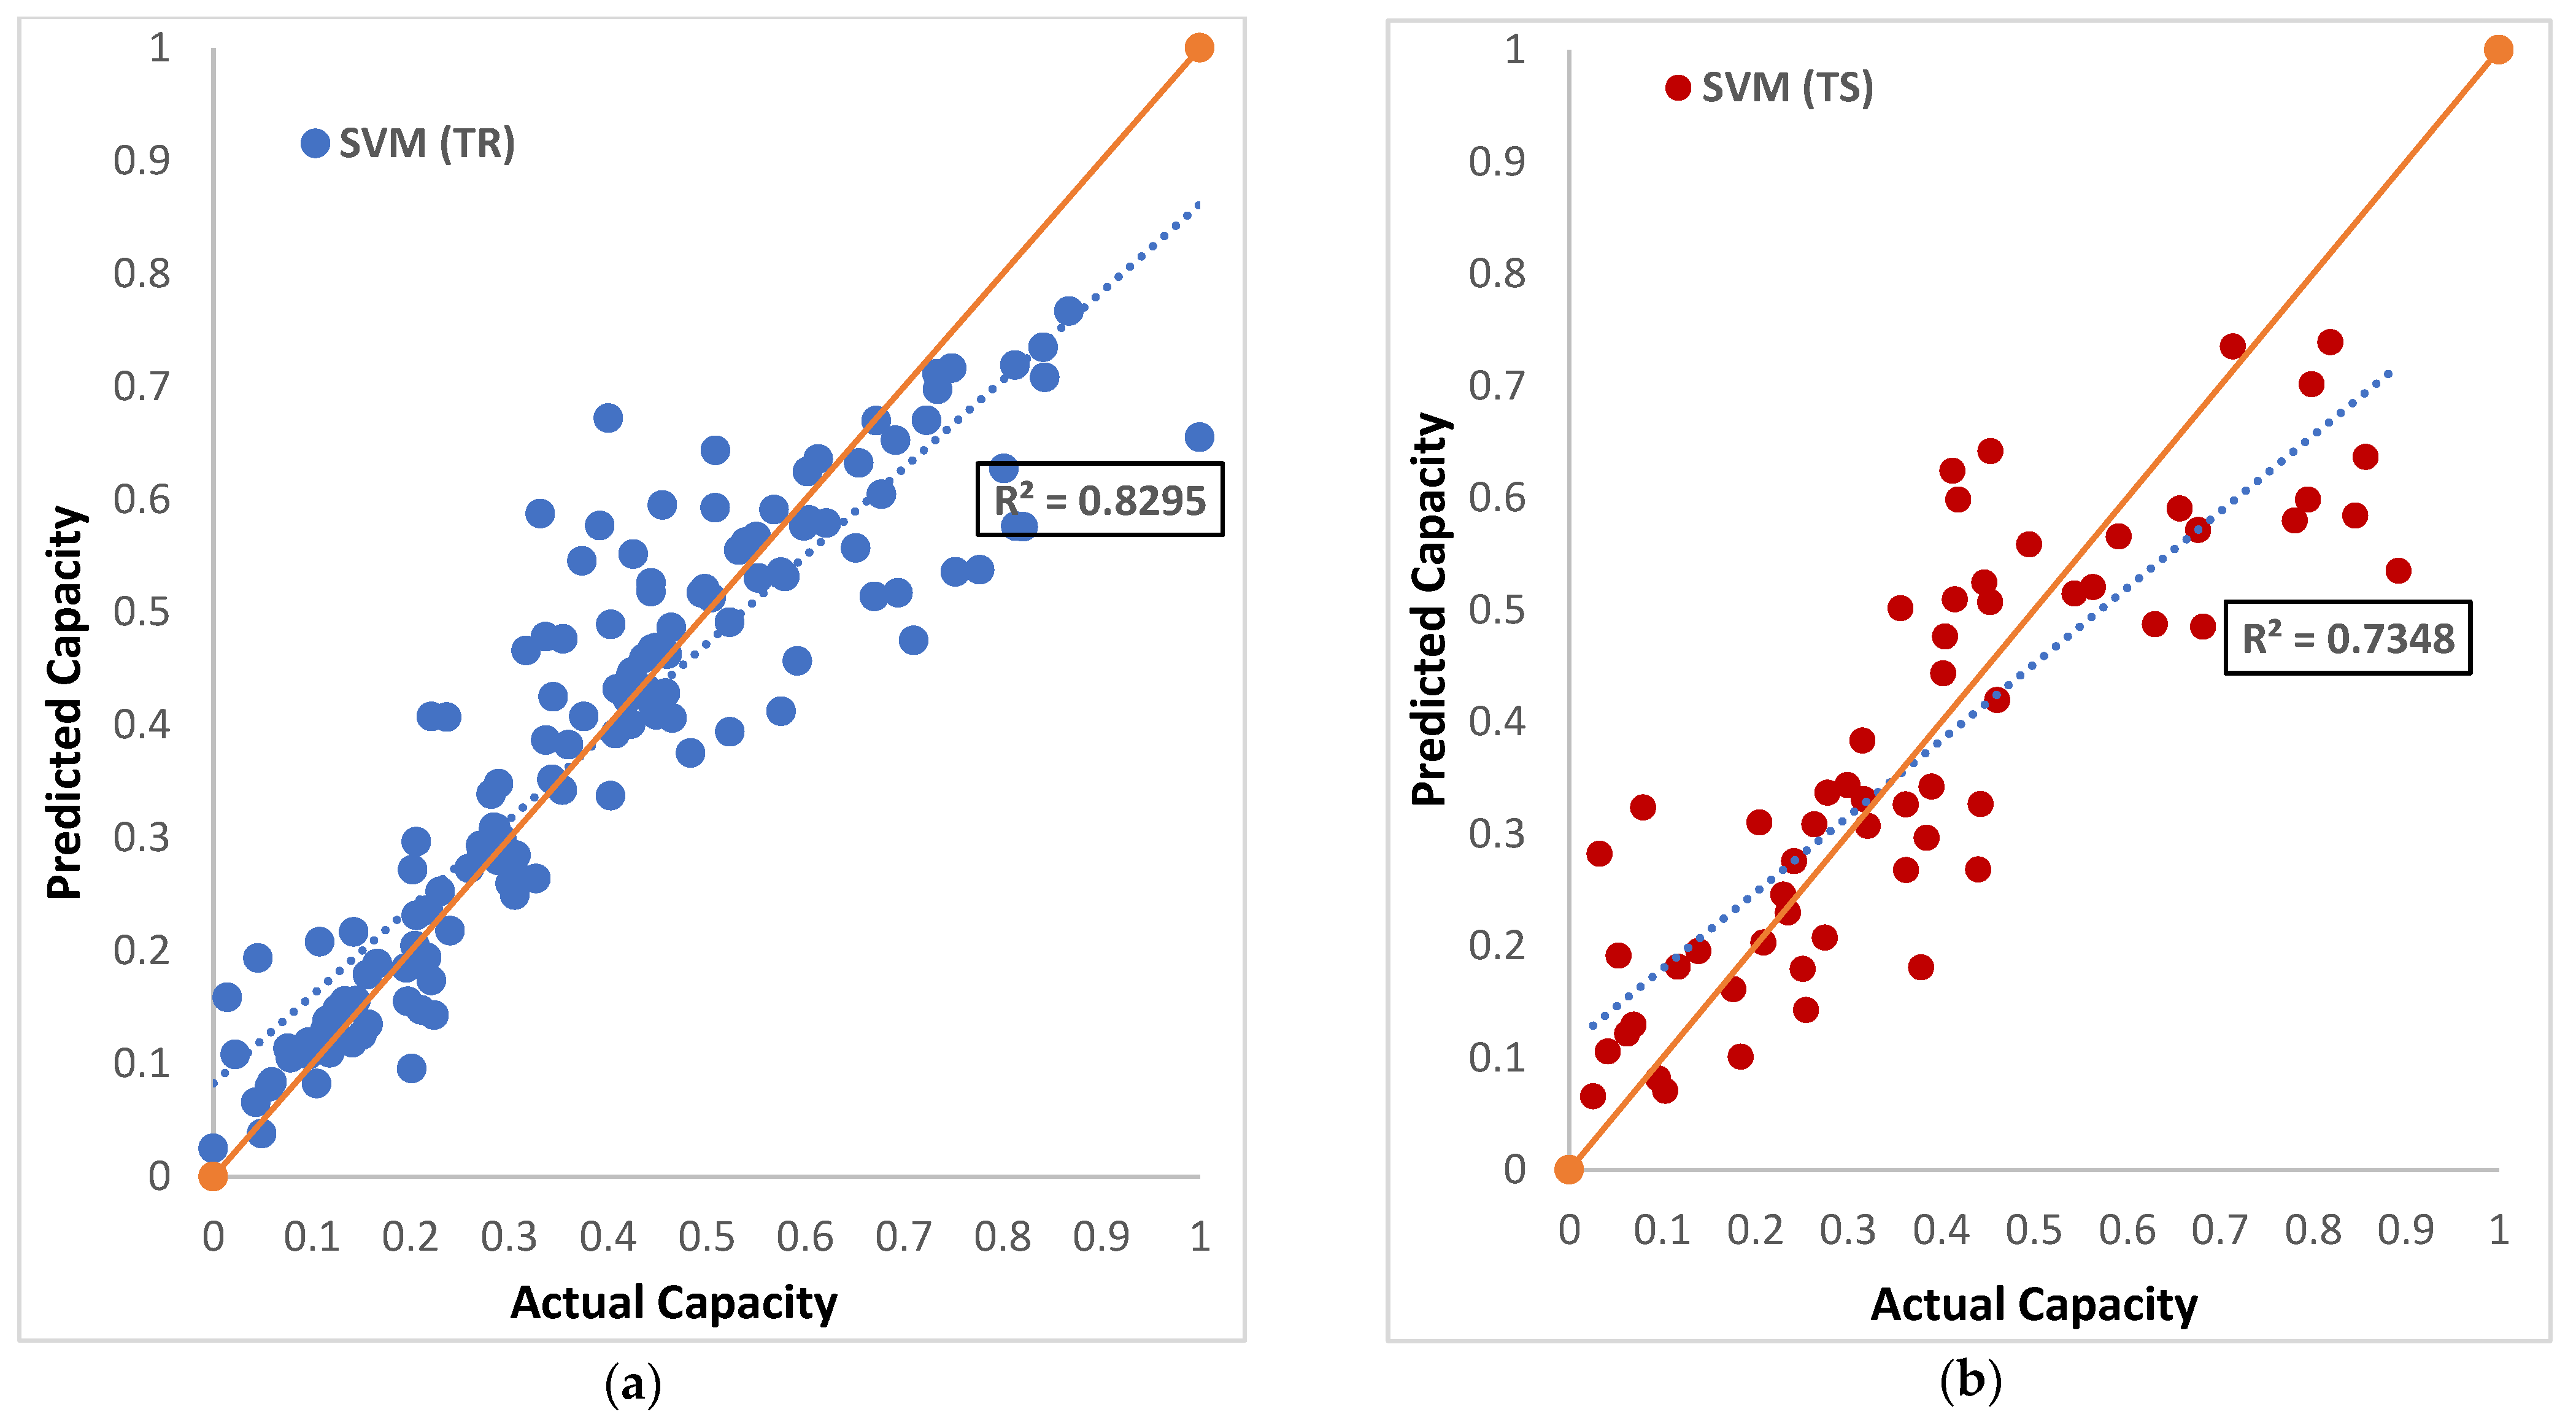
Figure 10.
Trend for actual capacity and predicted capacity for GBM model: (a) training data; (b) testing data.
Figure 10.
Trend for actual capacity and predicted capacity for GBM model: (a) training data; (b) testing data.
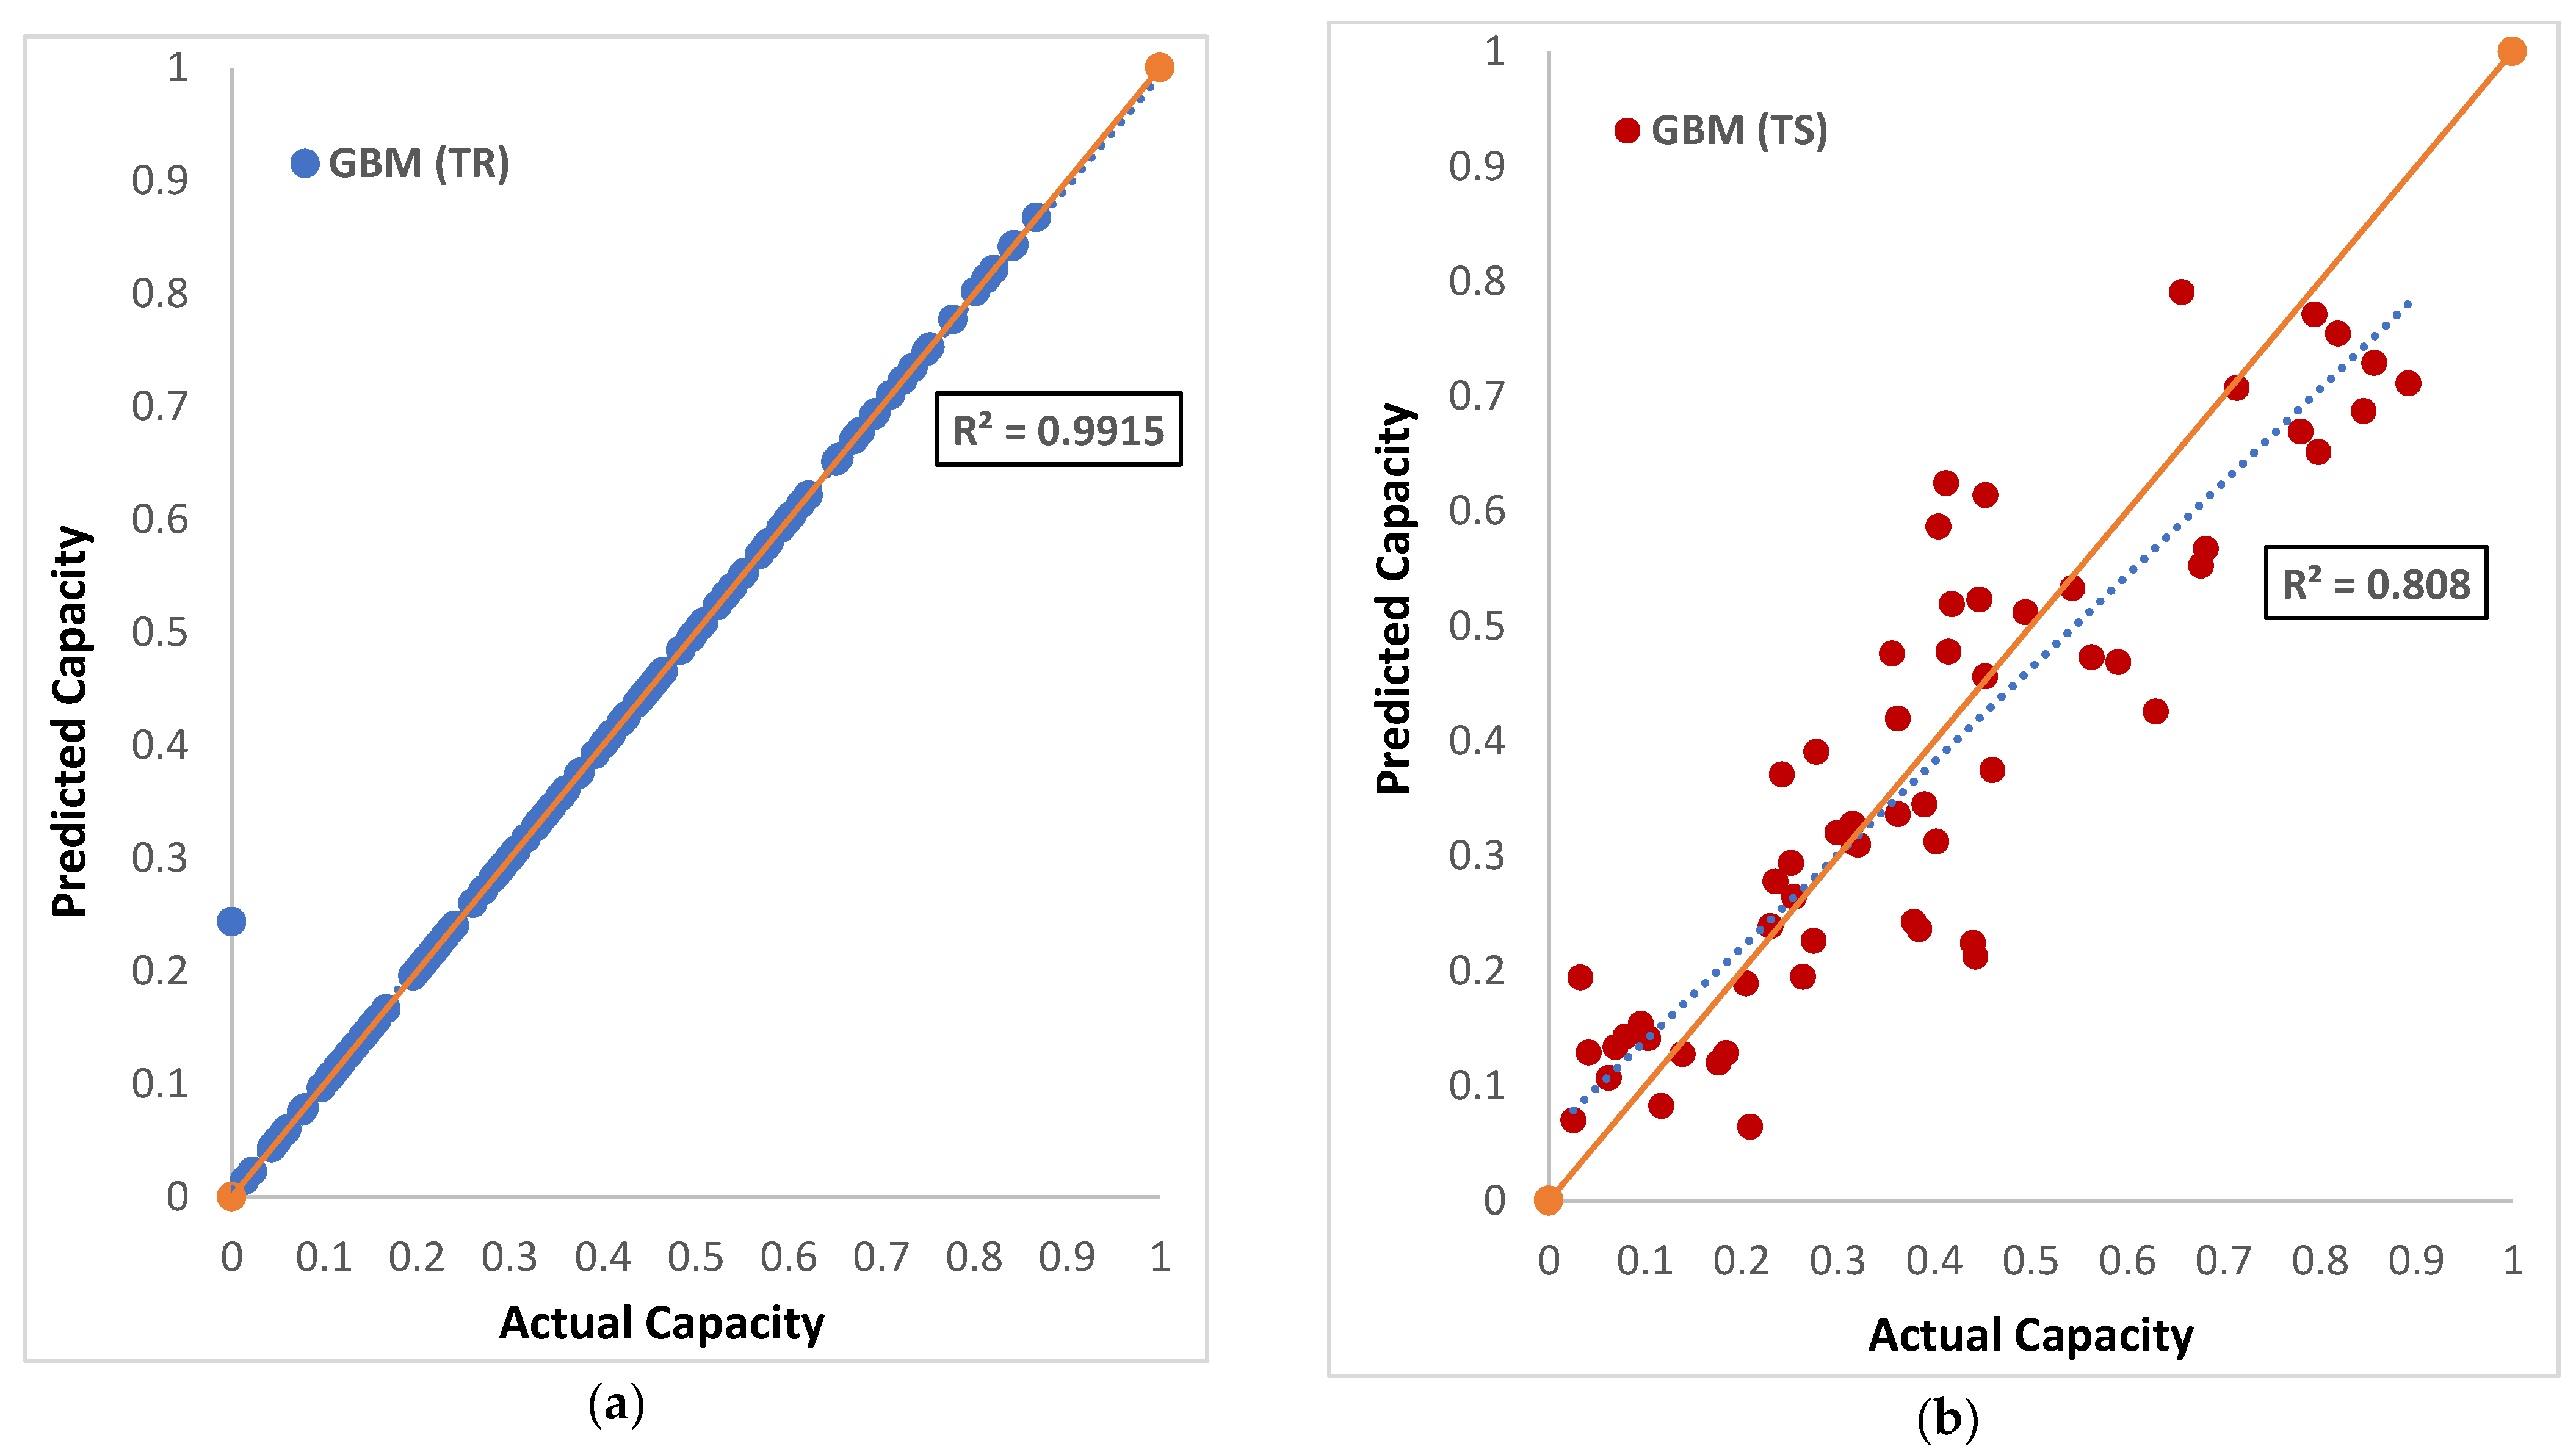
Figure 11.
Trend for actual capacity and predicted capacity for XGB model: (a) training data; (b) testing data.
Figure 11.
Trend for actual capacity and predicted capacity for XGB model: (a) training data; (b) testing data.
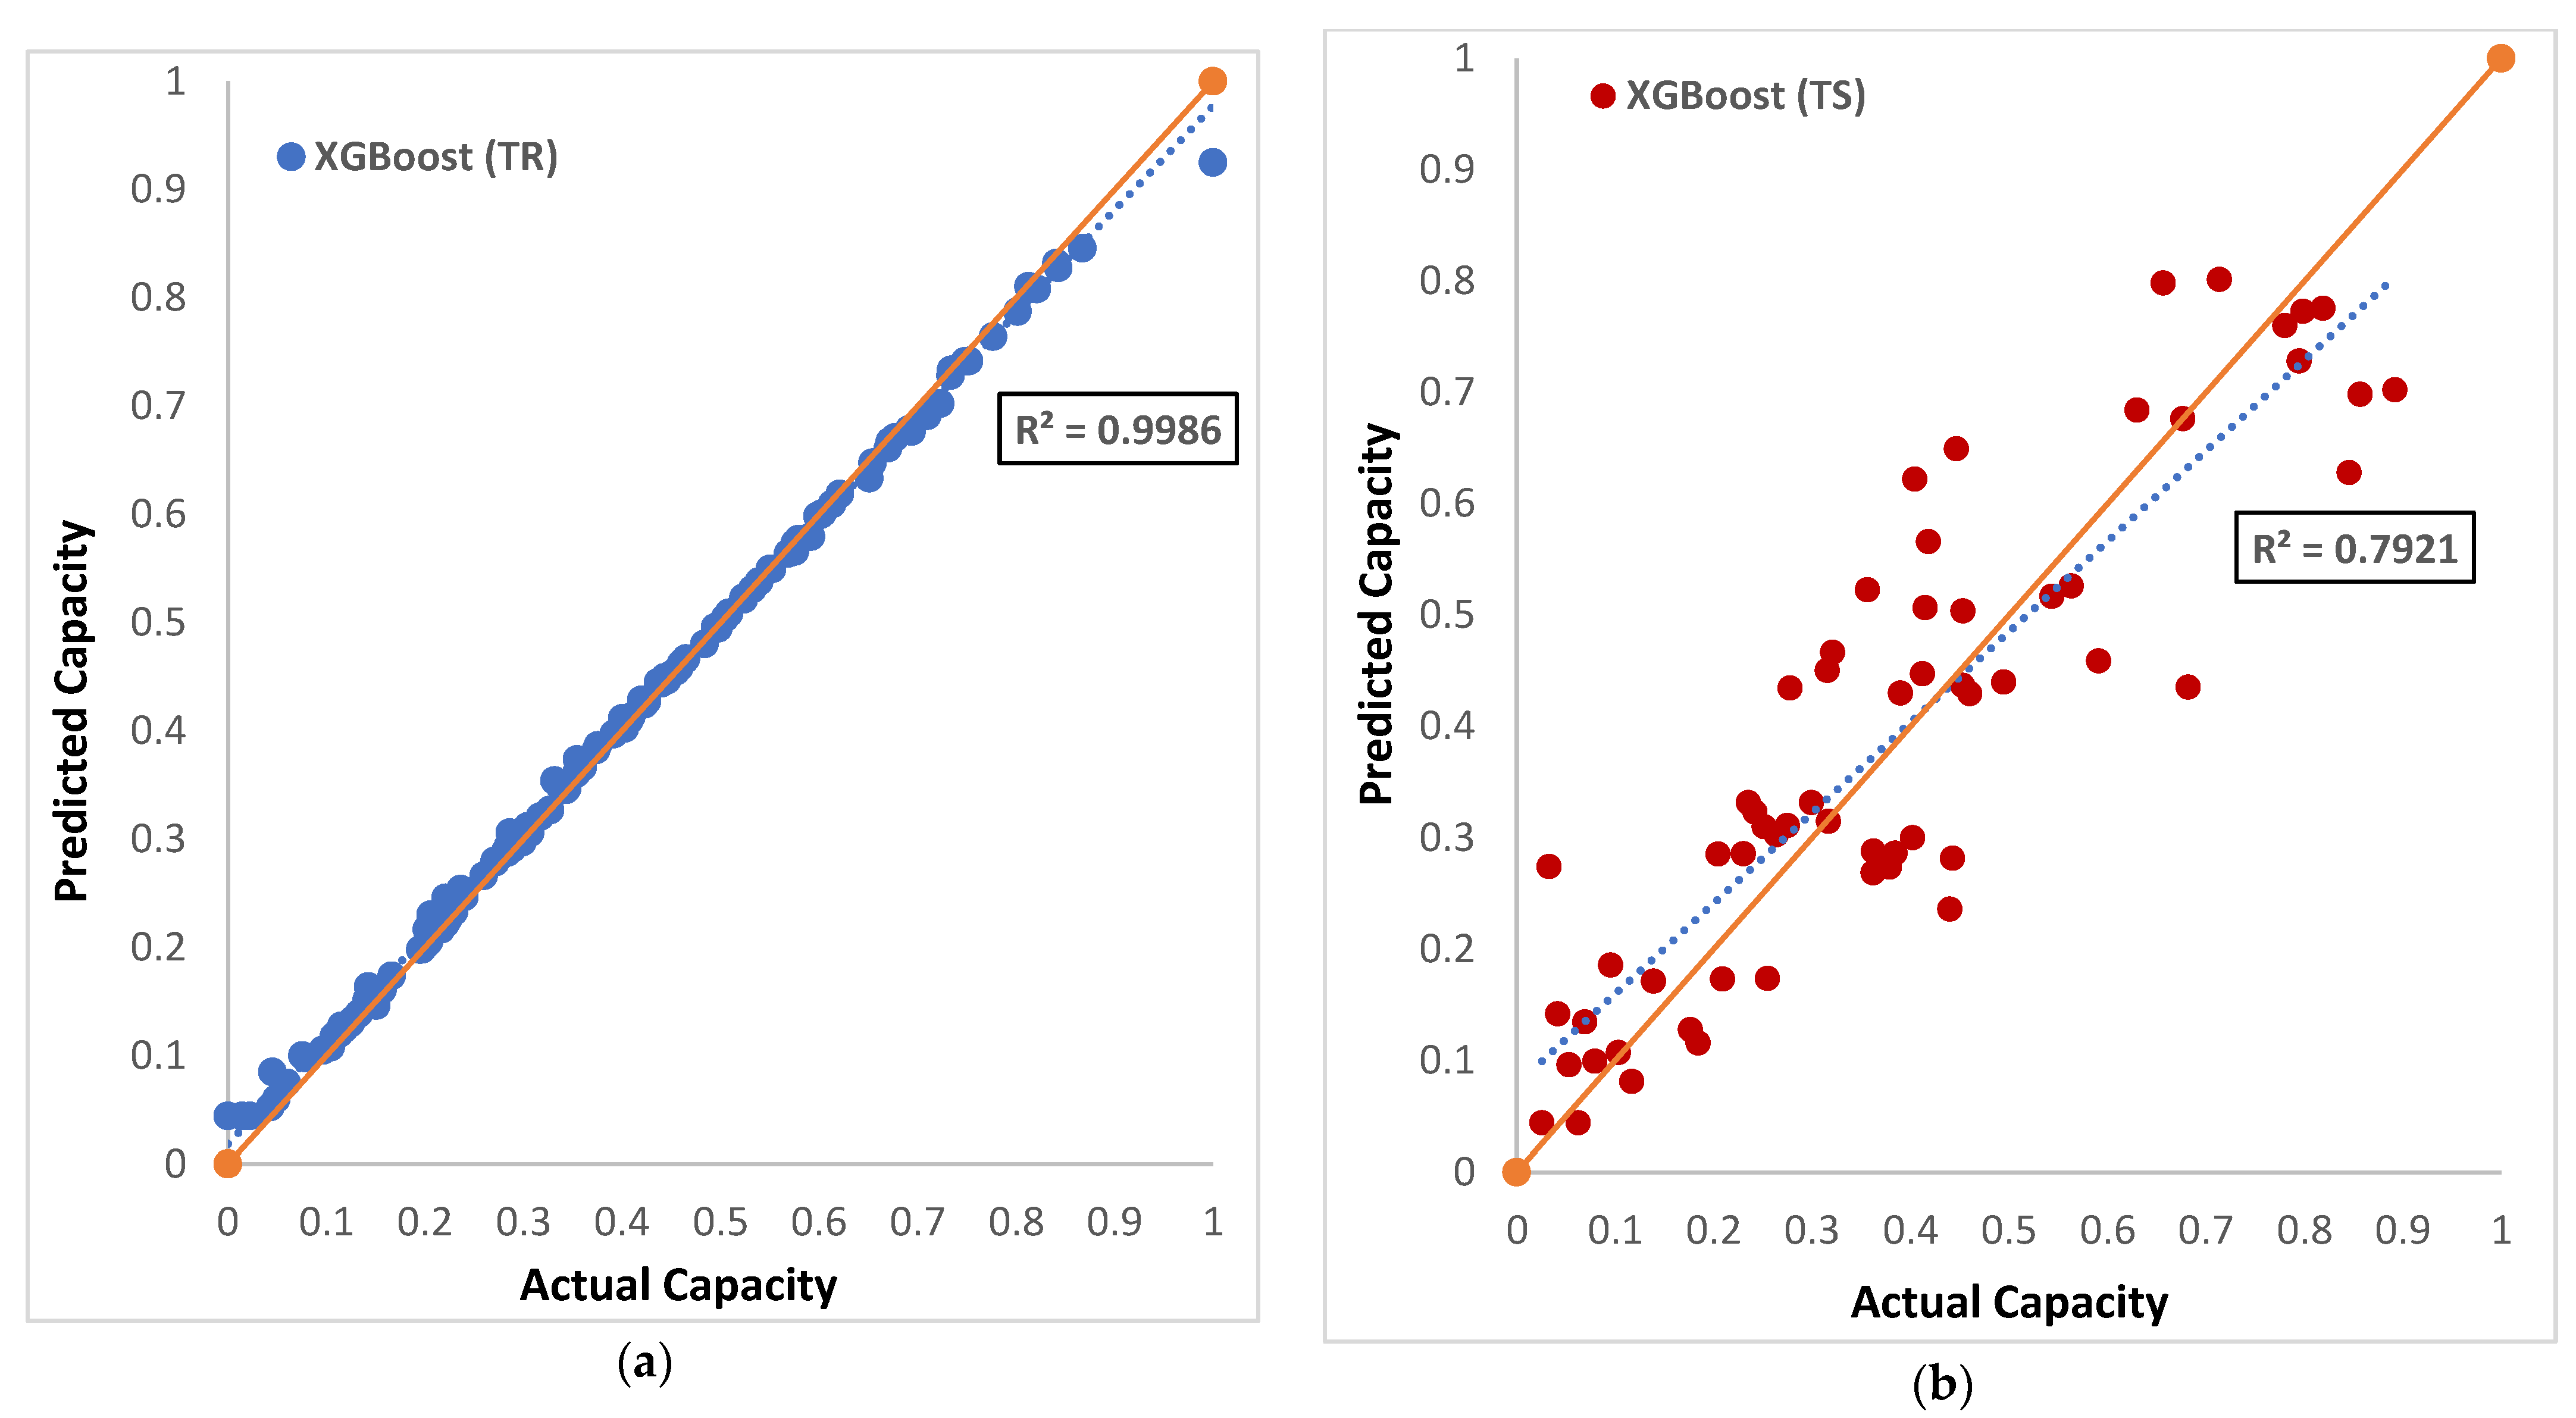
Figure 12.
Error matrix for training and testing dataset.

Figure 13.
Taylor’s plot for ML model training datasets.

Figure 14.
Taylor’s plot for ML model testing datasets.

Figure 15.
Reliability index value comparison of actual and predicted models for training datasets.

Table 1.
Physical properties and geometry of pile and GSHPs.
| L (m) | D (mm) | Flow Rate of Water (m3/h) | Heat Carrier Fluid Inlet Velocity (m/s) | Collector Type (mm) |
|---|---|---|---|---|
| 8 | 700 | 0.325 | 0.182 | U-tube 40 |
Table 2.
Thermal characteristics of isotropic materials (Obtained from Gashti et al. [51]).
Table 2.
Thermal characteristics of isotropic materials (Obtained from Gashti et al. [51]).
| Materials | Density (kg/m3) | Thermal Conductivity (W/m K) | Heat Capacity (J/kg K) |
|---|---|---|---|
| HDPE | 950 | 0.42 | 2250 |
| Clay | 1812 | 1.1 | 1845 |
| Steel | 7850 | 44.5 | 475 |
| Concrete | 2400 | 1.8 | 880 |
Table 3.
The mechanical and thermal characteristics of homogeneous isotropic materials (Obtained from Gashti et al. [51]).
Table 3.
The mechanical and thermal characteristics of homogeneous isotropic materials (Obtained from Gashti et al. [51]).
| Clay | Steel | Concrete | ||
|---|---|---|---|---|
| Young’s modulus (MPa) | E | 15 | 200 × 103 | 32 × 103 |
| Shear modulus (MPa) | G | 5.62 | 75 × 103 | 12 × 103 |
| Coefficient of thermal expansion (°C−1) | αc | 0.5 × 10⁻⁵ | 1.23 × 10⁻⁵ | 1 × 10⁻⁵ |
| Poisson ratio | ν | 0.33 | 0.33 | 0.33 |
Table 4.
Skin friction for various types of soil.
| Soil Type | (kPa) |
|---|---|
| Clays and peat | |
| Clays | |
| Silty clays and silty sands | |
| Sands | |
| Coarse sands and gravels |
Table 5.
Estimated pile group capacity (kN) for the entire length of the pile at the Perniö test site in Finland.
Table 5.
Estimated pile group capacity (kN) for the entire length of the pile at the Perniö test site in Finland.
| S.No | qc0 (kPa) | qc1 (kPa) | qc2 (kPa) | qc (kPa) | E (kPa) | Qug (kN) |
|---|---|---|---|---|---|---|
| 1 | 348 | 285 | 246 | 120 | 36,559,730 | 1589 |
| 2 | 487 | 421 | 138 | 454 | 30,512,281 | 5483 |
| 3 | 453 | 408 | 205 | 141 | 38,723,679 | 2416 |
| 4 | 400 | 273 | 237 | 476 | 31,791,913 | 6166 |
| 5 | 312 | 274 | 296 | 313 | 31,823,050 | 3198 |
| 6 | 480 | 350 | 151 | 170 | 31,997,539 | 2022 |
| 7 | 419 | 255 | 223 | 463 | 38,513,073 | 5718 |
| 8 | 391 | 283 | 293 | 118 | 37,369,266 | 1837 |
| 9 | 535 | 246 | 137 | 357 | 33,011,764 | 3815 |
| 10 | 463 | 436 | 189 | 452 | 35,985,785 | 4415 |
| 11 | 421 | 384 | 135 | 273 | 34,280,458 | 3260 |
| 12 | 265 | 263 | 284 | 523 | 35,216,679 | 6127 |
| 13 | 541 | 413 | 244 | 276 | 38,355,105 | 4116 |
| 14 | 519 | 497 | 162 | 134 | 36,511,371 | 2042 |
| 15 | 566 | 311 | 186 | 133 | 35,571,078 | 2256 |
| . | . | . | . | . | . | . |
| . | . | . | . | . | . | . |
| . | . | . | . | . | . | . |
| . | . | . | . | . | . | . |
| . | . | . | . | . | . | . |
| 189 | 291 | 261 | 239 | 364 | 37,193,735 | 2940 |
| 190 | 297 | 274 | 245 | 219 | 36,076,104 | 2394 |
| 191 | 472 | 247 | 124 | 542 | 34,210,352 | 5029 |
| 192 | 397 | 336 | 300 | 300 | 31,309,579 | 3889 |
| 193 | 432 | 364 | 240 | 415 | 39,380,051 | 3987 |
| 194 | 457 | 402 | 288 | 307 | 38,824,246 | 2971 |
| 195 | 344 | 283 | 124 | 319 | 39,835,672 | 3389 |
| 196 | 512 | 269 | 121 | 404 | 37,392,469 | 4217 |
| 197 | 510 | 339 | 254 | 481 | 32,045,184 | 6045 |
| 198 | 377 | 238 | 229 | 453 | 35,433,571 | 5539 |
| 199 | 302 | 263 | 207 | 226 | 35,553,756 | 3043 |
| 200 | 536 | 364 | 164 | 178 | 34,147,133 | 2382 |
Table 6.
The value of different performance parameters for different machine learning techniques in predicting the group capacity of a training dataset.
Table 6.
The value of different performance parameters for different machine learning techniques in predicting the group capacity of a training dataset.
| Proposed Models | R2 | RMSE | MAE | MBE | MAD | WMAPE | U95 | GPI | TIC | IA |
|---|---|---|---|---|---|---|---|---|---|---|
| RF | 0.957 | 0.065 | 0.049 | 0.000 | 0.038 | 0.127 | 0.180 | 3.09 × 10⁻⁸ | 0.074 | 0.973 |
| SVM | 0.829 | 0.092 | 0.064 | −0.003 | 0.029 | 0.164 | 0.257 | −4.0 × 10⁻⁶ | 0.106 | 0.948 |
| GBM | 0.991 | 0.020 | 0.001 | 0.001 | 0.000 | 0.000 | 0.057 | 1.72 × 10⁻⁸ | 0.014 | 1.000 |
| XGB | 0.998 | 0.124 | 0.008 | 0.002 | 0.005 | 0.020 | 0.034 | 3.85 × 10⁻⁹ | 0.023 | 0.998 |
Table 7.
The value of different performance parameters for different machine learning techniques in predicting the group capacity of a testing dataset.
Table 7.
The value of different performance parameters for different machine learning techniques in predicting the group capacity of a testing dataset.
| Proposed Models | R2 | RMSE | MAE | MBE | MAD | WMAPE | U95 | GPI | TIC | IA |
|---|---|---|---|---|---|---|---|---|---|---|
| RF | 0.785 | 0.135 | 0.109 | −0.008 | 0.097 | 0.279 | 0.376 | −4.9 × 10⁻⁸ | 0.159 | 0.855 |
| SVM | 0.734 | 0.122 | 0.018 | −0.012 | 0.067 | 0.247 | 0.340 | −1.0 × 10⁻⁴ | 0.140 | 0.910 |
| GBM | 0.808 | 0.104 | 0.084 | −0.015 | 0.066 | 0.217 | 0.288 | −1.0 × 10⁻⁴ | 0.119 | 0.941 |
| XGB | 0.792 | 0.107 | 0.086 | 0.006 | 0.067 | 0.216 | 0.298 | 1.88 × 10⁻⁵ | 0.118 | 0.944 |
Table 8.
Overall rank analysis of different performance parameters for different machine learning techniques.
Table 8.
Overall rank analysis of different performance parameters for different machine learning techniques.
| Performance Parameters | RF | SVM | GBM | XGB | ||||
|---|---|---|---|---|---|---|---|---|
| TR | TS | TR | TS | TR | TS | TR | TS | |
| R2 | 3 | 3 | 4 | 4 | 2 | 1 | 1 | 2 |
| RMSE | 2 | 4 | 3 | 3 | 1 | 1 | 4 | 2 |
| MAE | 3 | 4 | 4 | 1 | 1 | 2 | 2 | 3 |
| MBE | 1 | 2 | 4 | 3 | 2 | 4 | 3 | 1 |
| MAD | 4 | 3 | 3 | 2 | 1 | 1 | 2 | 2 |
| WMAPE | 3 | 4 | 4 | 3 | 1 | 1 | 2 | 2 |
| U95 | 3 | 4 | 4 | 3 | 2 | 1 | 1 | 2 |
| GPI | 1 | 4 | 4 | 2 | 2 | 2 | 3 | 1 |
| TIC | 3 | 4 | 4 | 3 | 1 | 2 | 2 | 1 |
| IA | 3 | 4 | 4 | 3 | 1 | 2 | 2 | 1 |
| Sub total | 26 | 36 | 38 | 27 | 14 | 17 | 22 | 17 |
| Total score | 62 | 65 | 31 | 39 | ||||
| Overall rank | 3 | 4 | 1 | 2 | ||||
Publisher’s Note: MDPI stays neutral with regard to jurisdictional claims in published maps and institutional affiliations. |
© 2022 by the authors. Licensee MDPI, Basel, Switzerland. This article is an open access article distributed under the terms and conditions of the Creative Commons Attribution (CC BY) license (https://creativecommons.org/licenses/by/4.0/).
Share and Cite
MDPI and ACS Style
Kumar, P.; Samui, P. Design of an Energy Pile Based on CPT Data Using Soft Computing Techniques. Infrastructures 2022, 7, 169. https://doi.org/10.3390/infrastructures7120169
AMA Style
Kumar P, Samui P. Design of an Energy Pile Based on CPT Data Using Soft Computing Techniques. Infrastructures. 2022; 7(12):169. https://doi.org/10.3390/infrastructures7120169
Chicago/Turabian StyleKumar, Pramod, and Pijush Samui. 2022. "Design of an Energy Pile Based on CPT Data Using Soft Computing Techniques" Infrastructures 7, no. 12: 169. https://doi.org/10.3390/infrastructures7120169