
Effects of Axial Relative Ground Movement on Small Diameter Polyethylene Piping in Loose Sand


Department of Civil Engineering, Faculty of Engineering and Applied Science, Memorial University of Newfoundland, St. John’s, NL A1C 5S7, Canada
*
Author to whom correspondence should be addressed.
Infrastructures 2021, 6(12), 168; https://doi.org/10.3390/infrastructures6120168
Submission received: 10 November 2021
/
Revised: 23 November 2021
/
Accepted: 29 November 2021
/
Published: 1 December 2021
Abstract
:Small diameter (42 mm) medium density polyethylene (MDPE) pipes are widely used in the gas distribution system in Canada and other countries. They are sometimes exposed to ground movements resulting from landslides or earthquakes. The current design guidelines for evaluating the pipes subjected to ground movement were developed for steel pipes of larger diameters and may not apply to flexible MDPE pipes. This paper evaluates 42 mm diameter MDPE pipes buried in loose sand under axial relative ground movement for developing a design method for the pipes. MDPE is a viscoelastic material; therefore, the behaviour of MDPE pipes exposed to landslides would depend on the rate of ground movements. In this research, full-scale laboratory tests were conducted to investigate the responses of buried pipes under various rates of relative axial displacement. Finite element modelling of the tests was used to interpret the observed behaviour using the continuum mechanics framework. The study revealed that the pulling force on the pipe depends on the rate of relative ground displacement (pulling rate). The nondimensional pulling force possessed a nonlinear relationship with the pulling rate. A rate-dependent interface friction angle could be used to calculate the maximum pulling forces using the conventional design guidelines for the pipes in loose sand. Based on the pulling force, the pipe wall strains can be estimated using the methods available for larger diameter pipes.
1. Introduction
Pipelines are a safe, reliable, and environmentally friendly way of transporting liquids and gas. However, ground movements resulting from various causes, including landslides, earthquakes, and ground subsidence, can pose severe threats to the performance and integrity of pipelines. The pipes may experience unacceptable levels of strain due to the loads from the moving ground [1]. When the direction of ground movement is parallel to the pipe axis (axial ground movement), the pipelines are subjected to longitudinal forces resulting from the friction between the pipe and the moving ground, causing axial strains in the pipe wall. The longitudinal force along the pipeline depends on the relative axial displacement between the soil and pipe, which is evaluated in the current design practices (i.e., [2,3,4]) based on an evaluation of the normal stresses acting on the pipe wall and the frictional characteristics of the soil–pipe interface. However, evaluating the normal stresses and the frictional characteristic is very complex, as these depend on the soil–pipe interaction. The mechanics of soil–pipe interaction depend extensively on pipe material and diameter, burial depth, ground conditions, and the ground movement rate.
Over the past few decades, many experimental and numerical studies were carried out to develop simplified design methods for assessing pipelines subjected to ground movements. Some of the studies focused on the axial pipeline–soil interaction of metal pipes in sand [5,6,7,8,9,10]. These studies identified the effects of interface soil dilation for pipes in dense sand that are not accounted for in the current design guidelines. Sheil et al. [11] measured initial normal stress at the pipe crown, where the stress was greater than the nominal overburden pressure. They postulated that the high normal stress is the result of the rigid inclusion of the steel pipe. This effect is also not considered in the current design guidelines. Marino and Osouli [12] employed pipe jacking tests to examine the interface friction coefficient for coal tar-coated steel pipes buried at various depths. The interface friction angles for clayey and sandy backfill materials were about 0.9 and 0.8 times that of the soil internal friction angles, respectively.
However, studies on the soil–pipe interaction for flexible pipes under axial ground movements are limited. Weerasekara and Wijewickreme [13] and Wijewickreme and Weerasekara [14] experimentally investigated the axial pullout behaviour of 60 and 114 mm diameter MDPE pipes. They reported that the interface frictional resistance for MDPE pipes is influenced by pipe elongation and diameter decrease during axial pullout. As a result, the length of shear strength mobilization along the pipe length is nonuniform and increases with the increase of relative ground movement. Meidani et al. [15] employed a finite-discrete element approach to examine the test results of a pipe reported in Weerasekara and Wijewickreme [13]. The pipe was modelled using finite elements, and the soil was modelled using discrete elements. The study confirmed that interface soil dilation contributes to the pullout resistance of a pipe buried in dense sand. The finite-discrete element approach was also found to successfully simulate the behaviour of MDPE pipe subjected to lateral movement induced by two symmetrically applied loads [16]. Bilgin and Stewart [17] investigated the effect of pipe diameter change due to temperature variations on the pullout resistance of buried high-density polyethylene (HDPE) pipes. The effect of pipe diameter changes was different for the pipes of different diameters investigated (i.e., 150 mm, 200 mm, and 250 mm). Alam and Allouche [18] performed full-scale axial pullout tests of PVC (polyvinylchloride) pipes, and recommended the pipe–soil friction coefficient for the pipes buried in different soil conditions. A similar study was conducted in Alam et al. [19], where the pipe–soil friction coefficients were evaluated for cement mortar, polyurethane, and prefabricated polyethylene tape coating systems on steel pipes. The effects of earth pressure, friction mobilization through the pipes, and pulling rate were not examined in those studies. For polyethylene-coated pipes, Scarpelli et al. [20] observed parallel scratches on the coating due to soil grain penetration that increased the friction coefficient. Reza and Dhar [21] examined 60 mm diameter MDPE pipes further, monitoring the length of shear strength mobilization during axial pullout and investigating the pulling rate effect on the pullout resistance. Finite element analysis was employed to capture the features that could not be measured during the tests, including the contributions of the soil, pipe, and interface parameters to the pipe behaviour. It revealed that the interface friction angle depends on the pulling rate due to the time-dependent property of the pipe material. Based on the study, a simplified method for calculating the mobilized frictional length and pipe wall strain was proposed for MDPE pipes in loose to medium dense sand. The applicability of the method for small diameter pipes (i.e., 42 mm diameter MDPE pipe) was not investigated.
The 42 mm diameter MDPE pipings are CSA B137.4 certified and widely used in the local gas distribution system in Canada. These pipes are highly susceptible to ground movement impacts due to their operations inside the local community. Therefore, the performance assessment of the pipes buried in areas prone to ground movement needs considerable attention. Pipelines are often installed with the backfill material purposely left loose to reduce the loads during relative ground movement. The Pipeline Research Council International (PRCI) [4] suggests burying pipelines in loose to moderately dense granular backfill as a practical method of reducing soil restraint. The current study focuses on the assessment of 42 mm diameter MDPE pipes in loose sand subjected to axial relative ground movement.
The objective of the current study is to develop a database and an improved understanding of the behaviour of small diameter MDPE pipelines subjected to axial ground movements. Full-scale axial pullout tests were conducted with 42 mm diameter MDPE pipes buried in loose sand. The pipes were pulled at three different rates to examine the effect of the pulling rate on the pipe behaviour. Force–displacement responses, pipe wall strains, and elongations were monitored during the tests. Three-dimensional (3D) finite-element (FE) analyses were used to investigate the loading rate-dependent interaction factor under various pulling rates. Finally, the applicability of the method proposed in Reza and Dhar [21] for the prediction of pipe responses was examined for the 42 mm diameter pipes.
2. Test Facility
A full-scale pipe testing facility developed at Memorial University of Newfoundland, St. John’s, NL, was used to investigate MDPE pipes subjected to axial ground movements. The details of the test cell, pulling mechanisms, and data acquisition system are described in Murugathasan et al. [6] and Reza and Dhar [21]. The facility idealizes the movement of a prismatic soil mass along failure planes parallel to the pipe axis [6]. However, a relative ground movement was applied by fixing the soil in a box and pulling a buried pipe through the soil. In a real field, the pipe is restrained in the stable ground, and the soil moves relative to the pipe. Similar test facilities were used by others for studying the axial ground movement effects on buried pipes [5,7,9,11].
The test cell was a steel box with inside dimensions of 4.0 m × 2.0 m × 1.5 m. Two circular openings on opposite walls in the box’s longer direction allowed the pipes to pass in and out of the box during axial pullout tests. For the axial pullout tests, the test pipe was passed through the openings extending beyond the boundaries of the test box at both ends when the portion of the pipe within the box was buried in the sand. Thus, the length of the pipe within the test box remained constant when the pipe was axially pulled. The buried pipe was pulled from one end (herein called the leading end) using a single-acting hydraulic actuator in a displacement-controlled manner, while the other end of the pipe was free to move. The axial pipe displacement at the other end of the pipe (referred to as the trailing end) was measured using a linear variable displacement transducer (LVDT). An overall arrangement of the test setup is shown in Figure 1.
Pipe Installation and Test Program
The test pipe was buried in loose well-graded sand in the test cell for the test. Index properties of the sand are shown in Table 1 (after Saha et al. [22]). As it was intended to have the sand in a loose condition around and above the pipe, the test cell was first backfilled up to a depth of five times the pipe diameter below the pipe centre (or the centre of the opening in the test cell) to represent native soil (Figure 2a). The sand was then poured into the box, dropping from a height of approximately 150 mm, using sandbags with the help of an overhead crane. The sand was spread uniformly using a wooden spreader carefully to maintain the loose condition. Once the pipe invert level was reached, the soil surface was uniformly levelled, and the pipe was placed straight, parallel to the longer direction of the test cell (Figure 2b). A 1000 mm long spirit level was used to ensure the pipe’s straightness. The soil backfilling was then continued until the desired burial depth for the pipe was reached (Figure 2c). In the present study, maintaining consistency in the soil condition (e.g., in situ density) of the test cell is an important consideration for the quality control of the constructions. In this regard, soil density was measured using in situ density pots at different locations inside the test box. The average value of soil unit weight ranged from 12 to 13 kN/m3. Thus, the average relative compaction of the backfill material was around 65% 3% of the standard Proctor maximum dry density. The backfill material used in each test was in air-dry condition (moisture content less than 1.5%).
The test pipe and sand were removed from the tank after each test, and the pipe installation procedure was repeated for the subsequent tests. Once used in the test, the pipe was not reused in the next tests to avoid the effect of residual stresses, if any. Although the pipelines under operation may experience residual stresses, the influence of residual stress on the test results was avoided for ease of interpretation without estimation of the contribution of the residual stress on the observed behaviour.
The test program was designed to monitor shear strength mobilization along the pipe length for 42 mm diameter piping subjected to axial pullout at various rates. Five tests (Test T1 to T5) were conducted by pulling the pipes at three different pulling rates. Pipe segments of 4.6 m in length were installed in the test box as discussed above; 4.0 m was inside the box, and 300 mm extended beyond the box on each side. The pipe had a standard dimension ratio (SDR) of 10.
The pipes were generally buried at a depth of 340 mm, resulting in the ratio of soil cover (measured from springline) to pipe diameter (H/D) of 8. A test with a higher burial depth (test T5) and a soil cover depth of 560 mm (H/D = 13.2) was also conducted to examine the effect. These burial depths fall within the range of standard practice for installation of gas distribution pipes at shallow depth from 0.3 m to 1.5 m [23]. The soil width on each side of the pipes was 1.0 m, about 24 times the pipe diameter, which is sufficiently far to minimize the boundary effects during the axial pullout tests. During the tests, the pipes were axially pulled to a displacement of 120 mm. The pulling rates were 0.5 mm/min, 1 mm/min, and 2 mm/min at the leading end in tests T1 and T5, T2 and T4, and T3, respectively. Test T4 was a repetition of test T2, as the result from test T2 appeared as an outlier (discussed later in the paper). The pulling rates were selected based on feasibility under the laboratory conditions. Note that the pulling rates fall in the velocity Class 5 (>0.3 mm/min and <30 mm/min), corresponding to moderate landslide velocity, according to Cruden and Varnes [24].
An array of electrical resistivity strain gauges were placed at selected locations on the pipe’s outer surface. Three uniaxial strain gauges (gauge length 5 mm, strain range ±15%, gauge resistance 119.8 ± 0.2 ohms) were installed at the distances of one-fourth, half, and three-fourths of the pipe length within the box from the leading end. These gauges, mounted at the pipe crown, provided an opportunity to capture the mobilization of axial force along the pipe’s length and served as a useful check on the strain rate variations throughout the pullout tests. The analog data from all instruments (such as the load cell, LVDT, and strain gauges) were translated into a digital signal by a data acquisition system (DAQS) and recorded on a personal computer at a rate of 2 Hz.
3. Experimental Force–Displacement Responses
Figure 3 presents the force–displacement responses observed during axial pullout of the pipes in tests T1–T5. The pulling force is shown as the pullout resistance in the figure, as the pulling force is essentially equal to the resistance offered by the surrounding soil. As seen in Figure 3, the pullout resistance increases nonlinearly with the pulling displacements at the leading end of the pipe. The increase of pullout resistance is continued until the soil’s shear strength at the pipe–soil interface is fully mobilized over the entire pipe length inside the soil box (i.e., 4.0 m). After full mobilization, the pullout forces are stabilized or slightly reduced upon further axial displacement of the pipe. Similar responses were measured for 60 mm diameter pipes presented in Reza and Dhar [21]. Then, nonlinear force–displacement responses are due to progressive mobilization of interface shearing resistance, starting from the leading end towards the trailing end. The pullout forces are maximal when the trailing end of the pipe starts to move. Thus, the leading end displacement up to the maximum pullout force is due to the elongation of the pipe. This elongation of the flexible pipe during axial pulling causes a reduction in the cross-sectional area [15,21]. As a result, the frictional resistance (i.e., soil resistance) along the pipe’s length is nonuniform.
Figure 3 also illustrates the effect of the loading rate on the pipe–soil interaction force for 42 mm diameter pipes buried in sand. Reza and Dhar [21] earlier investigated the pulling rate effect on the axial soil resistance of 60 mm diameter pipes, and revealed that the pullout resistance is higher for a higher rate of pulling. Similar responses are observed in Figure 3, except that the maximum pullout force is less in test T2 than in test T1 (conducted at a slower pulling rate). Therefore, an additional test with a pulling rate of 1 mm/min (test T4) was conducted that showed a higher maximum pullout force than in test T2.
Thus, the maximum pullout force in test T2 is considered an outlier, which can result from local voids around the pipe in the soil placed without compaction. The results from tests T1, T3, and T4 reveal that the peak pullout resistances can be 14% and 60% higher for the pulling rates of 1 mm/min and 2 mm/min, respectively, than for the pulling rate of 0.5 mm/min. Figure 3 also shows the effect of H/D on pullout resistance obtained by increasing the burial depth (H) in test T5. The peak pullout resistance increased by approximately 49% for changing H/D from 8 to 13.2.
The peak pulling forces, normalized for soil density, burial depth, pipe diameter, and test pipe length (i.e., /πDLγH), are compared in Figure 4 for various pulling rates. The normalized peak pullout resistances from test results presented in Anderson [25] and Reza and Dhar [21] are also included in Figure 4 for comparison. The figure shows that the nondimensional maximum pullout forces follow a general trend of increasing nonlinearly with the increase of pulling rate. The nondimensional forces obtained from the current study for 42 mm diameter pipes match well with the trend of results from previous studies with 60 mm diameter pipes [21,25] and 115 mm diameter pipes [25]. Thus, for pipes buried in loose and medium dense sands, a common relationship between the pulling force (nondimensional) and the pulling rate can be used, regardless of pipe diameters. Through curve fitting with the data, the following regression equation for the maximum pulling force is developed for MDPE pipelines buried in loose/medium sand.
4. Finite Element Analysis
Finite element (FE) analysis was performed to investigate the interface shearing behaviour that could not be measured during the experiment. Conventionally, the interface friction factor is expressed using a friction angle, δ, which is the internal friction angle of soil times a friction reduction factor, f (i.e., δ = fϕ). The American Lifelines Alliance (ALA) [3] recommends the friction reduction factor of f = 0.6 for polyethylene-coated steel pipe. Reza and Dhar [21] employed FE analyses to evaluate the interface friction factors for 60 mm diameter pipes subjected to different rates of axial pulling. They reported that interface friction angles for MDPE pipes could vary from 75% to 90% of the peak friction angle of the surrounding soil, depending on the rate of pulling. A similar study was conducted in the current research to evaluate the friction reduction factor for 42 mm diameter pipes. Three-dimensional (3D) FE analysis was performed using the Abaqus/Standard (version 2019) software package. The model dimensions were the same as those in the physical model (i.e., 4.0 m in length, 2.0 m in width, and 0.94 m in height, where the pipe was buried at a depth of 0.34 m). The soil and pipe were represented by reduced integration eight-noded linear (lower order) hexahedral elements (C3D8R). Since the ‘lower order’ elements might have been overly stiff, very fine meshes were used for a mesh sensitivity study. Finer mesh with a minimum element size of 3.0 mm was used in the close vicinity of the pipe over a radial distance of 2.5 times the pipe diameter (2.5 D), and coarser mesh was used beyond 2.5 D to reduce the computational time. The sides of the soil block were constrained in the horizontal direction. The bottom was constrained in all translational directions. Figure 5 shows the FE model used in the analysis.
For MDPE pipe material, the isotropic elastic-plastic model was implemented in the FE analysis. The stress–strain responses of MDPE pipe material are highly nonlinear and strain rate-dependent. The strain rate-dependent stress–strain relationship for the MDPE pipe material was represented using the hyperbolic model of Suleiman and Coree [26], as shown in Equation (2).
where Eini is the initial Young’s modulus, and η is a hyperbolic constant. These strain rate-dependent parameters can be obtained using the following equations [26]:
where is the strain rate, and a, b, c, and d are model parameters. The model parameters were adopted from Wijewickreme and Weerasekara [14]. The average strain rates measured during the tests were used to obtain the stress–strain relations. The true nonlinear stress–strain responses corresponding to the strain rates were then used as the input for the FE analysis. The average strain rate during the tests ranged from 2.48 × 10⁻⁶ s−1 to 1.0 × 10⁻⁵ s−1. The Poisson’s ratio and density of MDPE were assumed as 0.46 and 940 kg/m3, respectively, at the laboratory temperature (23 °C), after Bilgin et al. [27].
Young’s modulus () of soil was estimated based on the nonlinear model of Janbu [28] for a stress-dependent modulus of elasticity. Janbu [28] showed that the initial tangent modulus of elasticity, , varies as a power function of the confining pressure, p′, as shown in Equation (5).
where K is the material constant; pa is the atmospheric pressure (i.e., 101.3 kPa); p′ is the mean effective confining pressure; and η is a power exponent determining the rate of variation of with p′. For the sand used in the experiments, = 2 MPa is estimated based on p′ at the springline level of the pipe with K = 100 and η = 0.5 [29]. A Poisson’s ratio of 0.25 was considered, which is within the typical values for loose sand [30]. Soil plasticity was modelled using the conventional Mohr–Coulomb (MC) criteria. The conventional MC model was found to successfully simulate the ultimate soil resistance during the axial pullout [31]. For the loose condition of the sand, the typical peak friction angle for the soil is 34.5° at the high stress levels [22]. However, at the low stress levels, the peak friction angle can be much higher than the typical value. Saha et al. [22] found a ratio of the peak shear stress to the normal stress of around 0.8, corresponding to a friction angle of 39°, from direct shear tests at the normal stress of 12.5 kPa. Similar results were reported in Ansari et al. [32]. Based on this information, the friction angle ϕ of 38° was selected for the FE analysis of the stress levels expected in the soil around the pipes. Minimum value cohesion, c = 0.1 kPa, and the dilation angle, ψ = 0.1°, were chosen for numerical stability.
The interaction between the pipeline and the surrounding soil was modelled using the contact surface approach available in Abaqus/Standard that allows sliding and separation at the interface between the pipe and soil. Tangential and normal behaviour were defined between the contact surfaces. For the tangential contact behaviour, the friction coefficient, μ, between the soil and the pipe was introduced using a penalty friction formulation, while for the normal interaction behaviour, a non-penetrating condition was defined (referred to as ‘hard’ contact in Abaqus). The Coulomb friction model was used for the frictional interaction between the pipe and soil. In this method, the maximum allowable frictional shear stress () across the interface is related to the contact pressure () between the pipe and the soil. The allowable frictional shear stress, , is a fraction of the contact pressure, , between the contacting surfaces ( = μ). The fraction, μ (=tanδ), is known as the coefficient of friction, and δ is the interface friction angle (as mentioned previously). The contacting surfaces stick together and behave elastically when the shear stress, , at the contact interface, is less than . The sliding along the interface between the buried pipe and surrounding soil takes place when = (i.e., interface shear strength), and the separation between the soil and pipe occurs when < 0.
As the magnitude of the interface friction angle is unknown, analyses with various interface friction angles were performed to simulate the measured load-displacement responses. The FE analyses with an interface friction angle of 77%, 88%, and 95% of the peak friction angle of the soil were found to match the maximum pulling force reasonably for test T1 (pulling rate: 0.5 mm/min), test T4 (pulling rate: 1 mm/min), and test T3 (pulling rate: 2 mm/min), respectively. As mentioned earlier, the maximum pulling force in test T2 was considered an outlier and, therefore, was not simulated using the FE method.
5. Comparison of Results
Figure 6 compares the load-displacement responses from the FE analysis and the experiments. The FE method reasonably simulated the load-displacement responses with the interface friction reduction factors (f) of 0.77, 0.88, and 0.95, corresponding to the loading rates of 0.5, 1, and 2 mm/min, respectively. Similar comparisons were reported in Reza and Dhar [21] for 60 mm diameter MDPE pipes. The FE analysis slightly underestimates the peak pullout force for test T3, which might be due to uncertainty in the soil condition around the pipe. Although the backfill soil was carefully placed, it was difficult to maintain uniformity during backfilling with the loose condition of the sand. Note that the maximum pullout force for test T5 (with a deeper burial depth, H = 0.56 m) was also successfully simulated using the friction reduction factor (i.e., f = 0.77) used for test T1 conducted at the same pulling rate (0.5 mm/min). Thus, the factor f can be considered independent of the burial depth. The friction reduction factors for the 42 mm diameter pipes from the current study are compared with those from Reza and Dhar [21] in Figure 7. They show that the pulling rate-dependent friction reduction factors for 42 mm diameter pipes match those for 60 mm diameter pipes. Thus, the same friction reduction factors can be used for calculating the pulling forces for 42 mm and 60 mm diameter pipes.
The FE analysis results were also compared with the measured pipe wall strains (Figure 8). In Figure 8, the calculated longitudinal strains at the pipe crown at distances of one-fourth (L/4), half (L/2), and three-fourths (3L/4) from the leading end are plotted with the measured strains in test T1. The results from the FE analysis match reasonably well with the test results in Figure 8, implying that the developed FE modelling approach can reasonably simulate the test conditions.
6. Strain Calculations
During axial pullout of flexible MDPE pipes, the axial force and the interface shearing resistance are gradually mobilized from the leading end toward the trailing end. The friction mobilization length, l (called herein the ‘mobilized frictional length’), depends on the leading end displacement (or the relative ground movement in the field). The mobilized frictional length is required for estimating the pipe wall strains under axial ground movement. Reza and Dhar [21] proposed a simplified equation for predicting the mobilized frictional length, assuming a linear distribution of axial strains over the mobilized frictional length observed during the tests for 60 mm diameter pipe. The simplified equation for estimating the mobilized frictional length, l, as a function of known relative ground movement (u) is as follows:
where ζ is the normal stress adjustment factor, associated with reducing normal stress on the pipe wall (due to the pipe’s diametric reduction); A is the cross-sectional area of the pipe; and E is the elastic modulus of the pipe material. The factor ζ was calculated from the test results using the framework of the existing design equation [3] for calculating the maximum pullout force as follows in Equation (7).
In Equation (7), tanδ is the coefficient of friction that can be calculated using the friction reduction factor, f, discussed earlier. The coefficient of lateral earth pressure was calculated using = ν/1 ν. Using this method, the normal stress adjustment factors (ζ) were calculated as 0.95, 0.92, and 1.10 for tests T1, T4, and T3, respectively, which are close to 1. Thus, the reduction in normal stress due to the elongation of the pipe would be insignificant for 42 mm diameter pipes in loose sand.
Note that Equation (6) was developed based on a linear distribution of the axial strain over the mobilized frictional length of the pipe. Linear distributions of the axial strains were also observed for the 42 mm diameter pipes presented in this study, as shown in Figure 9. Figure 9 plots the distribution of axial strains along the pipe length at the leading end displacements, corresponding to the mobilization of frictional resistance to the distances from the leading end of 1 m, 2 m, 3 m, and 4 m (trailing end), termed herein as , , , and , respectively. The distances of frictional resistance mobilization were estimated using the measurements of axial strain. For example, when the axial strain starts increasing at a point (e.g., 1 m from the leading end), the frictional resistance (and hence the axial force) is mobilized to that point. In test T1, the distances were: = 0.24 mm, = 1.35 mm, = 4.0 mm, and = 8.1 mm. In test T4, these were: = 0.23 mm, = 1.24 mm, = 3.92 mm, and = 10.5 mm. In test T3, these were: = 0.19 mm, = 0.83 mm, = 3.8 mm, and = 12.16 mm. As seen in Figure 9, the distributions of the axial strains are essentially linear. Thus, the equation proposed for 60 mm diameter pipes (Equation (6)) is applicable for 42 mm diameter pipe to calculate the mobilized friction length. Using the mobilized friction length, the pipe wall strains can be estimated using Equation (8).
where l = mobilized frictional length corresponding to known relative ground movement; x = distance from the leading end of the pipe; and p = pulling force at the leading end. Pipe wall strains calculated using Equation (8) are compared with measured strains in Figure 10 for different leading end displacements (, , , and , discussed earlier). The calculated strains compare very well with the measured strains in the figure. Thus, the equations proposed for 60 mm diameter pipes in Reza and Dhar [21] are applicable for the 42 mm diameter pipes presented in this study.
7. Conclusions
This paper presents the behaviour of 42 mm diameter MDPE pipes buried in loose sand subjected to relative axial ground movement. Axial pullout tests were conducted at various pulling rates to investigate the effects. FE analyses of the tests were conducted to evaluate the pipe–soil interaction parameters. Measured responses were then compared with the simplified models previously proposed by the authors. The following presents the major findings from this study.
- The pullout resistance increases nonlinearly with the pulling displacements at the leading end of the pipe. The nonlinear force–displacement responses are due to progressive mobilization of interface shearing resistance, starting from the leading end towards the trailing end. The pullout forces are maximal when the trailing end of the pipe begins to move. Thus, the leading end displacement up to the maximum pullout force is due to the elongation of the pipe only. This confirms the nonuniform nature of the frictional resistance mobilized on the pipe surface.
- The pullout force of the pipe increases with the rate of relative ground movement, regardless of pipe diameter. The nondimensional maximum pullout force follows a general trend of increasing nonlinearly with the increase of pulling rate, and can be presented using Equation (1).
- Rate-dependent friction reduction factors can be used for the calculation of the maximum pullout resistance. The friction reduction factor increases nonlinearly with the pulling rate, which is the same for 60 mm and 42 mm diameter pipes.
- The effect of pipe diameter decrease is negligible for the small diameter pipes. The normal stress adjustment factor (ζ) is close to 1. Thus, the conventional design equation (i.e., ALA 2005) may reasonably calculate the maximum pullout force for pipes buried in loose sand with the application of a pulling rate-dependent friction coefficient.
- Linear distributions of the axial strains were observed for the pipes presented in this study, implying that the unit shear resistance at the pipe–soil interface can be assumed to be constant over the pipe length.
- The pipe wall strains calculation method proposed by Reza and Dhar [21] for 60 mm diameter pipe can be used for 42 mm diameter pipes.
Author Contributions
Conceptualization, A.R. and A.S.D.; methodology, A.S.D.; software, A.R.; validation, A.R.; writing—original draft preparation, A.R. and A.S.D.; writing—review and editing, A.R. and A.S.D.; supervision, A.S.D.; project administration, A.S.D.; funding acquisition, A.S.D. All authors have read and agreed to the published version of the manuscript.
Funding
This work was supported by the Natural Sciences and Engineering Research Council of Canada (NSERC) [grant number CRDPJ 514564-17]; Government of Newfoundland and Labrador (InnovateNL) [grant number 5404.1798.103]; and FortisBC Energy Inc. [grant number 4800003989].
Institutional Review Board Statement
Not applicable.
Informed Consent Statement
Not applicable.
Data Availability Statement
The authors confirm that the data supporting the findings of this study are available within the article.
Acknowledgments
The authors are thankful for the technical assistance by Jason Murphy, Shawn Organ, and Matt Curtis in the Faculty of Engineering and Applied Science at Memorial University of Newfoundland. Undergraduate student Thabiso Mthethwa helped with instrumentation and pipe installation and deinstallation during the tests.
Conflicts of Interest
The authors declare no conflict of interest.
References
- Kunert, H.G.; Marquez, A.A.; Fazzini, P.; Otegui, J.L. Failures and integrity of pipelines subjected to soil movements. In Handbook of Materials Failure Analysis with Case Studies from the Oil and Gas Industry; Elsevier: Amsterdam, The Netherlands, 2016; pp. 105–122. [Google Scholar] [CrossRef]
- American Society of Civil Engineers. Guidelines for the Seismic Design of Oil and Gas Pipeline Systems; Committee on Gas and Liquid Fuel Lifelines, Technical Council on Lifeline Earthquake Engineering: New York, NY, USA, 1984. [Google Scholar]
- American Lifelines Alliance. Guidelines for the Design of Buried Steel Pipe; American Lifelines Alliance: Reston, VA, USA, 2005. [Google Scholar]
- Pipeline Research Council International. Guidelines for Constructing Natural Gas and Liquid Hydrocarbon Pipelines through Areas Prone to Landslide and Subsidence Hazards; Report Prepared for the Design, Material, and Construction committee; Pipeline Research Council International: Chantilly, VA, USA, 2009. [Google Scholar]
- Bilgin, Ö.; Stewart, H.E. Pullout resistance characteristics of cast iron pipe. J. Transp. Eng. 2009, 135, 730–735. [Google Scholar] [CrossRef]
- Murugathasan, P.; Dhar, A.S.; Hawlader, B.C. An experimental and numerical investigation of pullout behaviour of ductile iron water pipes buried in sand. Can. J. Civ. Eng. 2021, 48, 134–143. [Google Scholar] [CrossRef]
- Paulin, M.J.; Phillips, R.; Clark, J.I.; Trigg, A.; Konuk, I. A full-scale investigation into pipeline–soil interaction. In Proceedings of the ASME. IPC1998, Calgary, AB, Canada, 7–11 June 1998; pp. 779–788. [Google Scholar]
- Sarvanis, G.C.; Karamanos, S.A.; Vazouras, P.; Mecozzi, E.; Lucci, A.; Dakoulas, P. Permanent earthquake-induced actions in buried pipelines: Numerical modeling and experimental verification. Earthq. Eng. Struct. Dyn. 2017, 47, 966–987. [Google Scholar] [CrossRef] [Green Version]
- Wijewickreme, D.; Karimian, H.; Honegger, D. Response of buried steel pipelines subjected to relative axial soil movement. Can. Geotech. J. 2009, 46, 735–752. [Google Scholar] [CrossRef]
- Meidani, M.; Meguid, M.A.; Chouinard, L.E. Evaluation of soil–pipe interaction under relative axial ground movement. J. Pipeline Syst. Eng. Pract. 2017, 84, 04017009. [Google Scholar] [CrossRef]
- Sheil, B.B.Ã.; Martin, C.M.Ã.; Byrne, B.W.Ã.; Plant, M.; Williams, K.; Coyne, D. Full-scale laboratory testing of a buried pipeline in sand subjected to cyclic axial displacements. Géotechnique 2018, 68, 684–694. [Google Scholar] [CrossRef]
- Marino, G.; Osouli, A. Slip Resistance Behavior of Coal Tar–Coated Steel Pipelines Buried in Clayey and Sandy Backfills from Ground Movement. J. Pipeline Syst. Eng. Pract. 2020, 11, 05020001. [Google Scholar] [CrossRef]
- Weerasekara, L.; Wijewickreme, D. Mobilization of soil loads on buried polyethylene natural gas pipelines subject to relative axial displacements. Can. Geotech. J. 2008, 45, 1237–1249. [Google Scholar] [CrossRef]
- Wijewickreme, D.; Weerasekara, L. Analytical modelling of Field Axial Pullout Tests Performed on Buried Extensible Pipes. Int. J. Geomech. 2015, 15, 04014441-12. [Google Scholar] [CrossRef]
- Meidani, M.; Meguid, M.A.; Chouinard, L.E. A finite-discrete element approach for modelling polyethylene pipes subjected to axial ground movement. Int. J. Geo. Eng. 2018, 14, 717–729. [Google Scholar] [CrossRef]
- Meidani, M.; Meguid, M.A.; Chouinard, L.E. On the Response of Polyethylene Pipes to Lateral Ground Movements: Insights from Finite-Discrete Element Analysis. Int. J. Geosynth. Ground Eng. 2020, 6, 15. [Google Scholar] [CrossRef]
- Bilgin, Ö.; Stewart, H.E. Design Guidelines for Polyethylene Pipe Interface Shear Resistance. J. Geotech. Geoenviron. Eng. 2009, 135, 809–818. [Google Scholar] [CrossRef]
- Alam, S.; Allouche, E.N. Experimental investigation of pipe soil friction coefficients for direct buried PVC pipes. In Proceedings of the Pipeline Division Specialty Conference, Keystone, CO, USA, 28 August—1 September 2010; pp. 1160–1169. [Google Scholar]
- Alam, S.; Allouche, E.N.; Bartlett, C.; Sherpa, A.; Keil, B. Experimental evaluation of soil–pipe friction coefficients for coated steel pipes. In Proceedings of the Pipelines 2013: Pipelines and Trenchless Construction and Renewals—A Global Perspective, Fort Worth, TX, USA, 23–26 June 2013; pp. 360–371. [Google Scholar]
- Scarpelli, G.; Sakellariadi, E.; Furlani, G. Evaluation of soil–pipeline longitudinal interaction forces. Riv. Ital. Geotec. 2003, 4, 24–41. [Google Scholar]
- Reza, A.; Dhar, A.S. Axial Pullout Behaviour of Buried Medium Density Polyethylene Gas Distribution Pipes. Int. J. Geomech. 2021, 21, 04021120. [Google Scholar] [CrossRef]
- Saha, R.C.; Dhar, A.S.; Hawlader, B.C. Shear strength assessment of a well-graded clean sand. In Proceedings of the 72nd Canadian Geotechnical Conference, GeoSt.John’s 2019, St. John’s, NL, Canada, 29 September–2 October 2019. [Google Scholar]
- Groves, A.; Wijewickreme, D. Field monitoring of buried polyethylene natural gas pipelines subjected to ground movement. In Proceedings of the 66th Canadian Geotechnical Conference, GeoMontreal 2013, Montreal, QC, Canada, 29 September–3 October 2013. [Google Scholar]
- Cruden, D.M.; Varnes, D.J. Landslide Types and Processes. Landslides—Investigations and Mitigation; Transportation Research Board, Special Report 247; Turner, A.K., Schuster, R.L., Eds.; The National Academies of Sciences, Engineering, and Medicine: Washington, DC, USA, 1996; pp. 36–75. [Google Scholar]
- Anderson, C. Soil–Pipeline Interaction of Polyethylene Natural Gas Pipelines in Sand. Master’s Thesis, University of British Columbia, Vancouver, BC, Canada, 2004. [Google Scholar]
- Suleiman, M.T.; Coree, B.J. Constitutive model for high density polyethylene material: Systematic approach. J. Mater. Civ. Eng. 2004, 16, 511–515. [Google Scholar] [CrossRef]
- Bilgin, Ö.; Stewart, H.E.; O’Rourke, T.D. Thermal and mechanical properties of polyethylene pipes. J. Mater. Civ. Eng. 2007, 19, 1043–1052. [Google Scholar] [CrossRef]
- Janbu, N. Soil compressibility as determined by oedometer and triaxial tests. In Proceedings of the European Conference on Soil Mechanics and Foundation Engineering (ECSMFE); German Society for Earthworks and Foundations: Essen, Germany, 1963; Volume 1, pp. 19–25. [Google Scholar]
- Fellenius, B.H. Basics of Foundation Design; Electronic: Calgary, AB, Canada, 2009; Available online: www.fellenius.net. (accessed on 2 September 2021).
- Budhu, M. Soil Mechanics and Foundations, 3rd ed.; John Wiley & Sons, Inc.: Hoboken, NJ, USA, 2011; p. 136. ISBN 978-0-470-55684-9. [Google Scholar]
- Muntakim, A.H.; Dhar, A.S. Assessment of Axial Pullout Force for Buried Medium-Density Polyethylene Pipelines. J. Pipeline Syst. Eng. Pract. 2021, 12, 04020074. [Google Scholar] [CrossRef]
- Ansari, Y.; Kouretzis, G.; Sloan, S.W. Development of a prototype for modelling soil–pipe interaction and its application for predicting uplift resistance to buried pipe movements in sand. Can. Geotech. J. 2018, 55, 1451–1474. [Google Scholar] [CrossRef] [Green Version]
Figure 1.
Test cell configuration.

Figure 2.
Test preparation (image by authors).
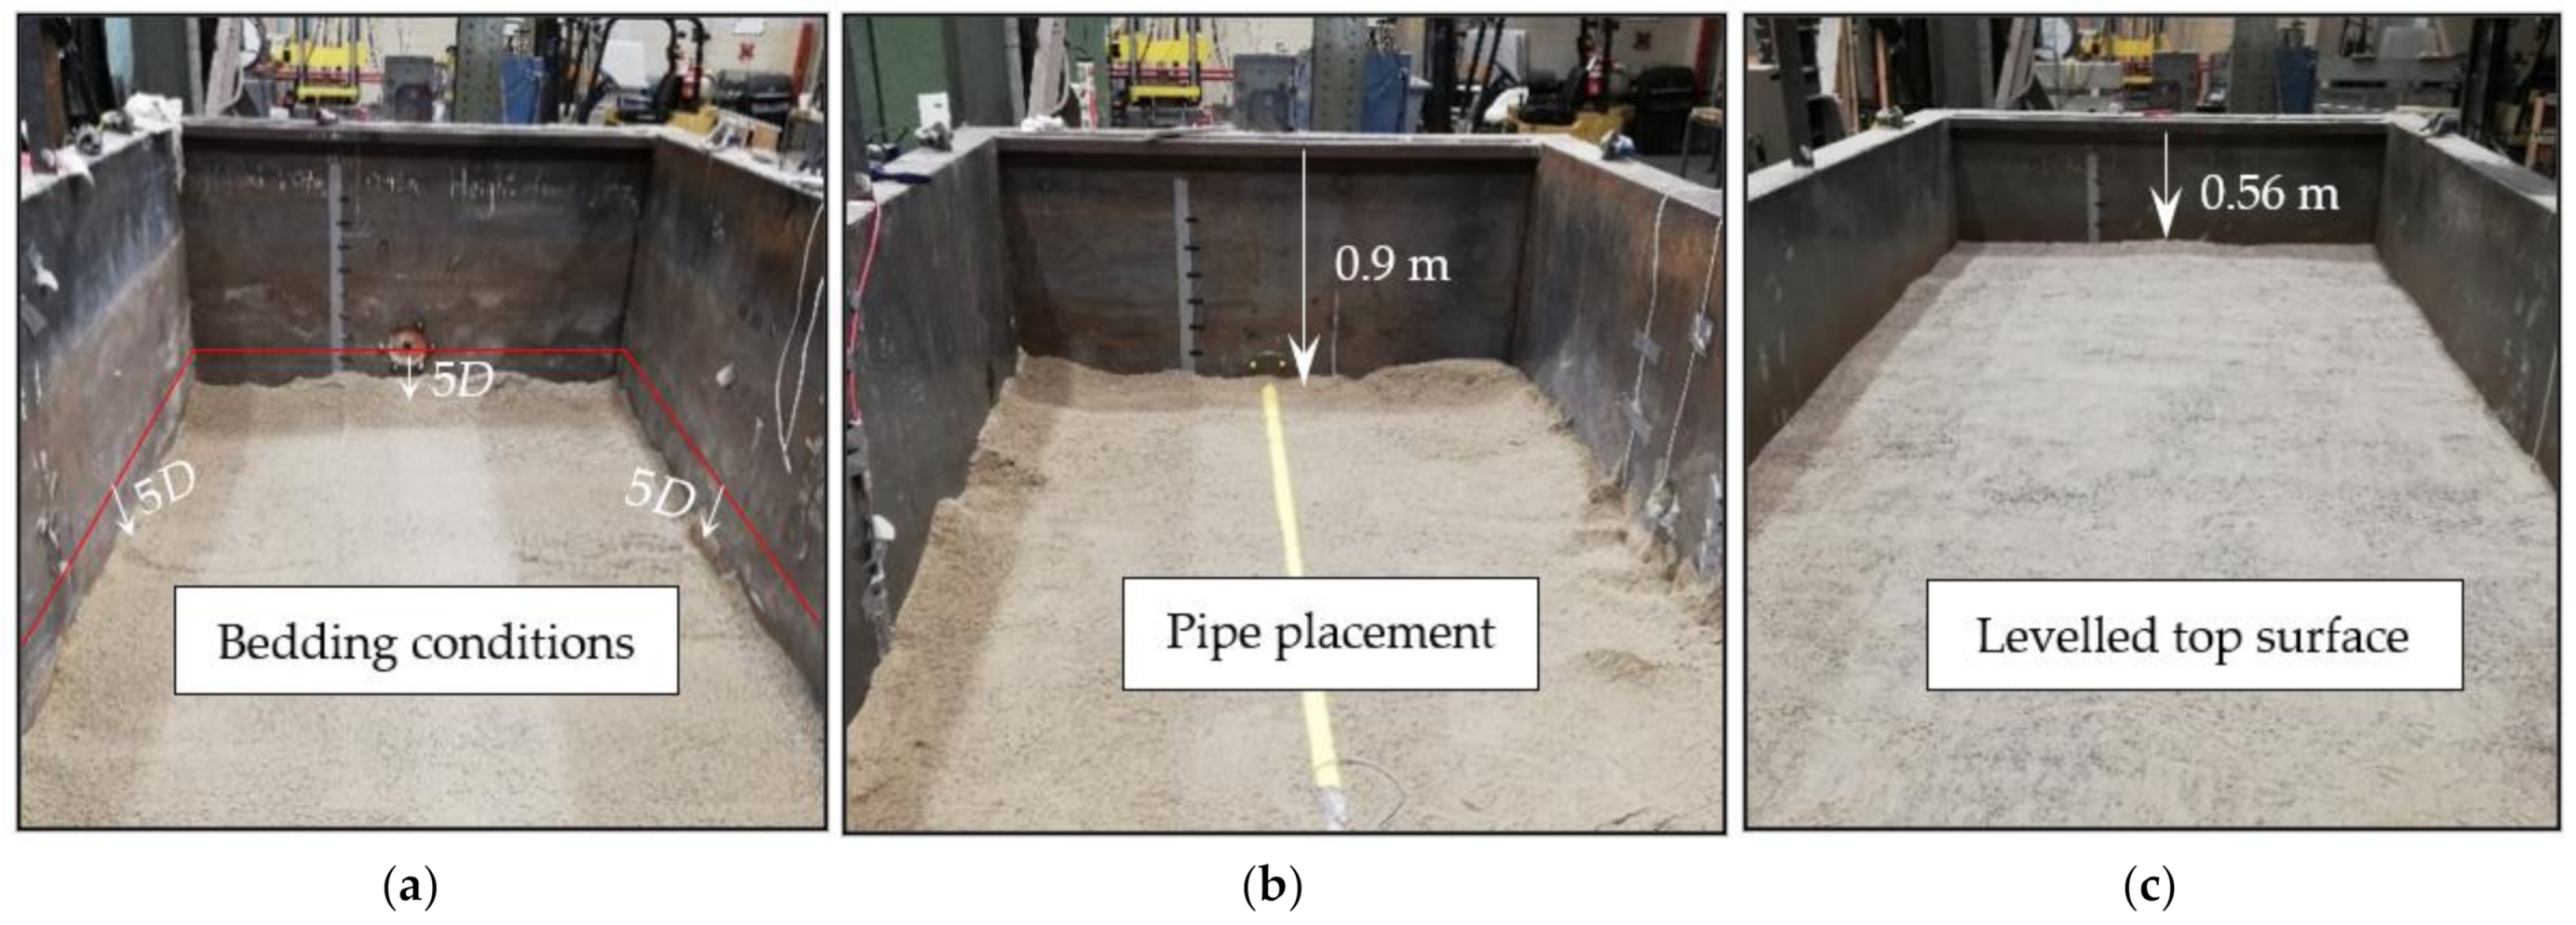
Figure 3.
Axial pullout resistance with leading end displacement.
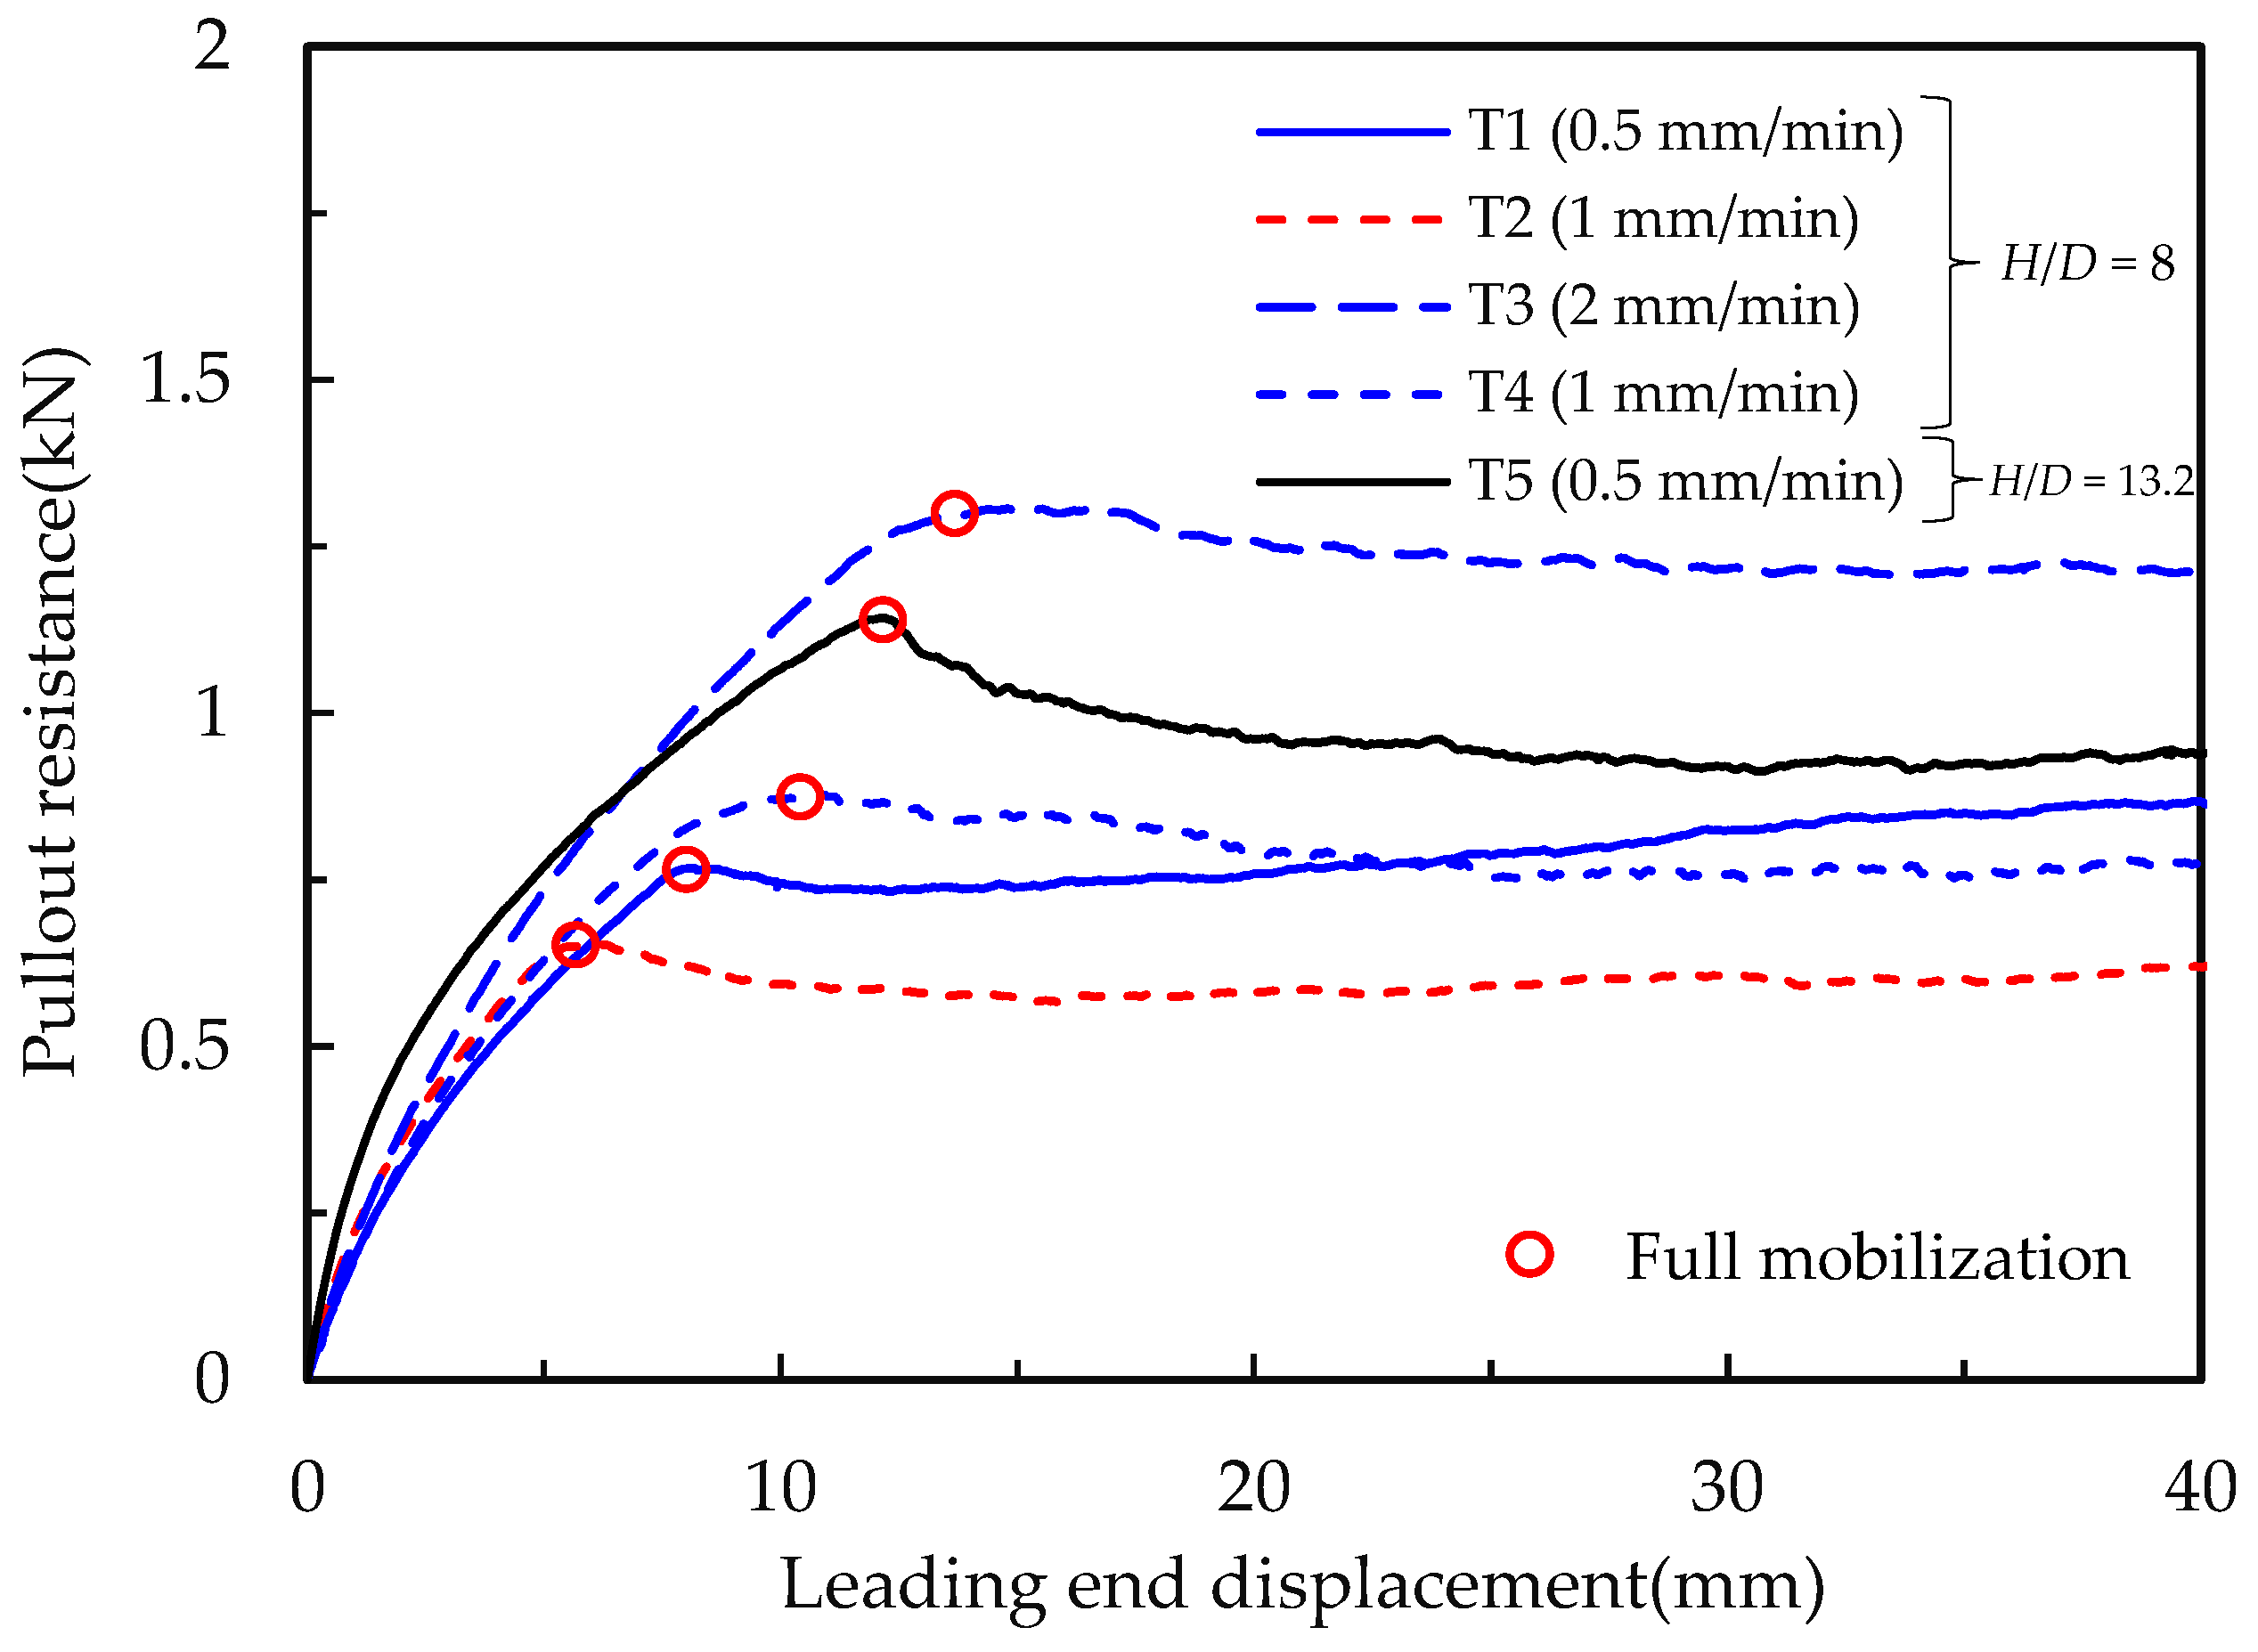
Figure 4.
Normalized peak pullout forces with pulling rates in loose/medium sand.
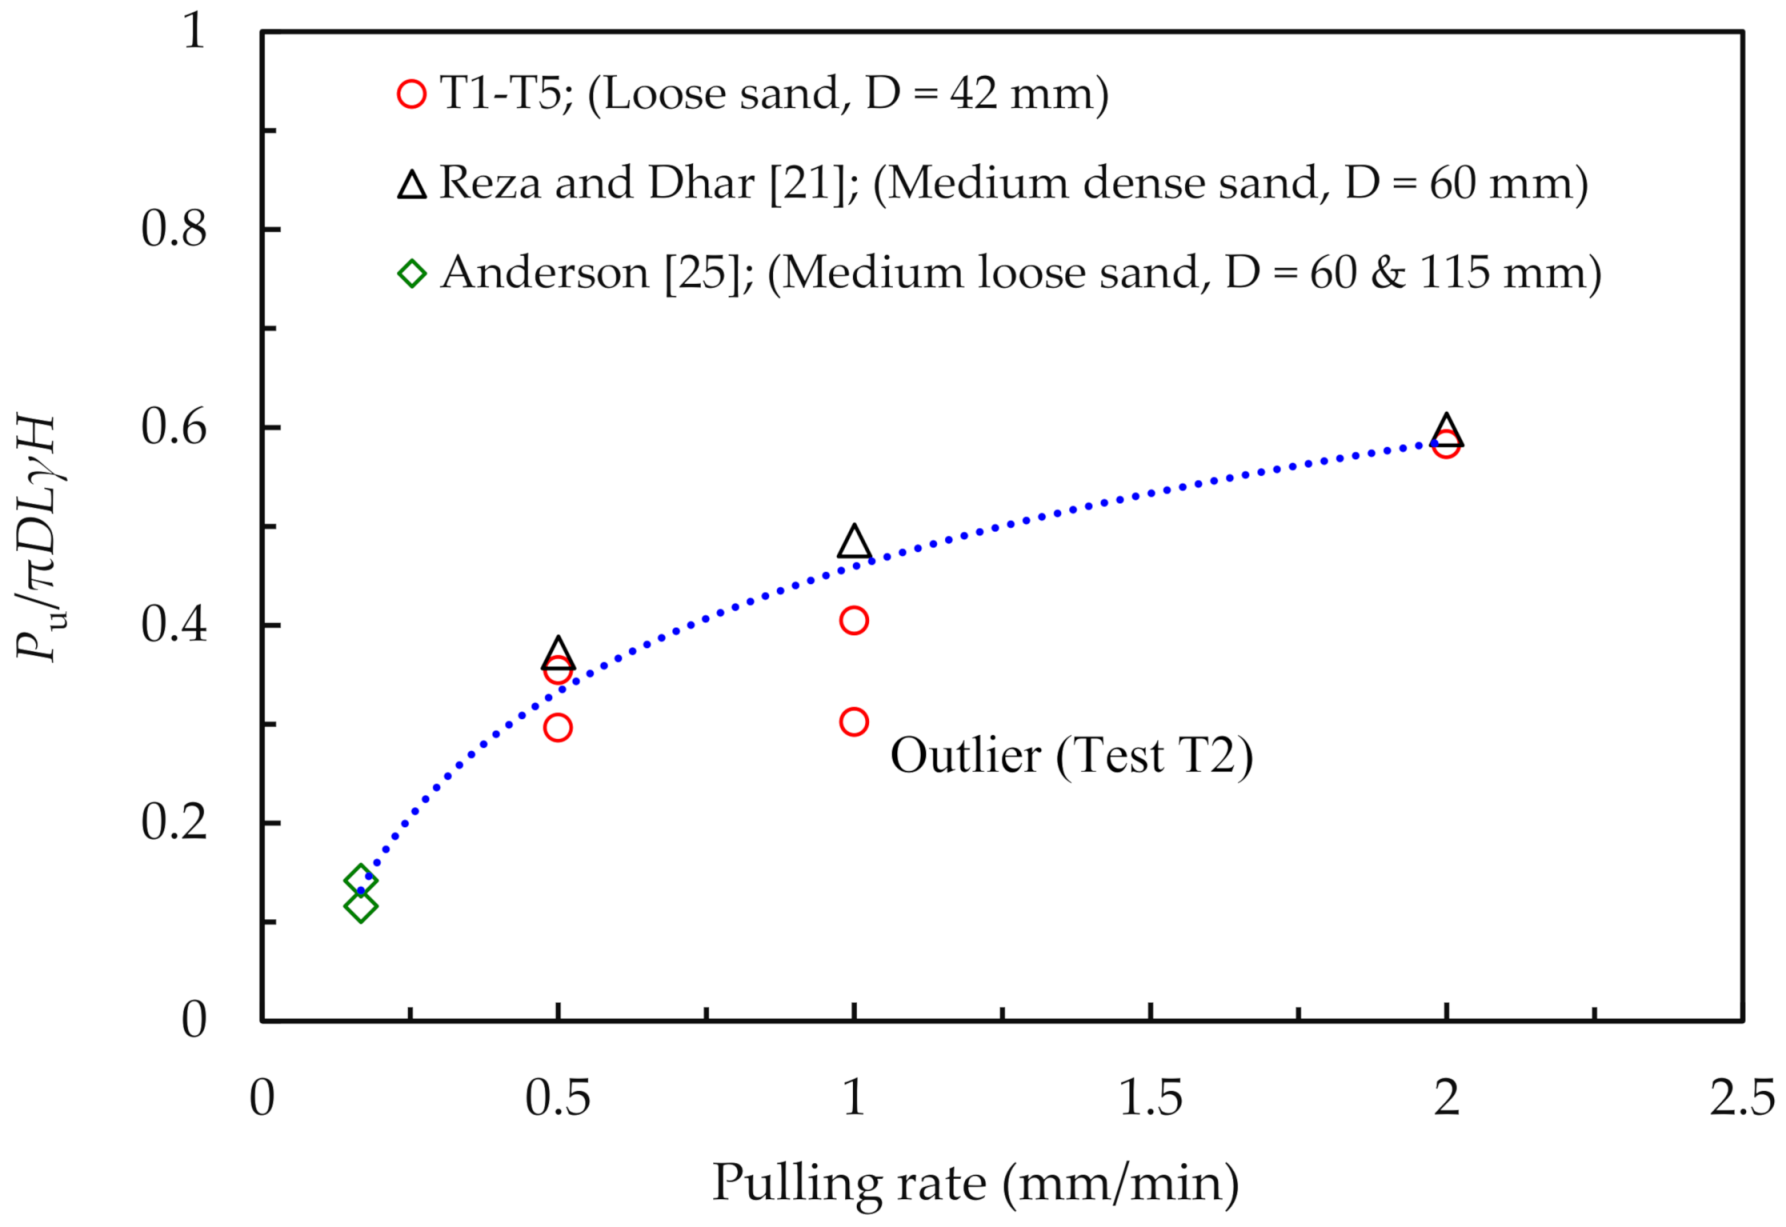
Figure 5.
FE mesh of the pipe–soil system. (a) 3D FE mesh; and (b) cross-section near the pipe.
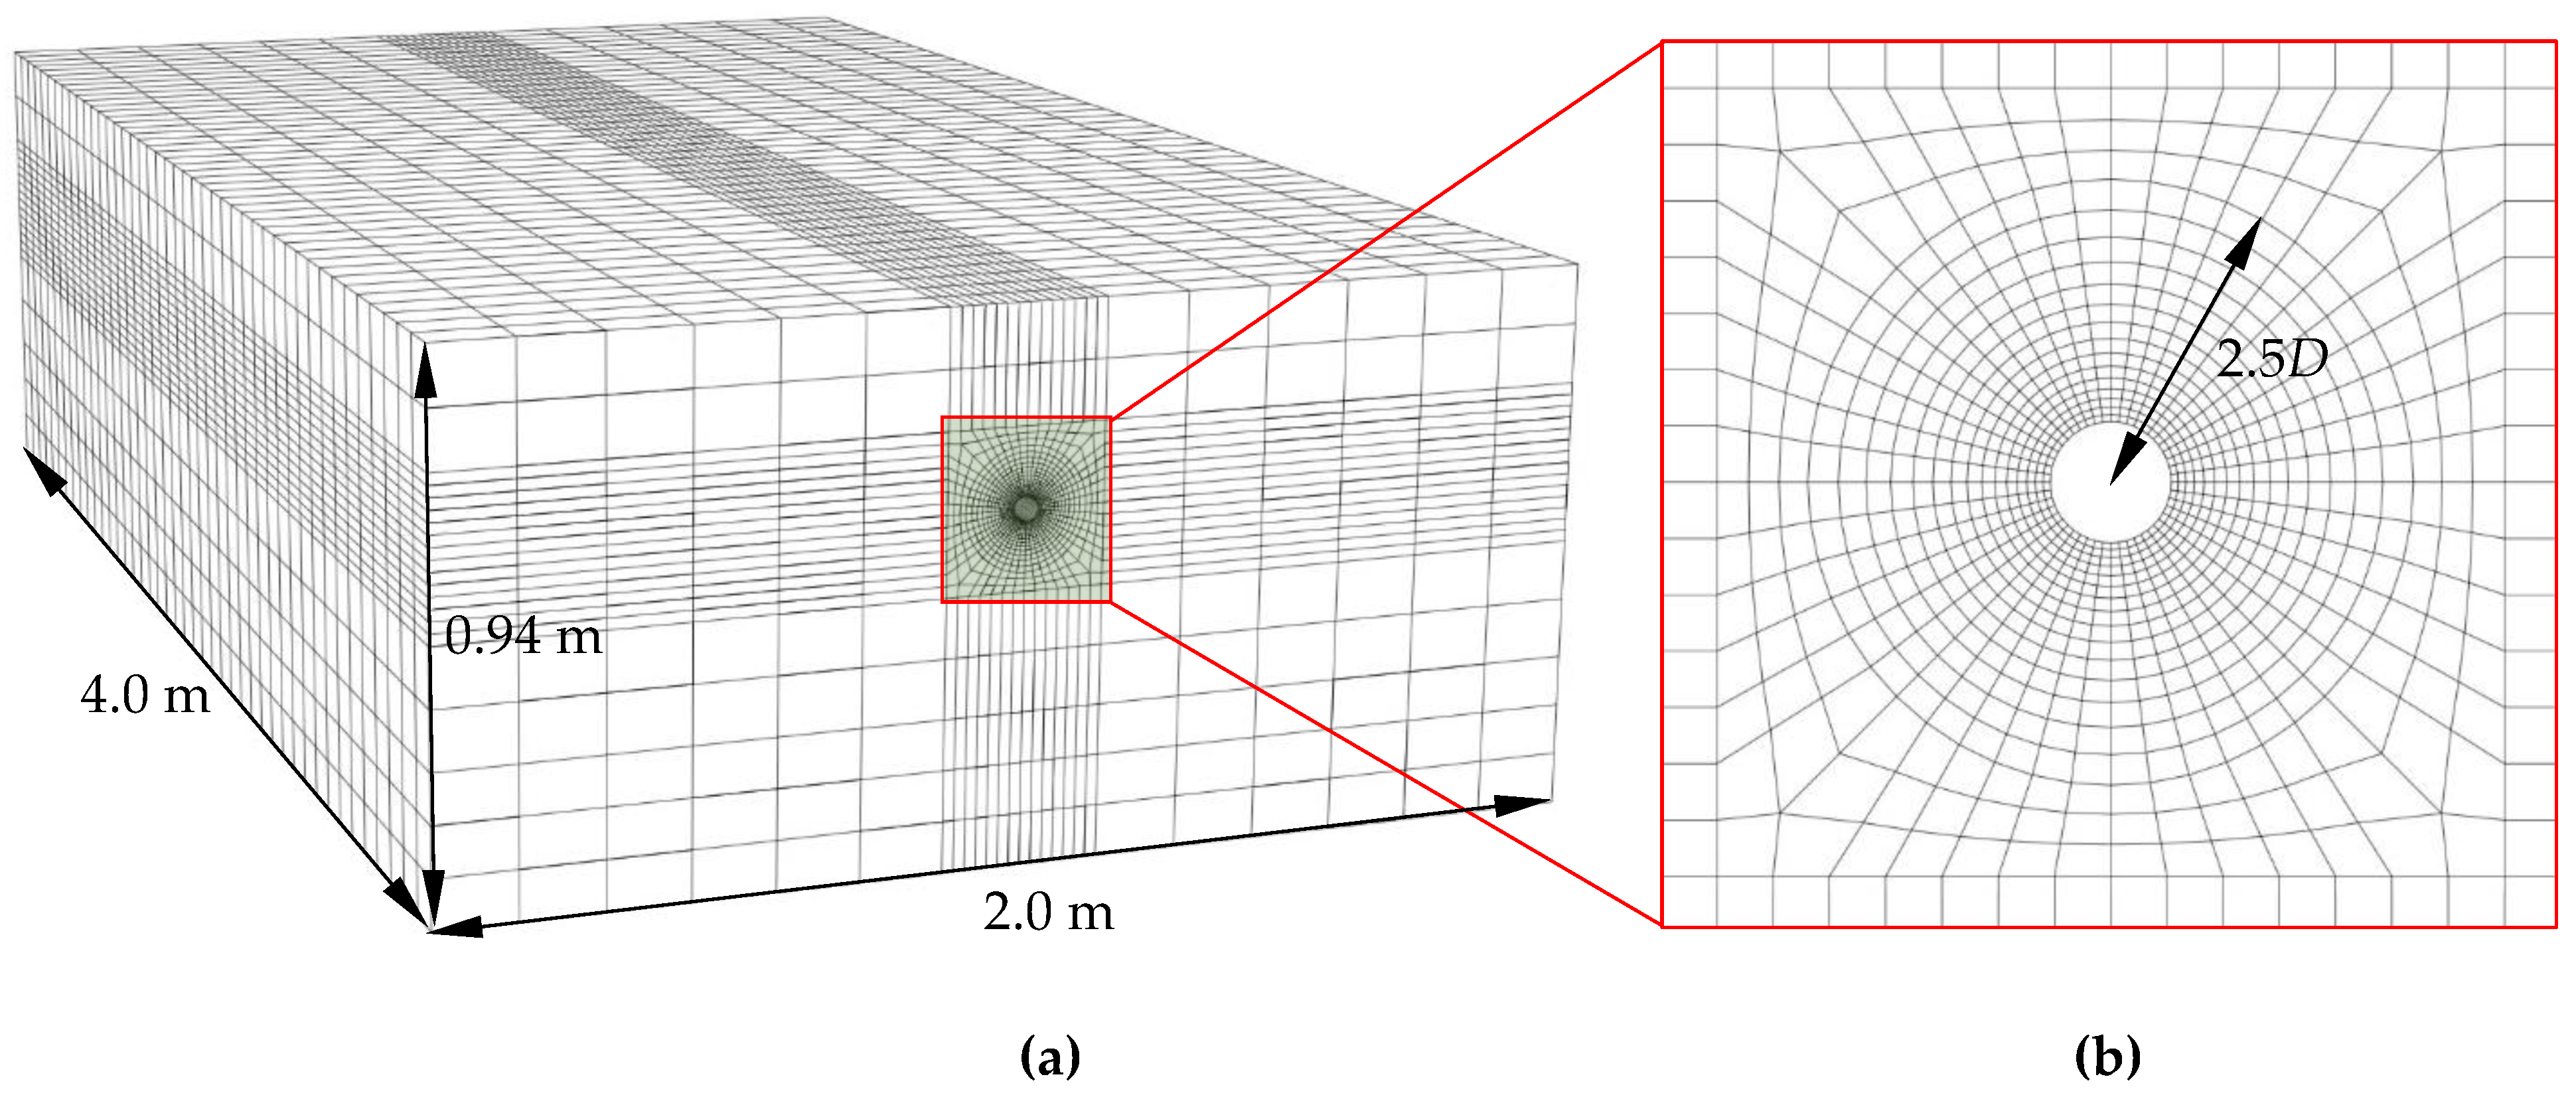
Figure 6.
Simulation of load–displacement response.
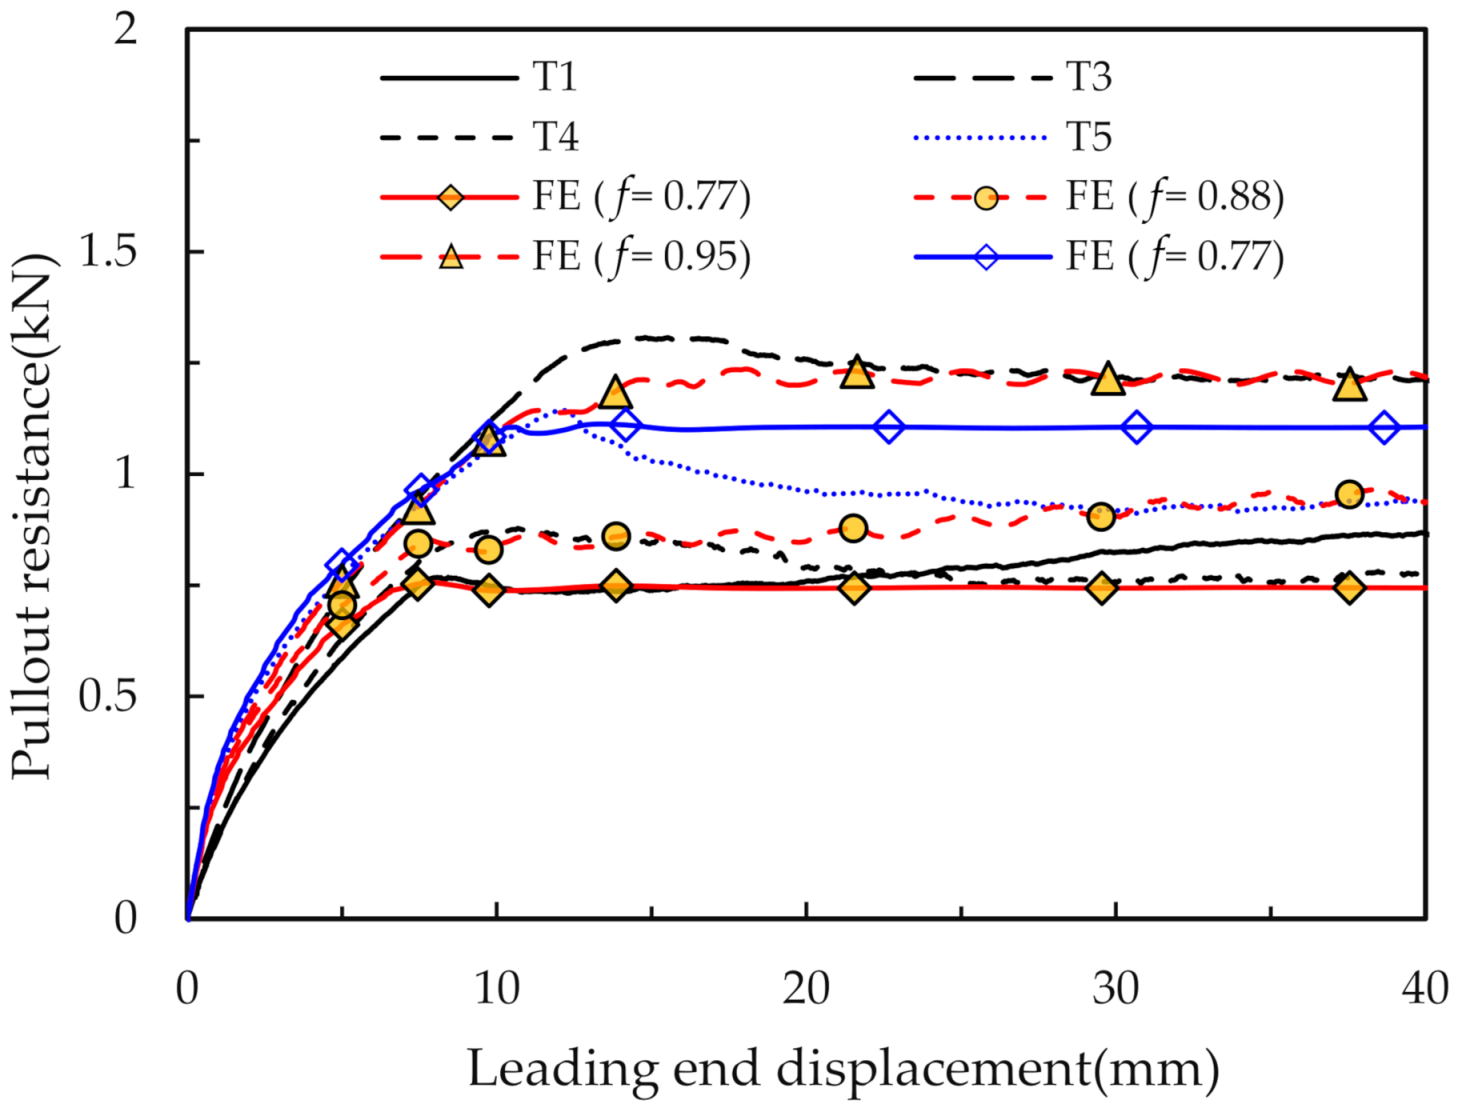
Figure 7.
Interface friction reduction factor with pulling rates.
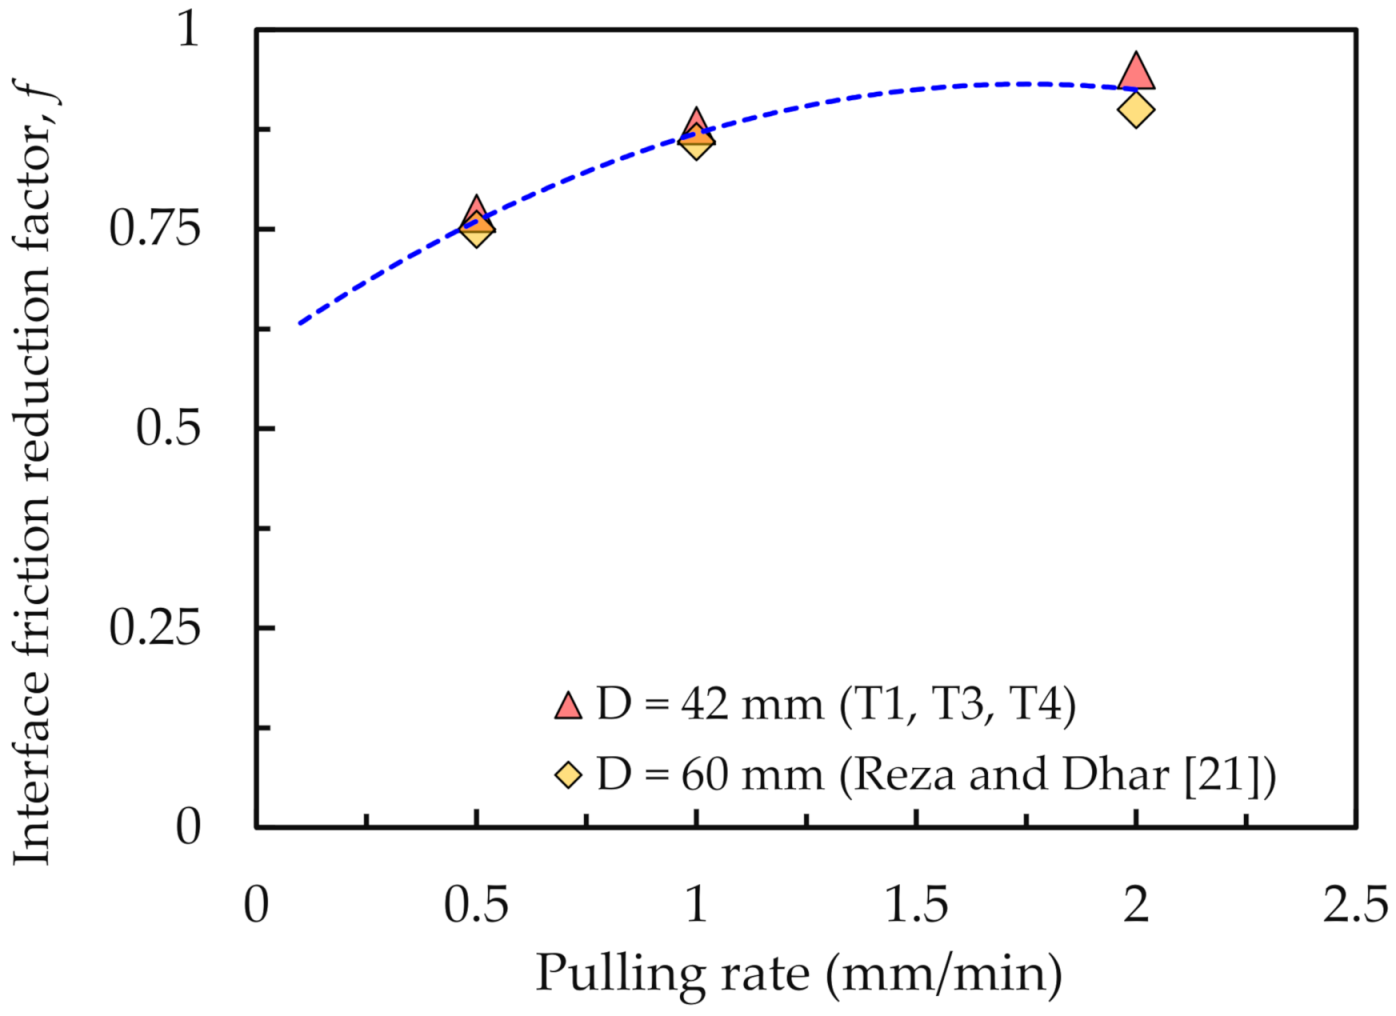
Figure 8.
Comparison of axial strains at different locations of the pipes in test T1 (the inserted figure shows pipe axial strain from FE calculation at peak pullout load).
Figure 8.
Comparison of axial strains at different locations of the pipes in test T1 (the inserted figure shows pipe axial strain from FE calculation at peak pullout load).
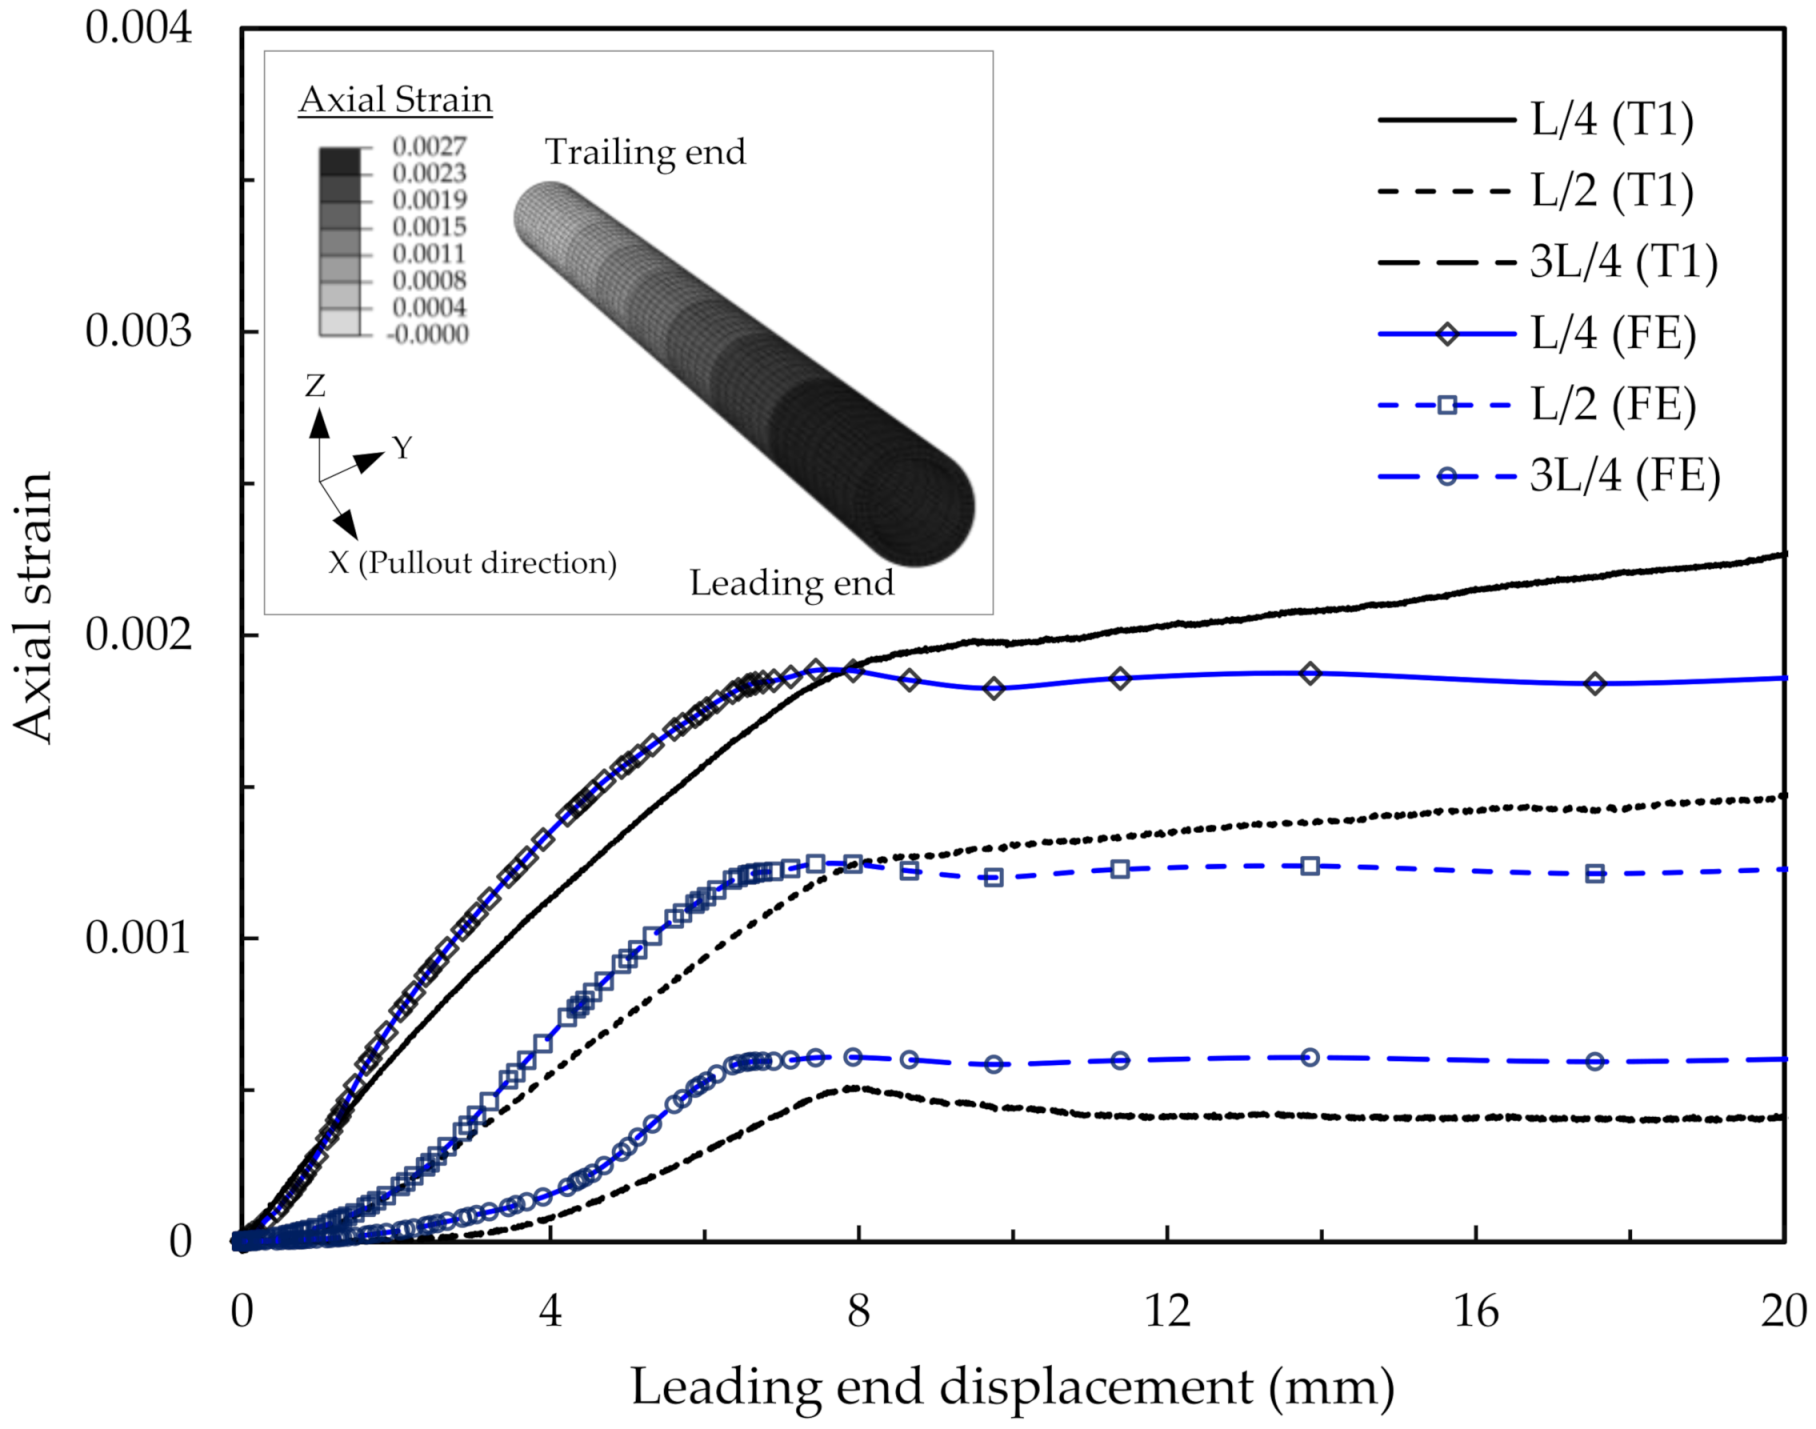
Figure 9.
Strain distribution along the length of the pipe.

Figure 10.
Comparison of experimental strains with calculations using the simplified method for (a) T1; (b) T4; and (c) T3. , , , and are the leading end displacements when the axial force is mobilized to the distance of 1, 2, 3, and 4 m (trailing end), respectively, from the leading end.
Figure 10.
Comparison of experimental strains with calculations using the simplified method for (a) T1; (b) T4; and (c) T3. , , , and are the leading end displacements when the axial force is mobilized to the distance of 1, 2, 3, and 4 m (trailing end), respectively, from the leading end.


Table 1.
Sand properties.
| Property | Value |
|---|---|
| (mm) | 0.742 |
| 5.81 | |
| 2.04 | |
| Fines content (%) | 1.3 |
| Gravel content (%) | 0.87 |
| 2.62 | |
| 0.33 | |
| 0.65 | |
| Maximum dry density (kN/m3) | 18.8 |
Publisher’s Note: MDPI stays neutral with regard to jurisdictional claims in published maps and institutional affiliations. |
© 2021 by the authors. Licensee MDPI, Basel, Switzerland. This article is an open access article distributed under the terms and conditions of the Creative Commons Attribution (CC BY) license (https://creativecommons.org/licenses/by/4.0/).
Share and Cite
MDPI and ACS Style
Reza, A.; Dhar, A.S. Effects of Axial Relative Ground Movement on Small Diameter Polyethylene Piping in Loose Sand. Infrastructures 2021, 6, 168. https://doi.org/10.3390/infrastructures6120168
AMA Style
Reza A, Dhar AS. Effects of Axial Relative Ground Movement on Small Diameter Polyethylene Piping in Loose Sand. Infrastructures. 2021; 6(12):168. https://doi.org/10.3390/infrastructures6120168
Chicago/Turabian StyleReza, Auchib, and Ashutosh Sutra Dhar. 2021. "Effects of Axial Relative Ground Movement on Small Diameter Polyethylene Piping in Loose Sand" Infrastructures 6, no. 12: 168. https://doi.org/10.3390/infrastructures6120168