
Design of Fast Patrol Boat for Improving Resistance, Stability, and Seakeeping Performance
by
 , ,
, ,
Tri Rahmaji
1,
Aditya Rio Prabowo
1,* ,
,
Tuswan Tuswan
2,
Teguh Muttaqie
3,
Nurul Muhayat
1 and
Seung-Jun Baek
4 1
Department of Mechanical Engineering, Universitas Sebelas Maret, Surakarta 57126, Indonesia
2
Department of Naval Architecture, Universitas Diponegoro, Semarang 50275, Indonesia
3
Research Center for Hydrodynamics Technology, National Research and Innovation Agency (BRIN), Surabaya 60112, Indonesia
4
Department of Naval Architecture and Marine Systems Engineering, Pukyong National University, Busan 48513, Korea
*
Author to whom correspondence should be addressed.
Designs 2022, 6(6), 105; https://doi.org/10.3390/designs6060105
Submission received: 5 September 2022
/
Revised: 16 October 2022
/
Accepted: 27 October 2022
/
Published: 1 November 2022
Abstract
:Indonesia is the largest archipelagic country and has the potential to become the world’s maritime axis. Two-thirds of Indonesia’s territory is ocean, with a total coastline of 54,716 km. Therefore, Indonesia must have solid systems and tools to overcome the various threats in the maritime sector. One of the technologies that can be developed to protect Indonesia’s naval territory is fast patrol boats. Indonesia requires efficient patrol boats that can optimally monitor the large Indonesian sea area and various potential threats in the maritime sector. Thus, research on the hydrodynamic criteria for the hull design of patrol boats is fundamental. In this study, we aimed to evaluate the design method based on hydrodynamic characteristics to obtain the primary dimensions and shape of the ship’s hull. We designed and analysed 11 ship models in terms of the following criteria: the resistance, stability, and seakeeping performance. The 11 models included five reference models of patrol boats with varying dimensions and block coefficients between 0.42 and 0.53, three ship models with the regression method with the exact dimensions and block coefficients between 0.45 and 0.46, and three ship models with the scale method with the exact measurements and block coefficients between 0.43 and 0.45. According to the analysis results, the regression method had better total hydrodynamic criteria and greater similarity to the reference vessel. With a shorter processing time, the regression method was more efficient than the scaling method and reference ship.
1. Introduction
Indonesia is an archipelagic country with 17,508 islands that are spread over a distance of 5000 km [1]. Two-thirds of Indonesia’s territory is ocean, with a total coastline of 54,716 km. With its strategic location between two continents (the Asian continent and Australian continent) and two oceans (the Indian Ocean and Pacific Ocean), Indonesia has the potential to become the world’s maritime axis [2]. As an archipelagic country that has become the world’s shipping traffic lane, Indonesia is responsible for safety and security in the territorial sea, which is within its jurisdiction [3]. The increasingly dynamic global politics poses a threat to the maritime sector in terms of illegal fishing, illegal trade routes, and global terrorism. Protecting the sea border is a top priority for the Indonesian government. Indonesia must have a strong fleet to monitor and safeguard its territorial sovereignty from various threats. In response to this, the government of Indonesia has created an integrated fleet system with a focus on strengthening submarines, frigates, and patrols boats with minimum essential force (MEF) (2024).
Fast patrol boats are part of the fleet that used to monitor Indonesia’s border areas. These ships are relatively small but have a high enough speed that they can increase the time efficiency when crossing Indonesian sea areas [4]. Indonesia’s substantial marine activity, with various rich marine products, poses multiple threats to Indonesia’s maritime sector. Therefore, Indonesia requires patrol boats with optimal functioning to protect Indonesia’s sovereign territory from these threats. To support this, research on the hydrodynamic characteristics of the ship’s hull is crucial. In previous studies, researchers studying ship hulls focused on the effect of the hull modification on the resistance value [4,5]. An investigation into the monohull model of fast boats with different primary dimensions resulted in varying resistance, stability, and seakeeping performance data [6]. Differences in the Earth’s climate affect the characteristics of water in the oceans, and so researchers need to pay attention to the performance of ships under certain conditions [7]. Researchers carry out optimisation of the hull to find an efficient hull shape and a good hydrodynamic performance [8,9,10].
We need to study the development of efficient methods to find the primary dimensions of the ship and shape of the hull to determine the adequate size, as required. We can apply the hull modeling method through regression and scale to determine the ship’s primary dimensions and the hull’s shape. The main characteristics of a ship’s design include the length (L), width (B), draft (d), and deadweight tonnage (DWT) [11]. A regression analysis from the reference data is needed to determine the main characteristics of the ship design [11,12,13]. In ship design, the scale method is performed by changing the primary dimensions of the original data according to the desired needs, without changing the hull’s shape. As Indonesia’s maritime infrastructure needs to be improved, especially the marine sector, we conducted an investigation into practical methods to develop patrol boats according to their needs.
In this study, we focused on the resistance, stability, and seakeeping performance criteria in the regression analysis design method, scaling design method, and for an original ship or design reference. In this study, we neglected the effects of the type of propulsion system and the hull construction. We aimed to evaluate each design method based on its hydrodynamic characteristics. In order to produce a hull with good efficiency according to the needs of the patrol boats, we used the Savitsky planing method for the resistance analysis, the large-angle stability for the stability analysis, and strip theory for the seakeeping analysis. Then, we evaluated the comparisons between the models using the multi-attribute decision-making (MADM) method to determine the best design alternative.
2. Theoritical Backgroud and Method
2.1. Design Method
Overall, ship design determines the main dimensions, line plans, general arrangement, structural design, etc. [14]. In the early stages of ship design, the hull’s shape is made after determining the main dimensions [15]. The main dimensions of vessels play an essential role in the ship design process. Therefore, in the ship design process, determining the ship’s main dimensions becomes the basis for the ship design concept. A mathematical approach can be used to determine the ship’s main dimensions, such as regression analysis [11]. In addition, the scale method from the reference ship can be used to determine the new hull shape. The following flow diagram of the initial ship design process is presented in Figure 1.
2.1.1. Regression Method
Regression analysis is one of the statistical methods used to determine the causal relationship between one variable and another [16]. The causal variable is often described by the variable X (independent variable), while the effect variable is defined by the variable Y (dependent). This analytical method is one of the most widely used in machine learning. In ship design, this regression method is used to find the primary dimension of the ship by looking at the relationship between ship length (L), ship width (B), ship depth (D), and deadweight (DWT) [11]. Linear regression is one of the regression methods. In linear regression, the relationship between the ship’s main dimensions (L, B, D, and DWT) follows the usual straight line. The linear regression mathematical model is as shown in Equation (1).
where Y and X are variables; a and b are constants.
Y = aX + b
2.1.2. Scaling Method
In developments in the field of design engineering, scaling methods are often used in geometric modelling. This method is used to change the main dimensions of a product according to the needs without changing the shape of the original design. With the help of 3D modeling software, the scaling process becomes faster. In a previous study, this method was used to find the main dimensions of the fishing vessel, with a ratio of 1: 20 from the reference vessel [17]. Therefore, this method can be used to design a ship according to size requirements. The ship-scaling method has also been applied by comparing two ship models with different ratios [18]. The scaling method has also been applied in the analysis of the ship propeller model [19].
2.2. Resistance Calculation
When the ship is operating, there will be a force opposite to the direction of the ship’s motion, called the ship’s resistance [4]. When designing a ship, the prediction of the ship’s total resistance is one of the most important factors [20]. The resistance value will be greater if the ship moves faster. Several factors affect the magnitude of the ship’s resistance, including ship speed (Vs), displacement (∆), and hull form [21]. Ship resistance has several components, including wave-making resistance, viscous resistance, and frictional resistance, as shown in Figure 2.
2.2.1. Frictional Resistance
Ship frictional resistance is one of the main types of ship resistance, with the percentage of resistance reaching 60~70% of the total resistance [22]. This resistance is a function of surface roughness, water viscosity, and wetted surface area [21]. The sum of the tangential stresses along the direction of motion of the ship on the submerged surface is the value of the frictional resistance [23]. According to the ITTC-57 formula, the frictional resistance coefficient is as shown in Equations (2) and (3).
where is a frictional coefficient, is Reynolds number, is the frictional resistance, is mass density of water, S is wetted surface area, and V is hull speed.
2.2.2. Viscous Resistance
Resistance is divided into two main parts, namely, the viscous resistance component and the wave resistance component, according to the ITTC standard. The total pressure drop behind the hull can be used to calculate the viscous resistance [24]. This pressure drop is due to the viscous force, which causes pressure loss at the rear of the ship’s body [24]. The coefficient of viscous resistance and total viscous resistance are shown in Equations (4) and (5).
where is viscous resistance coefficient, k is wave number, and is viscous resistance.
2.2.3. Wave Resistance
When the ship moves in the waters at a certain speed, it will produce waves. The higher the rate, the higher the produced tide, and the energy required will increase [21]. This required energy is called wave-making resistance. The wave resistance value is shown in Equation (6).
where is the wave resistance, c is a section chord, is the displacement volume, g is the acceleration due to gravity, is Froude number, and is Leeway angle.
2.2.4. Reynolds Number
Reynolds number can express the type of fluid flow. Fluids with a Reynolds value less than 2300 are categorised as laminar fluids, then values between 2300 and 4000 can be classified as transient flows, while those above 4000 are called turbulent flows [25]. Reynolds number can be identified by viscosity resistance, as shown in Equation (7) [24].
where is Reynold number, is the service speed, Lwl is the length of the waterline, and v is is the viscosity of seawater.
2.2.5. Froude Number
Froude number is a dimensionless number on the flow around the hull [26], which is used in hydrodynamics to indicate how well a particular model works for the whole system. The boat’s speed affects the magnitude of the Froude number [27]. The faster the ship, the greater the Froude Number value. Froude number calculation is defined in Equation (8) [24].
where L is length of ship, V is the ship speed, and g is acceleration due gravity.
2.2.6. Savitsky Method
The Savitsky method is one of the numerical methods of calculating hull resistance using hydrodynamic calculations to determine the wetted surface, a center of pressure, drag, and resistance. Its functions are speed, trim, deadrise angle, and load [28]. This method is used for prismatic hulls, which are often used on fast boat types and do not apply to curved hulls [25]. In the Savitsky calculation method, the frictional and total resistance value is defined in Equations (9) and (10) [28].
where is frictional resistance, is the average value of the ratio of length and width in the wet area, is the mean chine beam of planing craft, is deadrise angle of planing hull, is the total drag, is displacement force, and is the trim angle of planing hull.
2.3. Stability Calculation
Ship stability is defined as the ship’s ability to remain stable or return to its original position when the ship receives an external moment [29,30,31]. Stability calculations are a fundamental part of the naval architecture that ensures safe operation throughout the ship’s life cycle. Several essential points influence the stability of a ship in a boat. Point stability of the ship is depicted in Figure 3.
Figure 3 shows three crucial points that affect the stability of the ship. These points include buoyancy, gravity, and metacentric points. When the vessel is subjected to external forces such as waves or wind, the boat will experience a heel [30]. This will cause changes at the center of buoyancy according to the ship’s inclination angle. The location of the main force point on the boat changes due to the slope. This affects the value of GZ. The GZ value is the perpendicular distance between the lines of action of the force that occurs, commonly called the righting lever [30]. A ship will come to its upright position or will become stable, when an external force is applied and removed, if the centre of gravity remains in the same position well below metacentric height of the ship.
2.3.1. Center of Buoyancy
Ships can float on water because the ship’s buoyancy is greater than the ship’s weight. The center of the lift from the vessel is called the center of buoyancy. The magnitude of the buoyancy force is equal to the weight of the liquid displaced by an object submerged in water [31]. The ship’s buoyancy acts at the point where all moments are lost. The XB point can define the value of the buoyancy according to Equation (11).
where is the bouyancy coordinates and is the volume of displacement.
2.3.2. Center of Gravity
The ship’s center of gravity is defined as the center of the ship’s total mass. The direction of the ship’s vertical downward gravity is opposite to the direction of the lift from the boat. The center of gravity will change position when there is an addition, subtraction, or shift in mass in the ship [30]. The change in the center of gravity on the vessel is defined in Equation (12).
where w is the weight and d is the distance.
2.3.3. Metacentric Point
The ship’s metacentric point is the centerpoint of its wobble when rolling. This point is located at the intersection of two vertical lines that pass through the center of buoyancy at a certain angle when the ship is tilted [30]. The vessel will remain stable when rolling if its center of gravity is below the metacentric point and not below the center of buoyancy [32]. The vertical distance between the center of gravity G and the metacentric point M is called the metacentric height GM. Metacentric height GM can be defined by Equation (13)
where GM is the metacentric height and is trim or pitch angle.
2.4. Seakeeping
Seakeeping ability is used to determine a ship’s performance when sailing in certain marine environmental conditions [33]. Seakeeping performance is influenced by several factors, including the movement of six degrees of freedom, ship speed, and the influence of marine environmental conditions such as extreme weather. Therefore, seakeeping ability is an essential aspect when designing a ship so that the efficiency of the ship’s performance increases. When the ship hits the waves, the vessel will experience displacements (swaying, heaving, surging) and angular movements (pitching, rolling, yawing), as shown in Figure 4 [34]. Of all these moves, only three lead to the return force: heaving, pitching, and rolling. These three are often used as a reference in the ship-design process. These movements have different characteristics when experiencing various directions of incoming waves.
2.4.1. Heaving
Heaving is the ship’s movement caused by waves in the form of vertical up and down movements in parallel to the Z axis. To analyze heaving, use Equation (14).
where is inertial force, is damping force, is restoring force, and is the exiciting force.
2.4.2. Rolling
Rolling is the movement of the ship around the X axis. This movement occurs when the right side of the boat moves to the left side of the vessel, which is alternately repeated [35]. The analysis of the rolling motion uses the Equation (15).
where is inertial moment, is damping moment, is restoring moment, and is the exiciting moment.
2.4.3. Pitching
Pitching is the movement of the ship around the Y axis. The bow and stern alternately experience a change in trim when there is a pitching motion. This movement can be analyzed using Equation (16) [36].
where is inertial moment, is damping moment, is restoring moment, and is the exiciting moment.
2.4.4. Joint North Sea Wave Project (JONSWAP) Spectrum
Wave characteristics are very dominant influences on seakeeping performance. One wave spectrum often used in seakeeping analysis is the Joint North Sea Wave Project (JONSWAP) spectrum. The JONSWAP spectrum is an empirical relationship that defines energy distribution and frequency in the ocean [37]. The JONSWAP spectrum equation is presented in Equation (17) [37].
where is wave frequency, is the intensity of the spectra, is a shape factor, is the peak wave frequency, is the peak enhancement factor, and is parameter width of the spectral.
2.4.5. MSI
Motion Sickness Incident (MSI) is a parameter used to determine the percentage of discomfort in a moving environment [38]. On ships, motion sickness is characterized by uncomfortable physical symptoms such as dizziness, nausea, paleness, difficulty breathing, and vomiting, often called seasickness, due to the ship movement. The MSI index is used to determine the percentage of possible seasickness. The MSI index can be calculated using Equation (18) [38].
while is spectral moment of the ship.
2.4.6. Deck Wetness and Slamming
Deck wetness and slamming are phenomena that should be avoided on ships. This phenomenon can cause damage to the structure of the vessel as well as endanger the crew. Deck Wetness is a condition where water enters the ship’s deck, which can cause damage and threaten the crew [39]. This condition is caused by the frequency of ocean waves that have large amplitudes, while slamming is a phenomenon that occurs when the bottom of a ship hits the water at high speed. This condition causes deformation of the hull and structural damage at the bottom of the boat’s bow due to the high-pressure collision between the ship and water [39]. Slamming and deck wetness are affected by the vessel’s vertical motion and relative speed. The probabilities of deck wetness and slamming are used to design ships to avoid these phenomena. The probabilities of deck wetness and slamming are defined in Equations (19) and (20) [39]
while is relative vertical motion spectrum, is effective board, is relative vertical velocity spectrum, is thresold velocity, and d is draft.
2.4.7. RAO
Response Amplitude Operator (RAO), often known as the Transfer Function, is the relationship between the amplitude of the ship’s response and the amplitude of the ocean wave. RAO is the transfer function due to waves hitting the hull structure in a specific frequency range. Through numerical simulation, RAO is used to predict the response of ship movements such as Surge, Sway, Heave, Roll, Pitch, and Yaw [40]. The form of the RAO equation is defined in Equation (21).
where is Movement response amplitude and is wave amplitude.
2.5. MADM (Multi Attribute Decision Making)
Multi-attribute decision making (MADM) is a method of making decisions from several available alternatives related to limited attributes or criteria [41]. The simple additive weighting method (SAW) is one of the MADM methods that is used for simple weighting; the simplicity of SAW makes it very popular among practitioners [42]. The basic concept of the SAW method is to find the weighted sum of the performance ratings for each alternative on all attributes. The SAW method requires normalizing the decision matrix (X) to a scale that can be compared with all existing alternative ratings. The normalization of the decision matrix is defined in Equation (22). Then, the preference value on each alternative is caluclated using Equation (23).
V is the preference value, w is the weight of the criteria, and r is the normalized alternative value.
3. Research Methodology
The methods that we used in the research included data collection, data processing, and data simulation. We began the data collection by looking for references to patrol boats that suited our needs. Then, we created a 3D model of the patrol boat using the Maxsurf Modeler software according to the five selected reference ships. After we obtained the primary data of the reference ship, we performed data processing using the regression approach. We performed a regression analysis to produce a new main data ship according to the design needs. We then modeled three variations in the shape of the ship’s hull using the Maxsurf Modeler software according to the primary data of the vessel from the regression results. Then, from the five reference ship models, we selected the three ship models that had the lowest resistance. We then scaled the models with the help of Maxsurf Modeler software. This resulted in eleven patrol boat hull models (three regression ships, three scaled ships, and five reference ships). We then analysed the models using the Maxsurf Entreprise V8i software. In this study, we neglected the effects of the type of propulsion and the hull construction. We expected to be able to use the analysis results to evaluate the hull design method based on its hydrodynamic characteristics. The hydrodynamic characteristics included the ship’s total resistance, stability, and seakeeping performance values. To evaluate the best design alternatives, we used a simple weighting method in multi-attribute decision making (MADM).
3.1. Primary Dimensions of Patrol Boat
In the ship-design stage, we created the hull’s shape after determining the ship’s main dimensions [15]. In this study, we used the primary data collection of patrol boats with a deadweight tonnage (DWT) between 2 and 3.5 tons as the reference ship. We selected the V-hull, which is often used on fast boats and has minor resistance. We present the selected reference ships in Table 1.
After we obtained the primary data of the ships, we continued with the three-dimensional modelling process. We began the design process by creating line plans to determine the shapes of the vessels. Then, we defined the lines, surfaces, and volumes according to their main dimensions. We present the three-dimensional designs of the reference ships in Figure 5, and the line plan of these hulls, in Appendix A.
3.2. Design Variations
Out of the five reference ships that we determined, we proceeded to find the primary data for the design of the new patrol boat. We obtained the preliminary data using a linear regression approach. After we generated the primary data for the new ship, we conducted hull modeling. We began the modeling by creating a ship’s line plan to determine the shape of the hull and obtained three variations. Then, in the scale method, we selected the three best reference ship designs with the slightest resistance values, to be scaled according to the primary data from the regression results. As a result, we analysed eleven variations of the hull design of the patrol boats.
3.2.1. Regression Method
In the ship design, we used regression analysis to find the main data of the new design following the predetermined DWT target. We obtained the main data by looking at the relationship between the causal variables in the form of the DWT and the effect variables in the form of the length (L), beam (B), and draft (D) [11]. We used linear regression following the mathematical model presented in Equation (1). The relationship is presented in the form of a straight-line curve, which approximates the cause-and-effect variables. We present graphs of the regression results from the main data of the reference ship in Figure 6.
From the results of the linear regression analysis, we used a straight-line equation to identify the variables resulting from the predetermined causal variables. In this case, we specified 2.6 tons as the target DWT. Then, we looked for the value of the Y variable according to the straight-line equation in the graph in Figure 6. We present the results of the calculation of the main dimensions of the new design in Table 2.
From the newly obtained dimensional data, we then performed the three-dimensional modelling variations and obtained three designs of the patrol boats with the same dimensions but different hull shapes, as shown in Figure 7. We present the details of the data from the three regression results in Table 3.
3.2.2. Scale Method
We then used the new dimensions of the patrol boat design that we obtained from the regression results as the basis for the size used in the scale method. We analysed the resistance from the five selected carriers to select three ships with the lowest total resistances. We used resistance analysis because it has a simple form and faster data-processing abilities. We used the Savitsky method as the analytical method; researchers often use this method on fast boats [25]. We present the results of the resistance analysis on the reference ships in Table 4 and in the graphs in Figure 8.
According to the results of the resistance analysis, the reference ships with the slightest resistances were the Aresa 1300 Sentinel RHIB, high-speed rescue craft, and lightweight rescue craft (13 m). The total resistances of each vessel were 26.59 kN, 18.22 kN, and 21.6 kN, respectively, at Froude number 1.5, while the effective powers required at the value of Fn 1.5 were 507.71 kW, 339.06 kW, and 363.244 kW, respectively. From these data, we selected the Aresa 1300 Sentinel RHIB, high-speed rescue craft, and lightweight rescue craft as the ships to be scaled according to the new dimensions in the regression results. We performed the scaling process with the help of 3D modeller software, without changing the hull’s shape (Cb fixed). We transformed the three hulls into geometric scaling according to the new dimensions of the regression process while maintaining the block coefficients. Thus, the scaling hull had the same shape as the reference ship, but with different dimensions. We present the new design results from the scaling process in Figure 9, and we present the detailed data in Table 5.
3.3. Simulation Analysis
After we completed the design process, we proceeded with a simulation to determine the hydrodynamic characteristics of the hull. The design process resulted in eleven hull models, including three regression hull models with variations in shape, three scaling hull models with variations in shape, and five reference hull models with different main shapes and dimensions. We simulated the eleven ship models with Maxsurf software.
We analysed the ship resistance using Maxsurf Resistance with the Savitsky method. We used Froude numbers (Fn) between 0 and 3, with an interval of 0.5 at each level. We present the simulation results as a graph of the relationship between the ship’s resistance and Fn and the power required by the boat. With this simulation, we aimed to determine the design with the slightest resistance and lowest power.
We analysed the ship stability using Maxsurf Stability, with a heel angle ranging from 0 to 180°. We used the large-angle stability with a free trim load case. We selected the water conditions according to the data of WMO sea state 4 (moderate water), with a wave height of 1.875 m. The simulation results produced static stability values of the ships in the form of GZ (righting lever) curves. With this simulation, we aimed to determine the ship model with the best stability based on the existing model variations.
We analysed the ship motion using Maxsurf Motion with the strip theory method. We used 90° (beam sea), 135° (bow quartering), and 180° (head sea) as the variations in the angle of incidence of the waves, and we used 10, 20, and 30 knots as the speeds of the ship. We used JONSWAP spectra as the wave spectrum, with a wave height of 1.875 m. We present the simulation results as graphs of the ship’s heaving, pitching, rolling, MSI, and probabilities of slamming and deck wetness. With this simulation, we aimed to determine the response of the ship’s movements to specific water conditions.
After we completed the simulation, we performed statistical calculations to compare the simulation results between the three ship modeling methods. One way to evaluate design alternatives is to use the simple additive weighting (SAW) method, which is part of the MADM method. This calculation aims to analyse the most efficient method that can be used for the ship hull manufacturing process.
4. Data Results
We analysed all the patrol boat hull models that we modelled with the three various methods using Maxsurf software. We compared the results of the analysis of each process with each other. The conditions and parameters were the same in each simulation so that the comparison of the simulation data represented each method. We present the analysis results of the ship’s hull simulation in the following sections.
4.1. Analysis of Regression Method vs. Scaling Method
We developed the regression and scaling methods to determine the shapes of the ship’s hulls. In this study, we compared the simulation results of the three models of patrol boat hulls and the regression results with the three models of the scaled hulls. We simulated the six hull models with Maxsurf software using the following criteria: resistance, stability, seakeeping, MSI, deck wetness, and slamming.
4.1.1. Resistance in Regression Method vs. Scaling Method
The resistance value of a ship when moving on water will increase along with the vessel’s speed when moving. Predicting the total resistance of the boat is important when designing a ship [20], and when calculating the ship resistance using the Savitsky method with the help of Maxsurf software. Researchers often use this method on fast boats with prismatic hull shapes [25]. We calculated the amount of resistance by Froude numbers ranging from 0 to 3, with multiples of 0.5 in each simulation. We present the simulation results of the ship resistances in Table 6 and Table 7, as well as a graph of the comparison of the Froude number values with the resistance and power in Figure 10.
According to the comparison graph of the simulation results of the ship resistance in the regression method with scaling, the three ships that resulted from the regression method had lower resistances. At the value of Fn = 3, the Regression I model had a resistance of 36.29 kN, and the required power was 1389.25 kW, while the Scale II model had the most significant resistance, with a value of 48 kN, and a required power of 1619.79 kW. According to these data, the higher the Froude number, the higher the resistance and energy required. When the value of Fn is directly proportional to the ship’s speed [27], based on these data, the regression method is more effective in terms of the ship resistance criteria when compared with the scaling method. According to the three regression models, the resistance values tended to be smaller than those of the three scaling models; thus, the power required by the ship to travel on water was also lower.
4.1.2. Stability in Regression Method vs. Scaling Method
We calculated the value of the ship’s stability while it was under the influence of external forces. External forces can be in the form of waves or wind, which cause the vessel to heel [30]. We present the results of the ship stability calculation in the form of a graph showing the GZ (righting lever) curve. The graph represents the relationship between the GZ value and the increase in the ship’s tilt angle. We present the value of the ship stability for each regression and scaling model in Table 8, as well as a graph of the relationship between the GZ value and the increase in the ship’s tilt angle in Figure 11.
In the simulation results of the ship stability, which produced a GZ curve and stability value for each ship model, the maximum GZ value in the Regression II model was 0.587 m, with a maximum slope angle of 41.80°. The Regression II model had a maximum slope of 41.80°; if it exceeds this angle, then the ship will capsize. Of the six models, the Regression I and Scale III models had the best ship slope limit values (44.50°), with maximum GZ values of 0.533 m and 0.478 m, respectively, while the Scale III model had the smallest GZ value (0.478 m).
According to the simulation results of the regression and scale models, the Regression II model had the highest stability because it had a broader curve area under the stability graph compared with the other five models (33.78 m.deg). The three regression models were still superior when compared with the stability of the Scale III model. Thus, in terms of testing the ship’s stability, the regression method is superior to the scaling method.
4.1.3. Seakeeping in Regression Method vs. Scaling Method
In the seakeeping analysis, we aimed to determine the response of the ship’s movements to specific water conditions. We can use the movement response to decide the hull’s shape under certain water conditions so that the ship has good motion when sailing in the ocean. In the seakeeping analysis, we divided the directions of the incidents of the waves into several angles, as shown in Figure 12. In this study, we used 90°, 135°, and 180° as the angles of the incidents of the waves.
We present the results of the seakeeping analysis in the form of graphs of the RAO heaving, pitching, and rolling, with encounter frequencies that contain wave frequencies to determine the number of waves hitting the ship. In addition, the seakeeping analysis also produced the ship’s MSI value and the probabilities of slamming and deck wetness.
Heaving in Regression Method vs. Scaling Method
We present the results from the seakeeping heaving motion simulation in the form of an RAO graph, with an encounter frequency at a ship speed of 30 knots and a wave angle of 90°, in Figure 13.
We present the results of the heaving analysis in the form of the response to the ship’s up-and-down movement at a speed of 30 knots and a wave angle of 90° in Figure 13. The Scale II model had a relatively lower response compared with the other models when the frequency was 3.2 rad/s. According to the graph, the Regression III model had the highest response when compared with the other models when the frequency was 3.2 rad/s, but when the frequency was 9.8 rad/s, the Regression III model had a lower response than the Scale II and III models. However, all the models showed the same trend in terms of the heaving movement. The 90°-direction wave did not experience superposition because it had different initial and peak values from the wave frequency. Thus, the ship was more stable because it did not receive more than one wave at the same time.
Rolling in Regression Method vs. Scaling Method
We present the simulation results of the seakeeping rolling motion analysis in the form of an RAO graph, with an encounter frequency at a wave angle of 90° and a ship speed of 30 knots, in Figure 14. According to the rolling simulation results in the form of left and right swaying movements at a 90° wave-incident angle, almost all the models had the same graph trend as seen in Figure 14. However, the Scale III model was slightly lower than the other models, and so the ship’s response to the waves was relatively smaller. According to the comparison graph between the RAO rolling and RAO wave frequency, no superposition of the waves at the peak frequency occurred, which means that the ship did not simultaneously receive more than one wave, and tended to be more stable.
Pitching in Regression Method vs. Scaling Method
We present the results of the simulation of the seakeeping pitching motion in the form of an RAO graph, with an encounter frequency at a wave angle of 180° and a ship speed of 30 knots, in Figure 15.
In the seakeeping analysis on the pitching motion with a wave-incidence angle of 180° in the regression and scaling methods, the Scale II model had a smaller maximum value compared with the other models, which could be seen when the frequency was 3.9 rad/s (Figure 15), while, at a frequency of 3.9 rad/s, the Regression III model had a higher frequency value. However, all the models had the same graphic trend in terms of the pitching motion. The initial value of the pitching peak had the same frequency as the peak value of the wave frequency. However, during subsequent fluctuations, the peaks of the pitching waves were not superpositioned with the wave frequency. Thus, the ship was relatively more stable because it was not hit by more than one wave at the same time.
MSI in Regression Method vs. Scaling Method
The patrol boat model is designed to transport weapons to monitor Indonesia’s border areas. Armament and ship operations require assistance from crews. Therefore, it is necessary to consider the crew’s comfort level in the design process. In the seakeeping simulation, we calculated the comfort level of the crew and passengers using the motion sickness incidence (MSI) graph [38], which explains how many passengers will experience seasickness. We present the results of the MSI analysis at a ship speed of 30 knots with a wave angle of 135° in Figure 16.
According to the graph, which represents all the regression and scale hull models, from 2% to 5% of passengers will experience seasickness after 2 h of sailing, because this ship was designed as a fast patrol boat and not a passenger ship. Of the six ship models, the Regression II model had the lowest probability of seasickness compared with the other models, but the difference in the data is miniscule. According to the data shown in the MSI chart, all the ship models had the same graphic form. All the hull models passed the MSI 2% and 5% charts, which result in seasickness. However, they did not pass the MSI 10% and 20% charts, and so the crew’s condition was still safe.
Slamming and Deck Wetness in Regression Method vs. Scaling Method
In the seakeeping simulation, the probability of the ship experiencing slamming and deck wetness must be kept as low as possible because they can affect the structure and stability of the vessel when it is traveling on the ocean. We present the results of the slamming and deck wetness analyses in Table 9.
According to the simulation results, the Regression II model had the lowest probability of deck wetness, at 0.073 MII/h (close to 0), while the probability of slamming was 0.426 MII/h. The possibility of deck wetness and slamming was lower than one event per hour. We conducted this analysis at a wave angle of 135° and ship speed of 20 knots.
4.2. Analysis of Regression Method vs. Reference Ship
We conducted a comparison between the regression hull design and reference hull model to determine the regression method’s effectiveness. In this study, we compared the regression results of the three models of patrol boat hulls with the five models of reference ships that we determined. The comparison includes the criteria of the resistance, stability, seakeeping, MSI, and the probability of deck wetness and slamming.
4.2.1. Resistance in Regression Method vs. Reference Ship
The magnitude of the ship’s resistance is directly proportional to the speed of the boat when travelling on water. We performed the calculation of the ship resistance using Maxsurf Resistance software with the Savitsky method. We calculated the value of the ship’s resistance by the Froude number parameter, where the Froude number value is directly proportional to the ship’s speed [24]. The Froude number varied from 0 to 3, with multiples of 0.5 in each simulation. We present the simulation results of the ship resistance and required power in Table 10 and Table 11, respectively. We present a graph comparing the Froude number values with the resistance and power in Figure 17.
We present data on the simulation results of the ship resistance, comparing the regression models and reference ships, in Figure 17. The three regression models had almost the same resistance increase criteria, while the five reference ship models had varying resistance criteria, because the three regression models had the same primary dimensions, while the five reference ship models had different main dimensions. Of the eight ship models at a value of Fn = 3, the Regression I model had the slightest resistance, with a value of 36.29 kN, and the required power was 1389.25 kW. The SMIT patrol boat reference ship model had the most significant resistance at Fn = 3, with a value of 60.09 kN and a required power of 2254.81 kW.
These data show that the higher the speed, the greater the resistance and increased need for ship power. According to the results of these data, the regression models did not always have a lower resistance than the reference ships. We observed this at Fn = 3, when the resistance of the high-speed rescue craft was 37.46 kN, and the required power was 1391.57 kW. The resistance value was lower than the Regression II and III models, with values of 41.63 kN and 39.98 kN, respectively, and powers of 16000.05 kW and 1560.83 kW, respectively. Based on these data, the regression method tends to be more effective than the reference ship model in terms of the ship resistance criteria, because the regression method has variations in the resistance value, which tended to be the same and lower than the overall reference ship model.
4.2.2. Stability in Regression Method vs. Reference Ship
We found that the strength and stability of the ship could be used to obtain the value of the ship’s stability. We obtained the value of the ship’s stability by calculating the ship’s stability under the influence of external forces. We present the results of the ship stability analysis in the form of a graph with the GZ (righting lever) curves. The graph represents the relationship between the GZ value and the increase in the ship’s tilt angle. We present the value of the ship’s stability in each regression model and the reference ship model in Table 12, as well as a graph of the relationship between the GZ value and the increase in the ship’s tilt angle in Figure 18.
According to the simulation results of the ship stability, which produced a GZ curve and stability value for each ship model, the maximum GZ value of the SMIT patrol boat model was 0.737 m, with a whole-tilt angle of 36.4°, which means that the SMIT patrol boat model had a maximum slope of 36.4°; if it exceeds this angle, then the ship will capsize. Of the eight models, the Regression I and FPB (fast police boat) models had the best ship inclination limit values (44.500°), with maximum GZ values of 0.533 m and 0.540 m, respectively. In comparison, the Aresa reference ship model had the smallest GZ value and lowest slope limit, with a GZ of 0.441 m and maximum ship tilt angle of 35.500°.
According to the comparison data from the simulation results of the regression models and reference models, the SMIT patrol boat reference model had the highest stability because it had a wider curve area under the stability graph compared with the other seven models, which was 42.64 m.deg. From the eight models that we compared, the reference ships were not always superior to the regression ships, but they tended to have better stability values, as seen from the area of the curve under the stability graph. Thus, in the testing of the stability of the vessel, the reference ship model was superior to the regression model.
4.2.3. Seakeeping in Regression Method vs. Reference Ship
In the seakeeping analysis, we aimed to determine the response of the ship’s movements to specific water conditions. We can use the responses of these movements as the basis for determining the hull’s shape under certain water conditions so that the ship has good maneuverability and does not interfere with the comfort of the passengers, crew, and equipment safety during sailing. We present the results of the seakeeping analysis in the form of RAO graphs of the heaving, pitching, and rolling, with encounter frequencies that contain wave frequencies to determine the number of waves hitting the ship. In addition, the seakeeping analysis also produced the ship’s MSI value and the probabilities of slamming and deck wetness.
Heaving in Regression Method vs. Reference Ship
We present the results of the seakeeping heaving motion simulation in the form of an RAO graph, with an encounter frequency at a ship speed of 30 knots and a wave angle of 90°, in Figure 19.
We present the heaving analysis results, in terms of a ship’s up-and-down movement response at a speed of 30 knots and wave angle of 90°, in Figure 19. The SMIT patrol boat reference model had a relatively lower response than the other models when the frequency was 3.1 rad./s. According to the graph, the Regression III model had the highest response compared with the other models when the frequency was 3.4 rad/s. However, all the models showed the same trend in terms of the heaving movement. The 90°-direction wave did not experience superposition because it had different initial and peak values from the wave frequency. As seen in Figure 19, the peak wave frequency graph occurred at a frequency of 0.6 rad/s, while the initial peak value of the entire model occurred at a frequency of 0.4 rad/s. Thus, the ship was more stable because it did not receive more than one wave at the same time.
Rolling in Regression Method vs. Reference Ship
We present the simulation results of the seakeeping rolling motion in the form of an RAO graph, with an encounter frequency at a wave angle of 90° and ship speed of 30 knots, in Figure 20.
In the rolling simulation results, in the form of left and right roll movements at a 90° wave-incident angle, almost all the models had the maximum rolling value, and almost all had the same graph trend, as seen in Figure 20. Nevertheless, the Regression II model was slightly lower than the other models. Thus, the ship’s response to the waves was relatively smaller. According to the comparison graph between the RAO rolling and wave frequency, no superposition of the waves at the peak frequency occurred, which is shown in Figure 19, where the peak value of the wave frequency occurs at a frequency of 0.6 rad/s, while, in the RAO, the rolling occurred between a frequency of 1.9 rad/s and 2.7 rad/s. This means that the ship did not simultaneously receive more than one wave, and so the vessel tended to be more stable.
Pitching in Regression Method vs. Reference Ship
We present the results from the simulation of the seakeeping pitching motion in the form of an RAO graph, with an encounter frequency at a wave angle of 180° and ship speed of 30 knots, in Figure 21.
According to the seakeeping analysis of the pitching motion with a wave angle of 180° in the regression and reference models, the lightweight rescue craft (LWRC) reference model had a smaller maximum response value compared with the other models, which could be seen when the frequency was 3.9 rad/s (Figure 21), while, at a frequency of 3.8 rad/s, the Aresa reference model had the most significant maximum response value compared with the other seven models. However, all the models had the same graphic trend in the pitching motion. According to the comparison graph between the RAO pitching and wave frequency, no superposition of the waves at the peak frequency occurred, as shown in Figure 21, where the peak value of the wave frequency occurred at a frequency of 0.6 rad/s, while the RAO pitching occurs between a frequency of 3.6 rad/s and 4.1 rad/s, which means that the ship did not simultaneously receive more than one wave, and so tended to be more stable.
MSI in Regression Method vs. Reference Ship
For the seakeeping simulation, we calculated the comfort level of the crew and passengers using the motion sickness incidence (MSI) graph [38], which explains how many passengers will experience seasickness. We present the results of the MSI analysis at a ship speed of 30 knots and wave angle of 135° in Figure 22.
According to the graph, which shows all the regression hull models and reference ships, from 2% to 5% of passengers will experience seasickness after 2 h of sailing, because this ship was designed as a fast patrol boat and not a passenger ship. Of the eight ship models, the SMIT patrol boat model had the lowest probability of seasickness, but the data difference is miniscule. The Aresa model had the highest case of seasickness, which occurred at an encounter frequency of 3.6 rad/s and a vertical acceleration of 1.5 m/s2. According to the graph presented in Figure 22, the Aresa model is quite different. According to these data, all the ship models had MSI chart trends that tended to be the same. All the hull models passed the MSI 2% and 5% charts, and so 5% of passengers experienced seasickness. However, they did not pass the MSI 10% and 20% charts, and so the condition of the crew and equipment was still safe.
Slamming and Deck Wetness in Regression Method vs. Reference Ship
In the seakeeping simulation, the probability of the ship experiencing slamming and deck wetness needs to remain as low as possible because they can affect the structure and stability of the ship when it is travelling on the ocean. We present the results of the slamming and deck wetness analyses for the regression models and reference ships in Table 13.
According to the simulation results, the FPB reference model had the lowest deck wetness (0.046 MII/h) and slamming (approaching between 0 and 0.371 MII/h) probabilities, which indicates that the probabilities of deck wetness and slamming were lower than one event per hour. The SMIT model had the highest deck wetness and slamming probabilities: 0.426 MII/h and 1.9 MII/h, respectively. We performed this analysis at a wave angle of 135° and ship speed of 20 knots, which were the middle-value parameters of the simulation.
4.3. Analysis of Scaling Method vs. Reference Ship
We conducted a comparison of the scaled hull designs and reference hull models to determine the scaling method’s effectiveness. In this study, we compared three models of patrol boat hulls with five models of reference ships. We included the criteria of the resistance, stability, seakeeping, MSI, and probabilities of deck wetness and slamming in the comparison.
4.3.1. Resistance in Scaling Method vs. Reference Ship
To determine the magnitude of the resistance that occurred on the ships, we performed the calculation with the help of Maxsurf Resistance software using the Savitsky method. The magnitude of the ship’s resistance is directly proportional to the ship’s speed when it is travelling on water. We calculated the value of the ship resistance with the Froude number parameter, where the Froude number value varied from 0 to 3, with multiples of 0.5 in each simulation. We present the simulation results of the ship resistance and required power in Table 14 and Table 15, respectively. We present a graph comparing the Froude number values with the resistance and power in Figure 23.
We present the comparison data from the simulation results of the ship resistance between the scaled models and reference ships in Figure 23. All the models had varying resistance values. However, the pattern of increasing resistance in the scale model still tended to be close because it had the same primary dimensions. The five reference ship models had varying resistance criteria because they had different main dimensions. Of the eight ship models at a value of Fn = 3, the high-speed rescue craft (HSRC) model had the slightest resistance, with a value of 37.46 kN, and the required power was 1391.57 kW. The SMIT patrol boat reference ship model had the largest resistance at Fn = 3, with a value of 60.09 kN and a required power of 2254.81 kW.
These data show that the higher the speed, the greater the resistance and increased need for ship power. According to these data, the scale models did not always have greater or lesser resistances than the reference ships. This could be seen at Fn = 3, when the Scale III model had a resistance of 43.1 and a power of 1435.341 kW. The total resistance value was lower than the SMIT reference model, which had a total resistance of 60.09 kN and power of 2254.81 kW. However, the total resistance was greater than the HSRC reference model, with a total resistance of 37.46 kN and power of 1391.57 kW at Fn = 3.
4.3.2. Stability in Scaling Method vs. Reference Ship
We found that the strengths and stabilities of the ships could be used to obtain the value of their stability. We obtained the value of ship stability by caluclating the ship’s stability under the influence of external forces. We present the results of the ship stability calculation in the form of a graph showing the righting lever (GZ) curves. The graph represents the relationship between the GZ value and the increase in the ship’s tilt angle. We present the value of the ship’s stability in each scaling model and the reference ship model in Table 16, as well as a graph of the relationship between the GZ value and the increase in the ship’s tilt angle in Figure 24.
According to the simulation results of the ship stability, which produced a GZ curve and stability value for each ship model, the maximum GZ value for the SMIT patrol boat model was 0.737 m, with a maximum tilt angle of 36.4°, which means that the SMIT patrol boat model had a maximum slope of 36.4°. If it exceeds this angle, then the ship will capsize. Of the eight models analysed, the Scale III and fast police boat (FPB) models had the best boat slope limit values (44.5°), with maximum GZ values of 0.478 m and 0.54 m, respectively. The Aresa reference ship model had the smallest GZ value and lowest slope limit, with a GZ of 0.441 m and a maximum ship tilt angle of 35.5°.
According to the comparison data from the simulation results of the scale models and reference models, the SMIT patrol boat reference model had the highest stability because it had a broader curve area under the stability graph compared with the other seven models, which was 42.64 m.deg. Out of the eight models that we compared, the reference ships were not always superior to the scaled ships, but they tended to have better stability values, as seen from the area of the curve under the stability graph.
4.3.3. Seakeeping in Scaling Method vs. Reference Ship
In the seakeeping analysis, we aimed to obtain the appropriate hull shape based on the response of the ship’s movement to specific water conditions to determine the shape of the hull that provides comfort for the passengers, crew, and equipment safety during sailing. We present the results of the seakeeping analysis in the form of RAO graphs of the heaving, pitching, and rolling, with encounter frequencies that contain wave frequencies to determine the number of waves hitting the ship. In addition, the seakeeping analysis also produced the MSI values of the ships and probabilities of slamming and deck wetness.
Heaving in Scaling Method vs. Reference Ship
We present the results from the seakeeping heaving-motion simulation in the form of an RAO graph, with an encounter frequency at a ship speed of 30 knots and wave angle of 90°, in Figure 25.
We present the results of the seakeeping heaving motion analysis in the form of a response to the up-and-down movement of the ship at a speed of 30 knots and wave angle of 90° in Figure 25. The SMIT patrol boat reference ship model had a lower response than the other models when the frequency was 3.1 rad/s. According to the graph, the Scale III model had the highest response compared with the other models when the frequency was 3.42 rad/s. However, all the models showed almost the same trend in terms of the heaving movement. The 90°-direction wave did not experience superposition because it had different initial and peak values from the wave frequency. As seen in Figure 25, the peak wave frequency graph occurred at a frequency of 0.6 rad/s, while the initial peak value of the entire model occurred at a frequency of 0.4 rad/s. Thus, the ship was more stable because it did not receive more than one wave at the same time.
Rolling in Scaling Method vs. Reference Ship
We present the results of the simulation of the seakeeping rolling motion for the scaling and reference ship models in the form of an RAO graph, with an encounter frequency at a wave angle of 90° and ship speed of 30 knots, in Figure 26.
In the rolling simulation results in the form of left and right sway movements at a 90° wave incidence, almost all the models had the maximum rolling value, and we can see virtually the same graph trend in Figure 26. However, in Model III, the scaling was slightly lower than the other models when encountering a frequency of 1.89 rad/s. Thus, the ship’s response to the waves was relatively smaller. According to the comparison graph between the RAO rolling and wave frequency, no superposition of the waves at the peak frequency occurred, as shown in Figure 26, where the peak value of the wave frequency occurs at a frequency of 0.6 rad/s, while in the RAO rolling, the peak frequency occurs between 1.89 rad/s and 2.7 rad/s, which means that the ship did not simultaneously receive more than one wave, and so tended to be more stable.
Pitching in Scaling Method vs. Reference Ship
We present the results of the simulation of the seakeeping pitching motion for the scale and reference ship models in the form of an RAO graph, with the encounter frequency at a wave angle of 180° and ship speed of 30 knots, in Figure 27.
According to the results of the seakeeping analysis on the pitching motion with the wave angle of 180° for the scaling and reference models, the lightweight rescue craft (LWRC) reference model had a smaller maximum response value compared with the other models (Figure 27) when the frequency was 3.9 rad/s. The Aresa reference model had the most significant maximum response value compared with the other seven models at a frequency of 3.8 rad/s. However, all the models have the same graphic trend in terms of the pitching motion. According to the comparison graph between the RAO pitching and wave frequency, no superposition of the waves at the peak frequency occurred, as shown in Figure 27, where the peak value of the wave frequency occurs at a frequency of 0.6 rad/s, while the peak of the RAO pitching occurs between a frequency of 3.6 rad/s and 4.1 rad/s, which means that the ship did not simultaneously receive more than one wave, and so tended to be more stable.
MSI in Scaling Method vs. Reference Ship
In the seakeeping simulation, we calculated the comfort level of the crew and passengers using the motion sickness incidence (MSI) graph, which explains how many passengers will experience seasickness. We present the results of the MSI analysis on the scaling and reference models for a ship speed of 30 knots and wave angle of 135° in Figure 28.
According to the MSI analysis presented in Figure 28, which presents all the hull scaling models and reference ships, as many as from 2% to 5% of the passengers experienced seasickness after 2 h of sailing, because this ship was designed as a fast patrol boat and not a passenger ship. Of the eight ship models, the SMIT patrol boat model had the lowest probability of seasickness, but the data difference is miniscule. The Aresa model had the highest case of seasickness, which occurred at an encounter frequency of 3.6 rad/s and a vertical acceleration of 1.5 m/s2. As we can see from the graph presented in Figure 28, there is an obvious difference in the Aresa model. According to these data, the MSI chart trends of all the ship models tended to be the same. All the hull models passed the MSI 2% and 5% charts, and so 5% of the passengers experienced seasickness. However, they did not pass the MSI 10% and 20% charts, and so the crew and equipment conditions remained safe.
Slamming and Deck Wetness in Scaling Method vs. Reference Ship
In the seakeeping simulation, we kept the probabilities of the ship experiencing slamming and deck wetness as low as possible because they can affect the structure and stability of the ship when it is traveling on the ocean. We present the results of the slamming and deck wetness analyses for the regression models and reference ships in Table 17.
According to the results of the MSI analysis, the fast police boat (FPB) reference model had the lowest deck wetness (0.046 MII/h) and slamming (approaching between 0 and 0.371 MII/h) probabilities, which means that the probabilities of deck wetness and slamming were lower than one event per hour. The SMIT model had the highest deck wetness and slamming probabilities at 0.426 MII/h and 1.9 MII/h, respectively, which means that its probabilities of slamming or deck wetness were more than one event per hour, and so this ship tended to be less safe. We performed this analysis at a wave angle of 135° and ship speed of 20 knots, which were the middle-value parameters of the simulation.
5. Overall Discussion
We performed simulation analyses of all the patrol boat models from the three methods. Each method has advantages and disadvantages based on the criteria of resistance, stability, and seakeeping. Further analysis is required to determine the level of efficiency of each method. We present a description of the study of each model in all the methods in the following sections.
5.1. Simulation Result Recapitulation
To determine each method’s effectiveness level, we needed to compare the simulation results of the models. The following is a recapitulation of the simulation results for each model in all the analysed methods.
5.1.1. Resistance Analysis Recapitulation
The resistance simulation produced data on the resistance and power required for each model. Each method has varying resistance and power values. We needed to calculate the similarity percentages to determine the level of variation in the results of the ship resistance analysis to determine which method was more effective. We present the results of the recapitulation of the resistance analysis for each model in Table 18. We present the similarity percentages of the resistance between the regression and reference vessels in Table 19, and between the scale and reference vessels in Table 20. We present the colour indicators in Table 21.
Based on the data recapitulation of the resistance simulation results presented in Table 18, we performed calculations to determine the resistance similarity percentages in the regression and scaling models with the reference-ship models that became the design reference. In Table 19, the rate of the similarity between the regression models and reference ships has a maximum value of up to 99.474%, a minimum value of 60.393%, and an average similarity of 82.324%. Based on the colour indicators in Table 21, the regression method has 86.667% resistance values between the models, which are lower than the reference models. Meanwhile, in the scaling method, the similarity between the scaling and reference ship models has a maximum value of 97.291%, a minimum value of 71.726%, and an average similarity of 85.084%. Based on the colour indicators in Table 21, the scaling method has 46.667% resistance values between the models, which are lower than the reference models. Thus, the resistance criteria regression method is superior to the scaling model, with maximum similarities of 99.474% and 86.667% for the model, and with lower resistance than the reference ships.
5.1.2. Stability Analysis Recapitulation
The stability simulation produced stability value data for each model. Each method had various stability values. We needed to analyse the rate of the similarity to determine the level of variation in the results of the ship stability analysis to determine a more efficient method to be applied. We present the recapitulation of the stability analysis for each model in Table 22. We present the percentages of the similarity stability between the regression methods and reference ships in Table 23, and between the scale methods and reference ships in Table 24. We present the colour indicators in Table 25.
Based on the data recapitulation of the stability simulation results presented in Table 22, we then performed calculations to determine the rate of the similarity of the main parameters of the stability value of the regression and scaling models with the reference ship model as the design reference. In Table 23, the percentages of the similarity between the regression models and reference ship have a maximum value of up to 96.741%, a minimum value of 62.359%, and an average similarity of 83.528%. Based on the colour indicators in Table 25, the regression model has a stability value of 33.334%. The model has a better stability value than the reference ships.
While the percentages of the similarity between the scaling and reference ship models have a maximum value of 99.841%, a minimum value of 62.312%, and an average similarity of 84%, based on the colour indicators in Table 25, the scaling method has a stability value of 26.667%, and the model has a better stability value than the reference ship. In terms of the stability criteria, the scaling method has a similarity percentage that is superior to the regression model, with a maximum similarity of 99.841%. However, the reference vessels are still ideal for both these methods. The regression model is superior to the models with better stability, with 33.334%, while the scaling model is 26.667%.
5.1.3. Seakeeping Analysis Recapitulation
The seakeeping simulation produced data on the ship’s motion in each model under specific water conditions. Each method had a somewhat varied seakeeping value. We needed to analyse the rate of similarity to determine the level of variation from the results of the ship’s seakeeping analysis to determine which method would be more effective. We present the results of the recapitulation of the seakeeping analysis for each model in Table 26. We present the similarity percentages of the seakeeping results between the regression methods and reference ships in Table 27, and between the scale methods and reference ships in Table 28, with the colour indicators presented in Table 29.
Based on the recapitulation of the seakeeping simulation data presented in Table 26, we performed calculations to determine the rate of the similarity of the main parameters of the seakeeping analysis value for the regression and scaling models with the reference ship models as the design reference. In Table 27, the percentages of the similarity between the regression models and reference ships have a maximum value of up to 99.997% for the heaving motion criterion, 99.961% for the rolling motion criterion, and 99.422% for the pitching motion criterion. The minimum similarity value is 99.959% for the heaving motion criterion, 97.501% for the rolling motion criterion, and 84.270% for the pitching motion criterion. The average similarity values were 99.983% for the heaving motion criterion, 98.889% for the rolling motion criterion, and 91,881% for the pitching motion criterion. Based on the colour indicators in Table 28, the regression model has a seakeeping value in the form of a ship movement response that is 57.778% lower than the reference ships.
The rate-of-similarity seakeeping analysis between the scaling and reference ship models had a maximum value of 100.00% for the heaving-motion criterion, 99.878% for the rolling motion criterion, and 98.490% for the pitching-motion criterion. The minimum similarity value is 99.942% for the heaving-motion criterion, 97.358% for the rolling motion criterion, and 74.337% for the pitching-motion criterion. Based on the colour indicators in Table 29, the scaling models had seakeeping values in the form of ship movement responses that were comparable to the reference ships.
In terms of the seakeeping criteria, the regression methods have similarity percentages that are superior to the rolling and pitching compared with the scale models, with maximum similarities of 99.961% for the rolling motion and 99.422% for the pitching motion. However, the scaling method is superior in terms of the heaving-motion criterion, with a maximum similarity of 100% to the reference ships. However, the regression model is excellent, with a total of 57.778%. The model has a lower seakeeping movement response than the reference ships. Each method shows varying results regarding the similarity of the hydrodynamic analysis. However, the percentage of the similarity for each criterion is still above 60%, and so the two methods have results that are not too different. We present a summary of the similarity of the hydrodynamic analysis of each method in Table 30.
According to Table 30, the regression and scaling methods have advantages and disadvantages for each criterion. At the maximum similarity rate, the regression and scale methods with the reference ship have a similarity percentage above 96% for all the requirements. For the percentages of the similarity of the resistance and seakeeping, the regression method is superior to the scale method, while, for the stability analysis, the scale method has a higher similarity. However, at the minimum similarity percentage between the two methods, all the criteria still have values above 60%; thus, these two methods have criteria that are close to those of the reference ship, which was the design reference. This was reinforced by the average values of the similarity in the two methods, which were above 82%, as shown in Table 30.
5.2. Multi-Attribute Decision Making (MADM)
Based on the similarity analysis of the hydrodynamic criteria between the regression and scaling methods with the reference ship, we determined the similarity percentages for the hydrodynamic characteristics of the hulls with the methods used. We still required an analysis to select the best model of the used methods. We used the multi-attribute decision-making (MADM) calculation model and the simple additive weighting (SAW) method to obtain the best alternative hull model. In this case, we based the best alternative hull model on the weights of the predetermined hydrodynamic criteria. We present the MADM calculation in the following sections.
5.2.1. Weight of Each Criterion
In the MADM calculation, we based the weights on the hydrodynamic criteria of the hull on the primary needs of the patrol boat. We present the weight of the criterion for each parameter in Table 31.
We present three primary criteria in Table 31: resistance, stability, and seakeeping. Resistance has the most significant weight (50%) because patrol boats require low resistance to move fast, and they require minimal energy when operating in the ocean. The stability weight is 30%, because patrol boats need stability and good maneuverability when conducting patrols. Seakeeping has the lowest weight, which is 20%, because patrol boats have small crews, but must still be a consideration when determining the best hull model. We used these three criteria as the basis for determining the best hull model based on the simulation results. We present the alternative design models of the three methods in Table 32.
5.2.2. Nomination Matrix
Based on the recap data from the simulation results, we formed paired matrices for each model, and we present the criteria in Table 33. In the table, the value of C1 is the total resistance value of the ship when Fn = 3, the value of C2 is the area under the GZ curve, which represents the stability value, and the value of C3 is the average of the heaving, pitching, and rolling, which refers to the seakeeping value of the ship. We used the three central values to determine the best alternative model from all the methods.
5.2.3. Matrix Normalization
5.2.4. Weighting
5.2.5. Ranking
From the weighting results above, we performed the ranking to determine which alternative design models had the highest total values. We based the results of the design model ranking data on the three main hydrodynamic hull criteria, as shown in Table 36.
According to the table, the alternative model A3, the high-speed rescue craft, is the best model based on the primary criteria that we determined, with a total value of 0.939. However, the model with the lowest weight is the A2 model, which is the fast police boat reference ship, with a total value of 0.742. Thus, the reference ship has a less consistent value. As for the three hull models in terms of the regression results (A6, A7, A8), the rankings are 2nd, 3rd, and 4th, respectively, with total weights of 0.904, 0.867, and 0.827, respectively. The three regression models of the hull have higher ranks than all of the scaling models of the hull. The hulls from the scaling models (A9, A10, A11) were ranked 10th, 7th, and 6th, respectively, with total weights of 0.785, 0.799, and 0.801, respectively.
5.3. Estimated Design Time
When designing the hull model, specific processes and stages are needed to realise a hull that has good efficiency. Each method requires specific steps and techniques to create an ideal hull, based on the experience in the lab and the design and computing. We present the details of each method’s process and the estimated time required for each stage in Table 37. According to the data, the process of designing the hull according to the reference ship takes longer than the regression and scaling methods, with an estimated time of 790 min. The regression method is shorter than the other methods, with an estimated time of 565 min. The scaling method takes 720 min, or is 70 min faster, than the reference ship method.
6. Conclusions
In this study, we analysed three hull design methods: the regression method, scaling method, and a reference ship as the design reference. The analysis criteria included the resistance, stability, seakeeping, and estimated time required, while we ignored the influence of the type of propulsion and hull construction. We drew the following conclusions.
In resistance testing, the regression method is superior to the scaling method. The regression method had a maximum similarity percentage of 99.474%, with the reference ship as the reference. The model’s percentage had a lower resistance of 86.667% compared with the reference ship. When testing the ship’s stability, the regression model was superior in terms of the number of models, with better stability than the reference ship, with a percentage of 33.334%. In comparison, the scaling model was 26.667%. In the analysis of seakeeping with the main parameters of heaving, rolling, and pitching, the regression method had a better seakeeping value, with a rate of 57.778%, compared with the reference ship. Thus, in terms of the seakeeping criteria, the regression method is better than the scaling method.
In the multi-attribute decision-making (MADM) analysis, the high-speed rescue craft reference model was the best model based on the criteria of the resistance, stability, and seakeeping, with a total value of 0.939. However, the regression method had more consistent values than the reference and scaling methods. The hull models resulting from the regression had rankings of 2nd, 3rd, and 4th, respectively, with total weights of 0.904, 0.867, and 0.827, respectively.
The regression and scaling methods have respective advantages and disadvantages regarding the criteria of the resistance, stability, and seakeeping performance. Both have similarities above 60%, and that reach 99.8% similarity to the reference ship. Thus, these two methods have nearly the same criteria as the reference ship. However, the regression method has a better number of hydrodynamic criteria and superior similarity. Based on the MADM calculation, the regression method has a more consistent total value than the scaling and reference methods, with a shorter processing time than the other methods (estimated time: 565 min). Thus, the regression method has higher effectiveness than the scaling method.
Author Contributions
Conceptualization, S.-J.B., T.M. and A.R.P.; methodology, A.R.P., N.M. and T.T.; software, T.R. and T.T.; validation, A.R.P. and T.R.; formal analysis, T.R., A.R.P., T.T. and N.M.; writing—original draft preparation, T.R., A.R.P., T.M. and T.T.; writing—review and editing, A.R.P., S.-J.B. and T.M.; visualization, T.R. and T.T.; supervision, T.M., N.M. and A.R.P.; project administration, A.R.P. and N.M.; funding acquisition, A.R.P. All authors have read and agreed to the published version of the manuscript.
Funding
This research received no external funding.
Institutional Review Board Statement
Not applicable.
Informed Consent Statement
Not applicable.
Data Availability Statement
Not applicable.
Conflicts of Interest
The authors declare no conflict of interest.
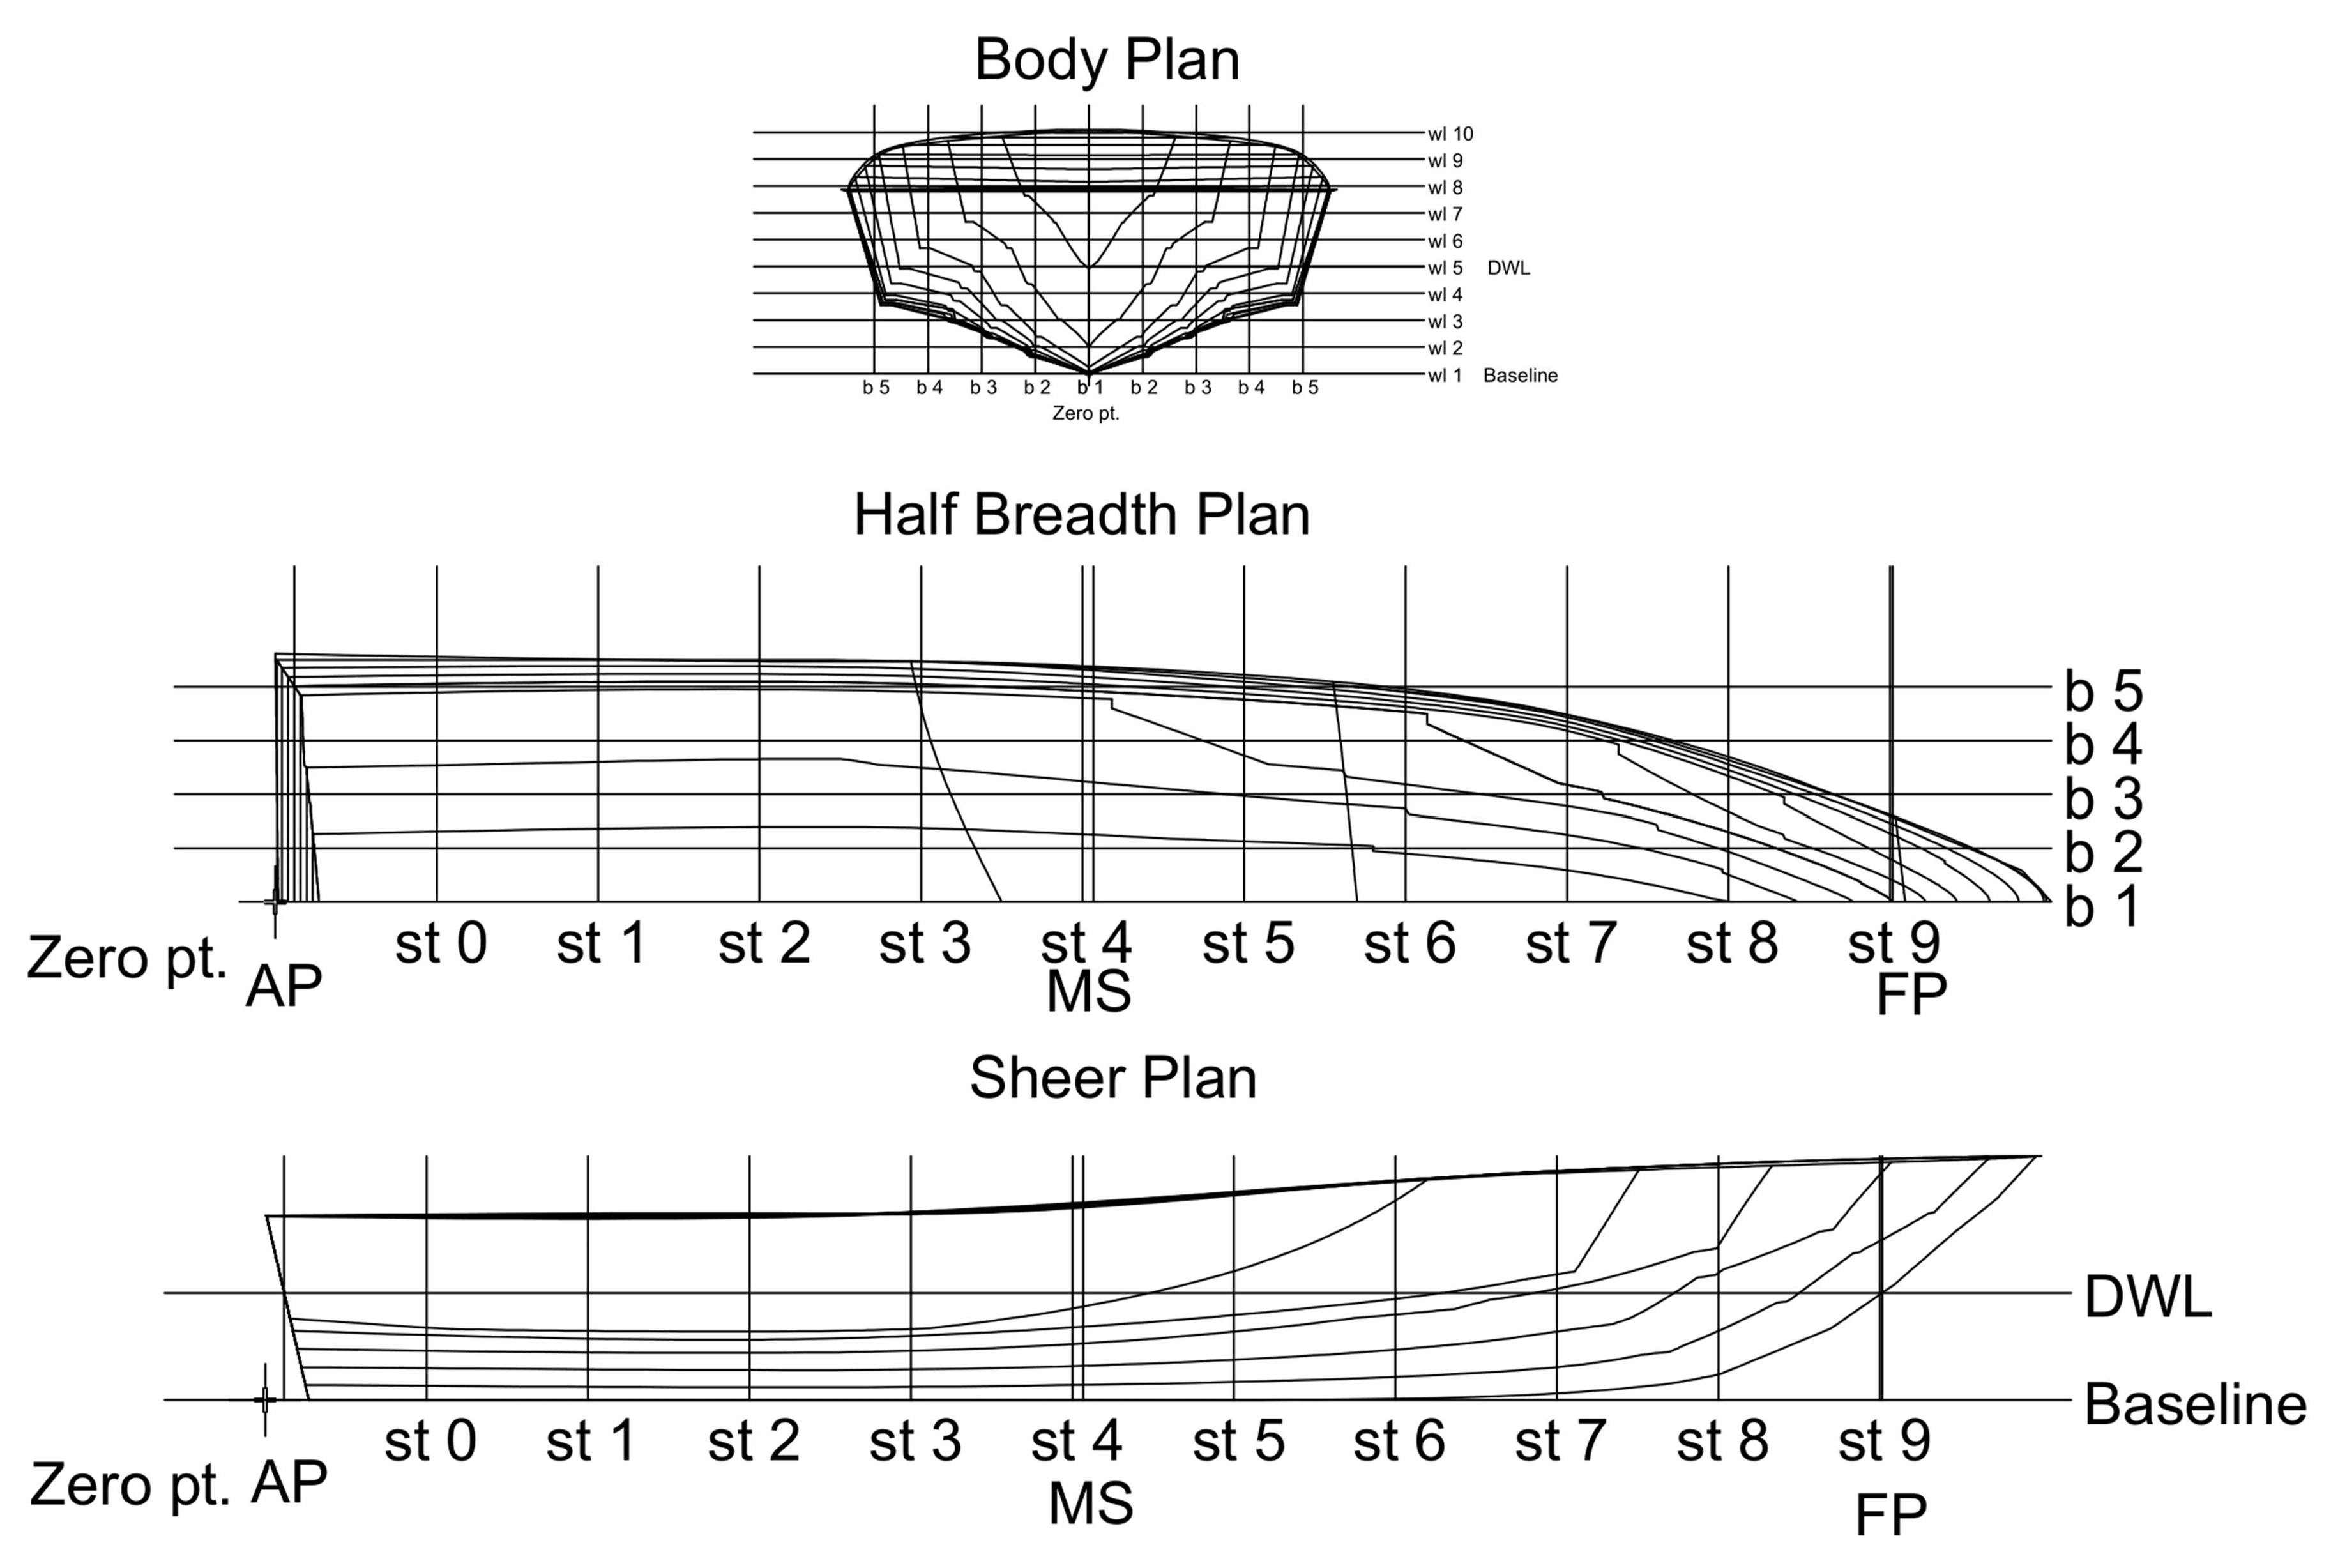
Appendix A. Lines Plan of the Reference Ships
Figure A1.
High Speed Rescue Craft 12 m.
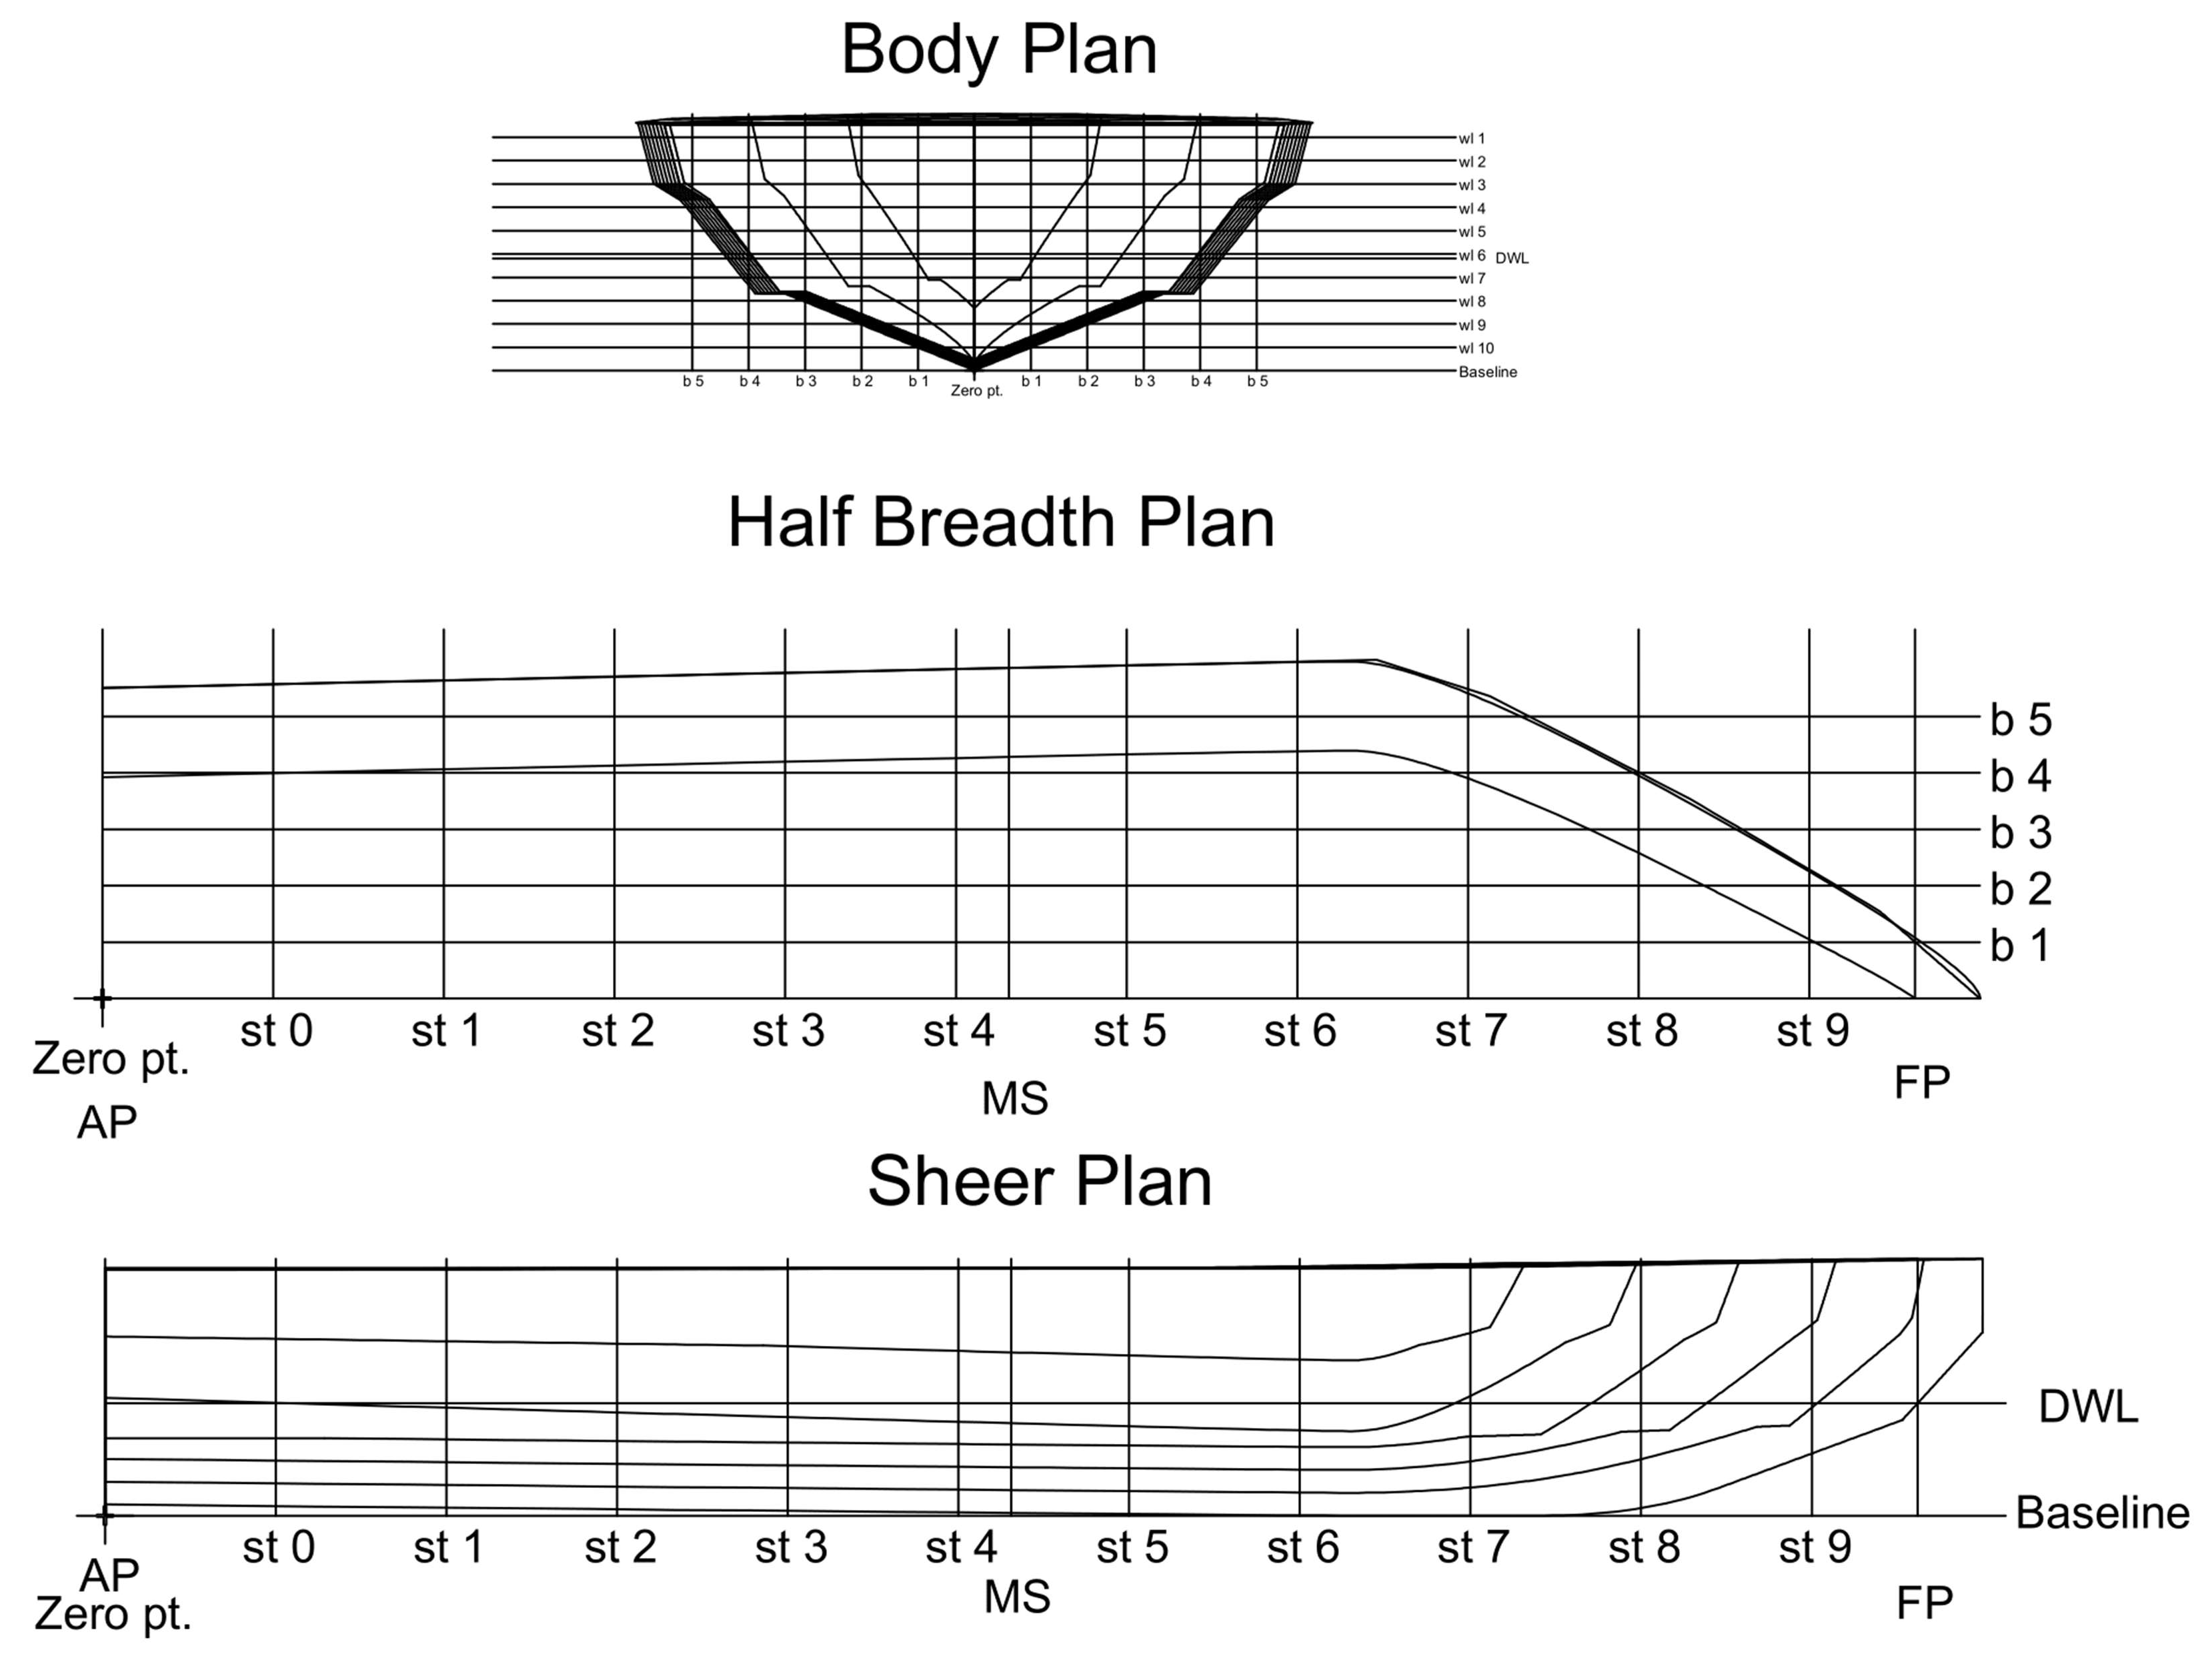
Figure A2.
SMIT Patrol Boat.

Figure A3.
Light Weight Rescue Craft 13 m.
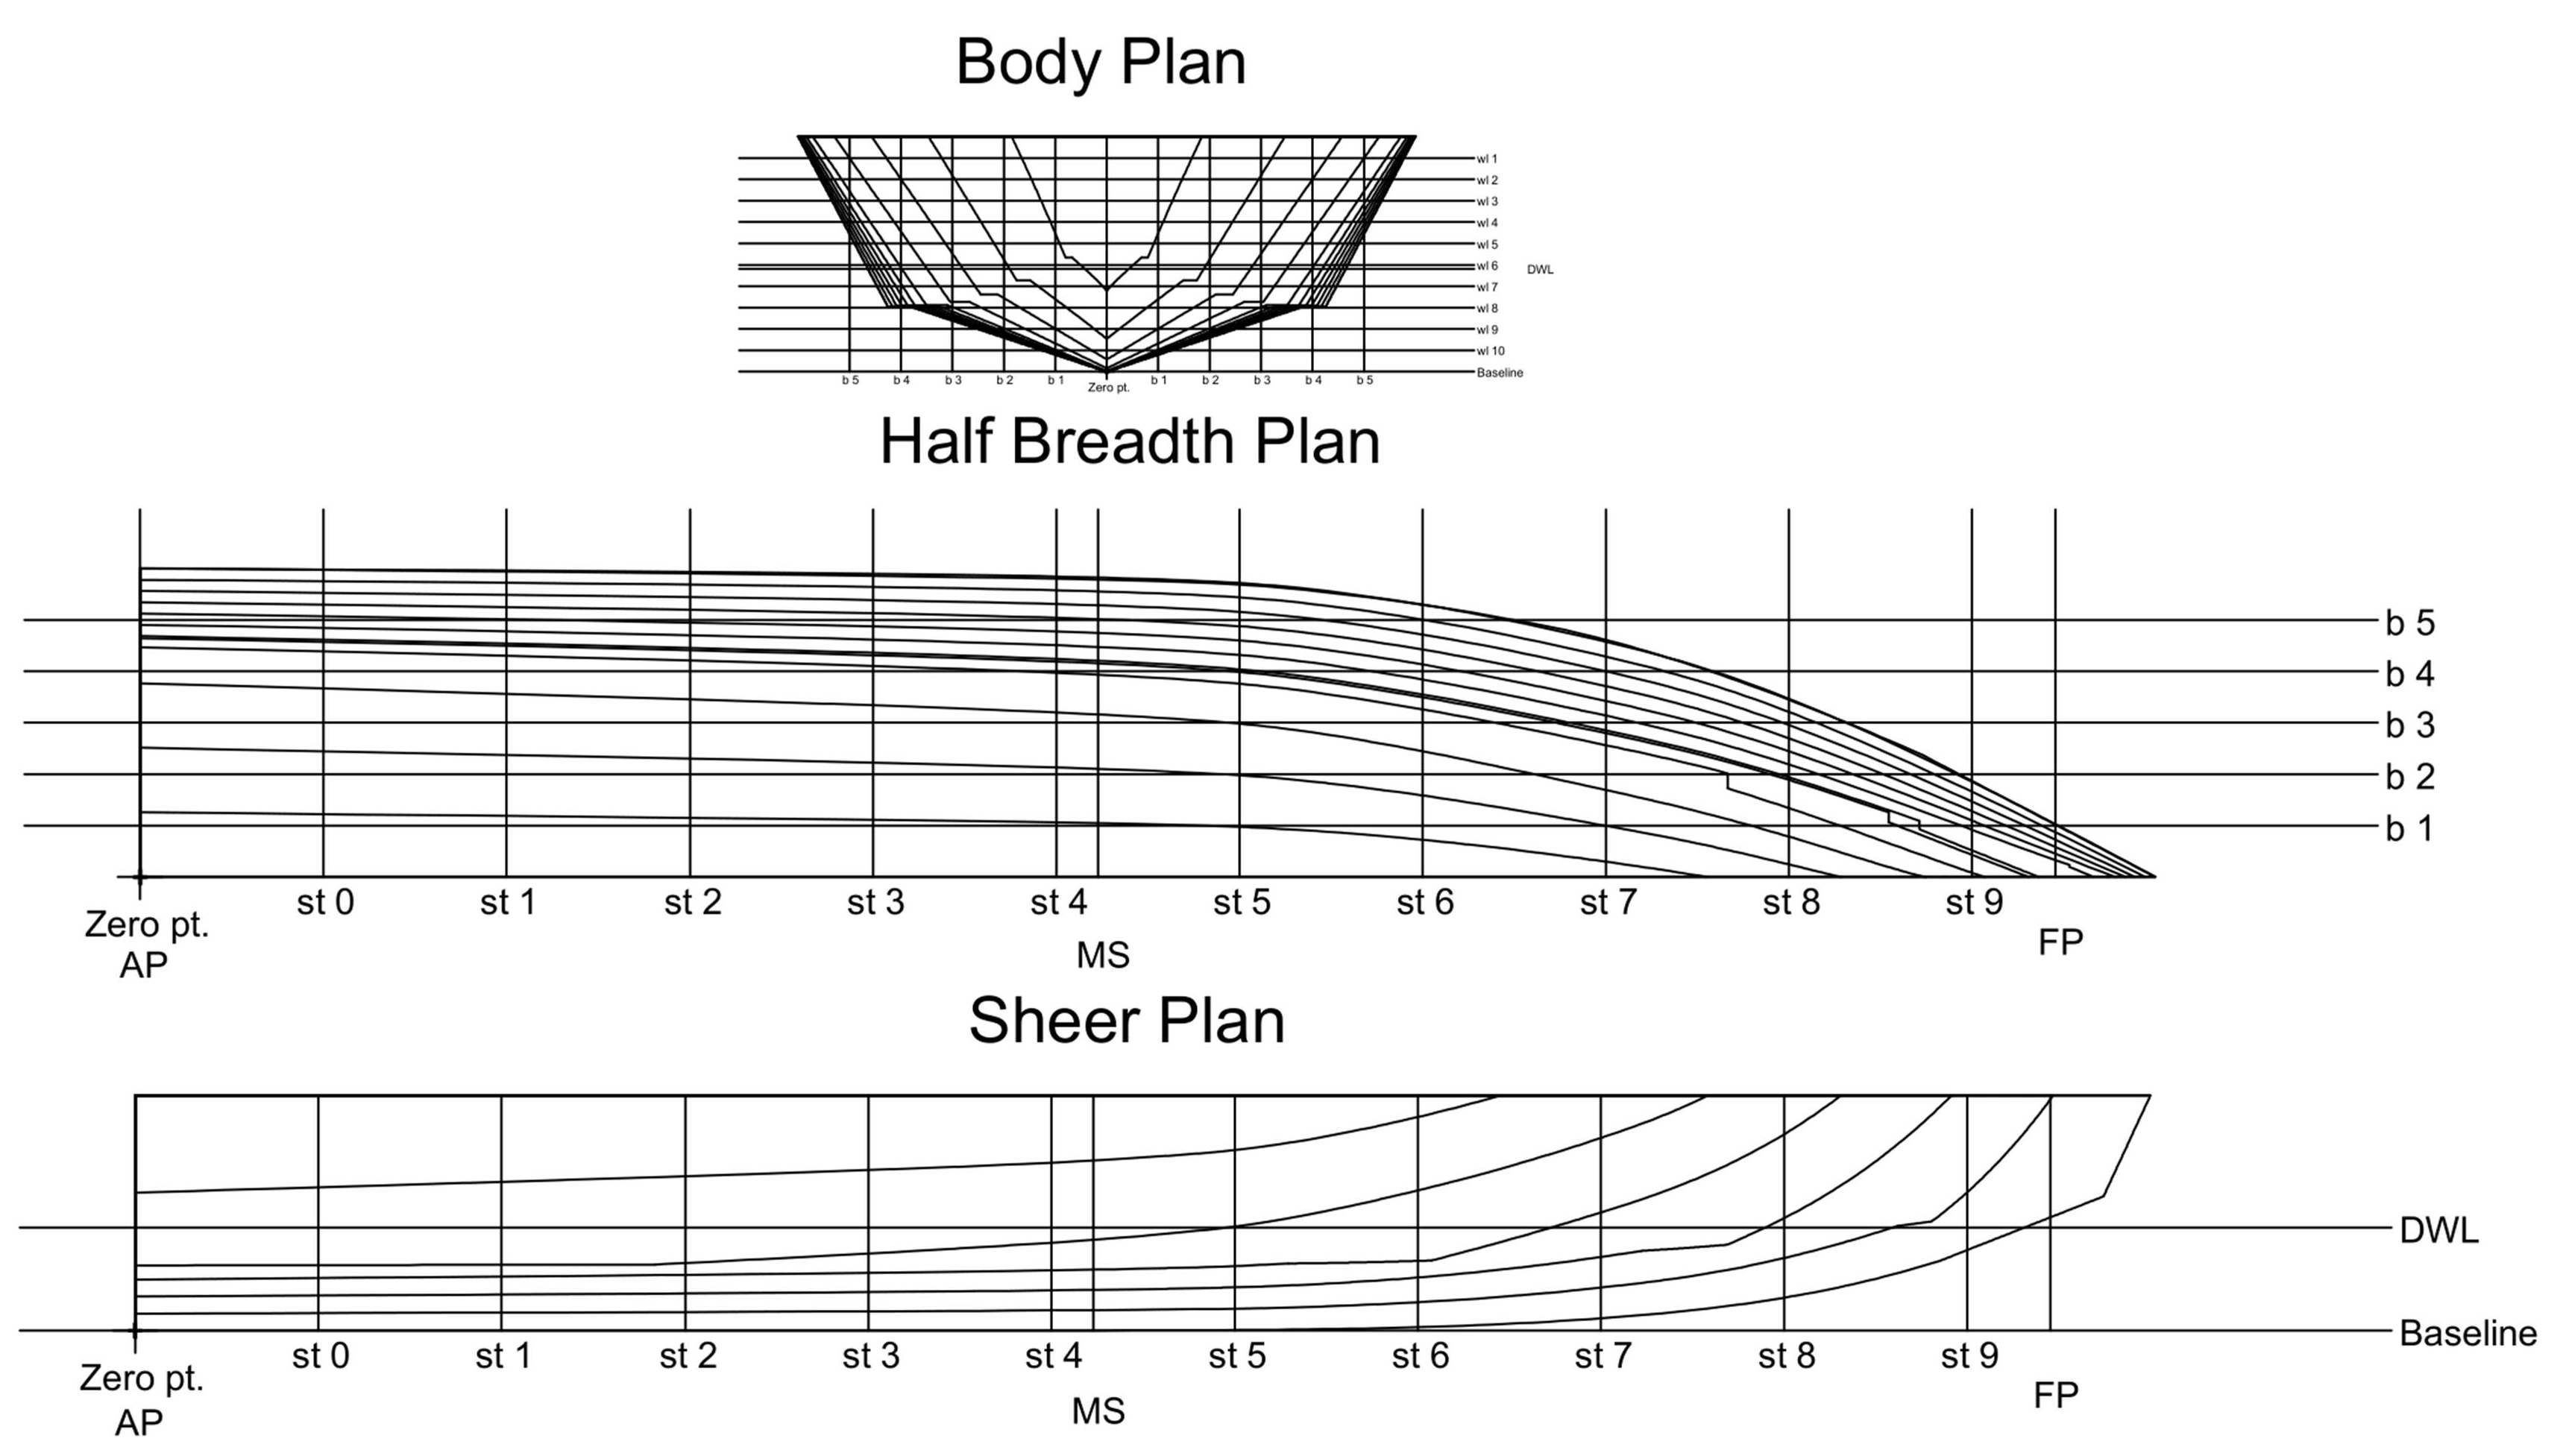
Figure A4.
Fast Police Boat 15 m.
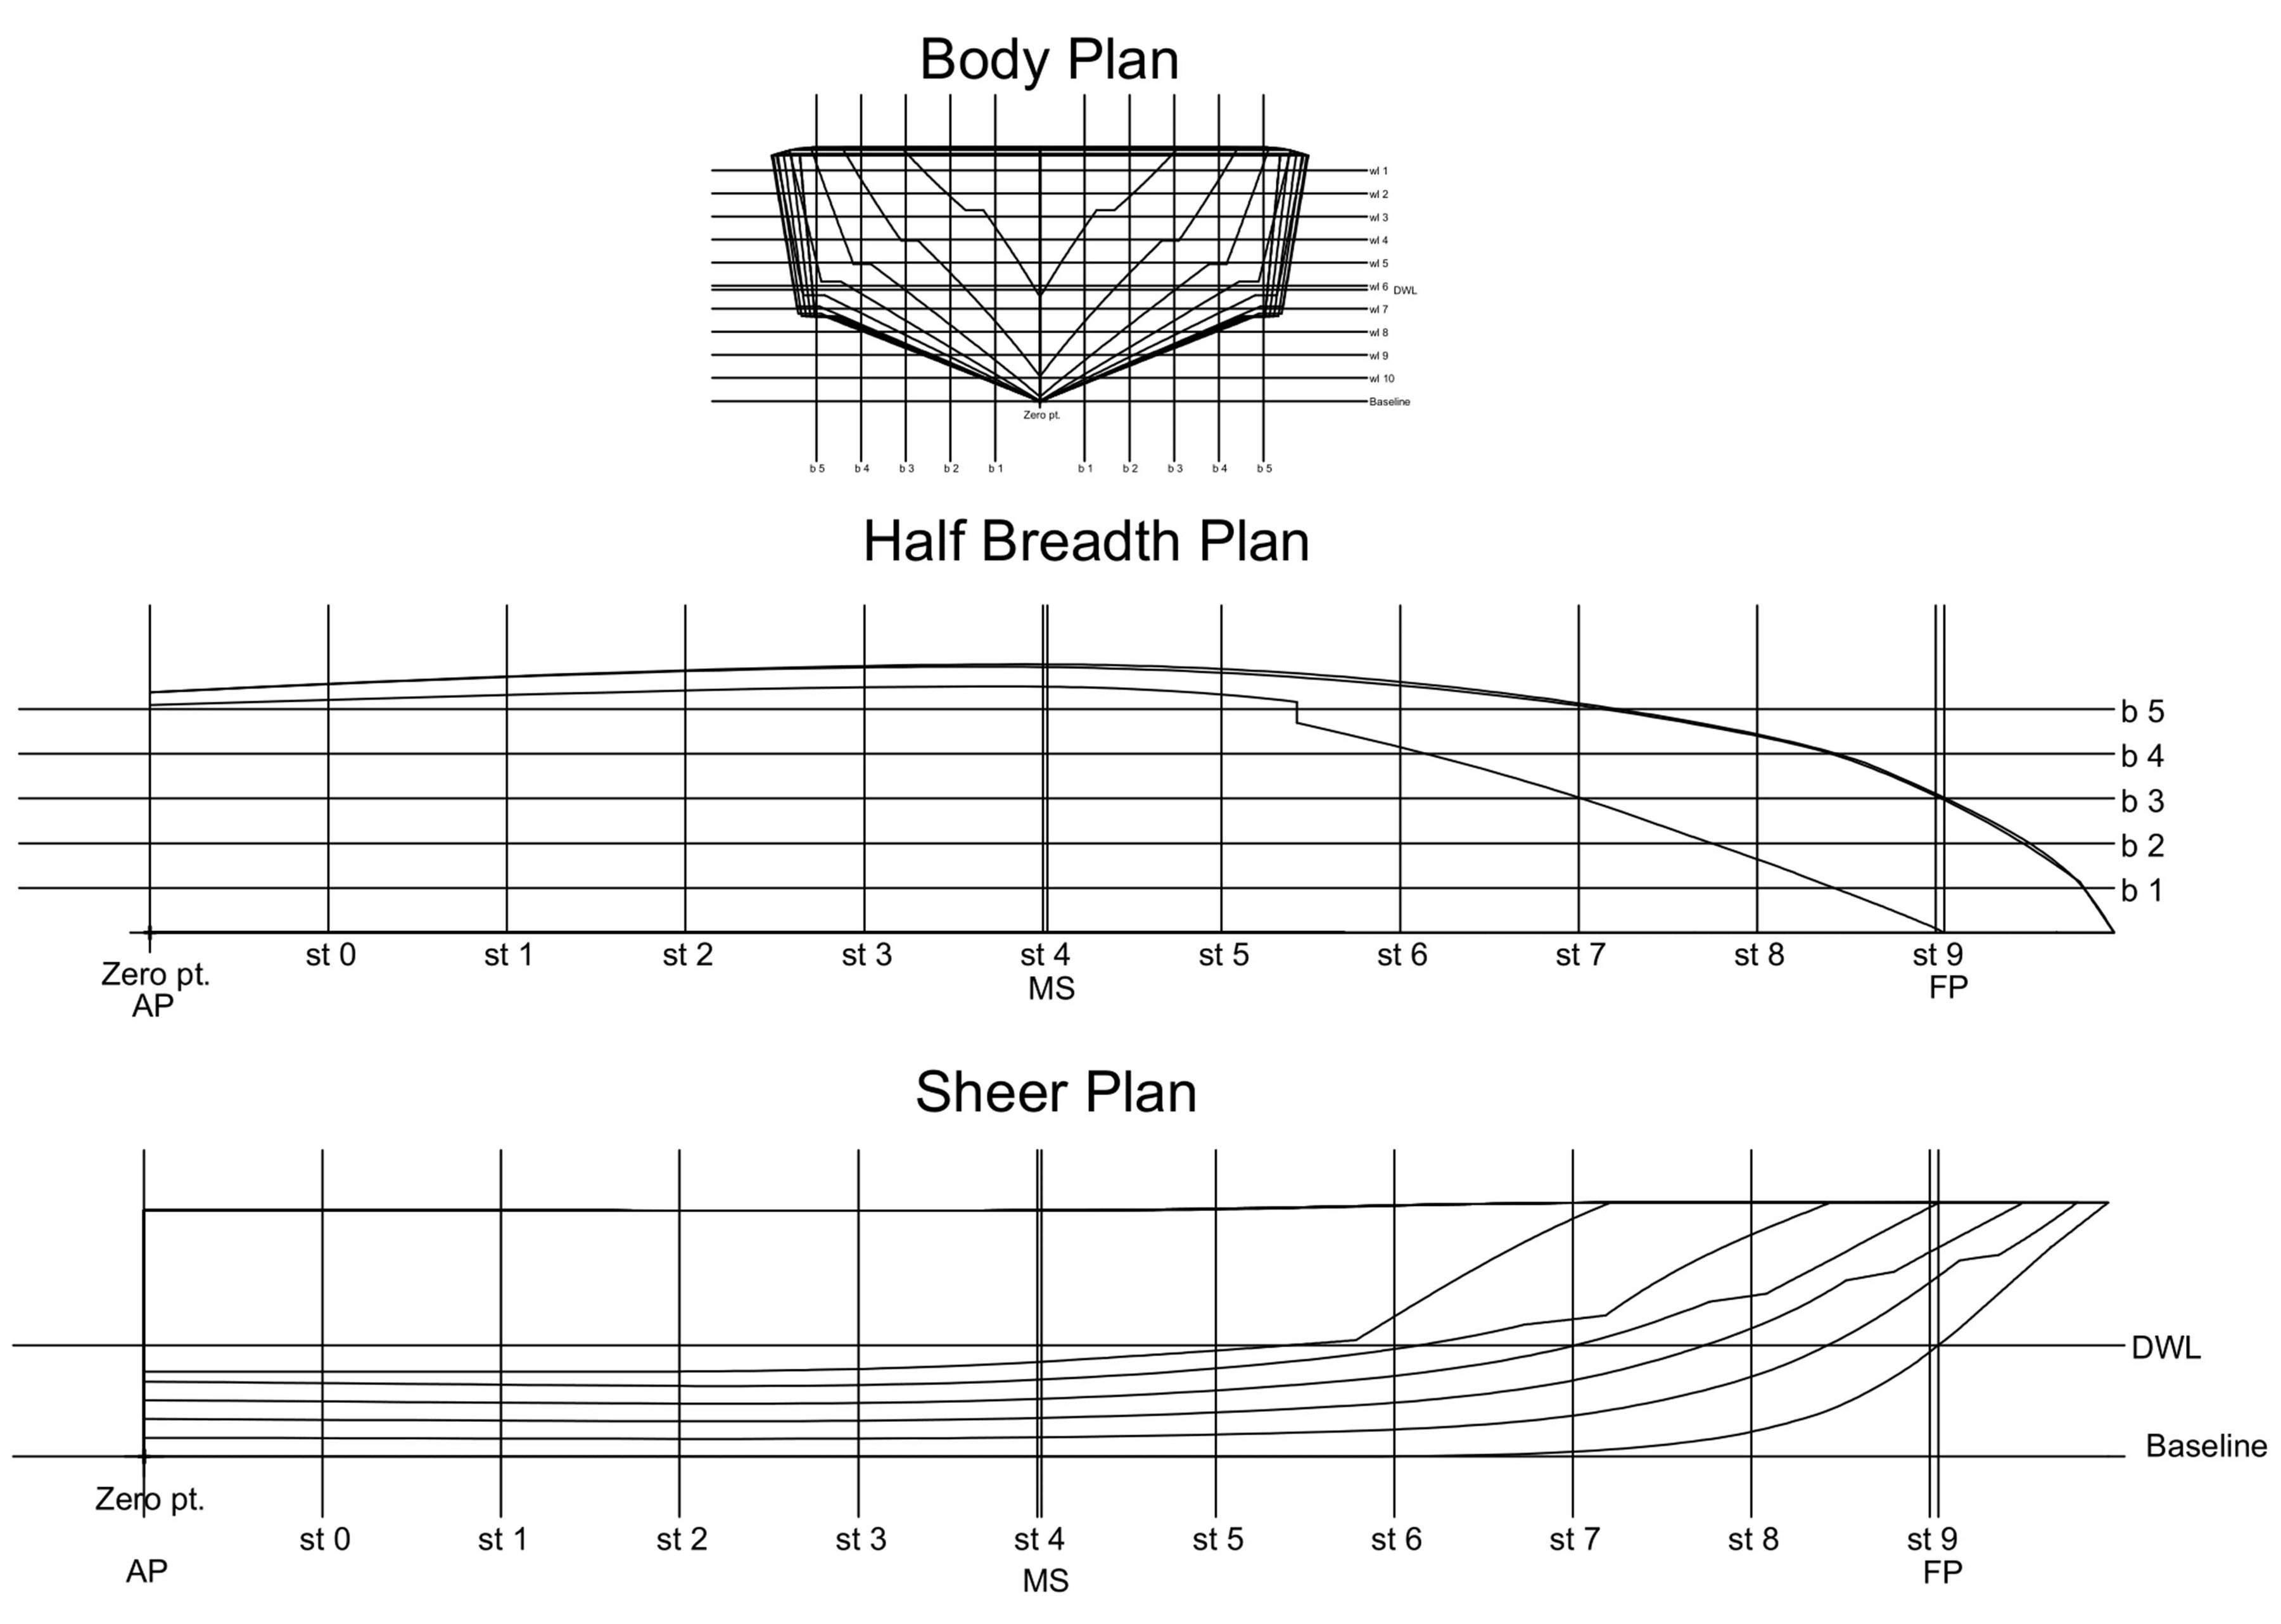
Figure A5.
Aresa 1300 Sentinel RHIB.
Appendix B. Lines Plan of the Regression Model
Figure A6.
Model of the Regression I.
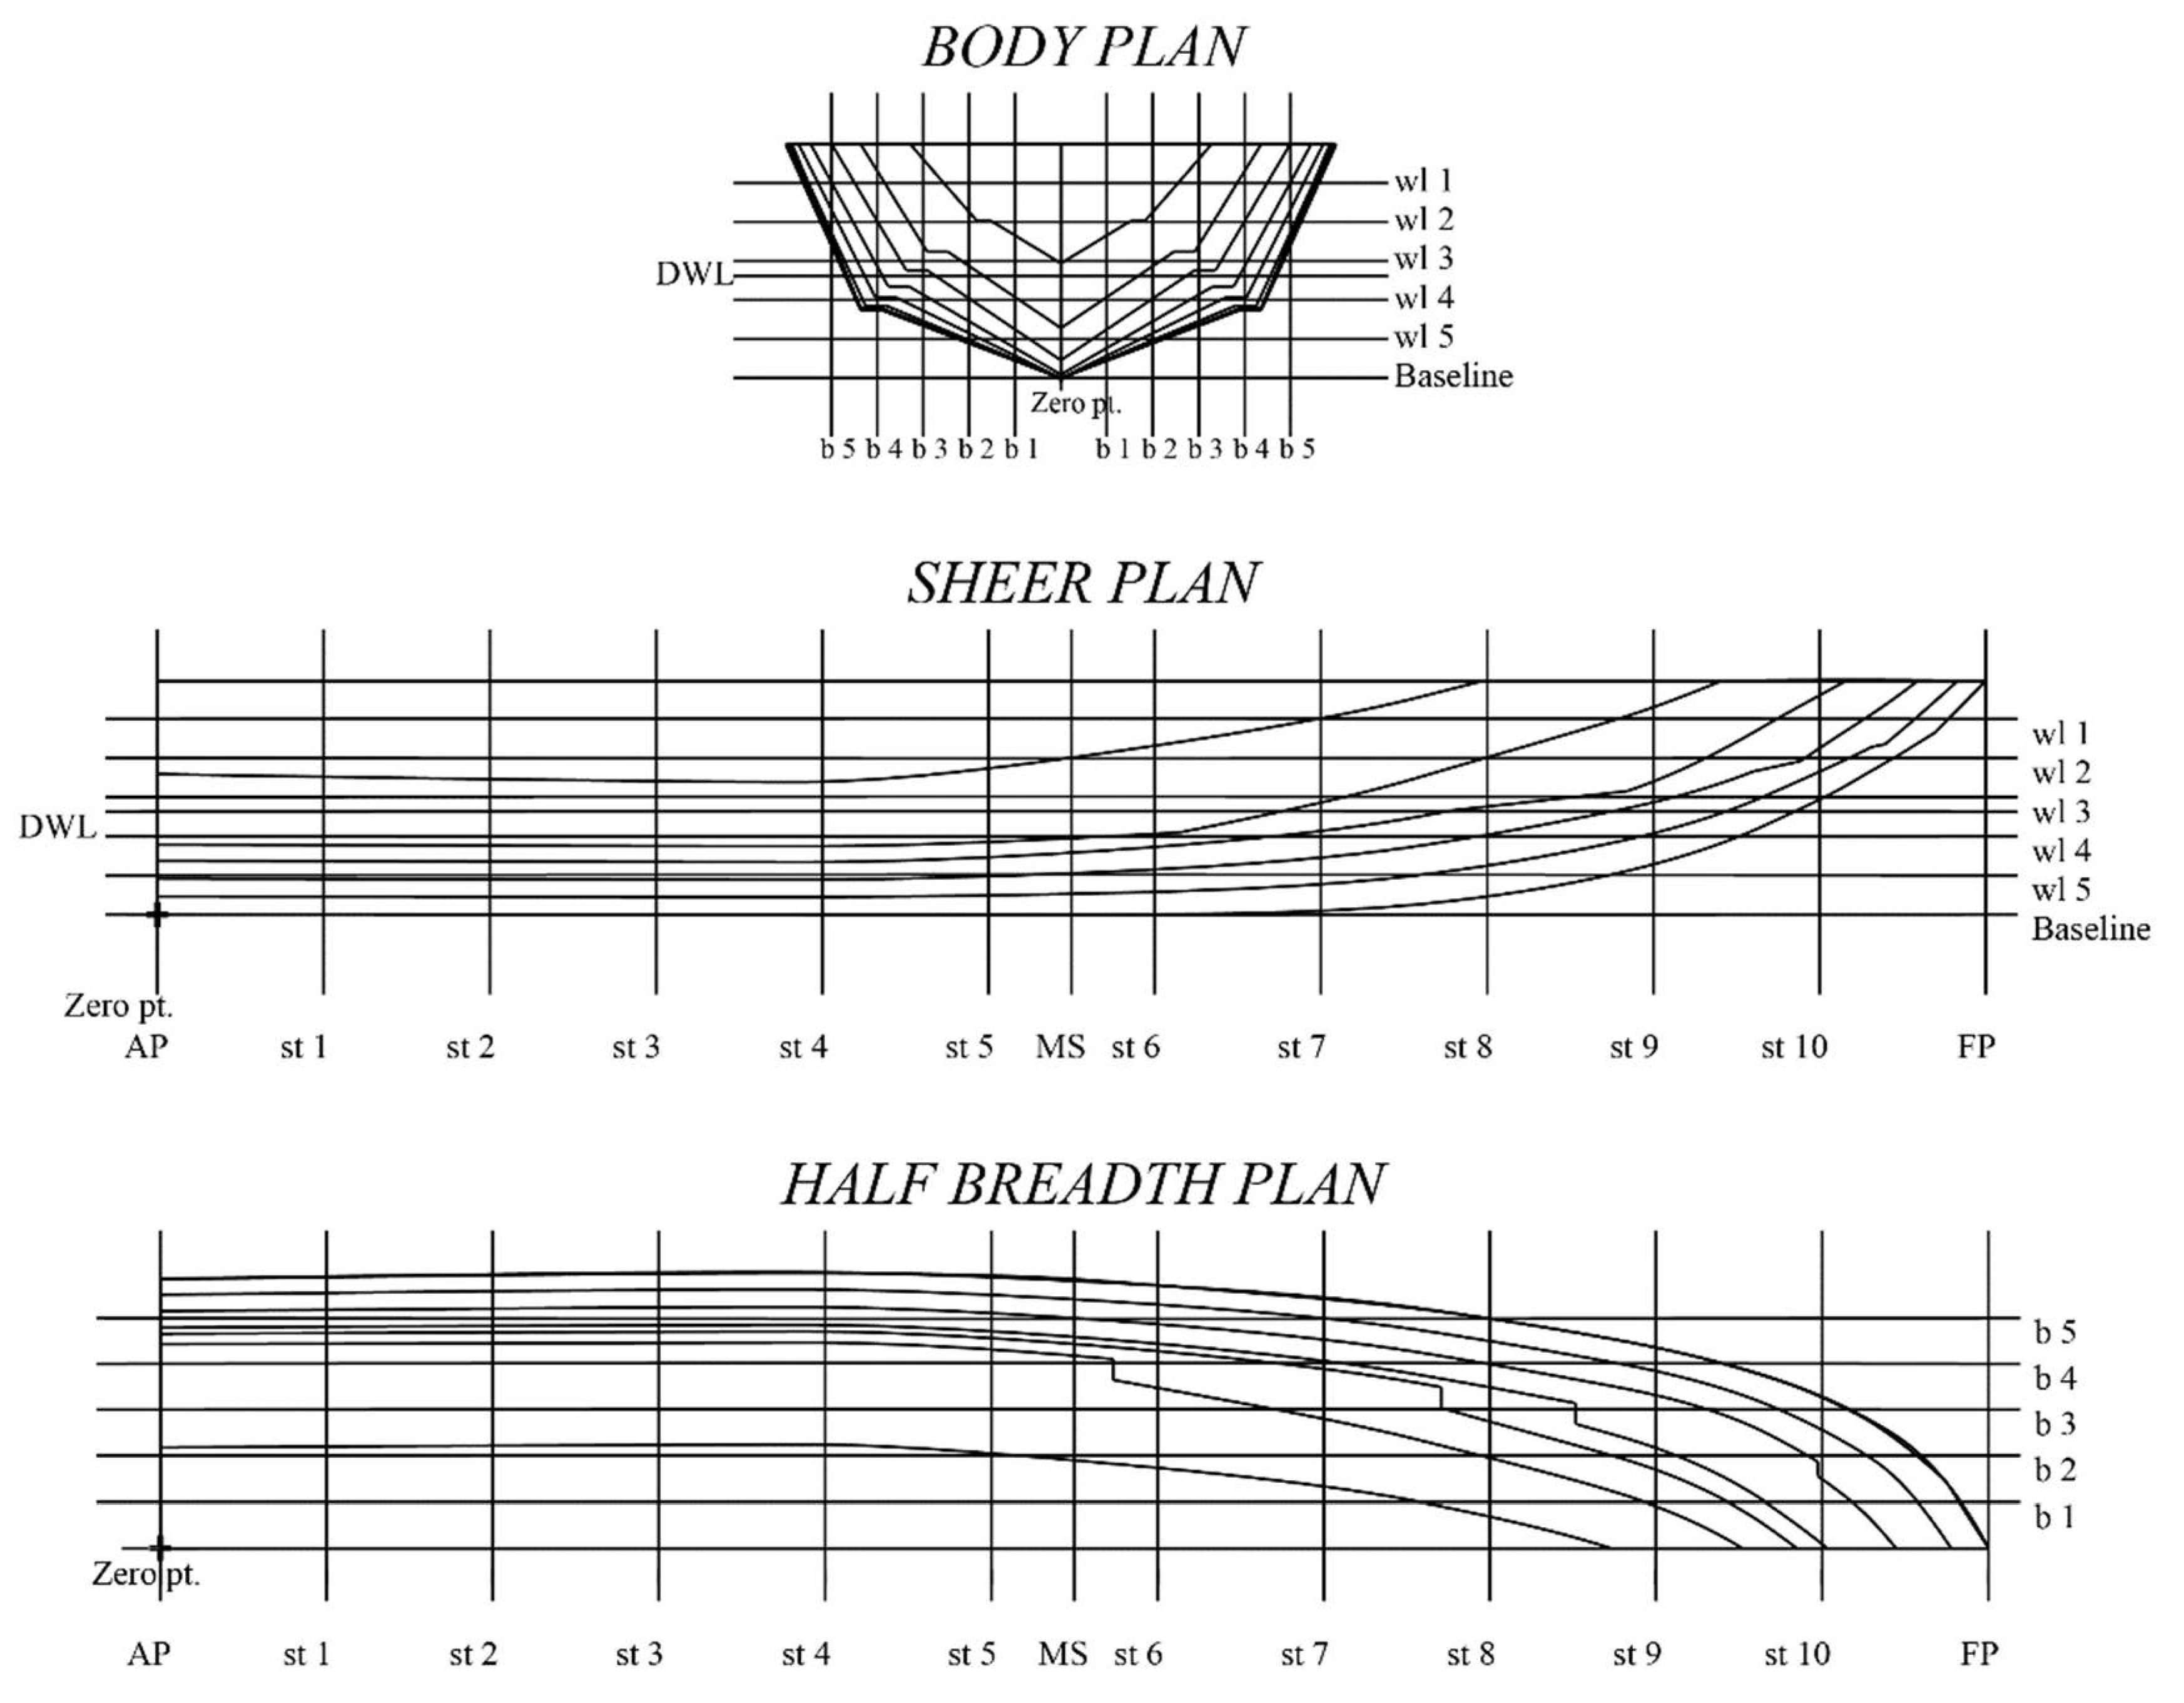
Figure A7.
Model of the Regression II.
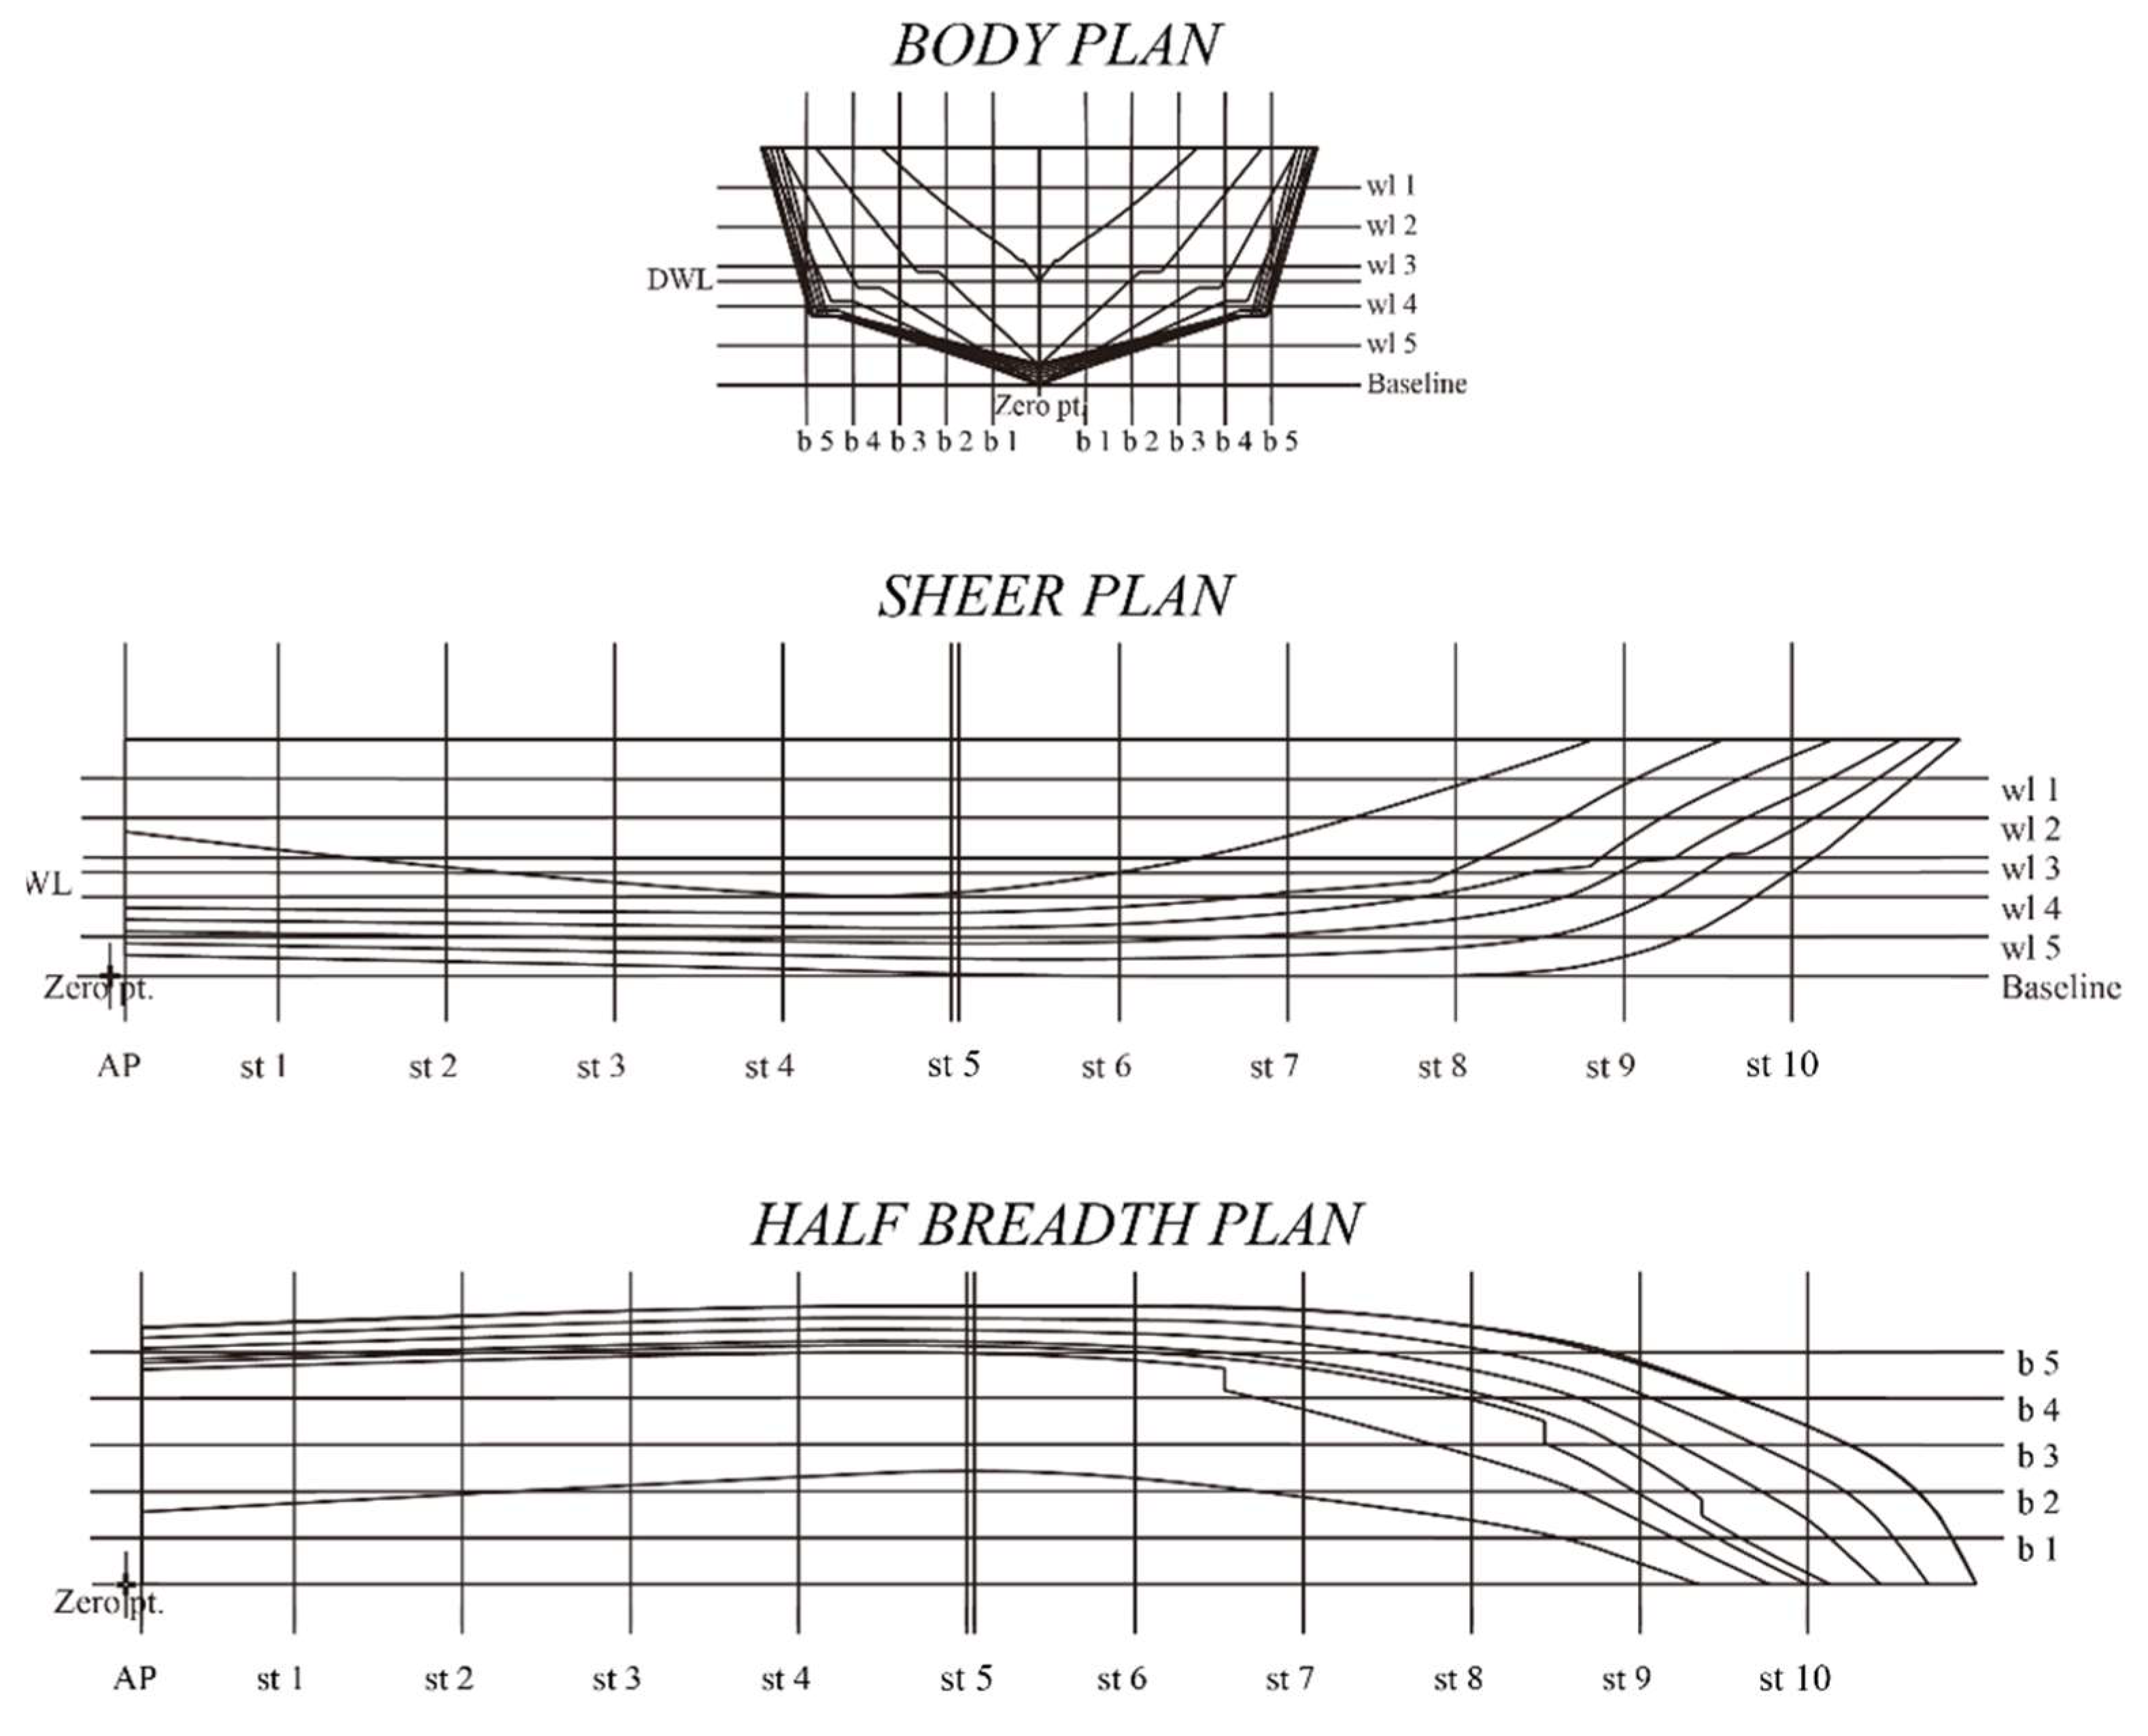
Figure A8.
Model of the Regression III.
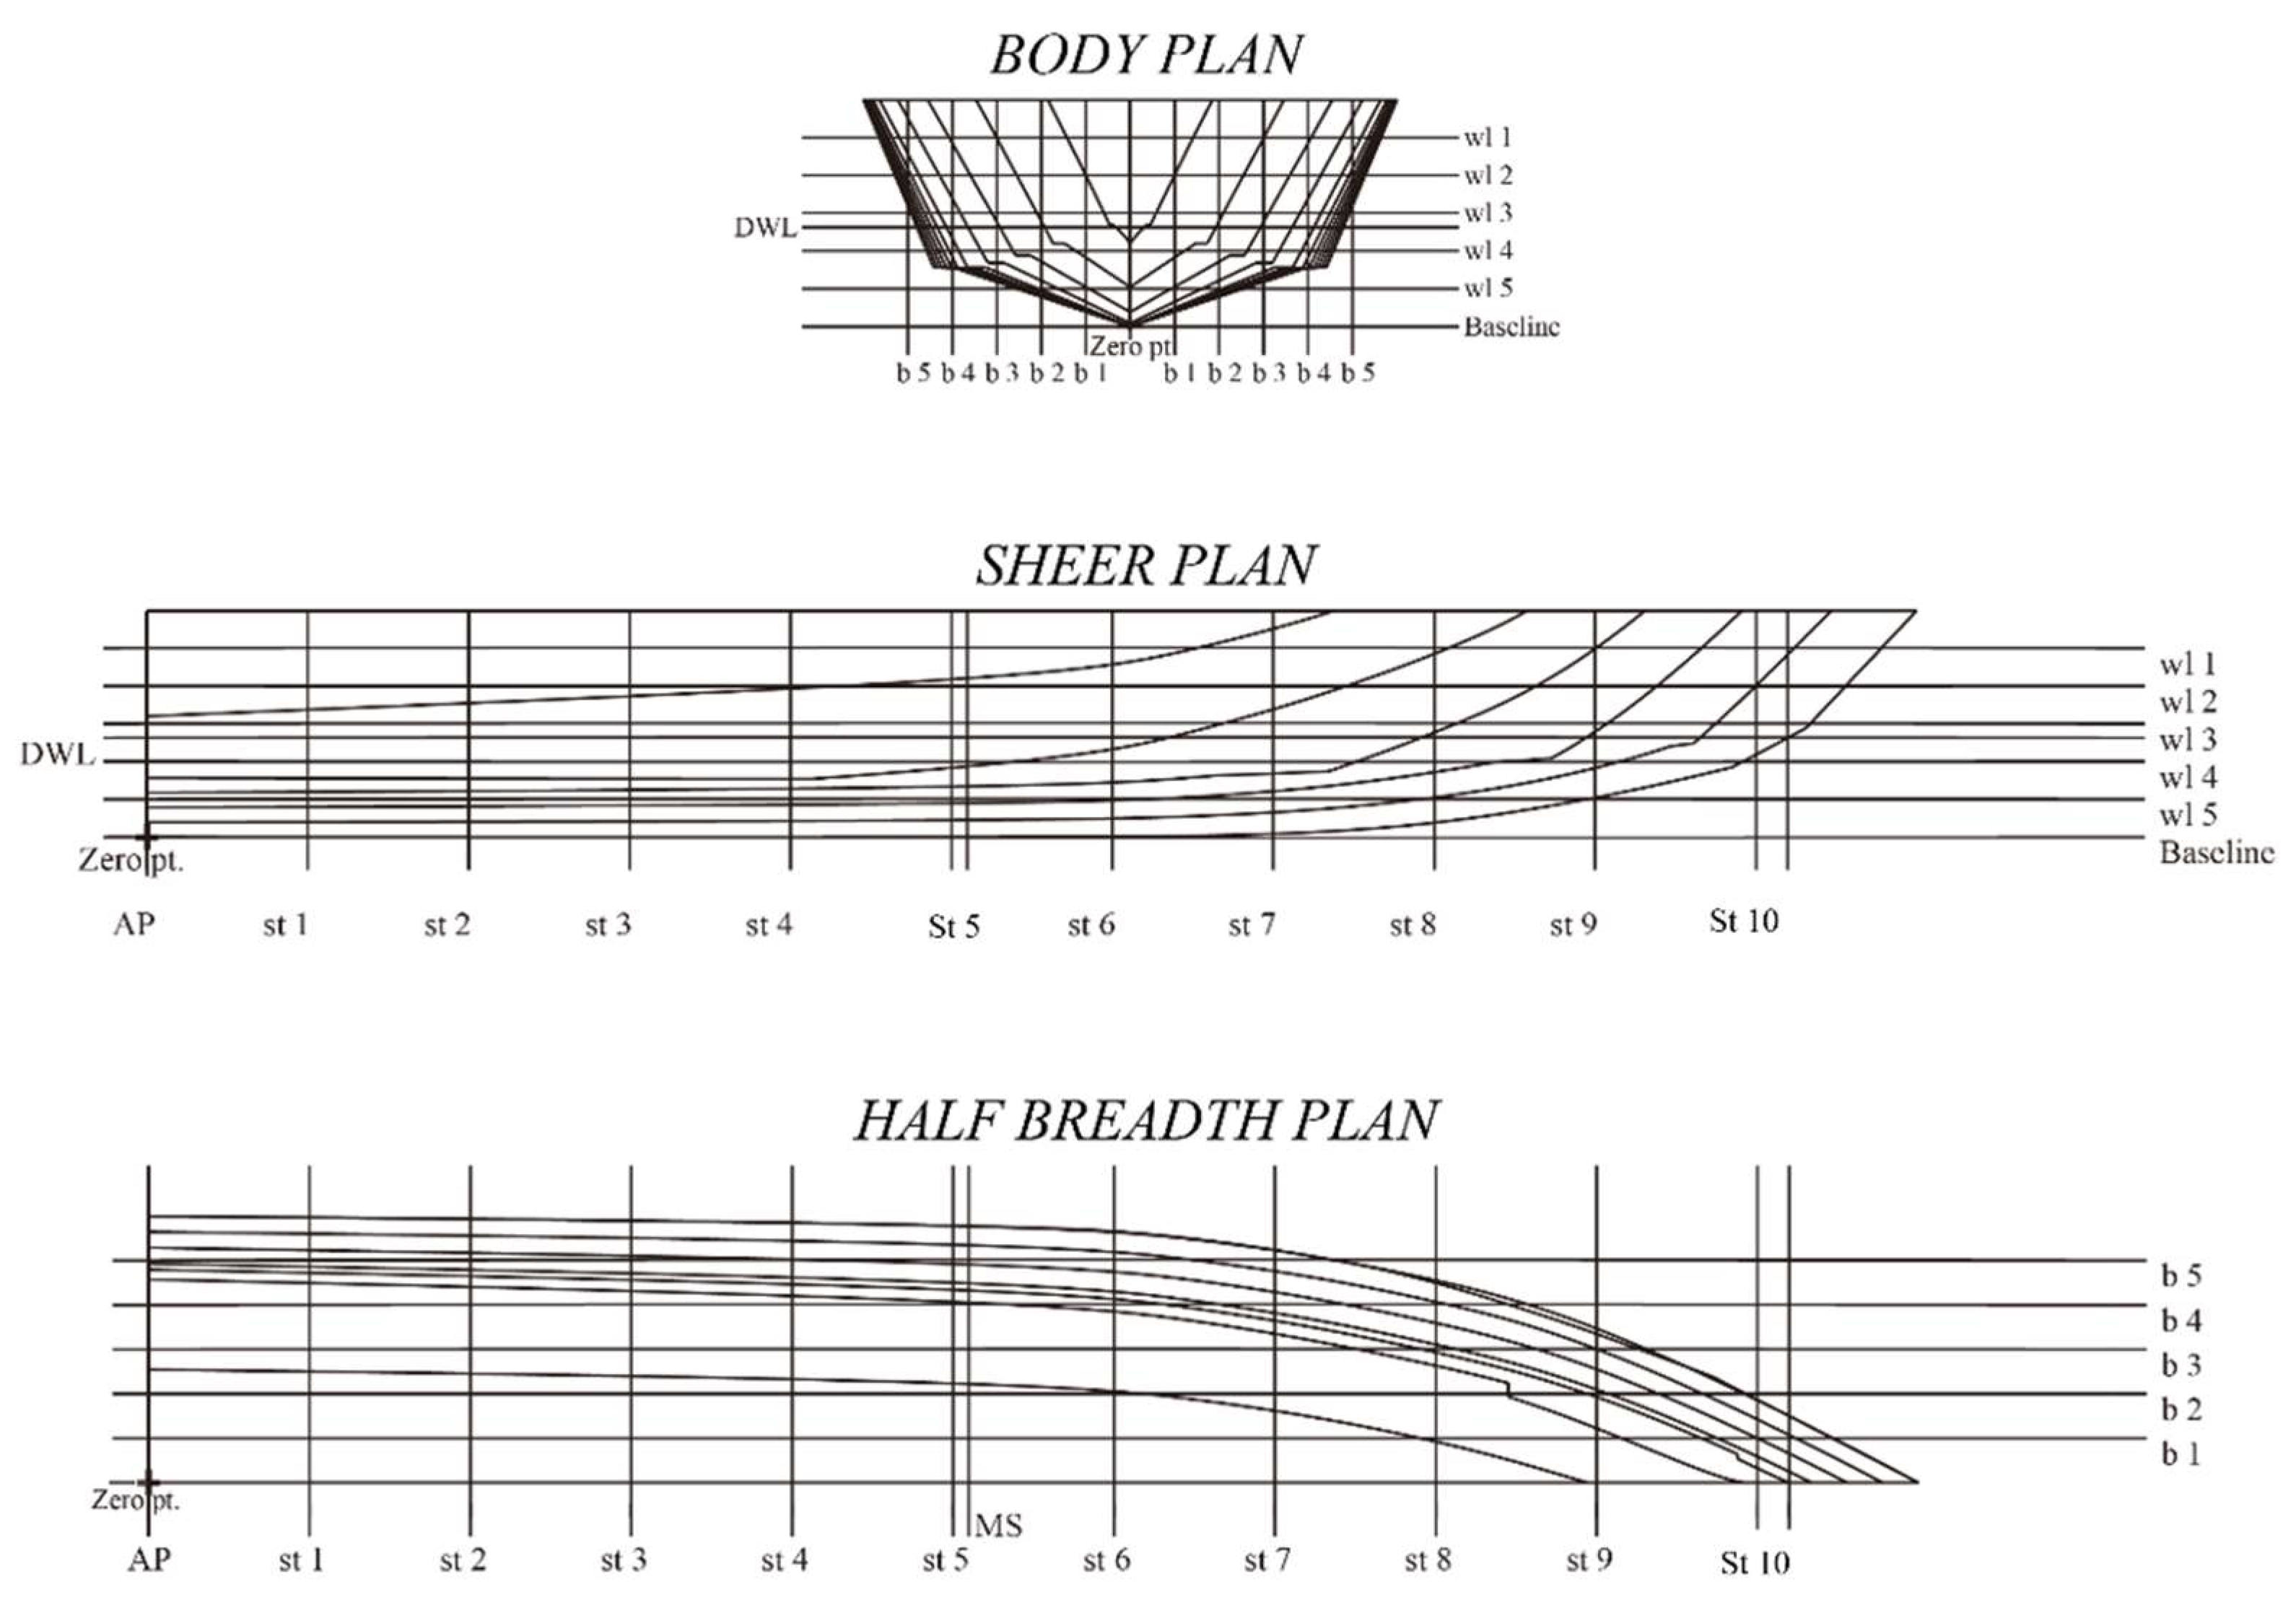
Appendix C. Lines Plan of the Scaling Model
Figure A9.
Model of the Scaling I.
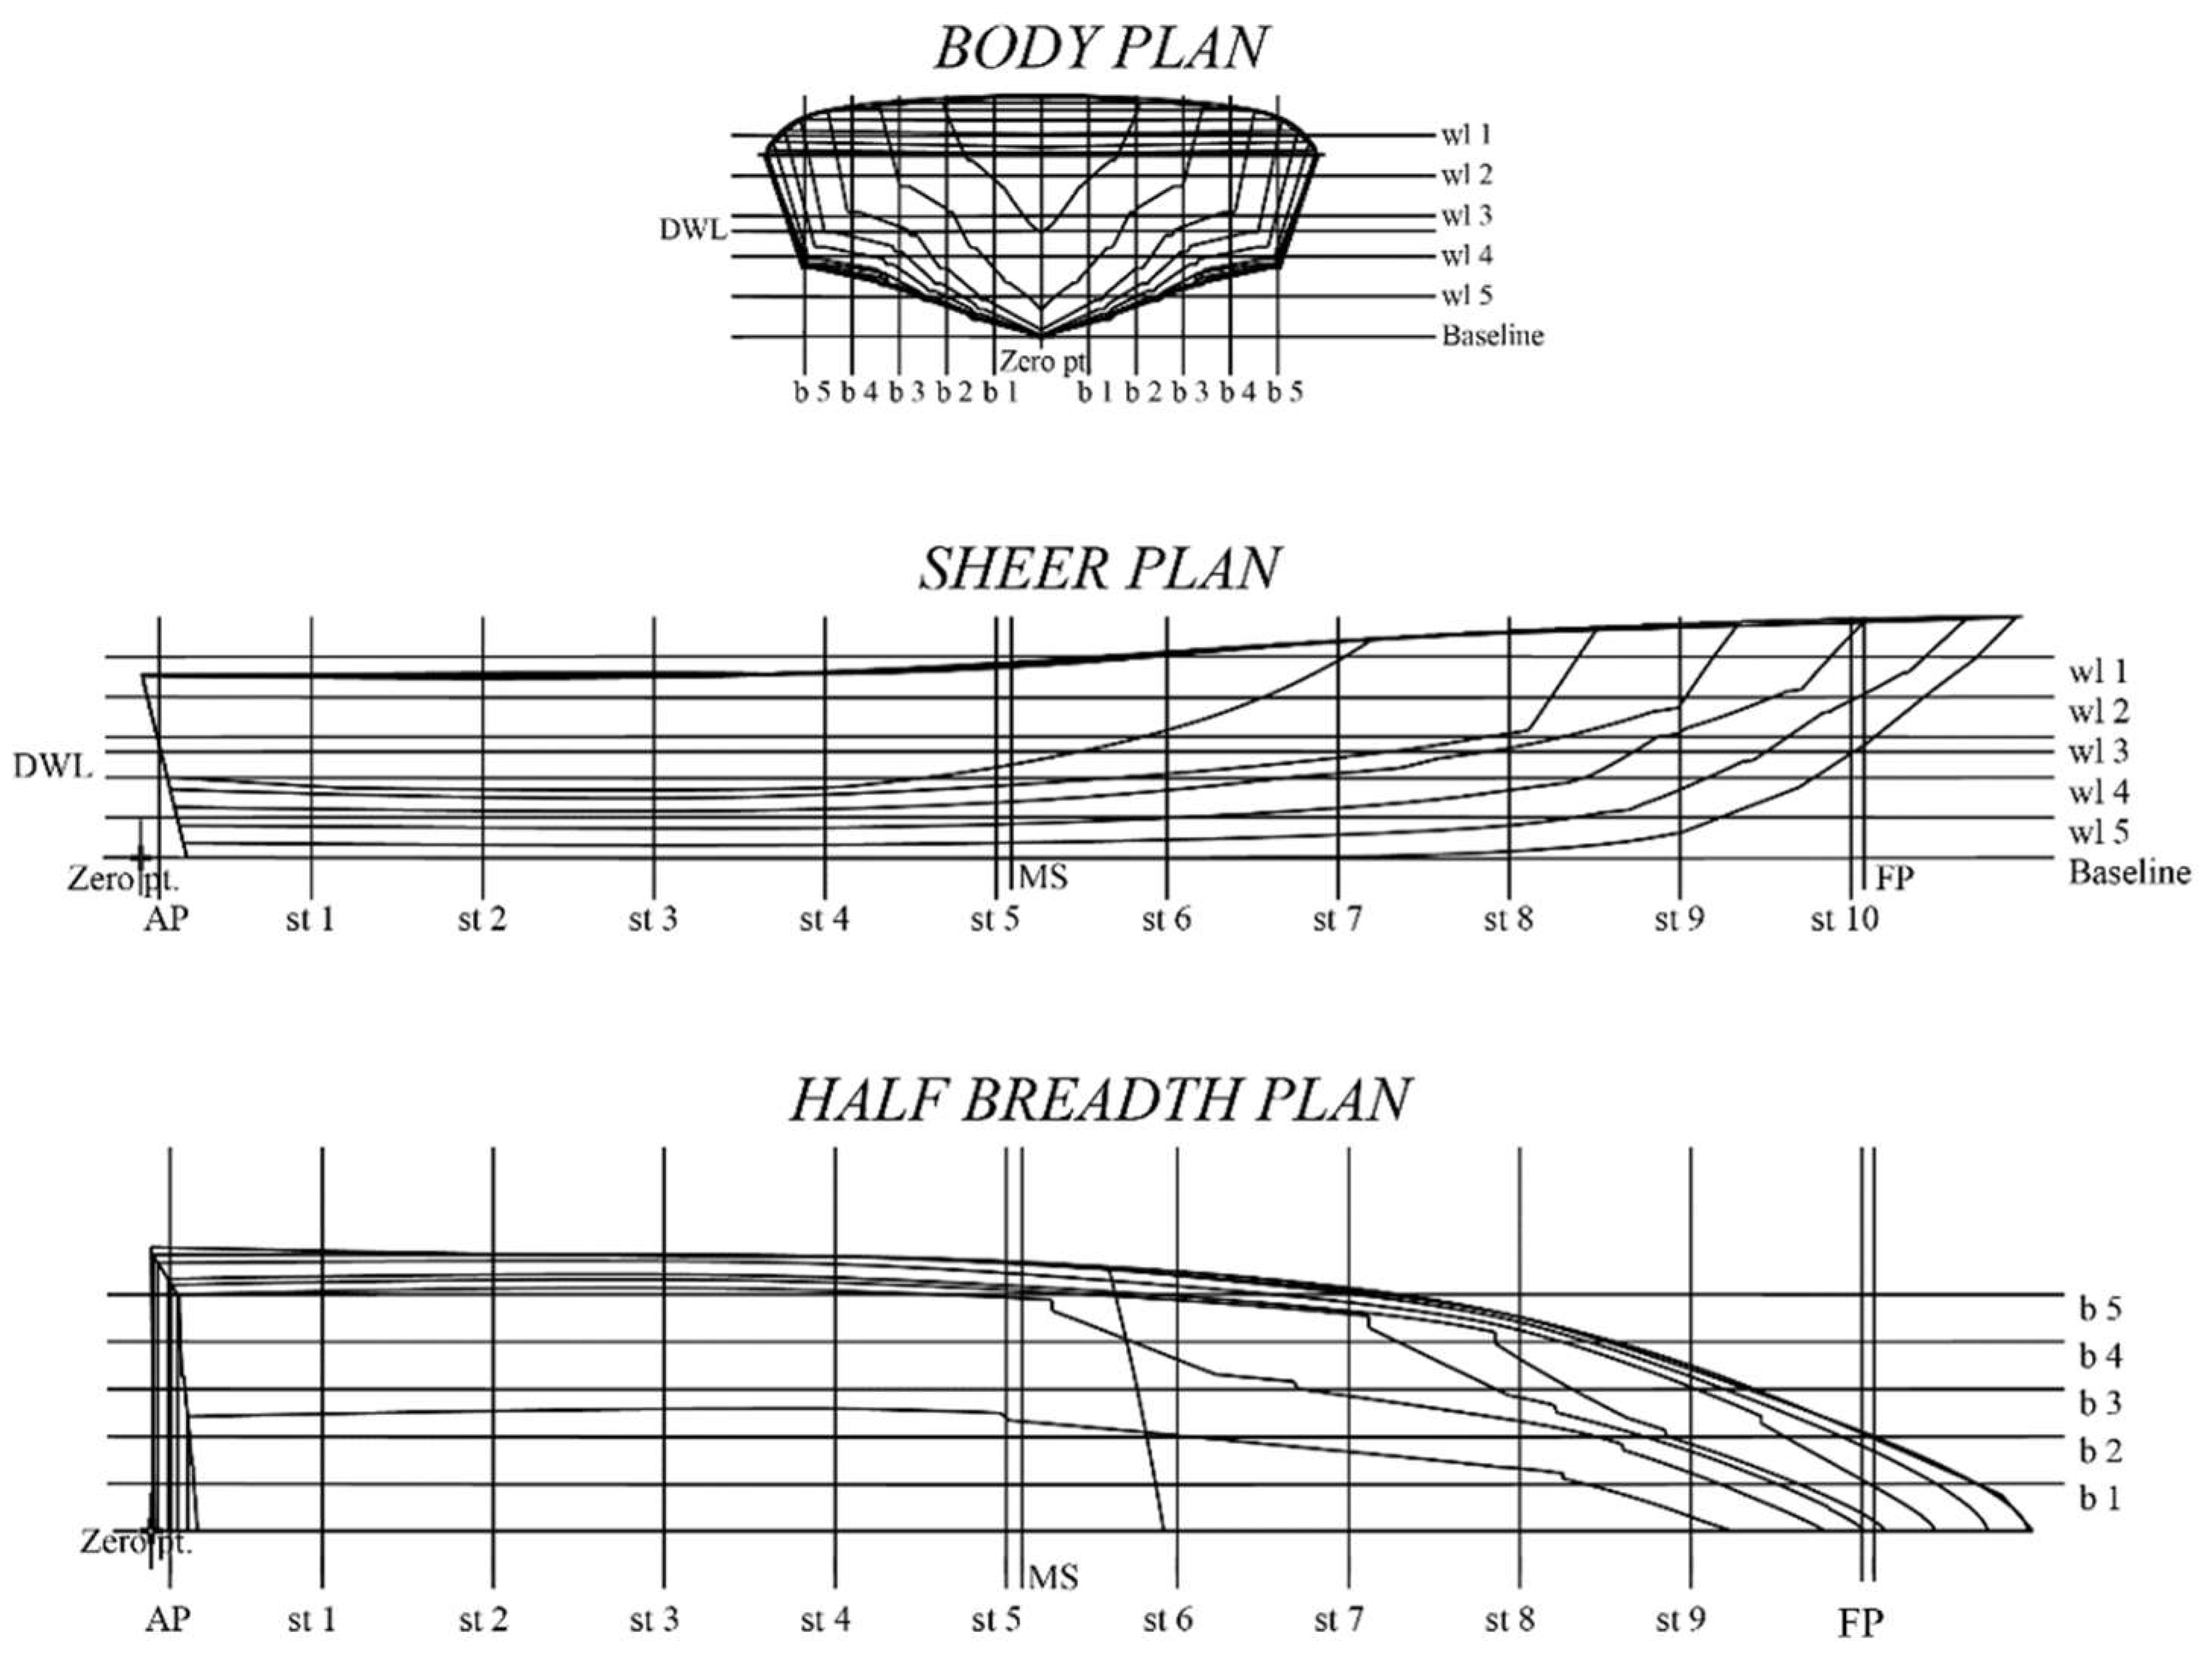
Figure A10.
Model of the Scaling II.
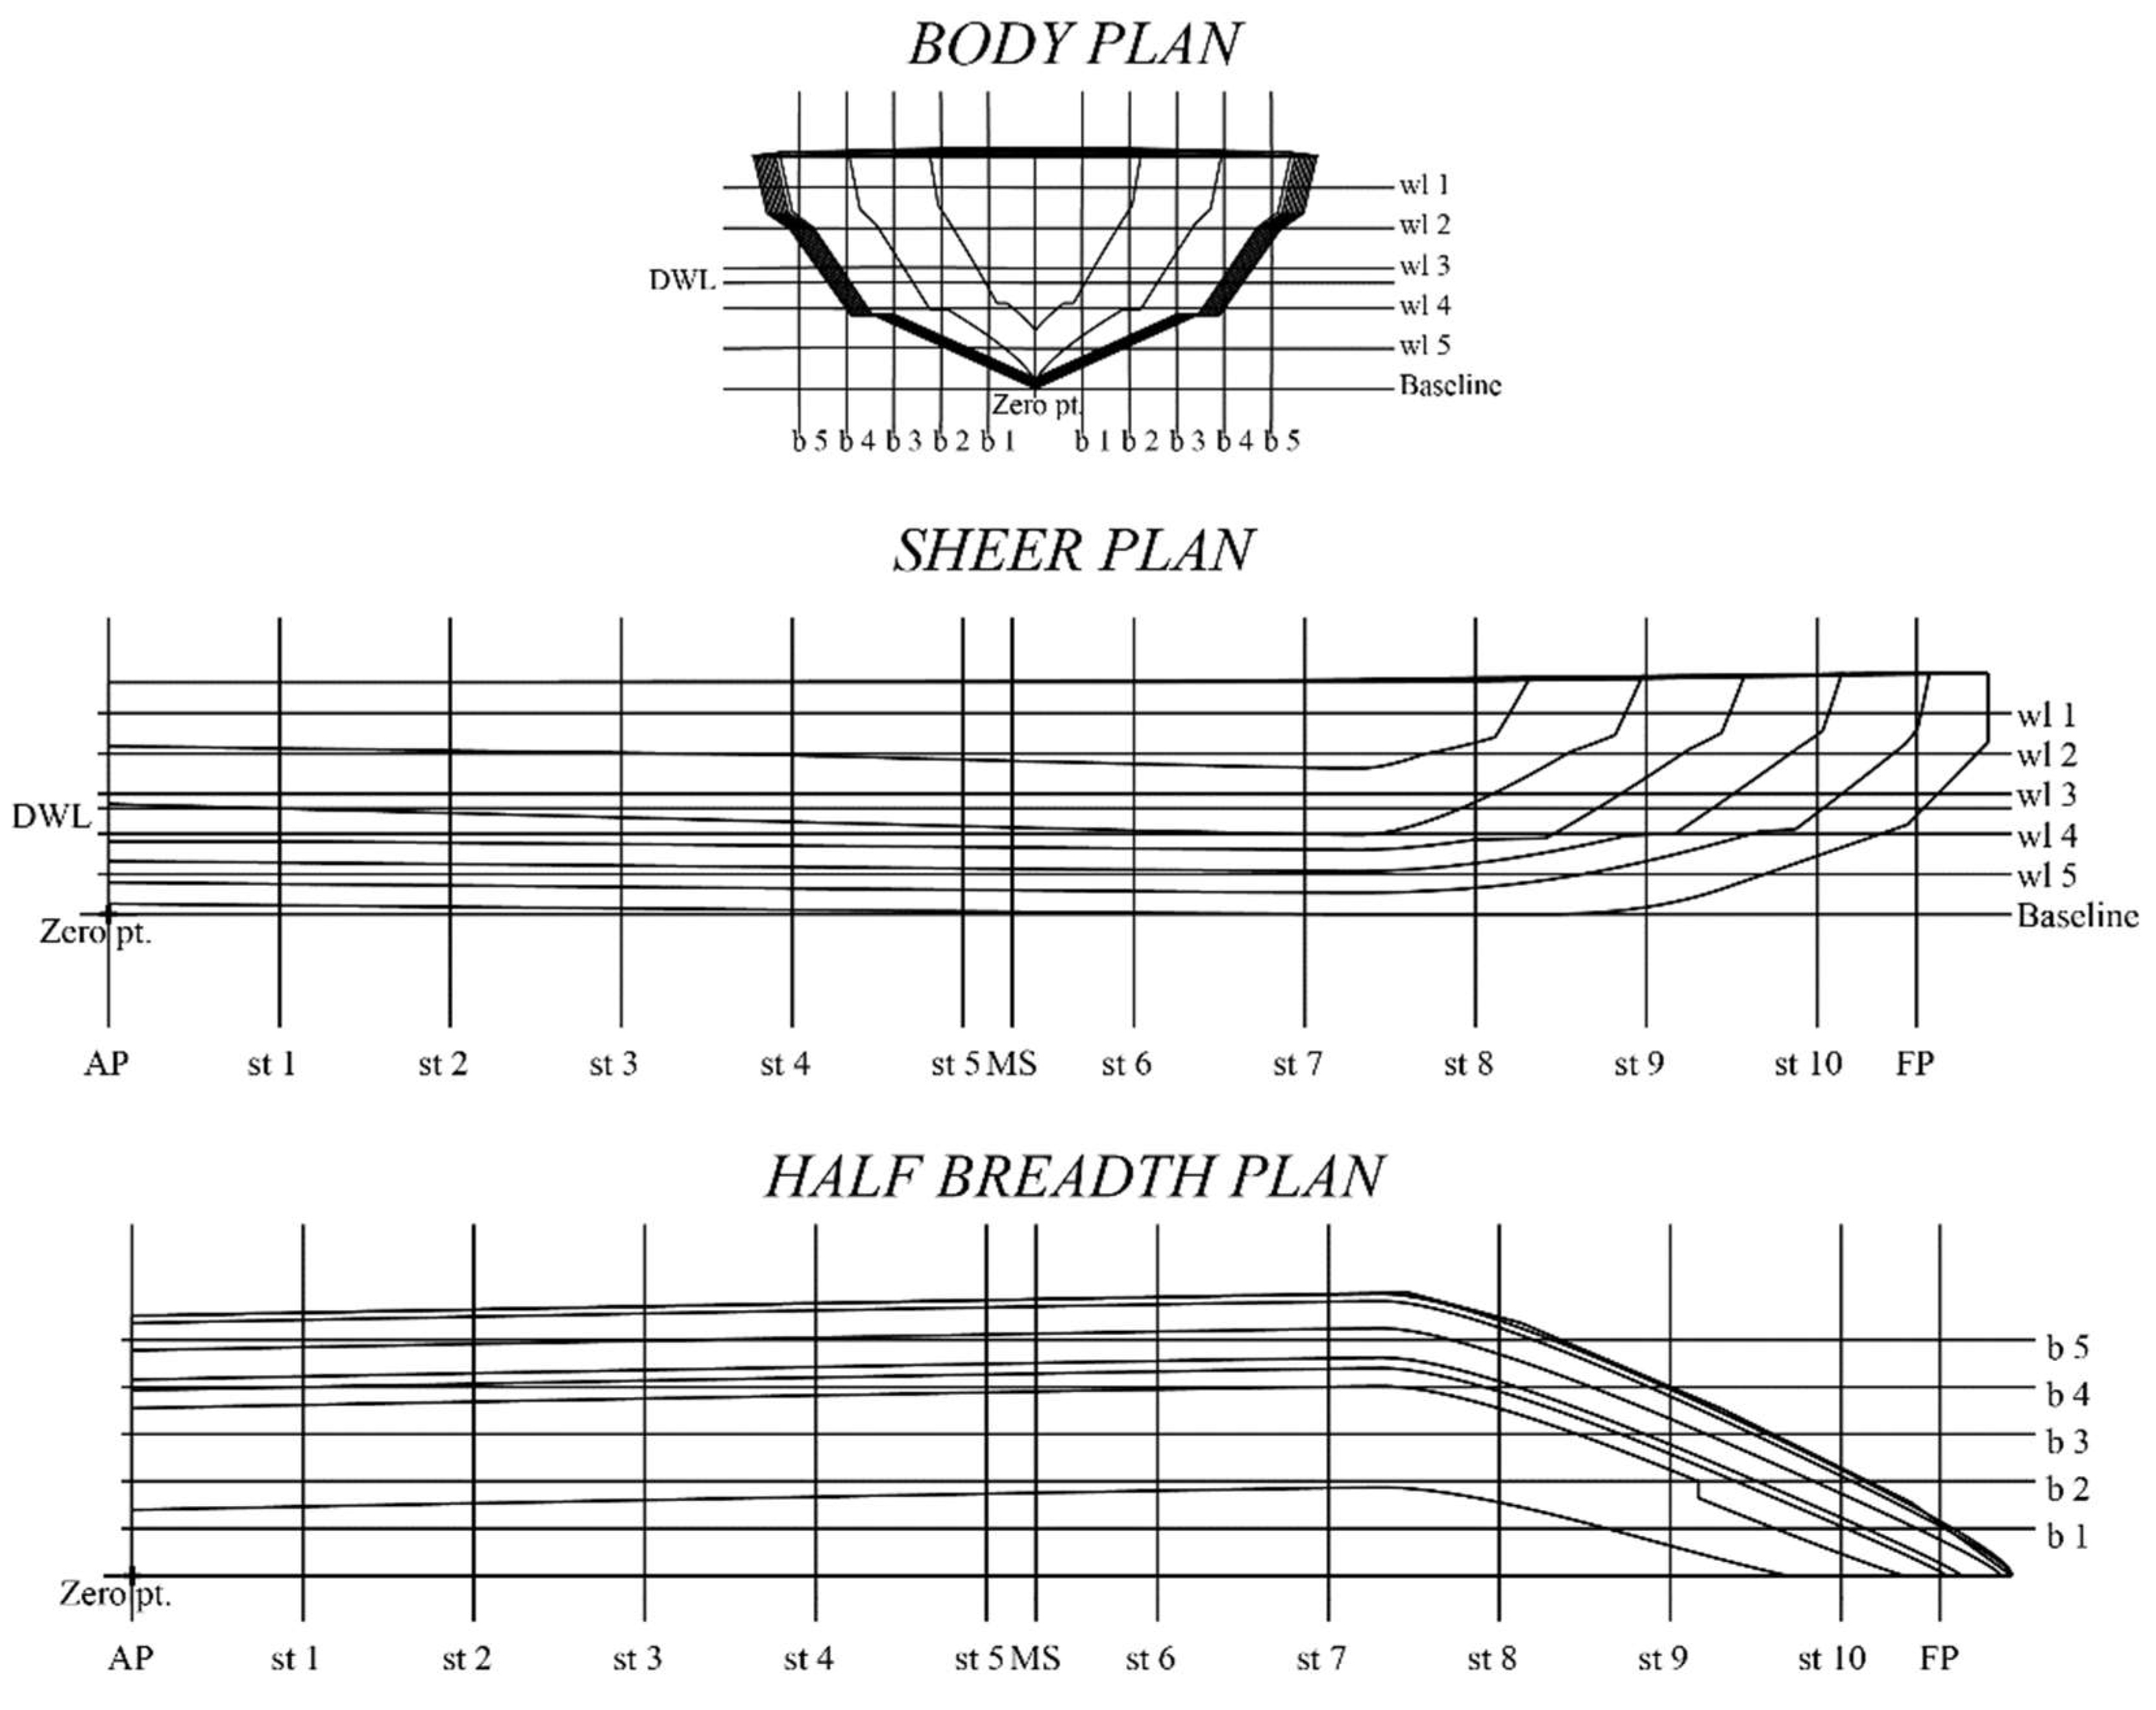
Figure A11.
Model of the Scaling III.

References
- Saha, P. Indonesia’s potential as a maritime power. Marit. Aff. J. Natl. Marit. Found. India 2016, 12, 28–41. [Google Scholar] [CrossRef]
- Nugroho, A.; Suharyo, O.S.; Rahman, A. The development of Indonesian maritime potential and prospects towards a world maritime axis. STTAL Postgrad. Int. Conf. 2020, 4, 1–8. [Google Scholar]
- Dipua, A.; Harahap, N.; Puspitawati, D.; Aminuddin, F.; Prakoso, L.Y. Sea defense strategy the Indonesian navy in dealing with the South China Sea Conflict. Italienisch 2021, 11, 120–126. [Google Scholar]
- Prabowo, A.R.; Martono, E.; Muttaqie, T.; Tuswan, T.; Bae, D.M. Effect of hull design variations on the resistance profile and wave pattern: A case study of the patrol boat vessel. J. Eng. Sci. Technol. 2022, 17, 106–126. [Google Scholar]
- Julianto, R.I.; Prabowo, A.R.; Muhayat, N.; Putranto, T.; Adiputra, R. Investigation of hull design to quantify resistance criteria using holtrop’s regression-based method and savitsky’s mathematical model: A study case of fishing vessels. J. Eng. Sci. Technol. 2021, 16, 1426–1443. [Google Scholar]
- Febrianto, R.A.; Prabowo, A.R.; Baek, S.J.; Adiputra, R. Analysis of monohull design characteristics as supporting vessel for the covid-19 medical treatment and logistic. Transp. Res. Procedia 2021, 55, 699–706. [Google Scholar] [CrossRef]
- Yusvika, M.; Prabowo, A.R.; Tjahjana, D.D.D.P.; Sohn, J.M. Cavitation Prediction of Ship Propeller Based on Temperature and Fluid Properties of Water. J. Mar. Sci. Eng. 2020, 8, 465. [Google Scholar] [CrossRef]
- Jeong, S.; Kim, H. Development of an efficient hull form design exploration framework. Math. Probl. Eng. 2013, 2013, 12. [Google Scholar] [CrossRef] [Green Version]
- Ang, J.H.; Goh, C.; Li, Y. Hull form design optimisation for improved efficiency and hydrodynamic performance of “ship-shaped” offshore vessels. In Proceedings of the International Conference on Computer Applications in Shipbuilding, Bremen, Germany, 29 September–1 October 2015; Royal Institution of Naval Architectsm: London, UK; pp. 71–80. [Google Scholar]
- Julianto, R.I.; Muttaqie, T.; Adiputra, R.; Hadi, S.; Hidajat, R.L.L.G.; Prabowo, A.R. Hydrodynamic and structural investigations of catamaran design. Procedia Struct. Integr. 2020, 27, 93–100. [Google Scholar] [CrossRef]
- Radfar, S.; Taherkhani, A.; Panahi, R. Standardization of the main dimensions of design container ships in ports—A case study. World J. Eng. Technol. 2017, 5, 51–61. [Google Scholar] [CrossRef] [Green Version]
- Kristensen, H.O.H. Determination of Regression Formulas for Main Dimensions of Tankers and Bulk Carriers Based on IHS Fairplay Data; Technical report for Project no. 2010-56, Emissionsbeslutningsstøttesystem Work Package 2; Technical University of Denmark: Lyngby, Denmark, 2012. [Google Scholar]
- Yurdakul, O.; Küçüksu, G.N.; Saydam, A.Z.; Çalışal, M.S. A decision-making process for the selection of better ship main dimensions by a Pareto frontier solution. Ocean Eng. 2021, 239, 109908. [Google Scholar] [CrossRef]
- Hou, Y.H.; Huang, S.; Wang, W.Q.; Hu, Y.L. Regression Analysis of Ship Principal Dimensions Based on Improved PSO-BP Algorithm. Adv. Mater. Res. 2011, 308–310, 1029–1032. [Google Scholar] [CrossRef]
- Yang, Y.-S.; Park, C.-K.; Lee, K.-H.; Suh, J.-C. A study on the preliminary ship design method using deterministic approach and probabilistic approach including hull form. Struct. Multidiscip. Optim. 2006, 33, 529–539. [Google Scholar] [CrossRef]
- Noviyarto, H. Implementation regression and naïve bayes to predict and classify data asset at educational institutions. Int. J. Multidiscip. Res. Publ. 2020, 2, 22–25. [Google Scholar]
- Dabit, A.S.; Lianto, A.E.; Branta, S.A.; Laksono, F.B.; Prabowo, A.R.; Muhayat, N. Finite element analysis (FEA) on autonomous unmanned surface vehicle feeder boat subjected to static loads. Procedia Struct. Integr. 2020, 27, 163–170. [Google Scholar] [CrossRef]
- Jiao, J.; Chen, C.; Ren, H. A comprehensive study on ship motion and load responses in short-crested irregular waves. Int. J. Nav. Archit. Ocean Eng. 2019, 11, 364–379. [Google Scholar] [CrossRef]
- Yusvika, M.; Prabowo, A.R.; Baek, S.J.; Tjahjana, D.D.D.P. Achievements in observation and prediction of cavitation: Effect and damage on the ship propellers. Procedia Struct. Integr. 2020, 27, 109–116. [Google Scholar] [CrossRef]
- Campbell, R.; Terziev, M.; Tezdogan, T.; Incecik, A. Computational fluid dynamics predictions of draught and trim variations on ship resistance in confined waters. Appl. Ocean Res. 2022, 126, 103301. [Google Scholar] [CrossRef]
- USNA. Resistance and Powering of Ships. In Resist. Powering Ships; USNA: Vancouver, BC, Canada, 2002; pp. 1–46. [Google Scholar]
- Jang, J.; Choi, S.H.; Ahn, S.-M.; Kim, B.; Seo, J.S. Experimental investigation of frictional resistance reduction with air layer on the hull bottom of a ship. Int. J. Nav. Archit. Ocean Eng. 2014, 6, 363–379. [Google Scholar] [CrossRef] [Green Version]
- Kristensen, H.O.; Lützen, M. Prediction of Resistance and Propulsion Power of Ships; Technical report for Project no. 2010-56, Emissionsbeslutningsstøttesystem Work Package 2; Technical University of Denmark: Lyngby, Denmark, 2013. [Google Scholar]
- Molland, A.F.; Turnock, S.R.; Hudson, D.A. Ship Resistance and Propulsion, 2nd ed.; Cambridge University Press: Cambridge, UK, 2017. [Google Scholar]
- Cookson, M.D.; Stirk, P.M.R. Plant Flow Measurement and Control Handbook; Elsevier: Amsterdam, The Netherlands, 2019. [Google Scholar]
- Bahatmaka, A.; Kim, D.-J.; Samuel; Prabowo, A.R.; Zaw, M.-T.; Ariyanto, M.; Munadi; Ismail, R.; Arifin, Z.A. Investigation on the performance of the traditional Indonesian fishing vessel. MATEC Web Conf. 2018, 159, 02056. [Google Scholar] [CrossRef]
- He, J.; Wu, H.; Ma, C.; Yang, C.J.; Zhu, R.; Li, W.; Noblesse, F. Froude number, hull shape, and convergence of integral representation of ship waves. Eur. J. Mech. B Fluids 2019, 78, 216–229. [Google Scholar] [CrossRef]
- Savitsky, D.; Brown, P.W. Procedures for hydrodynamic evaluation of planing hulls in smooth and rough water. Mar. Technol. SNAME News 1976, 13, 381–400. [Google Scholar] [CrossRef]
- Adrian, B.; Ruben Lopez, P. Ship Hydrostatics and Stability, 2nd ed.; Butterworth-Heinemann: Oxford, UK, 2014. [Google Scholar]
- Barrass, C.B.; Derrett, D.R. Ship Stability for Masters and Mates, 6th ed.; Butterworth-Heinemann: Oxford, UK, 2006. [Google Scholar]
- Ruponen, P. Principles of Ship Buoyancy and Stability; Aalto University Publication Series: Aalto, Finland, 2021. [Google Scholar]
- Mégel, J.; Kliava, J. Metacenter and Ship Stability. Am. J. Phys. 2010, 78, 738–747. [Google Scholar] [CrossRef] [Green Version]
- Prabowo, A.R.; Febrianto, R.A.; Tuswan, T.; Tjahjana, D.D.D.P. Performance evaluation on the designed v-shaped monohull ship models. J. Appl. Eng. Sci. 2022, 20, 609–623. [Google Scholar]
- Ibrahim, R.A.; Grace, I.M. Modeling of ship roll dynamics and its coupling with heave and pitch. Math. Probl. Eng. 2010, 2010, 13–18. [Google Scholar] [CrossRef] [Green Version]
- Nurhasanah, N.; Santoso, B.; Romadhoni, R.; Nasutioni, P. Seakeeping Analysis of Hull Rounded Design with Multi-Chine Model on Fishing Vessel. IOP Conf. Series: Earth Environ. Sci. 2020, 430, 012041. [Google Scholar] [CrossRef]
- Bhattacharyya, R. Dynamics of Marine Vehicles; John Wiley & Sons: New York, NY, USA, 1978. [Google Scholar]
- Code Cogs The JONSWAP Spectra in the Wave-Frequency Domain. Available online: http://www.codecogs.com/library/engineering/fluid_mechanics/waves/spectra/jonswap.php (accessed on 10 June 2022).
- Scamardella, A.; Piscopo, V. Passenger ship seakeeping optimization by the overall motion sickness incidence. Ocean Eng. 2014, 76, 86–97. [Google Scholar] [CrossRef]
- Nguyen, V.M.; Jeon, M.; Yoon, H.K. Study on the optimal weather routing of a ship considering parametric rolling, slamming and deck wetness. In Proceedings of the International Symposium on Practical Design of Ships and Other Floating Structures, Copenhagen, Denmark, 4–8 September 2016. [Google Scholar]
- Ibinabo, I.; Tamunodukobipi, D.T. Determination of the response amplitude operator(s) of an FPSO. Engineering 2019, 11, 541–556. [Google Scholar] [CrossRef] [Green Version]
- Xu, Z. On Multi-Period Multi-Attribute Decision Making. Knowl. Based Syst. 2008, 21, 164–171. [Google Scholar] [CrossRef]
- Zanakis, S.H.; Solomon, A.; Wishart, N.; Dublish, S. Multi-Attribute Decision Making: A Simulation Comparison of Select Methods. Eur. J. Oper. Res. 1998, 107, 507–529. [Google Scholar] [CrossRef]
Figure 1.
Flowchart of the initial design of the ship.
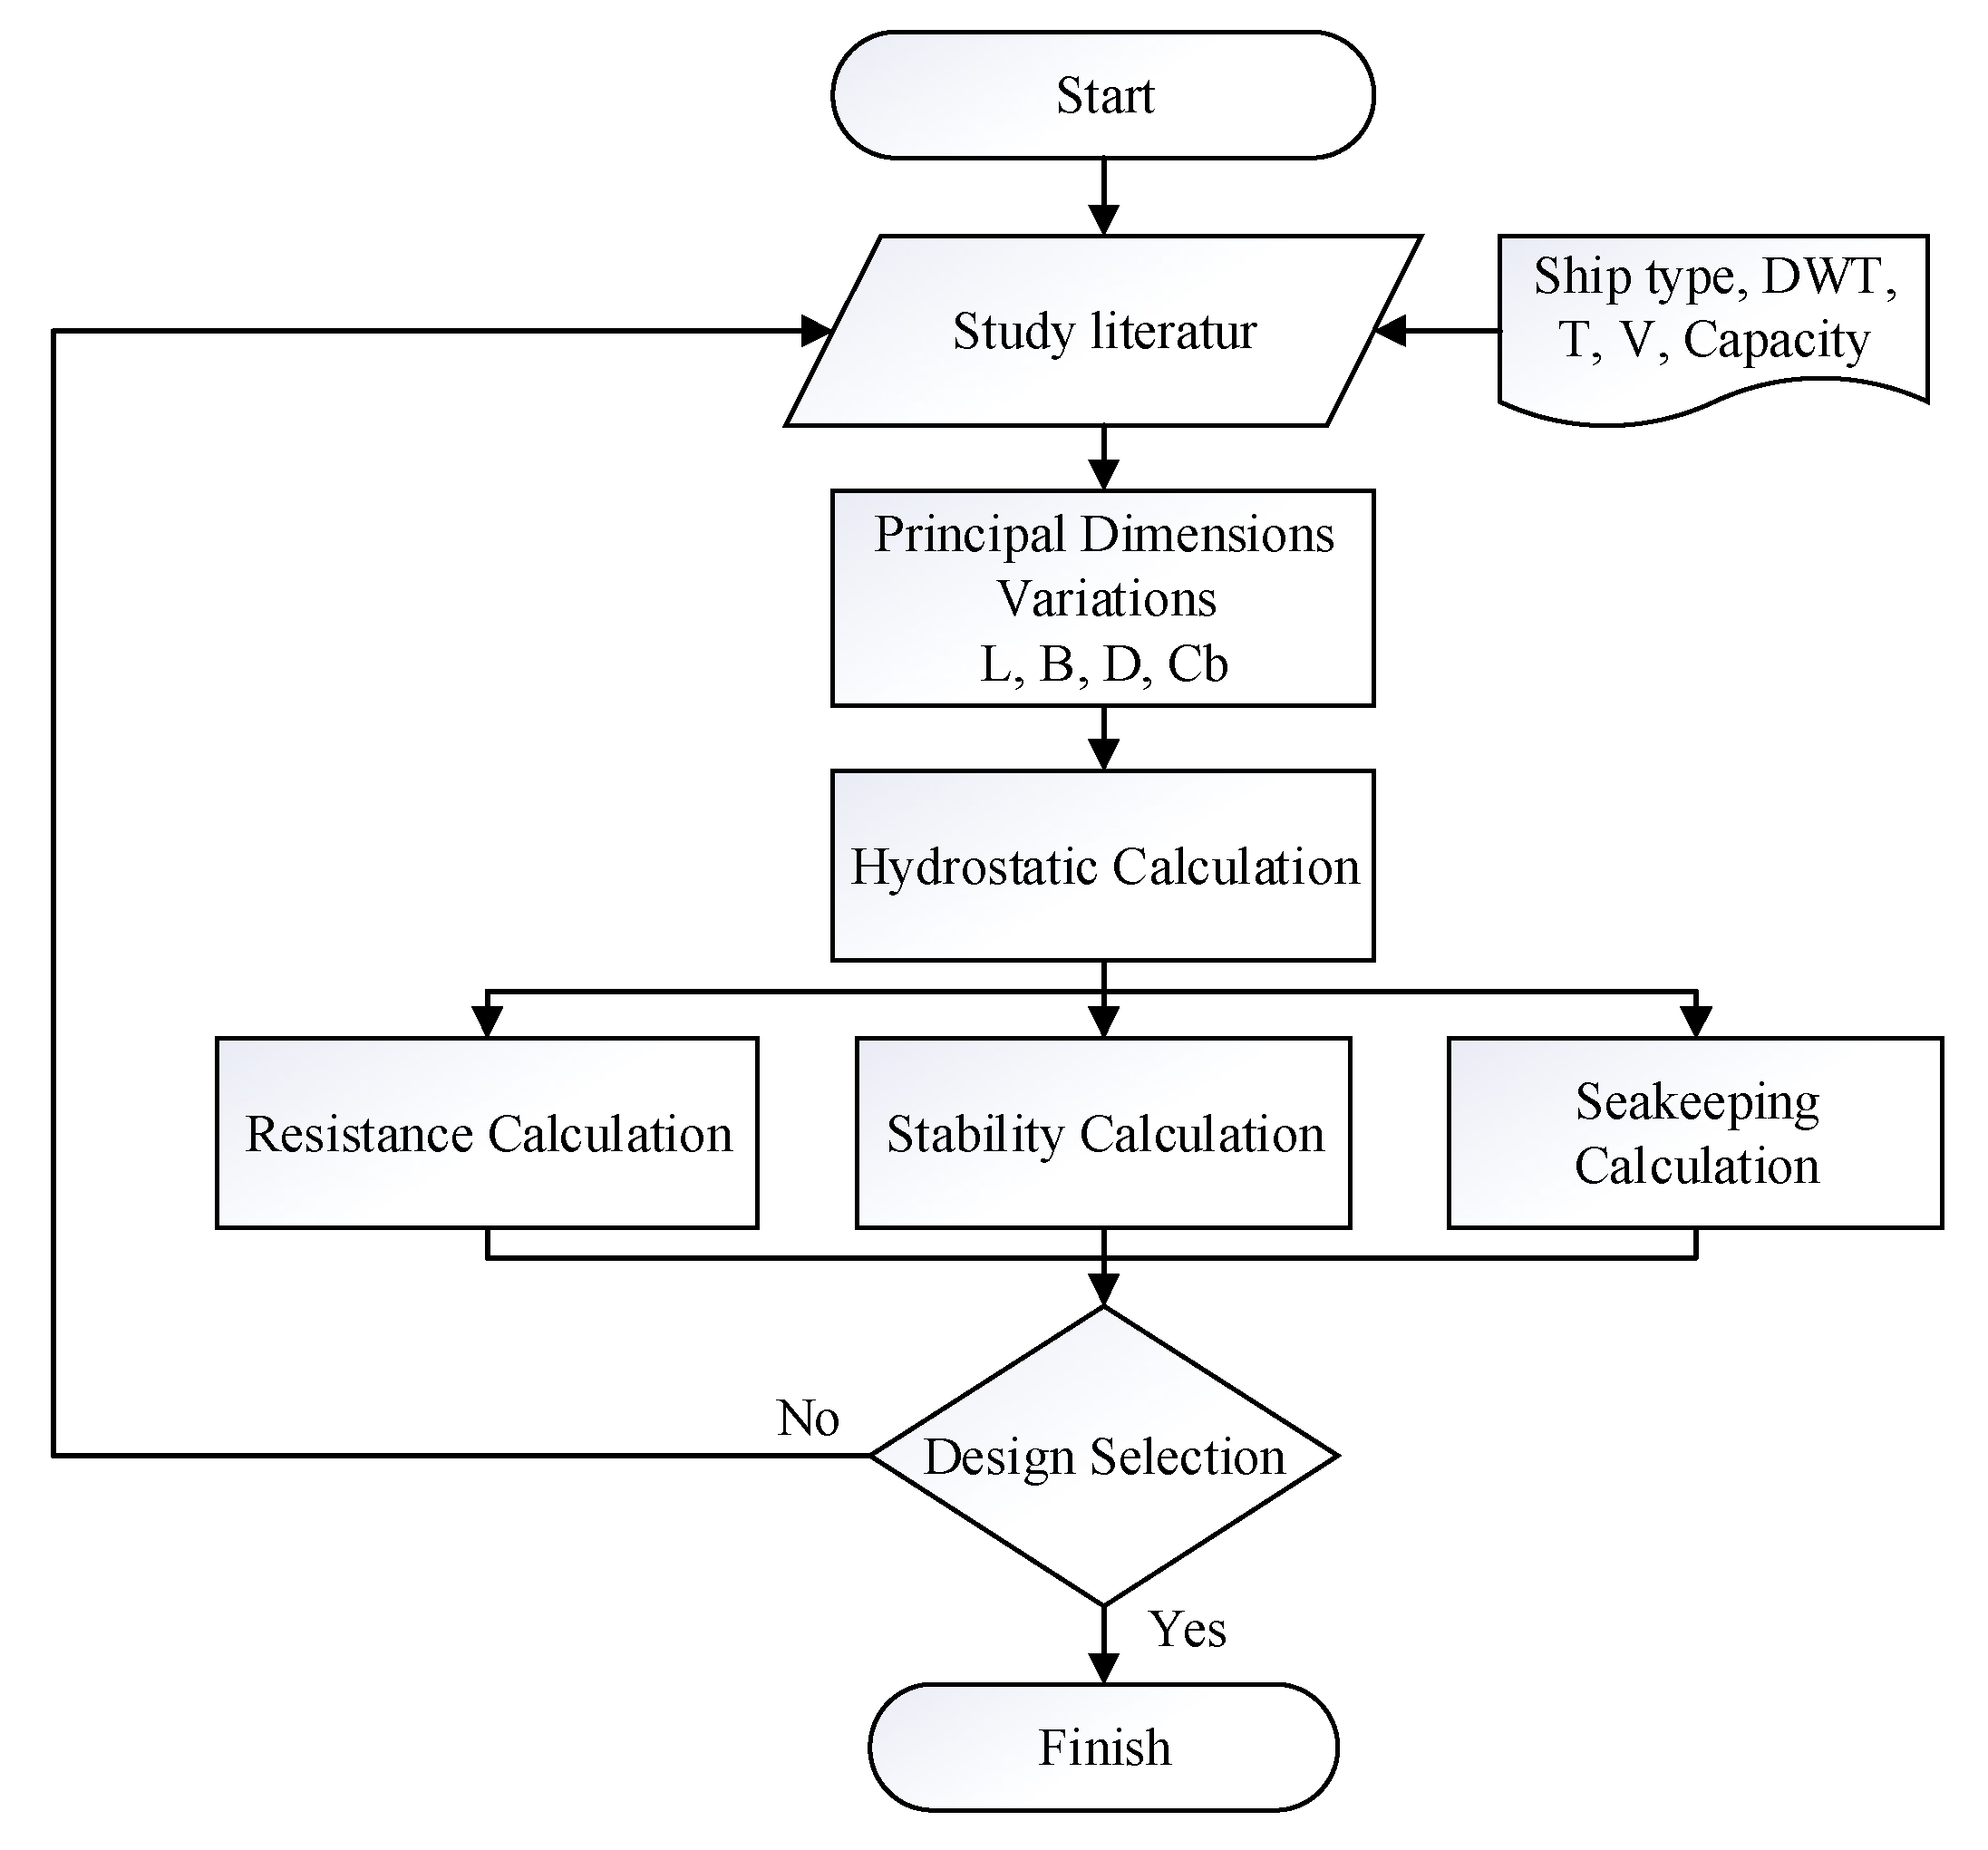
Figure 2.
Types of ship resistance.
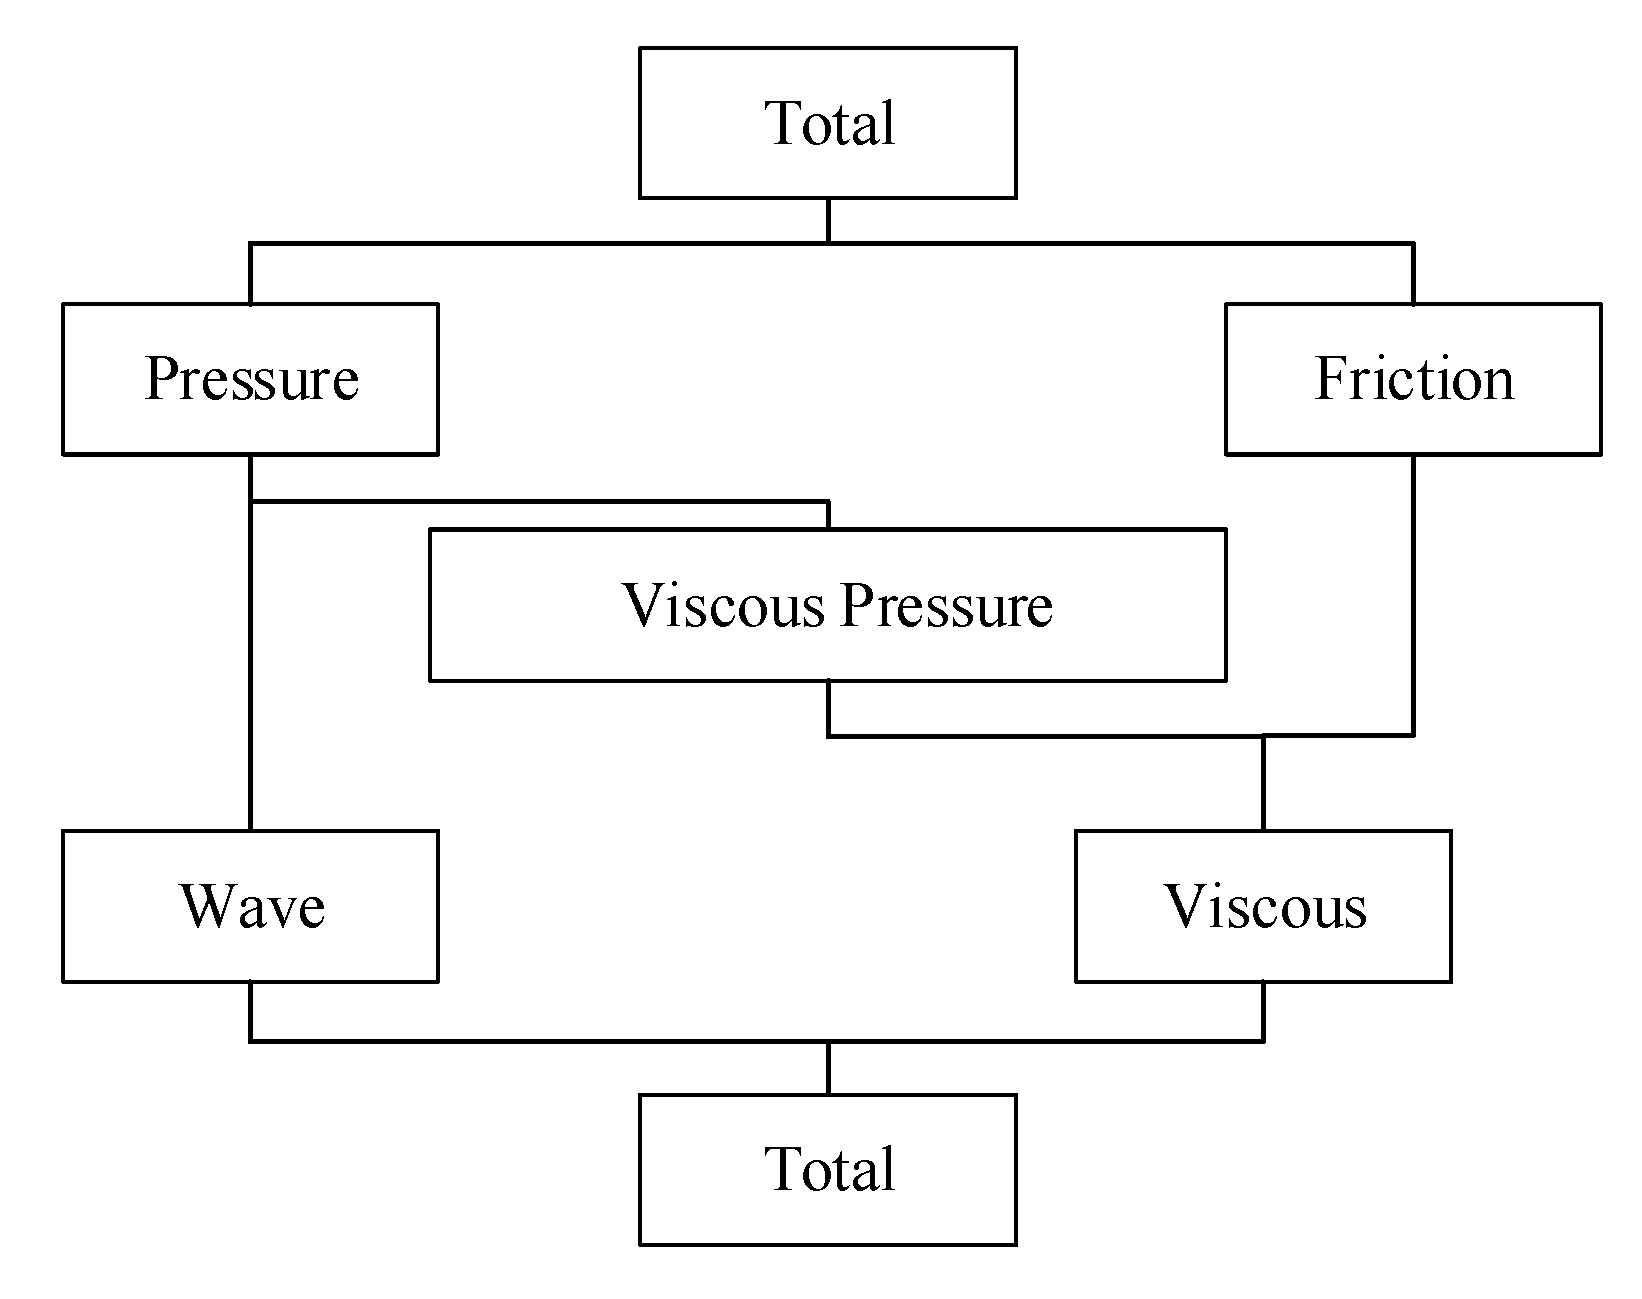
Figure 3.
Point of stability on the ship.
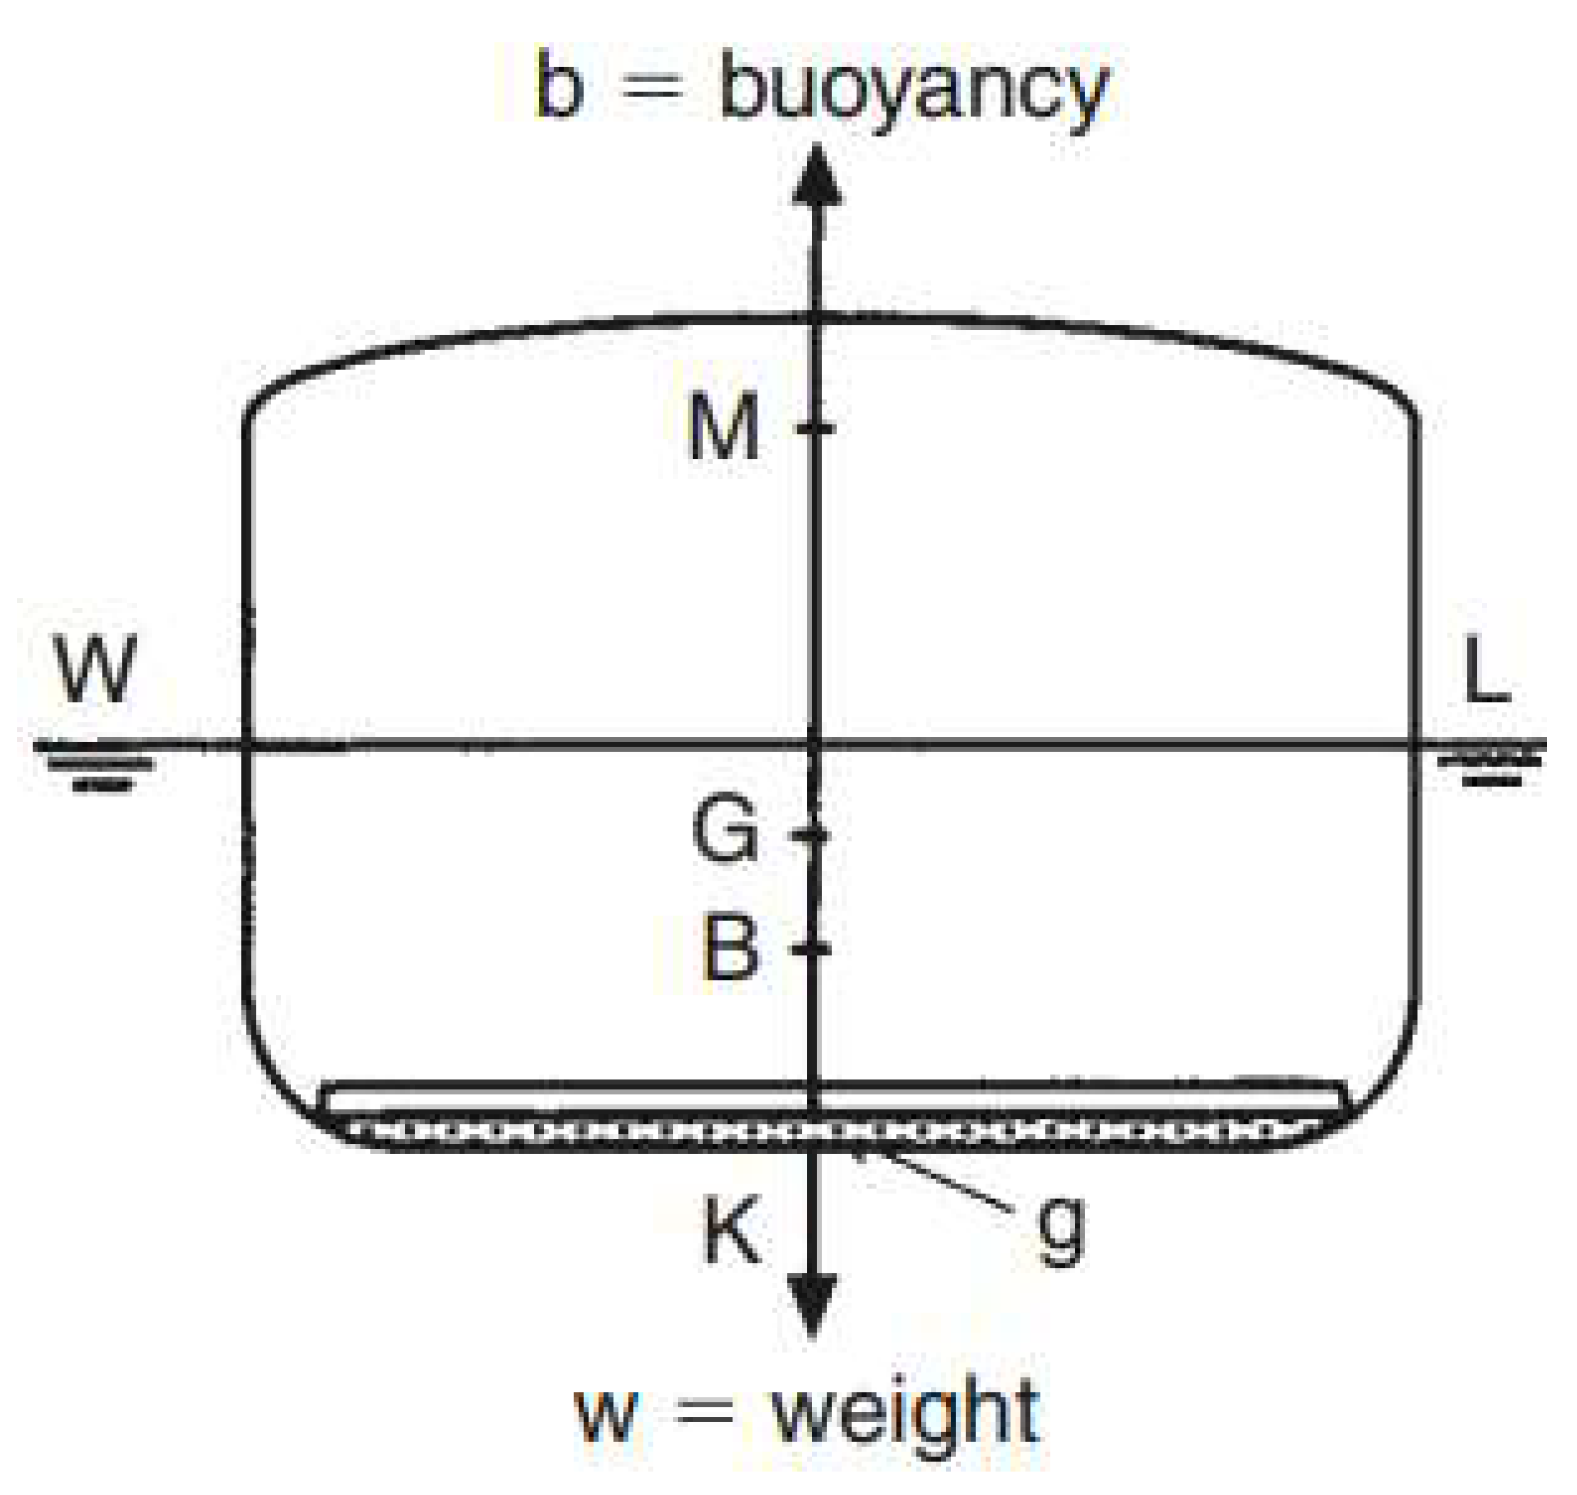
Figure 4.
Movement of the ship’s 6 degrees of freedom.
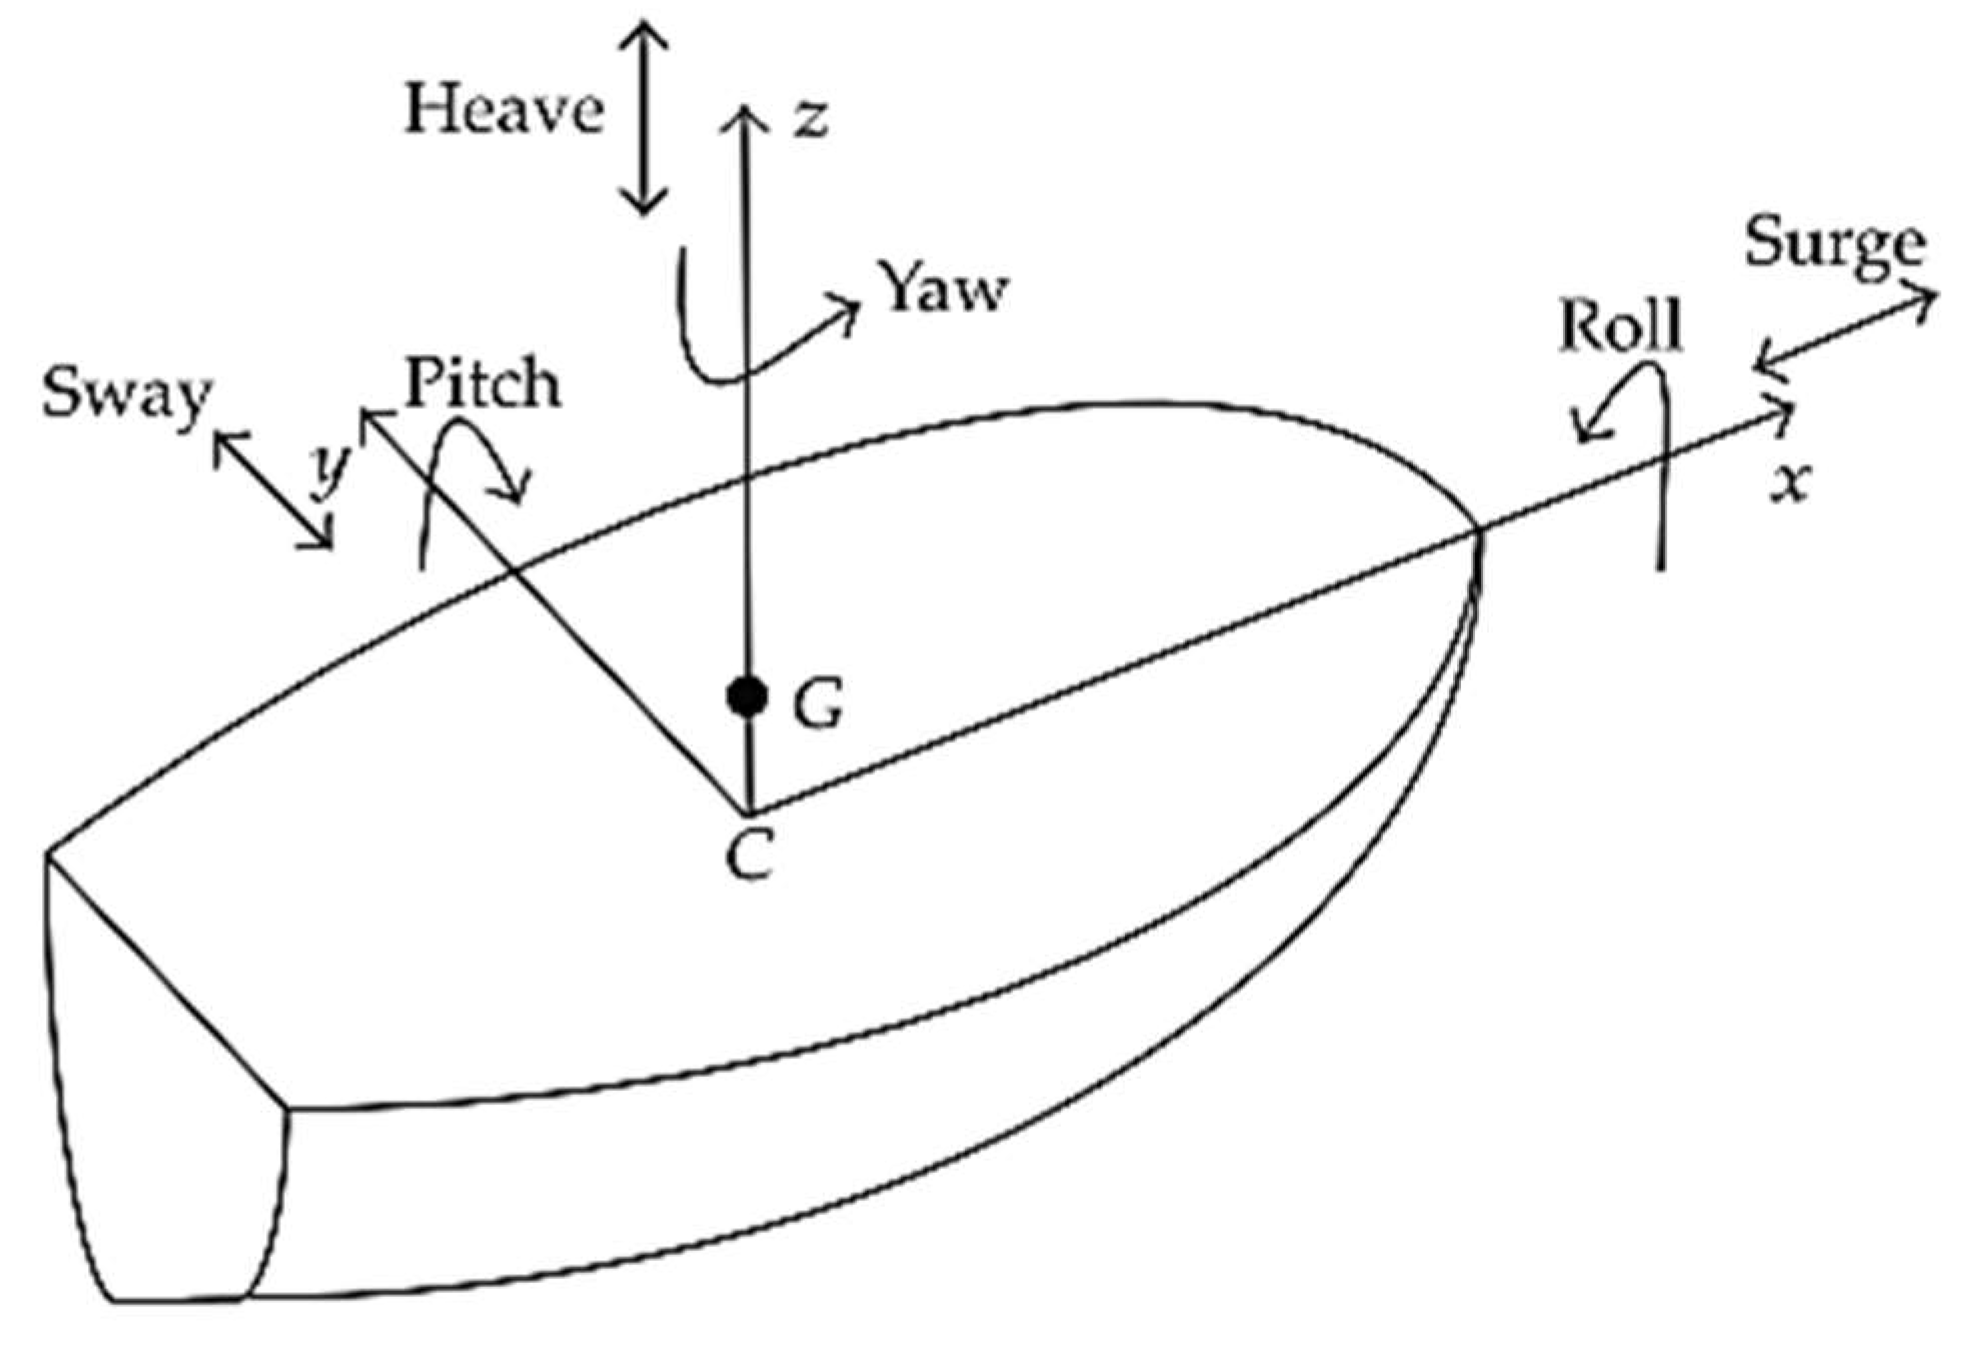
Figure 5.
Patrol boat 3D hull designs: (a) high-speed rescue craft (12 m); (b) SMIT patrol boat; (c) lightweight rescue craft (13 m); (d) fast police boat (15 m); (e) Aresa 1300 Sentinel RHIB.
Figure 5.
Patrol boat 3D hull designs: (a) high-speed rescue craft (12 m); (b) SMIT patrol boat; (c) lightweight rescue craft (13 m); (d) fast police boat (15 m); (e) Aresa 1300 Sentinel RHIB.
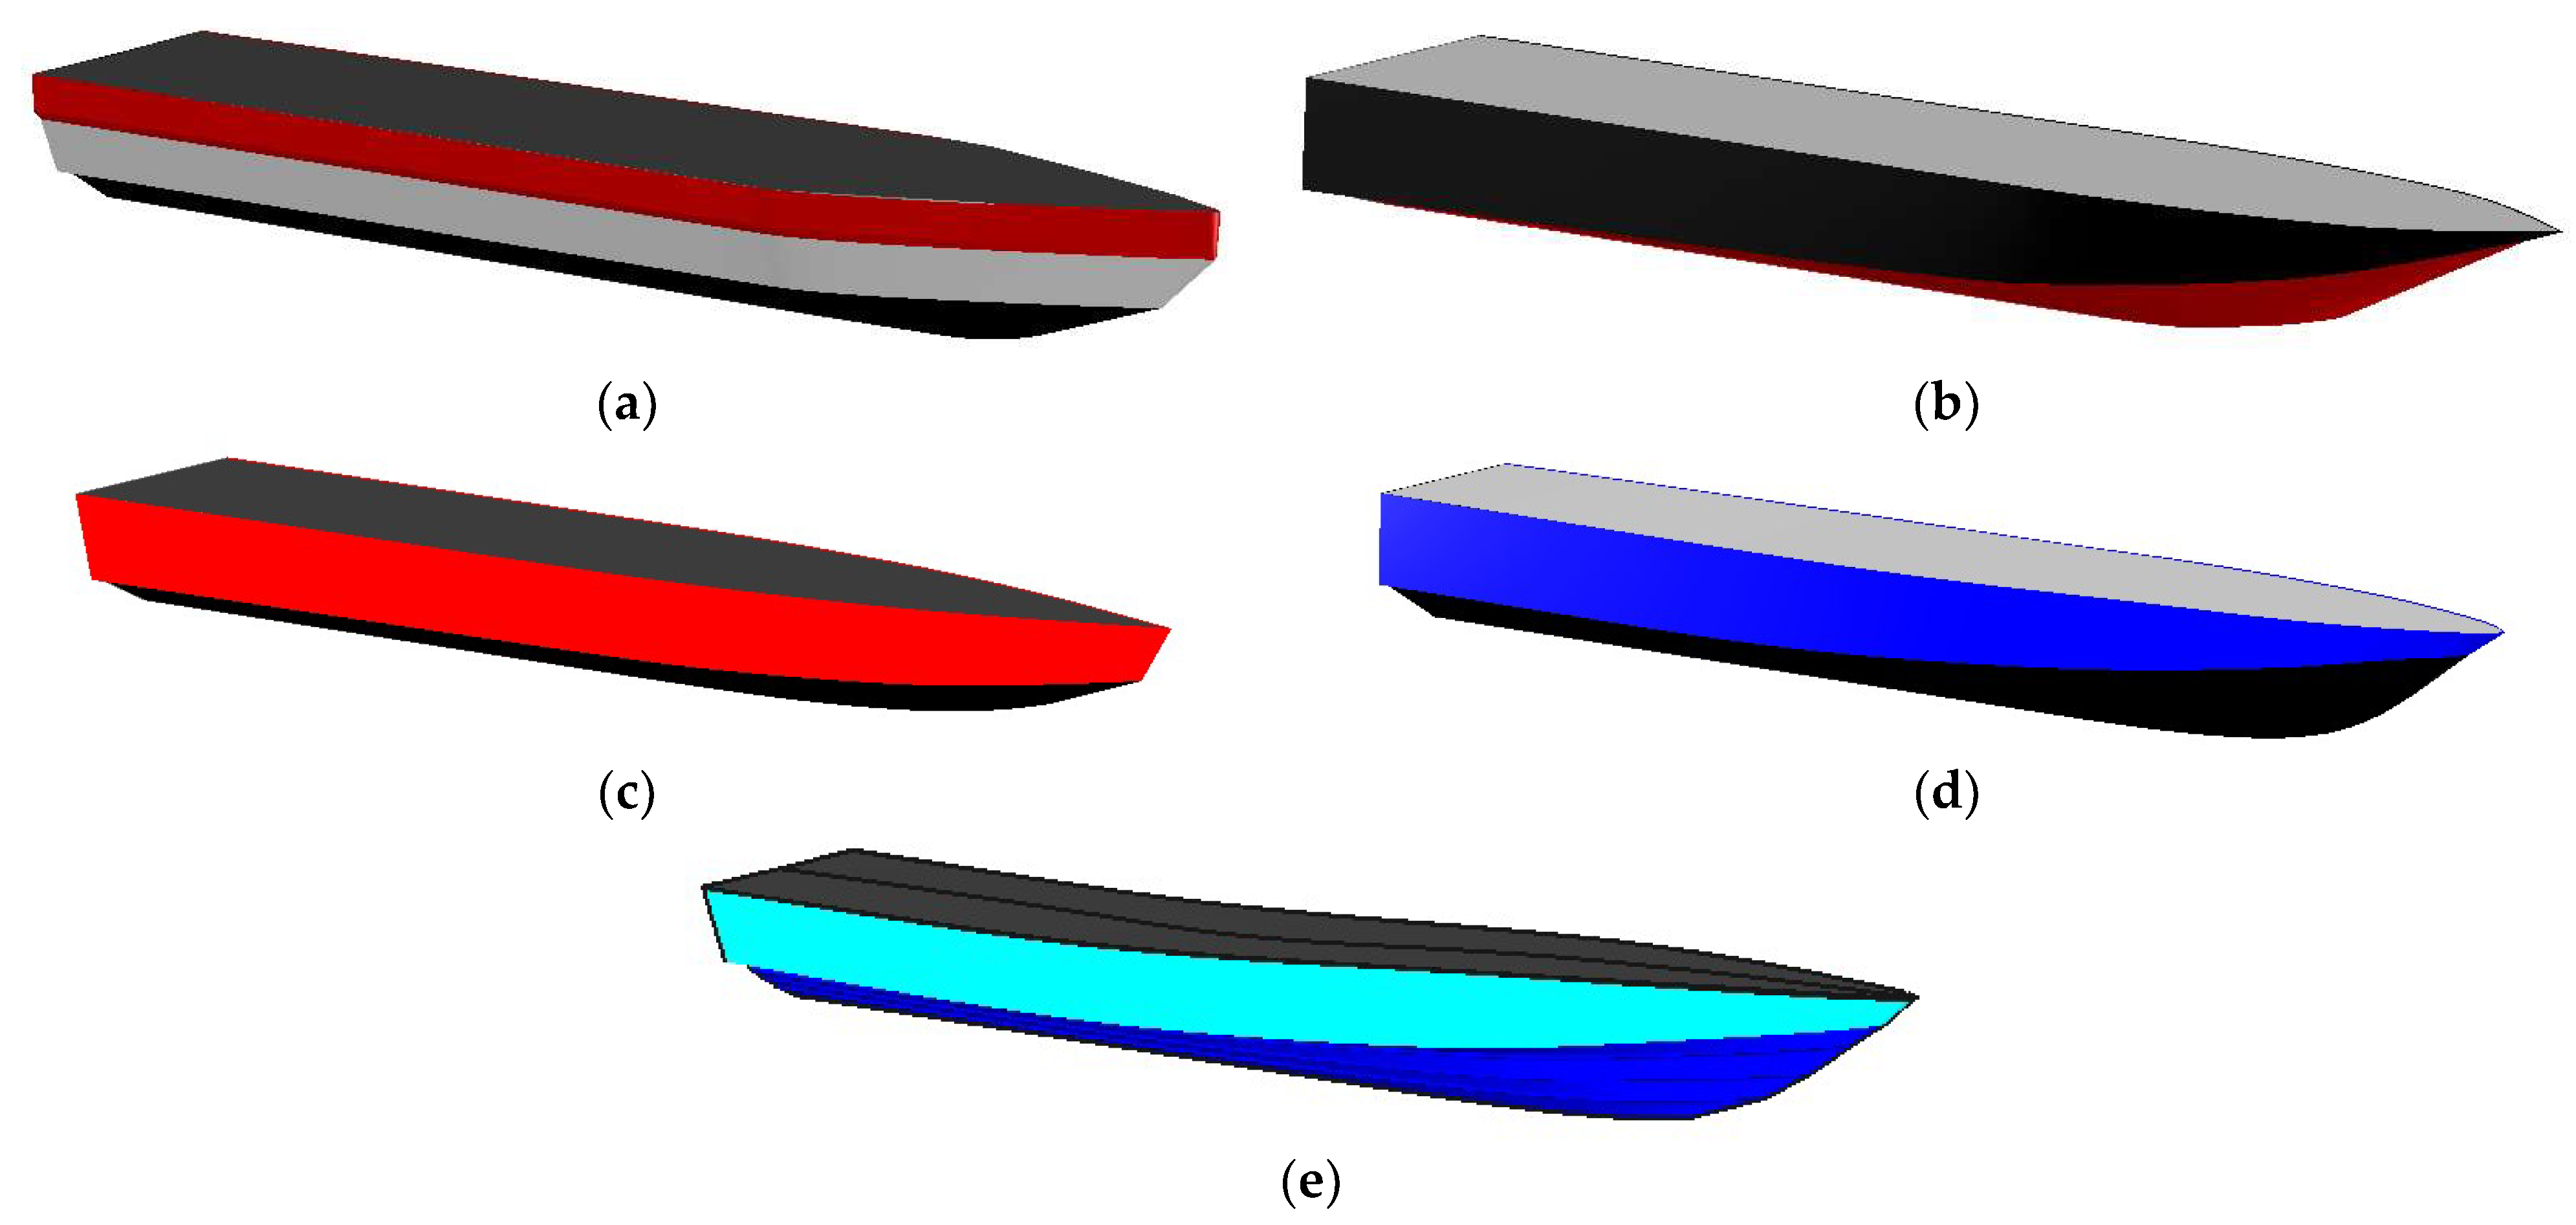
Figure 6.
Graphs of regression results: (a) length vs. DWT; (b) beam vs. DWT; (c) draft vs. DWT; (d) depth vs. DWT.
Figure 6.
Graphs of regression results: (a) length vs. DWT; (b) beam vs. DWT; (c) draft vs. DWT; (d) depth vs. DWT.
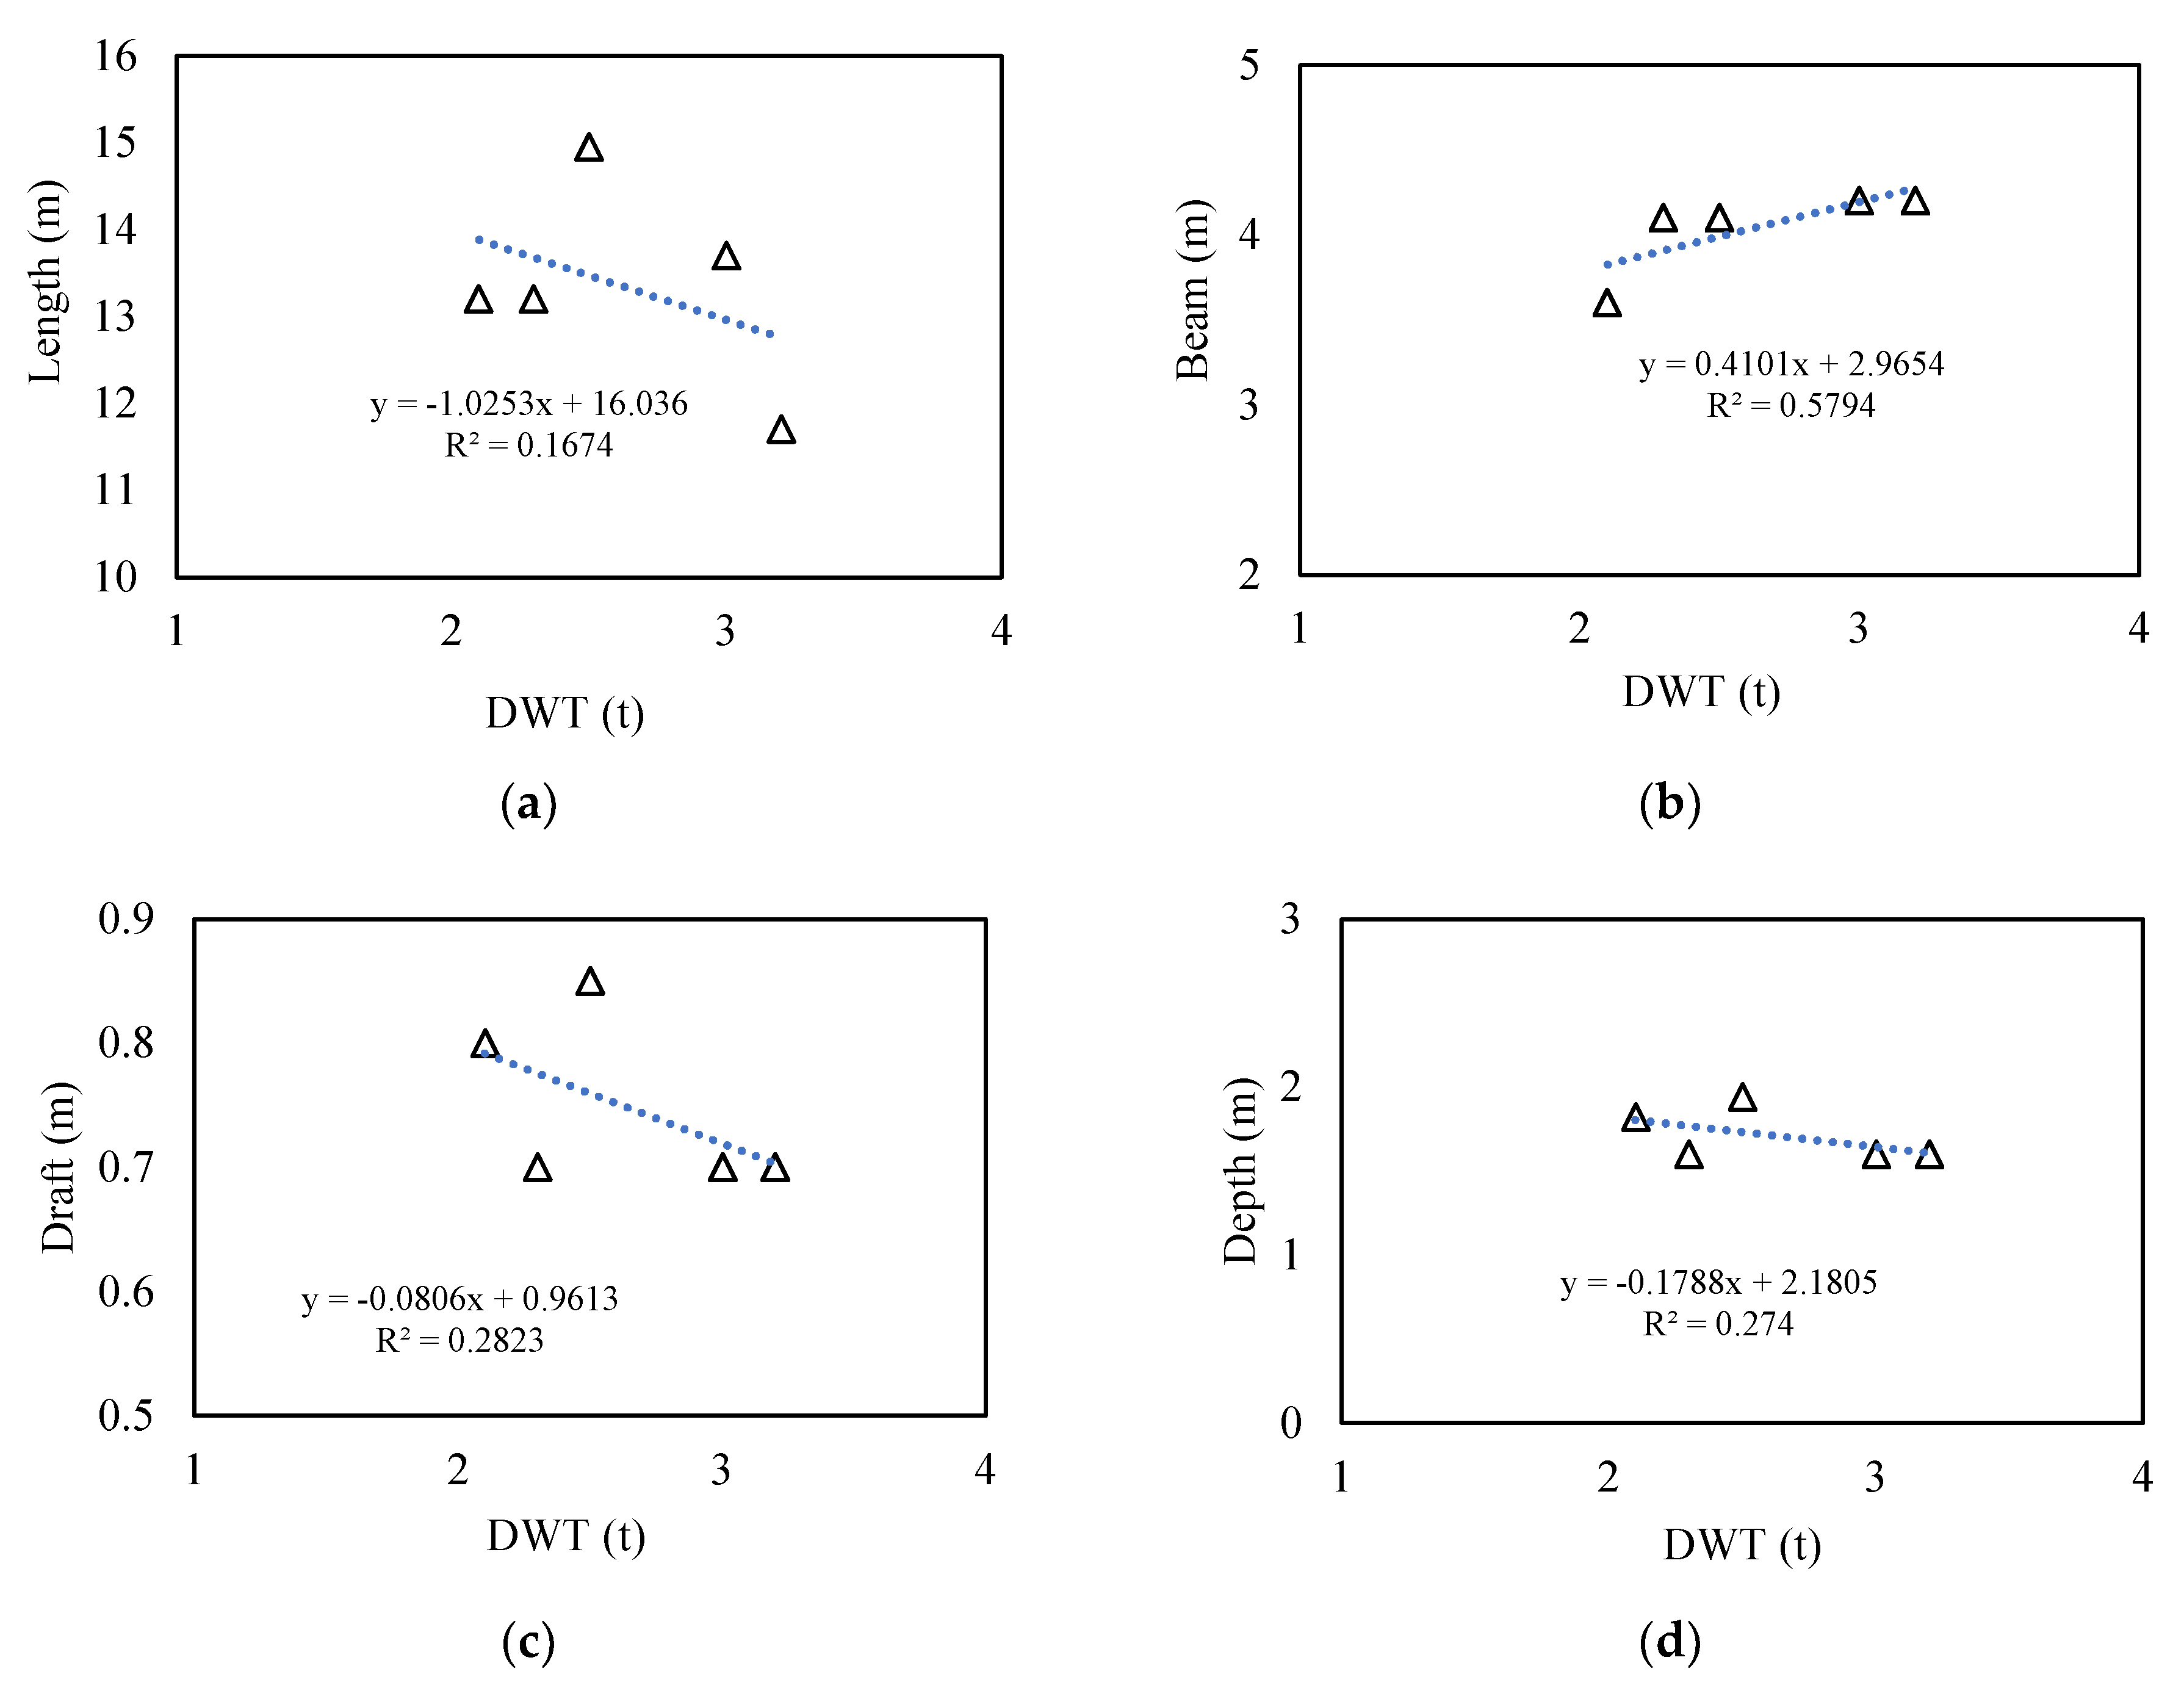
Figure 7.
3D hull designs from regression results: (a) Regression I; (b) Regression II; (c) Regression III. The lines plan of regression-based hulls is given in Appendix B.
Figure 7.
3D hull designs from regression results: (a) Regression I; (b) Regression II; (c) Regression III. The lines plan of regression-based hulls is given in Appendix B.
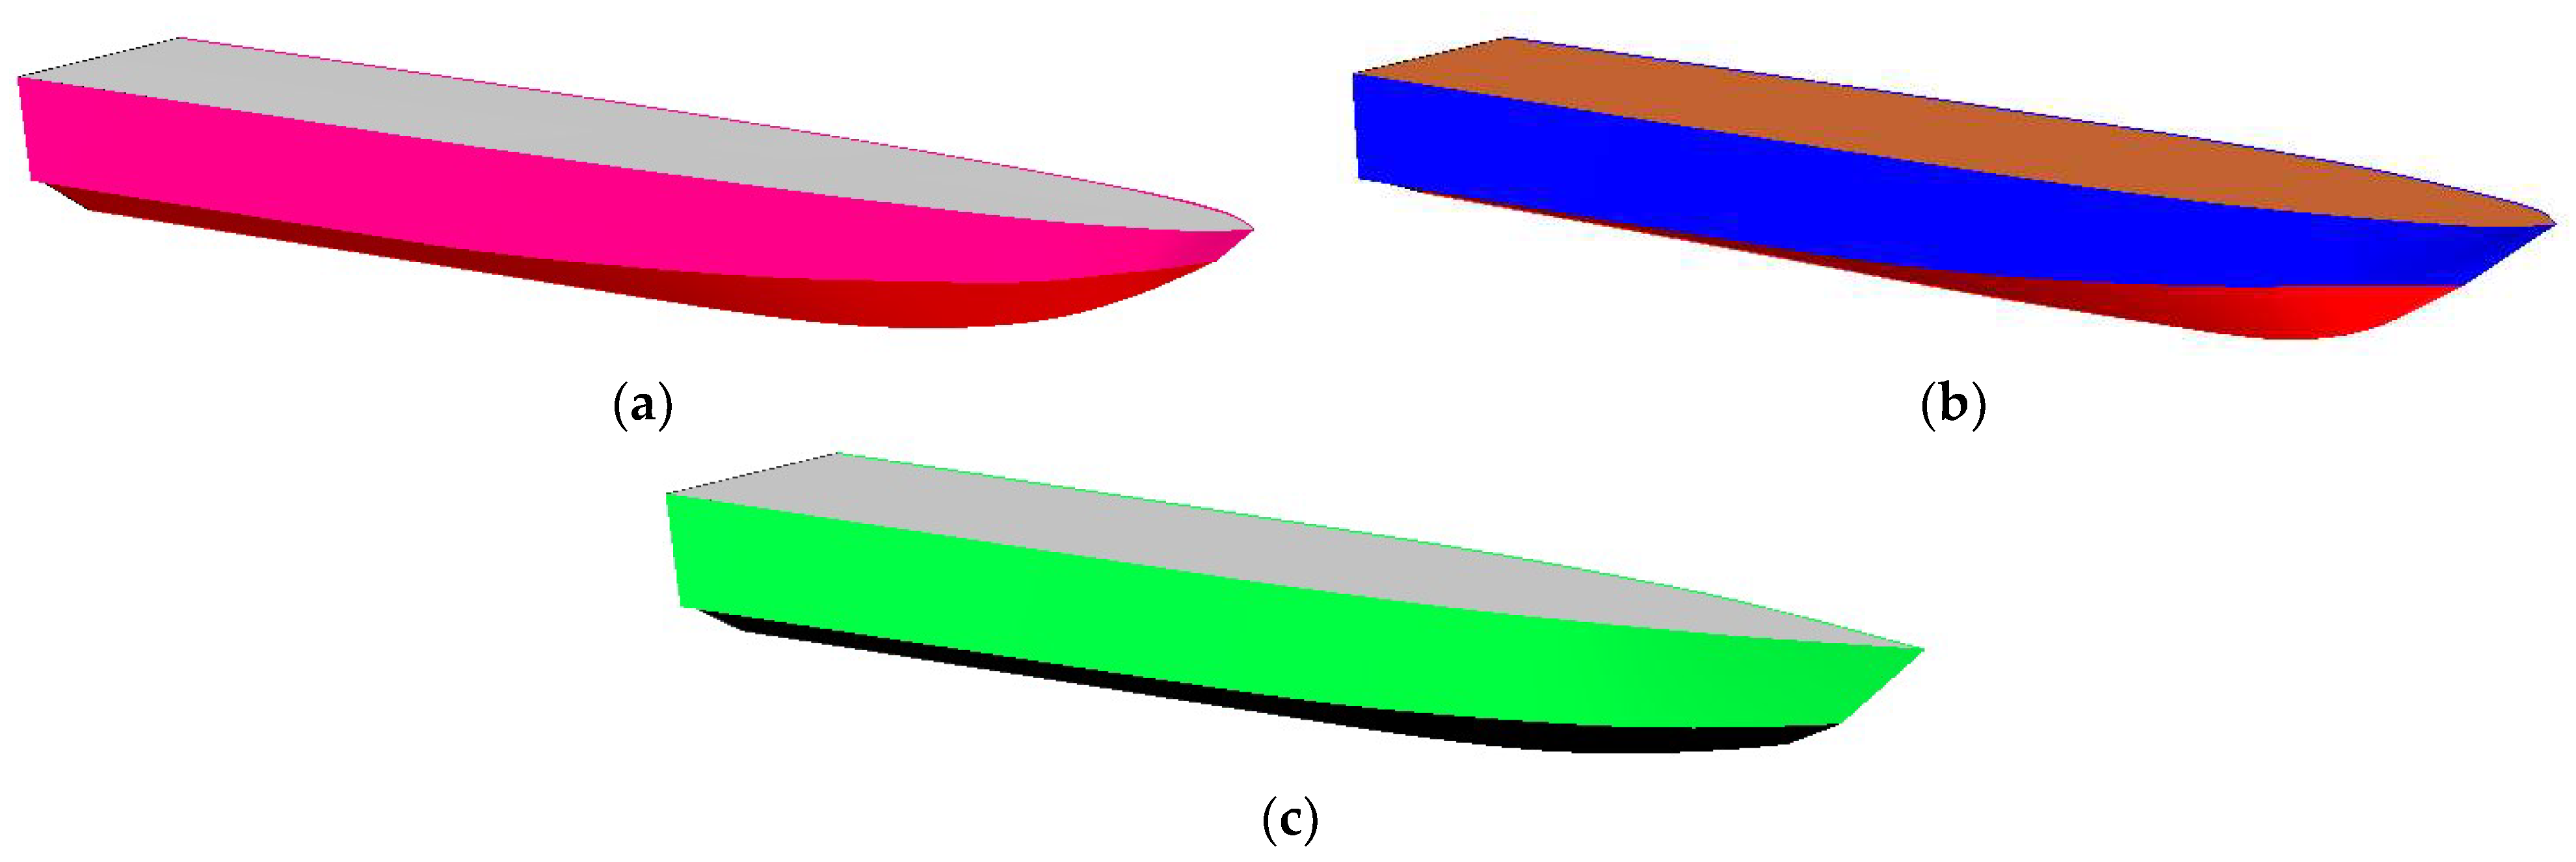
Figure 8.
Graphs of reference ship resistance assessment results: (a) speed vs. resistance; (b) speed vs. effective power.
Figure 8.
Graphs of reference ship resistance assessment results: (a) speed vs. resistance; (b) speed vs. effective power.

Figure 9.
3D hull designs that resulted from scaling: (a) Scale I; (b) Scale II; (c) Scale III. The lines plan of scaling-based hulls is given in Appendix C.
Figure 9.
3D hull designs that resulted from scaling: (a) Scale I; (b) Scale II; (c) Scale III. The lines plan of scaling-based hulls is given in Appendix C.

Figure 10.
Comparison between regression and scale models: (a) Froude number and resistance; (b) Froude number and power.
Figure 10.
Comparison between regression and scale models: (a) Froude number and resistance; (b) Froude number and power.
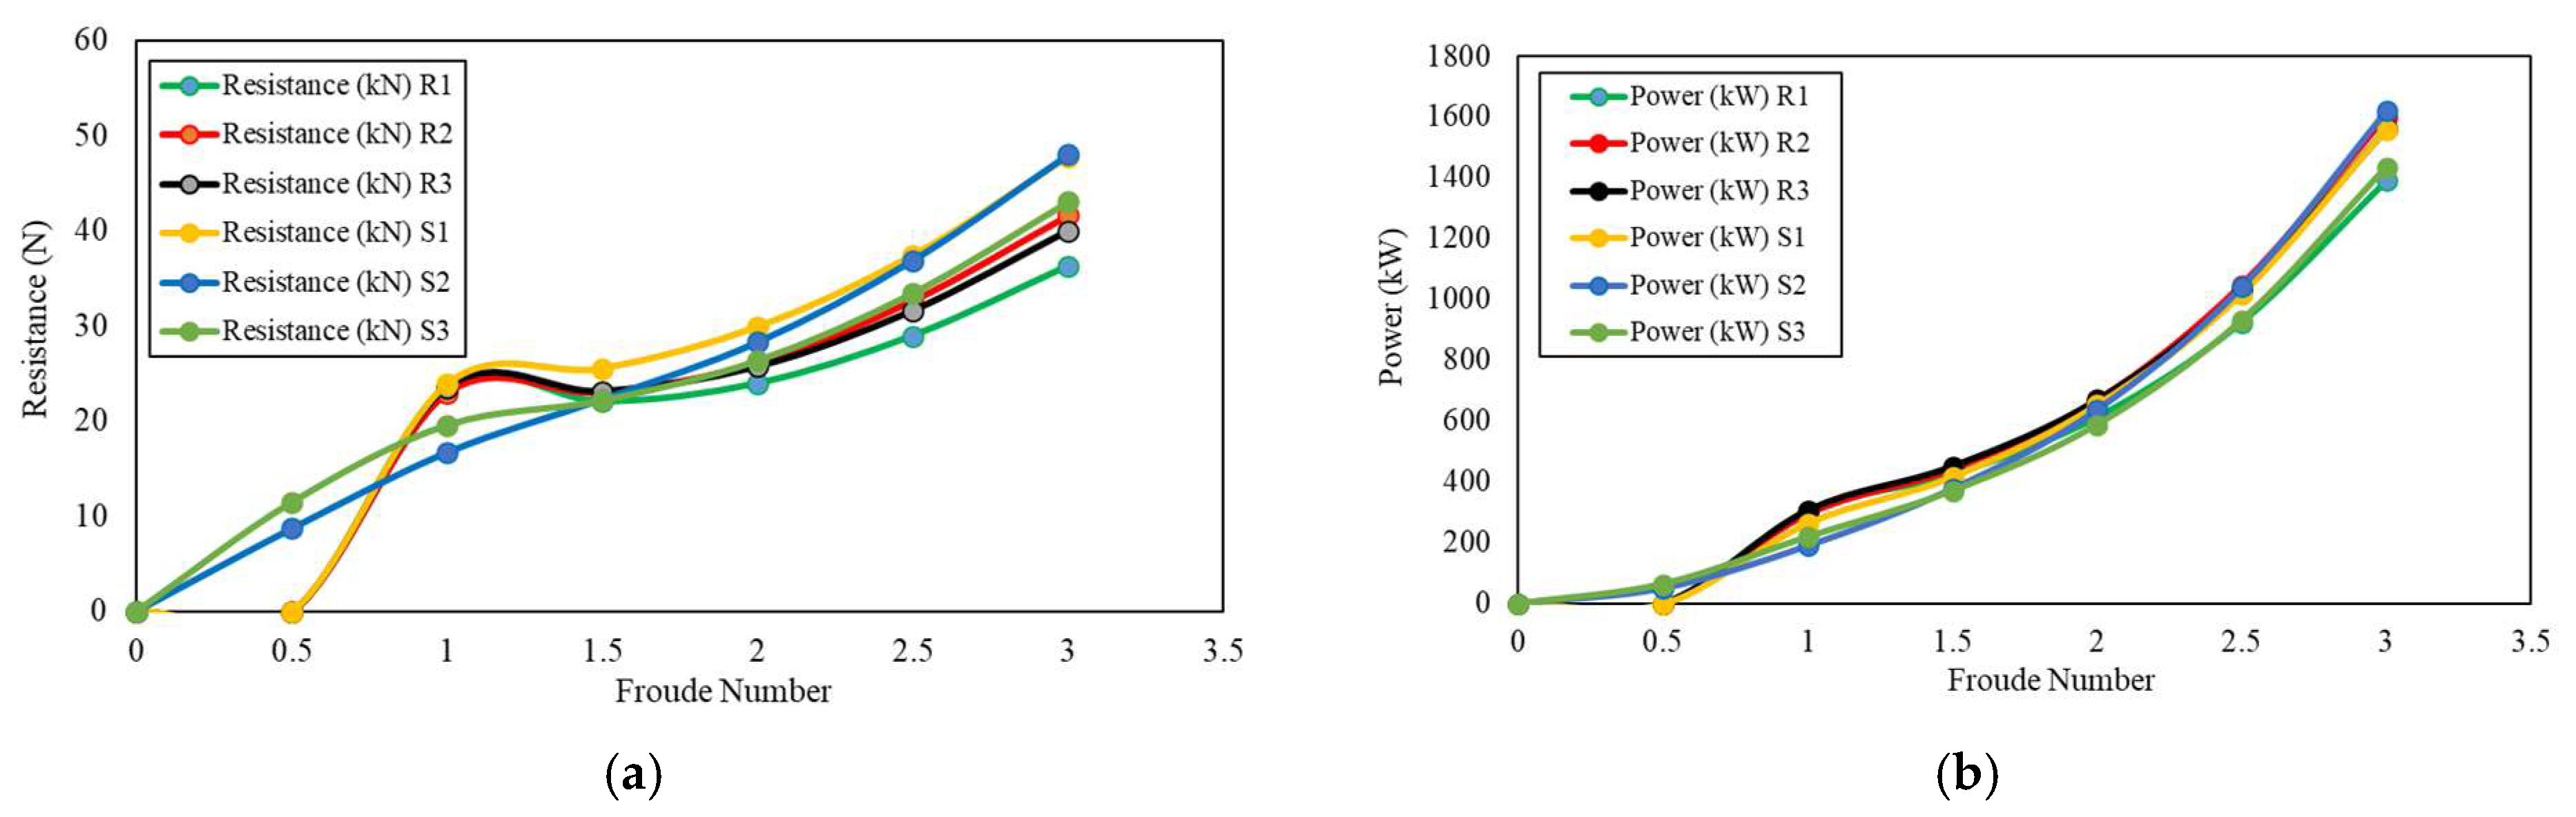
Figure 11.
Comparison of GZ values with ship’s tilt angle for regression and scaling models.
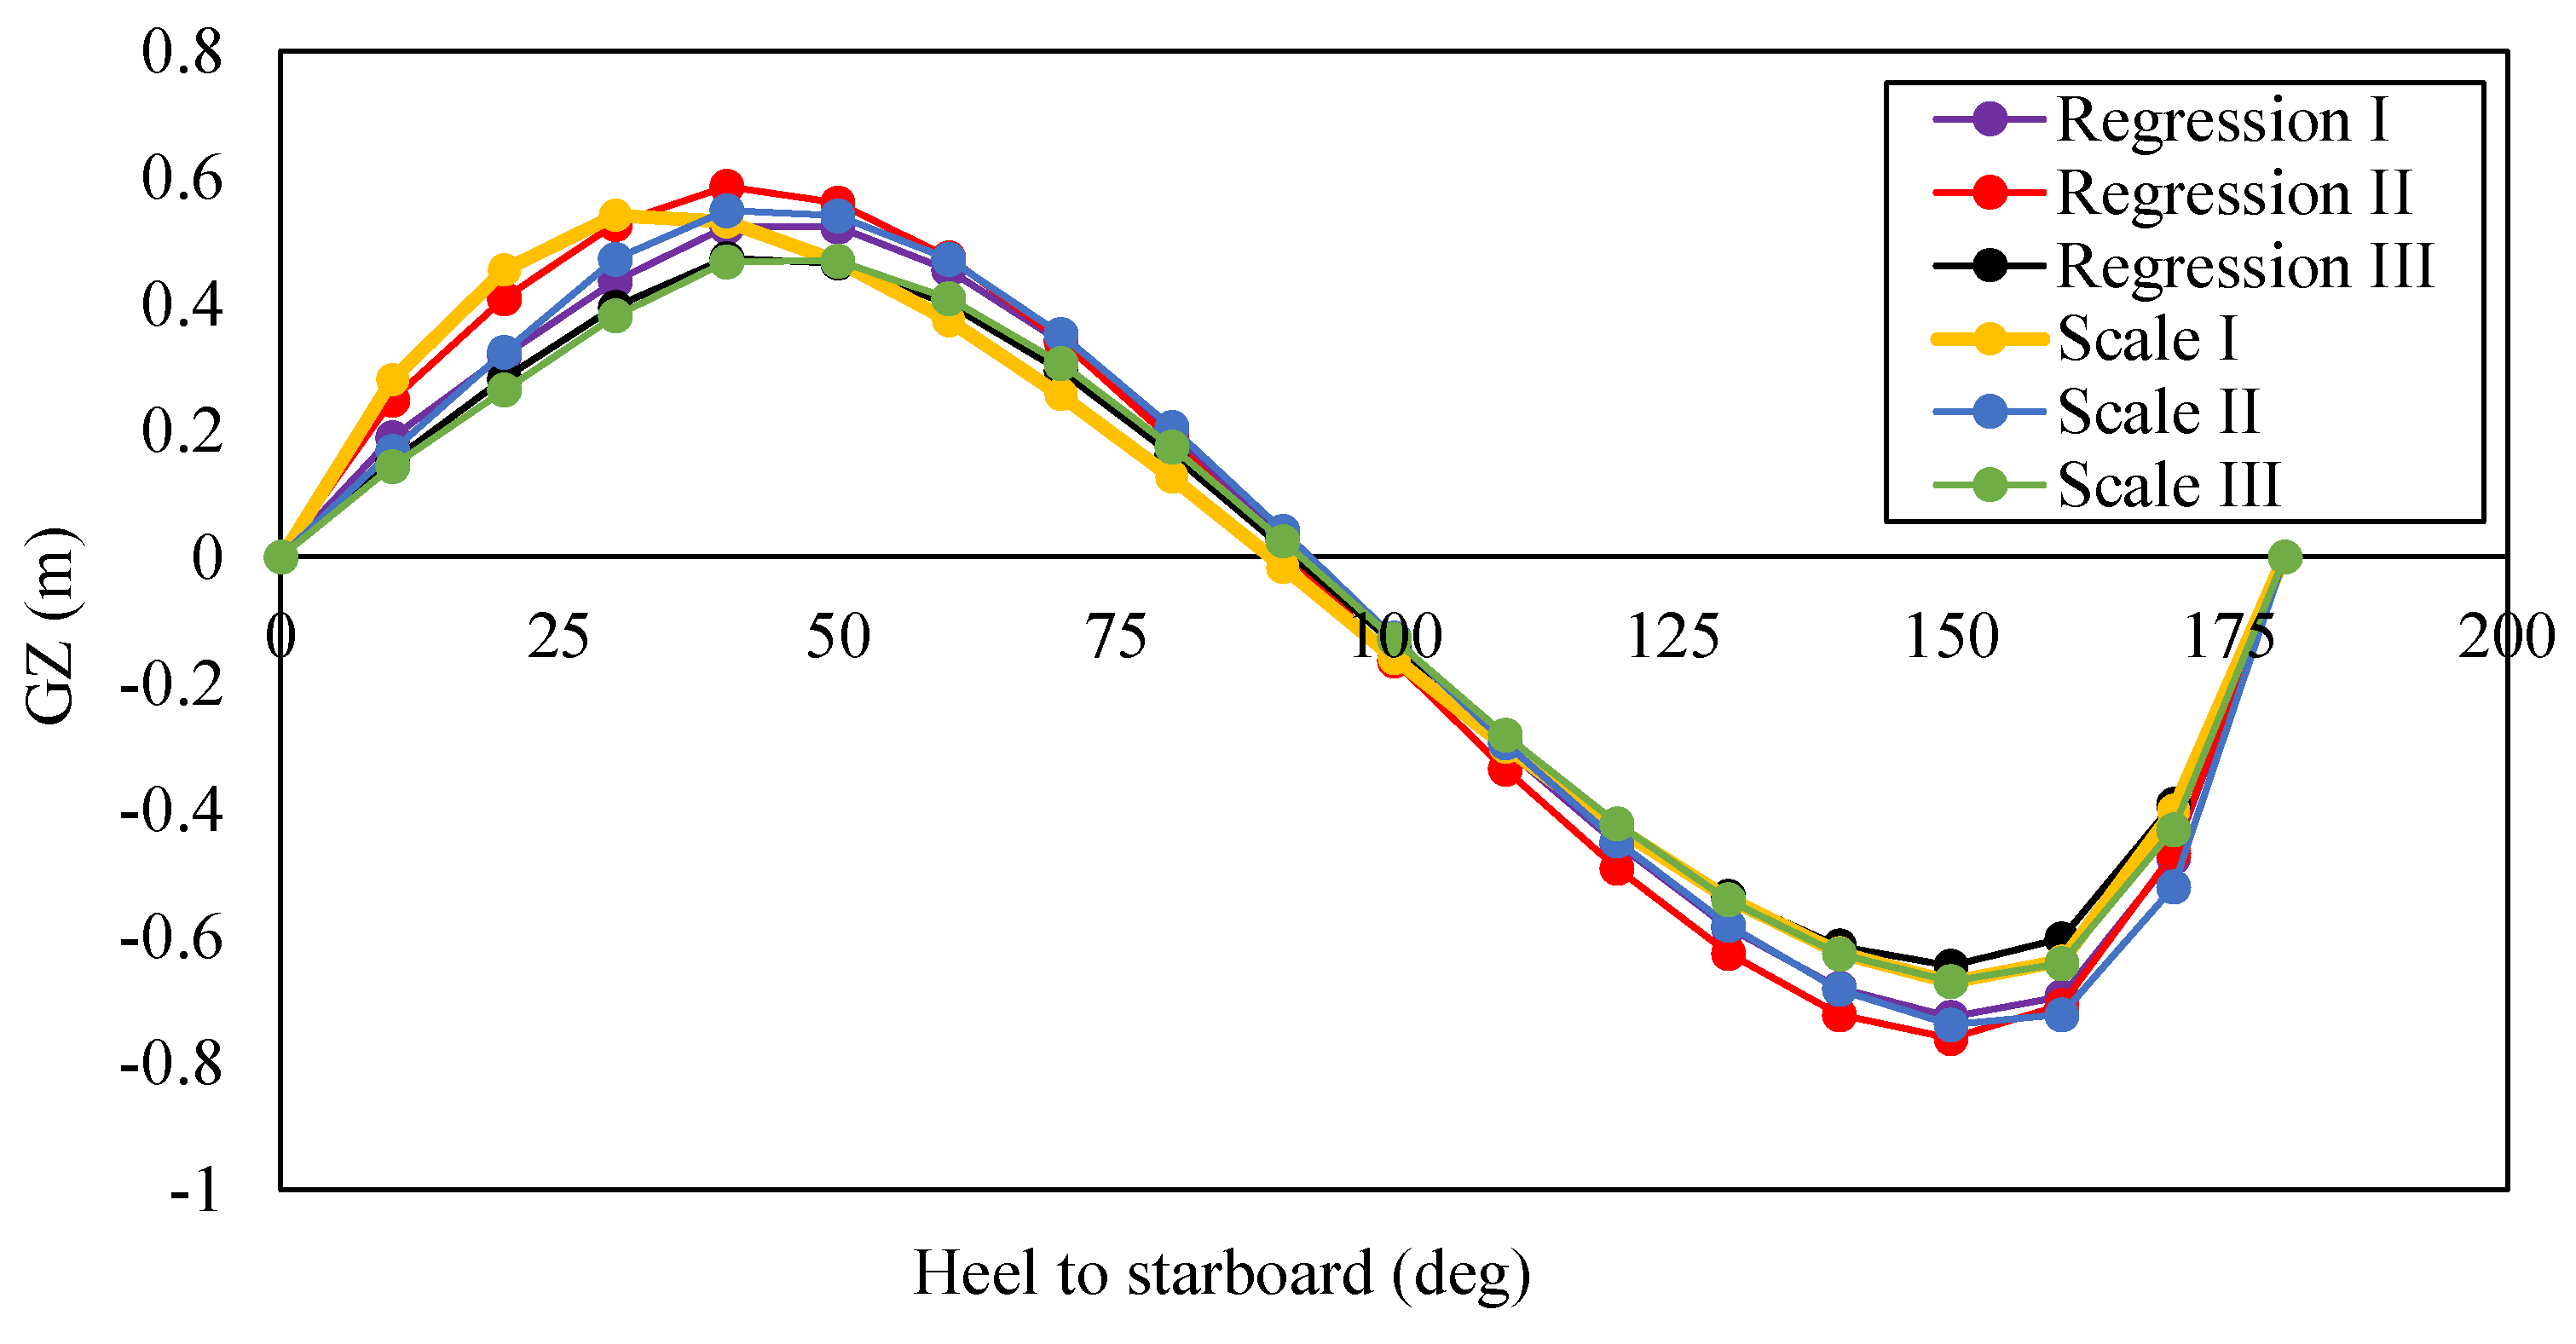
Figure 12.
Orientations of wave directions.
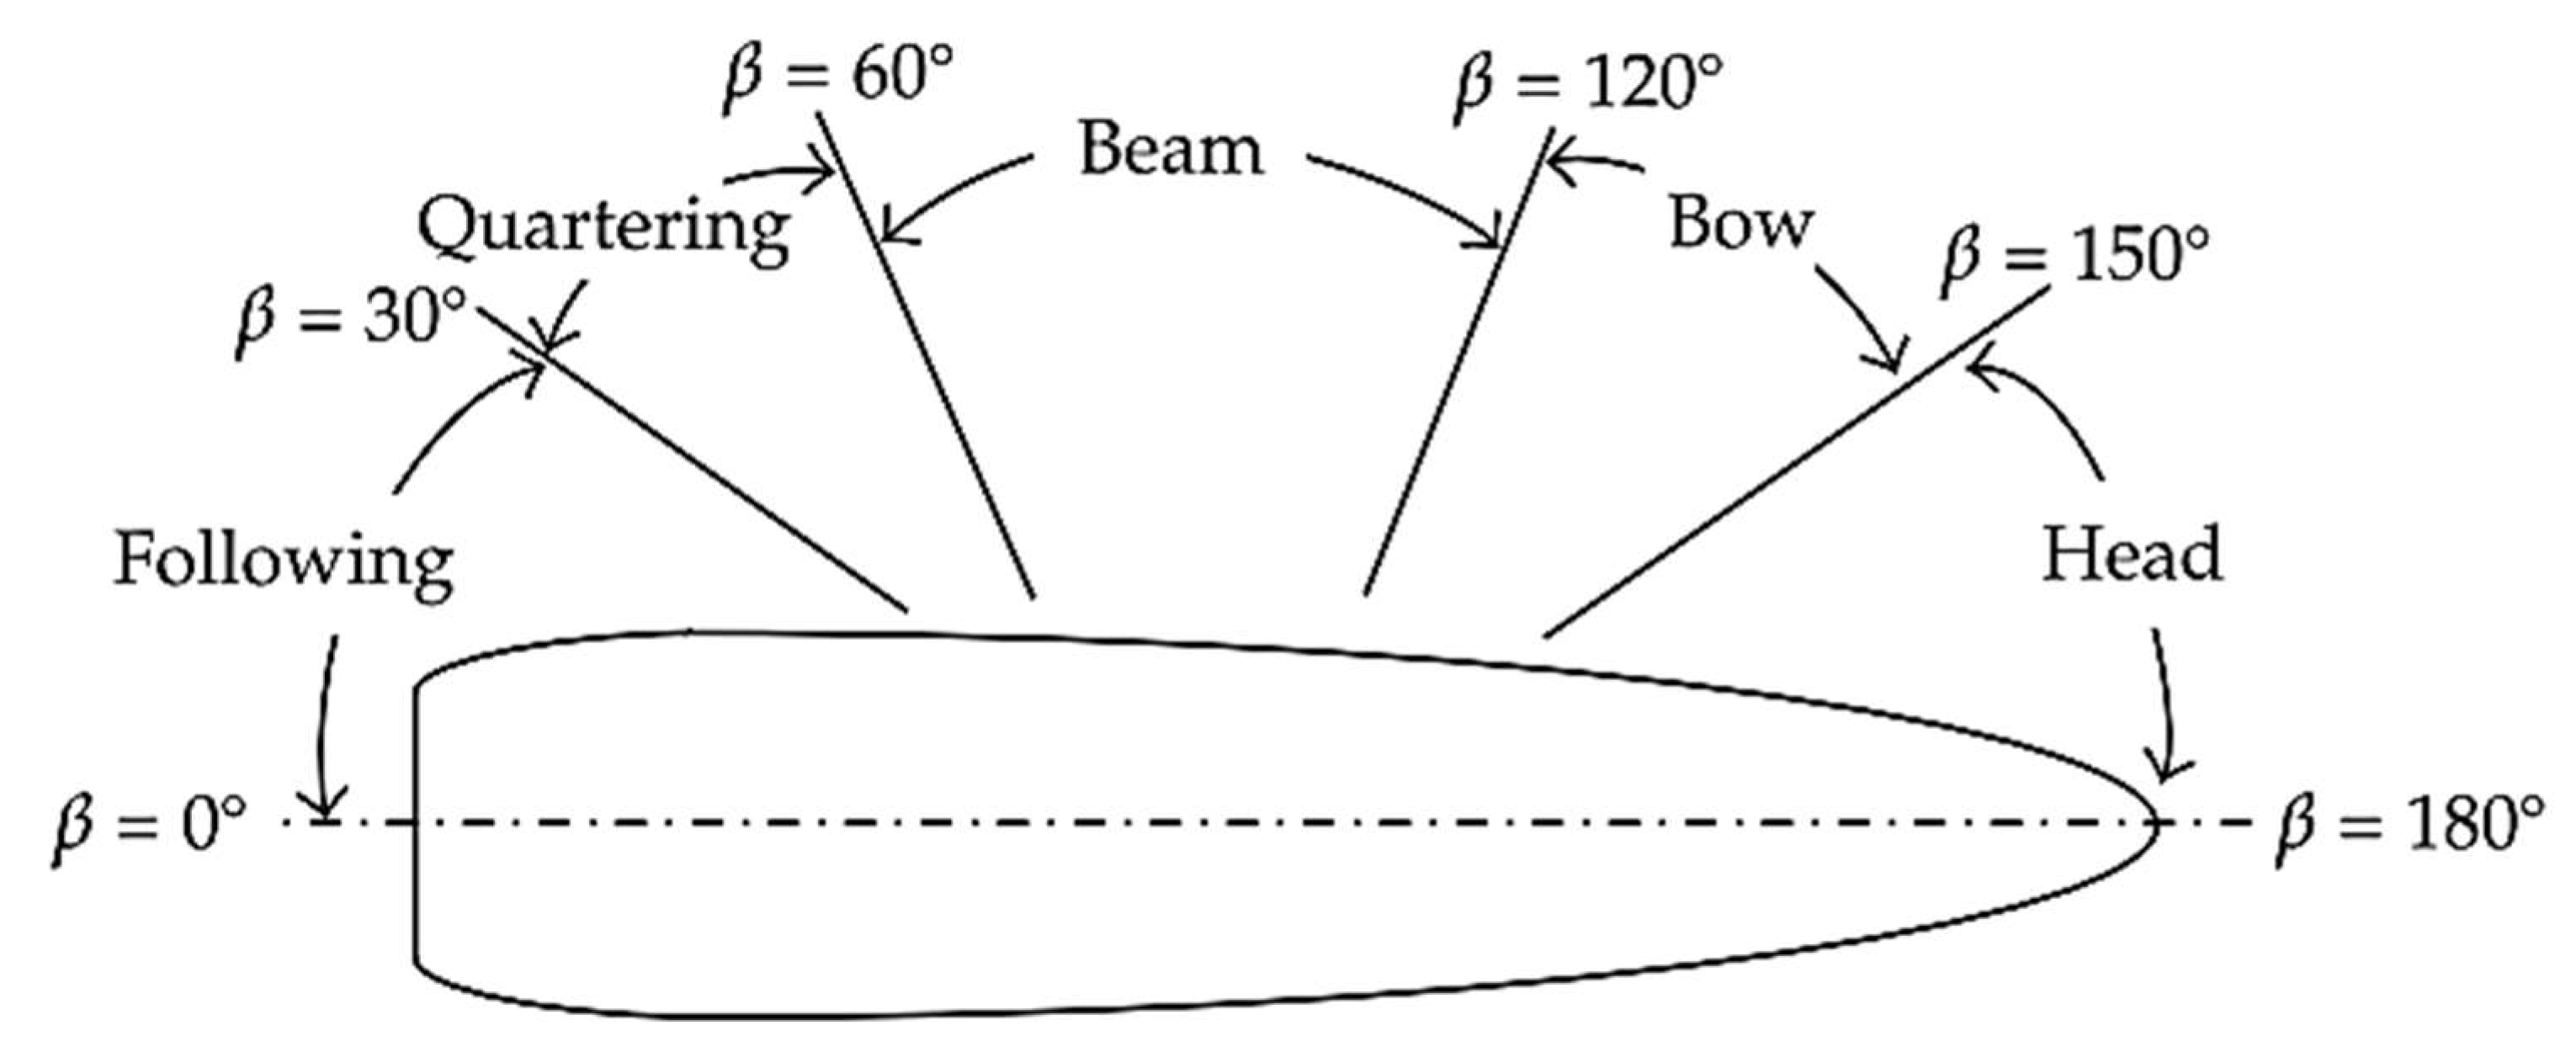
Figure 13.
RAO heaving motion graph for regression and scale models.
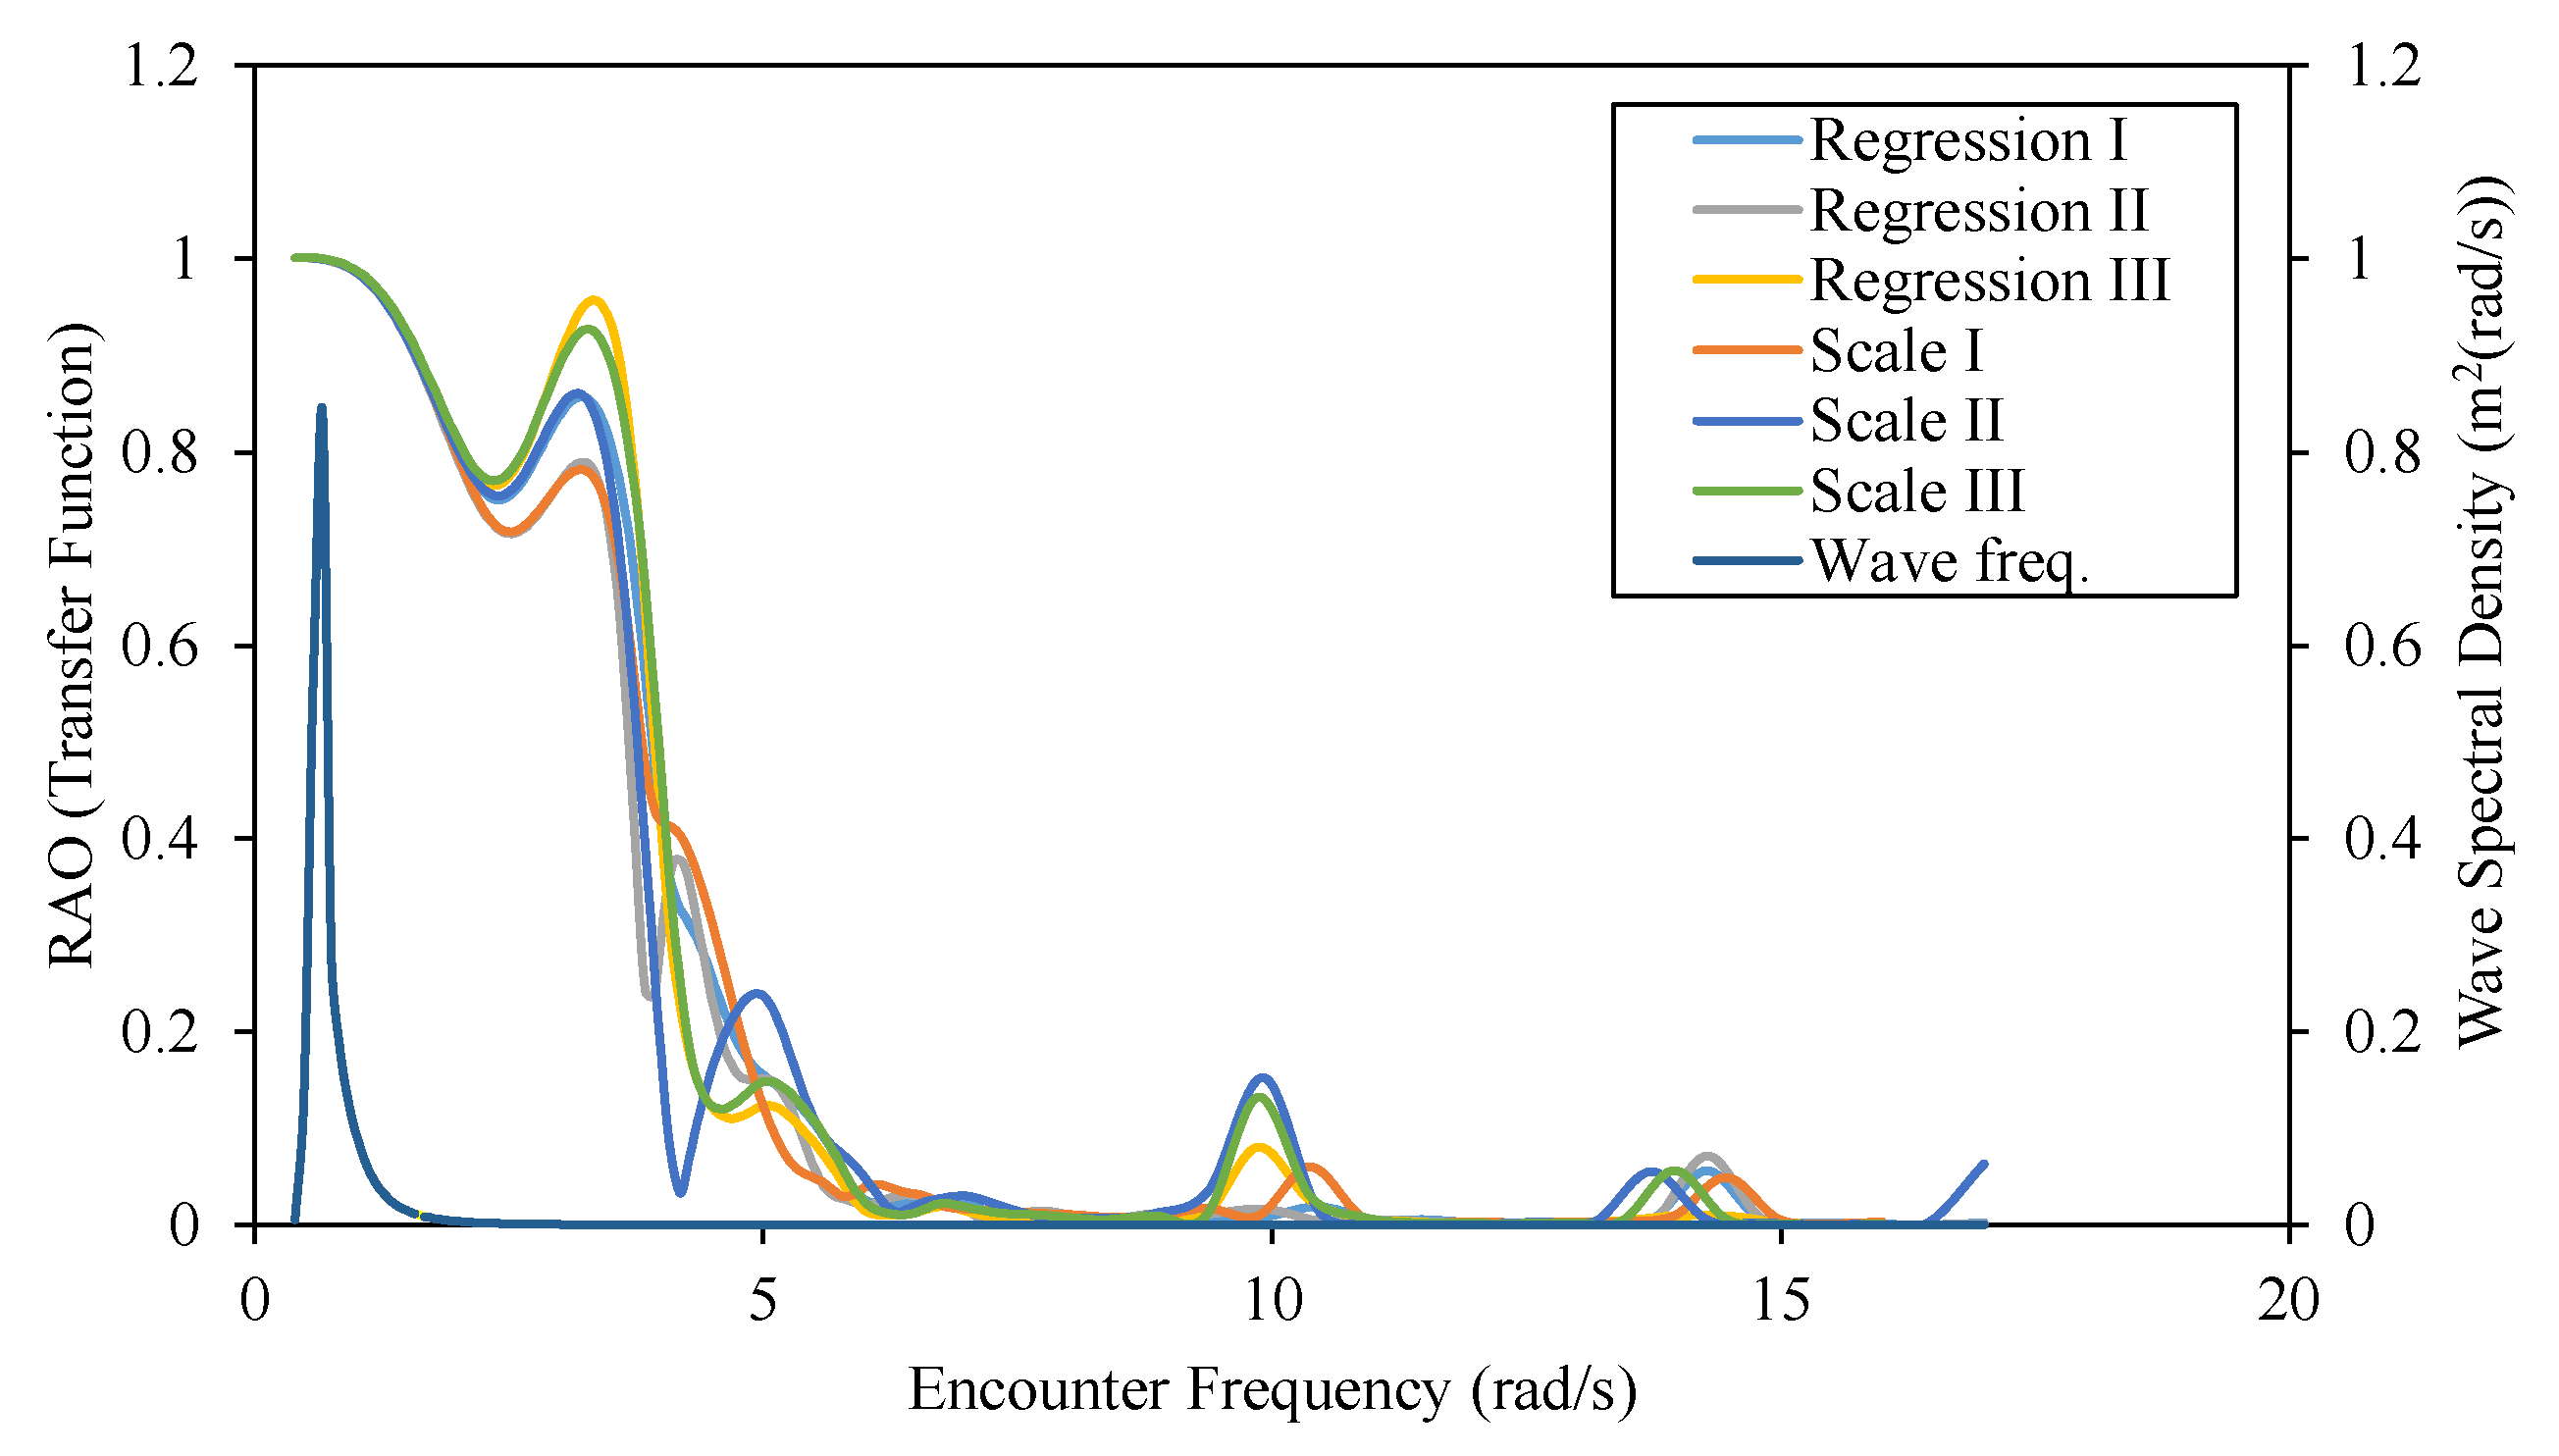
Figure 14.
RAO rolling motion graph for regression and scale models.
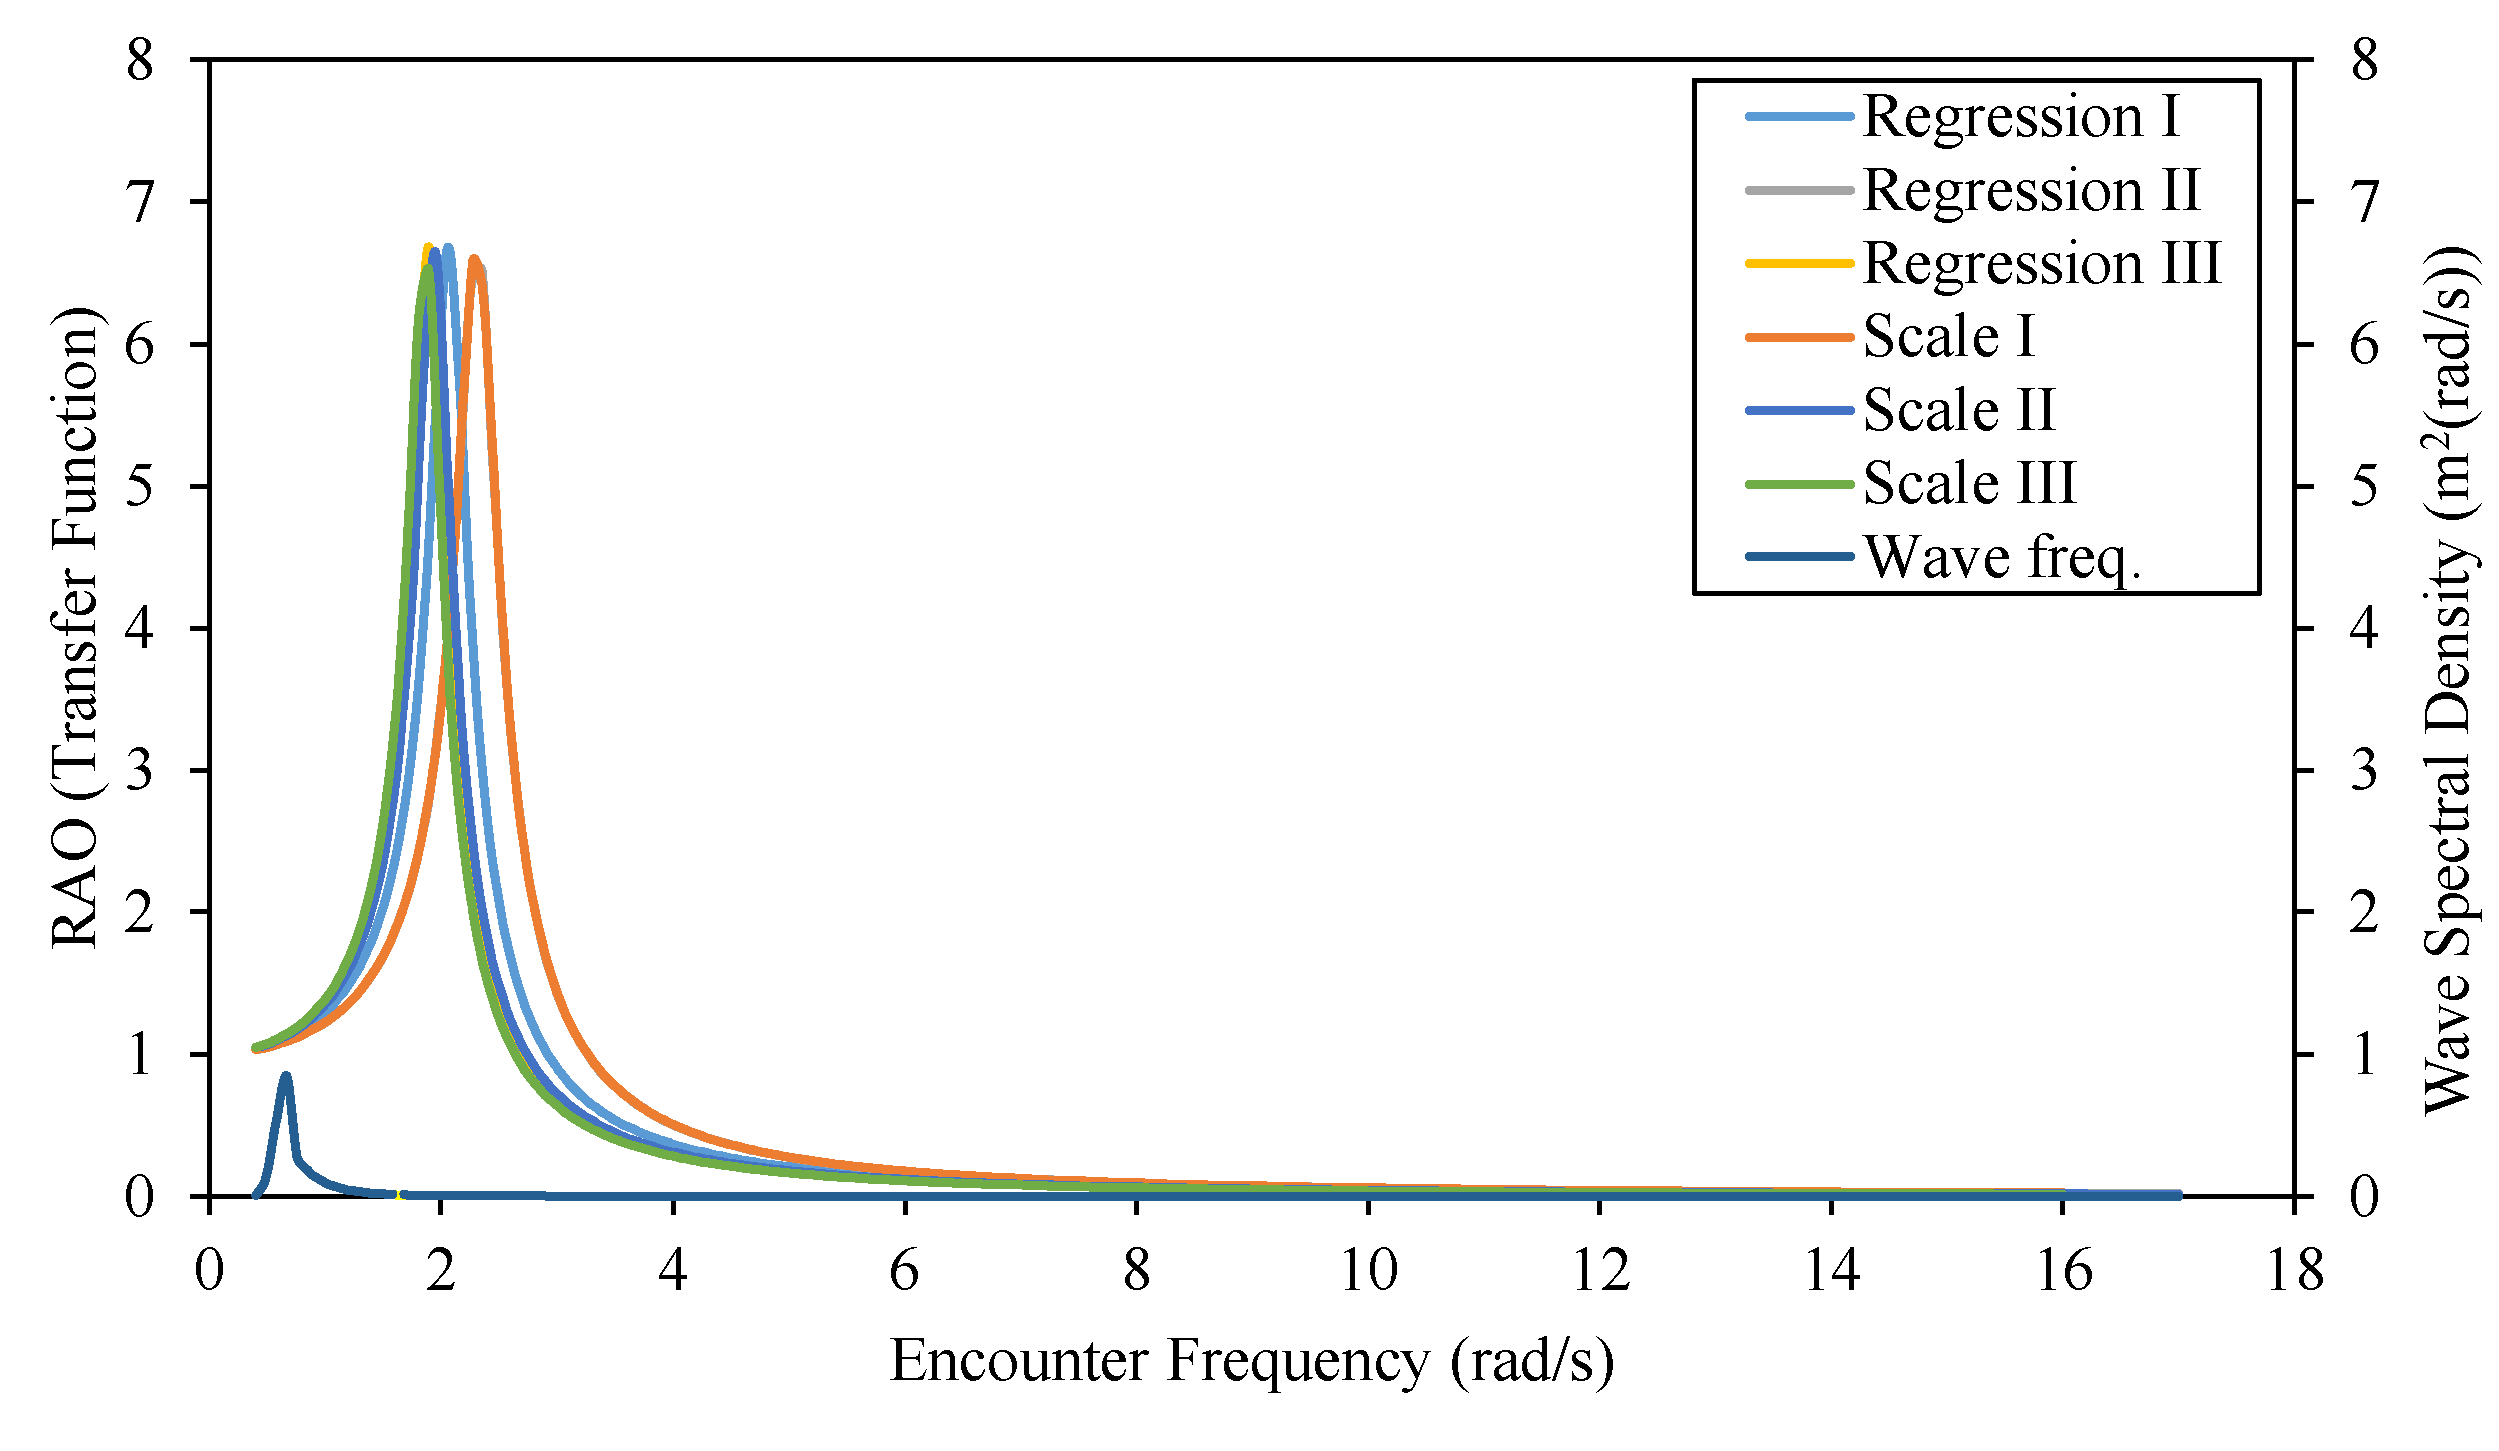
Figure 15.
Graph of RAO pitching motion for regression and scale models.
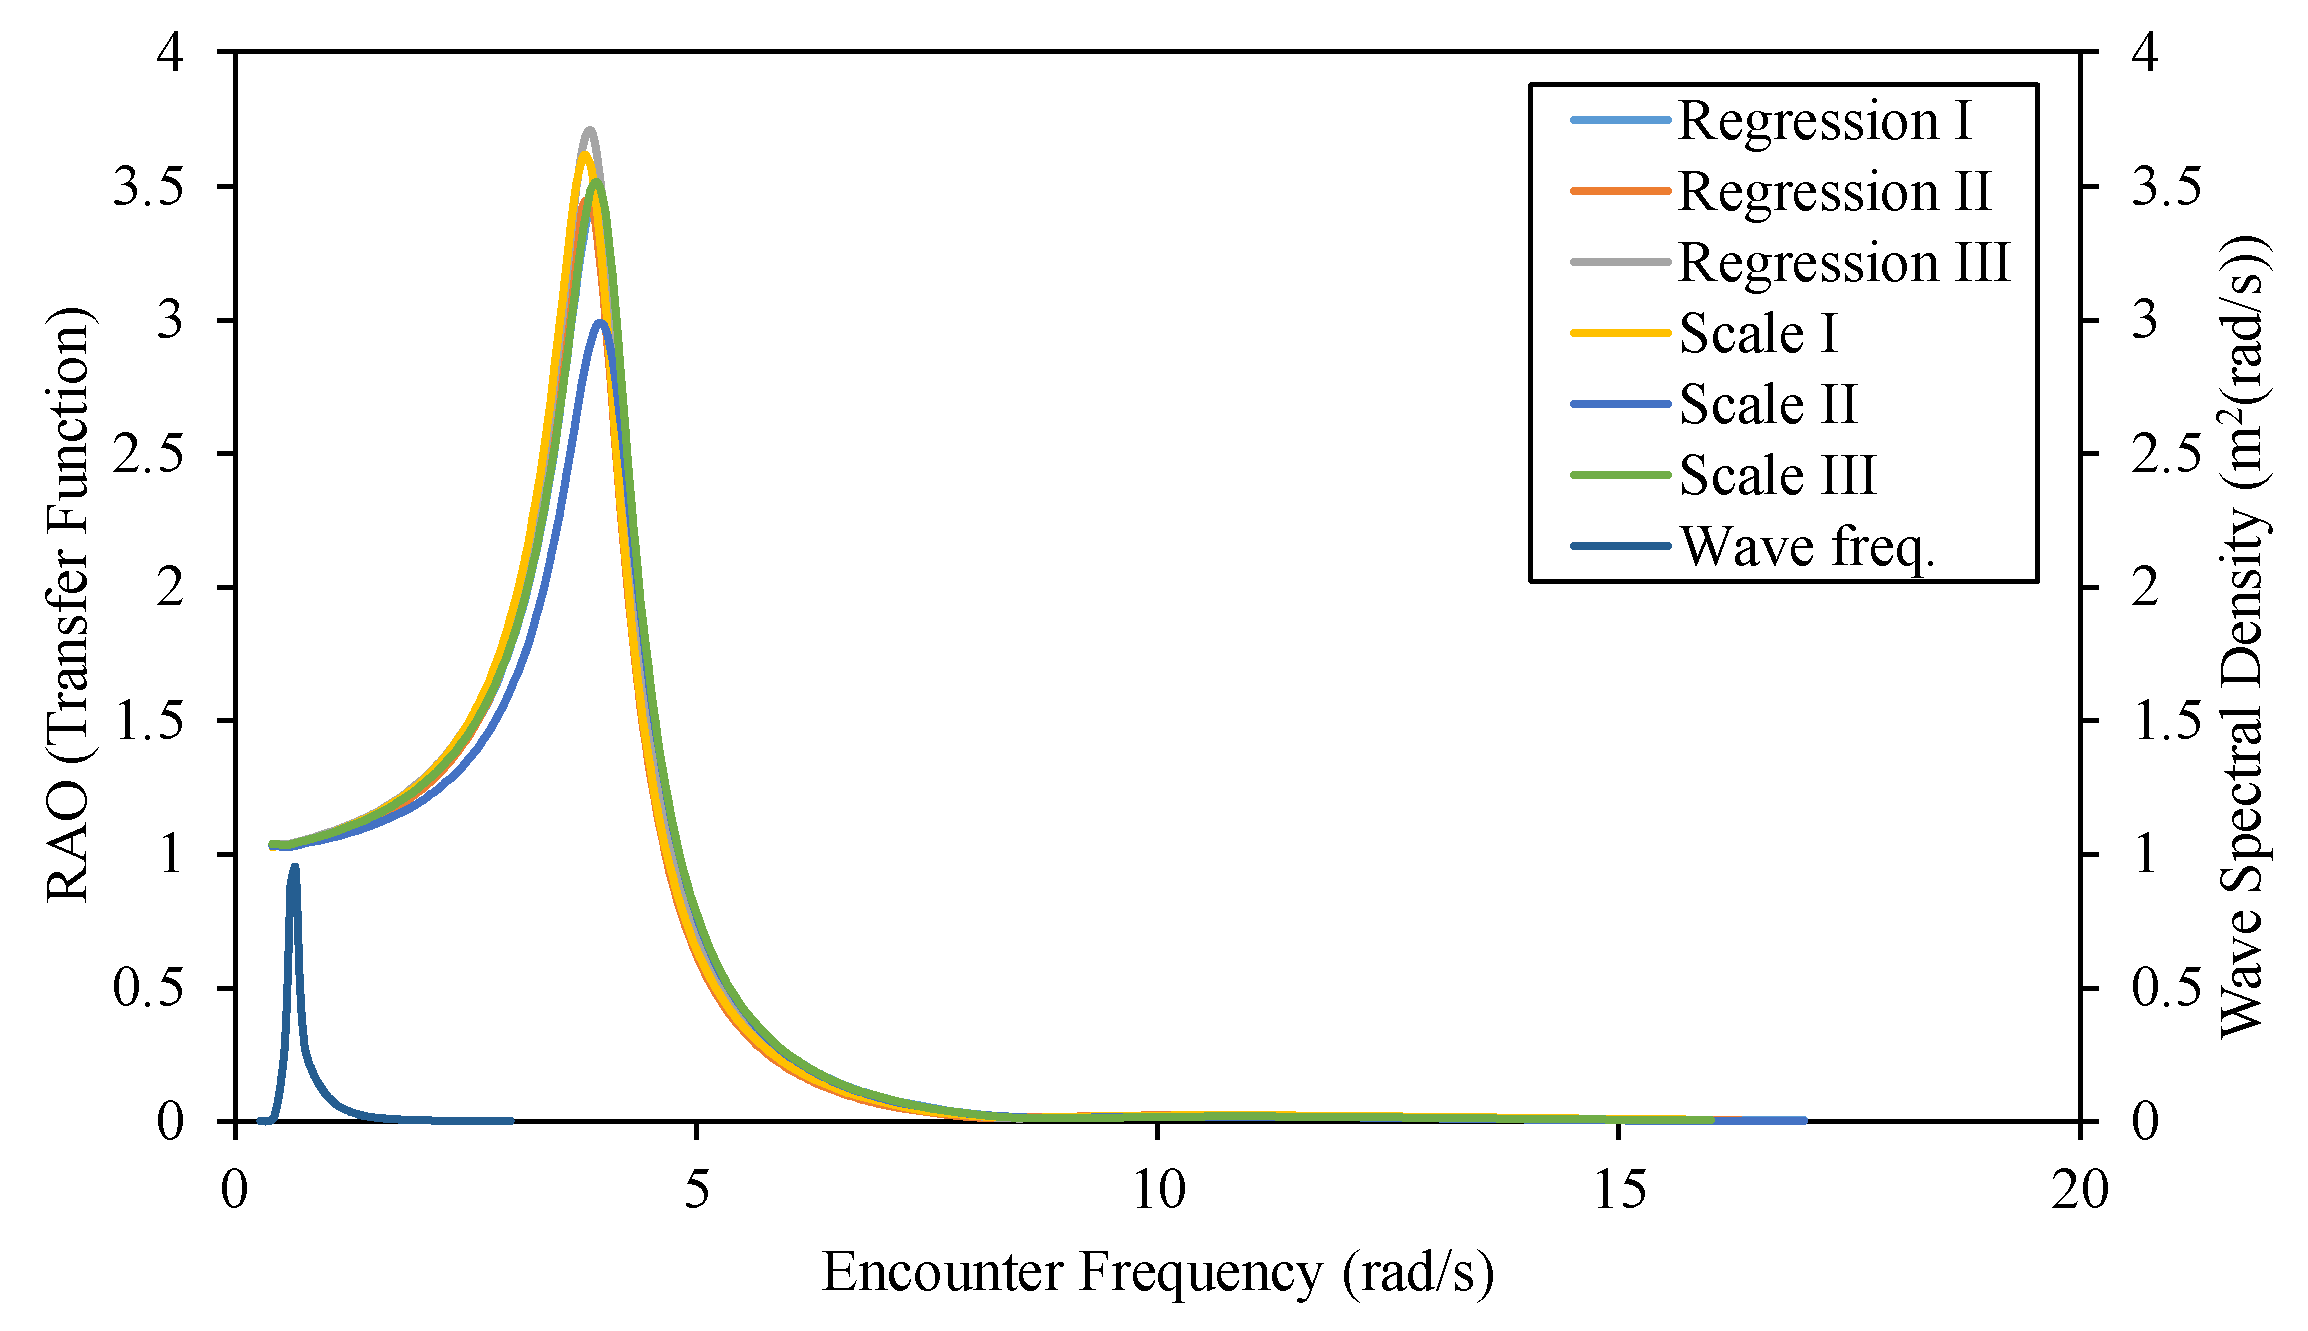
Figure 16.
MSI graph for regression and scale models.
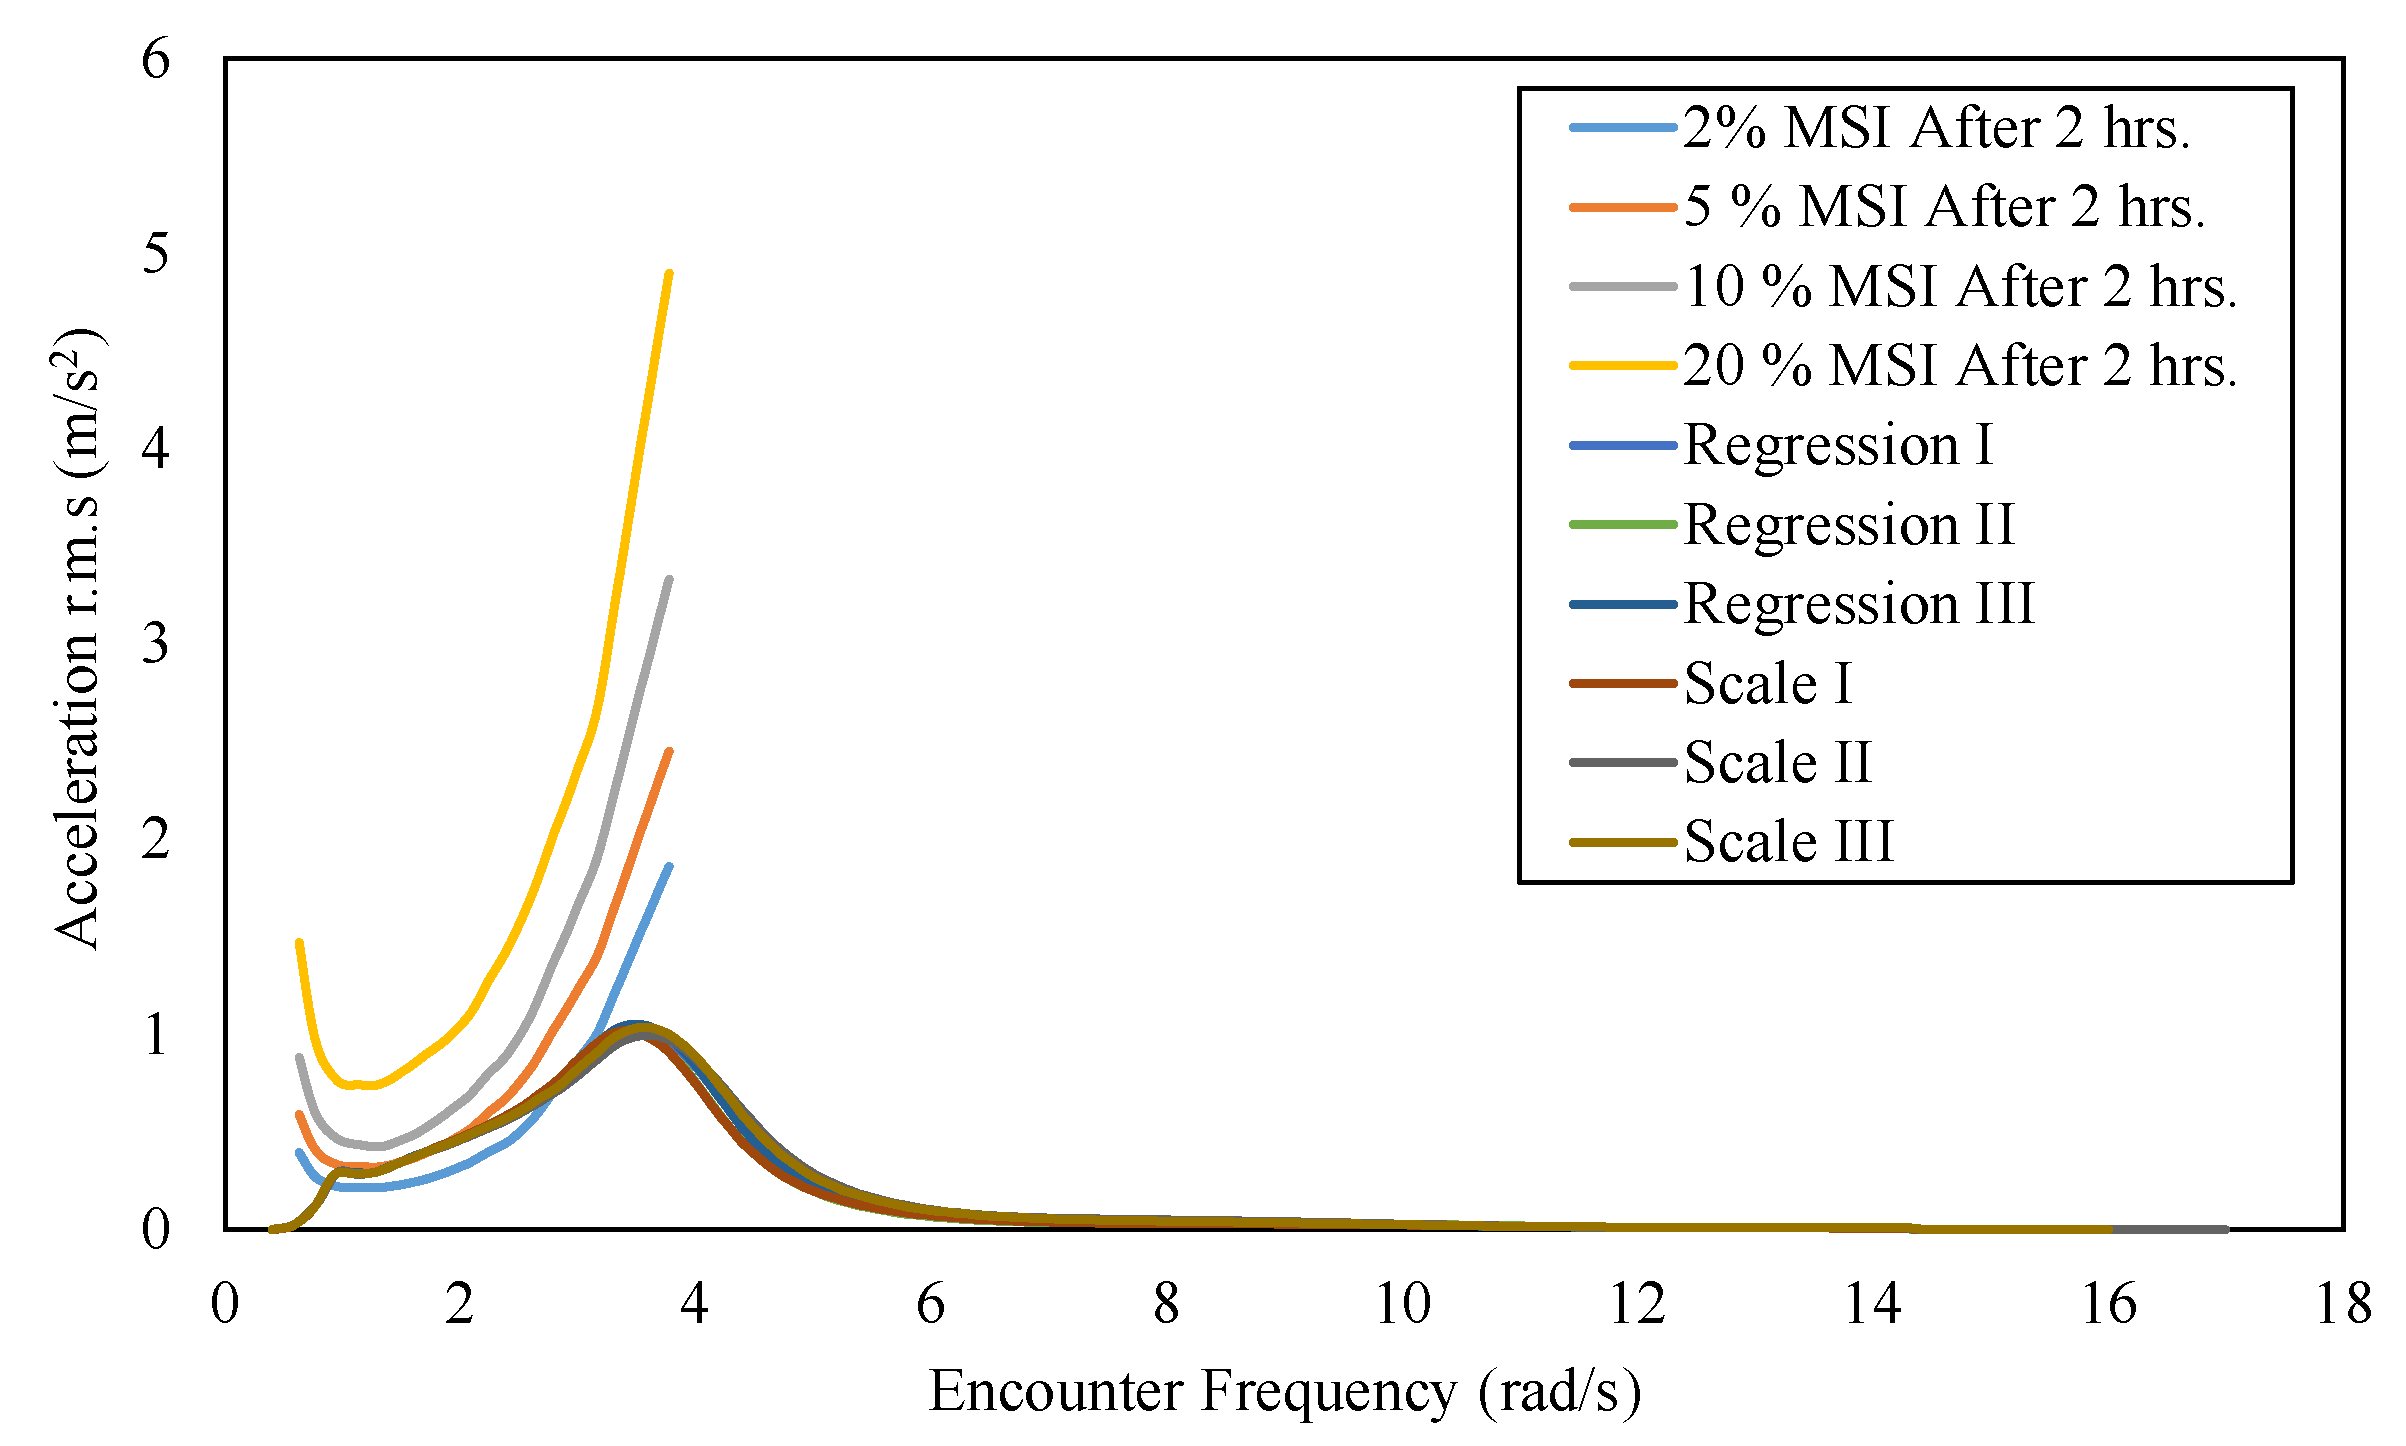
Figure 17.
Comparison between regression models and reference ships: (a) Froude number with resistance; (b) Froude number with power.
Figure 17.
Comparison between regression models and reference ships: (a) Froude number with resistance; (b) Froude number with power.
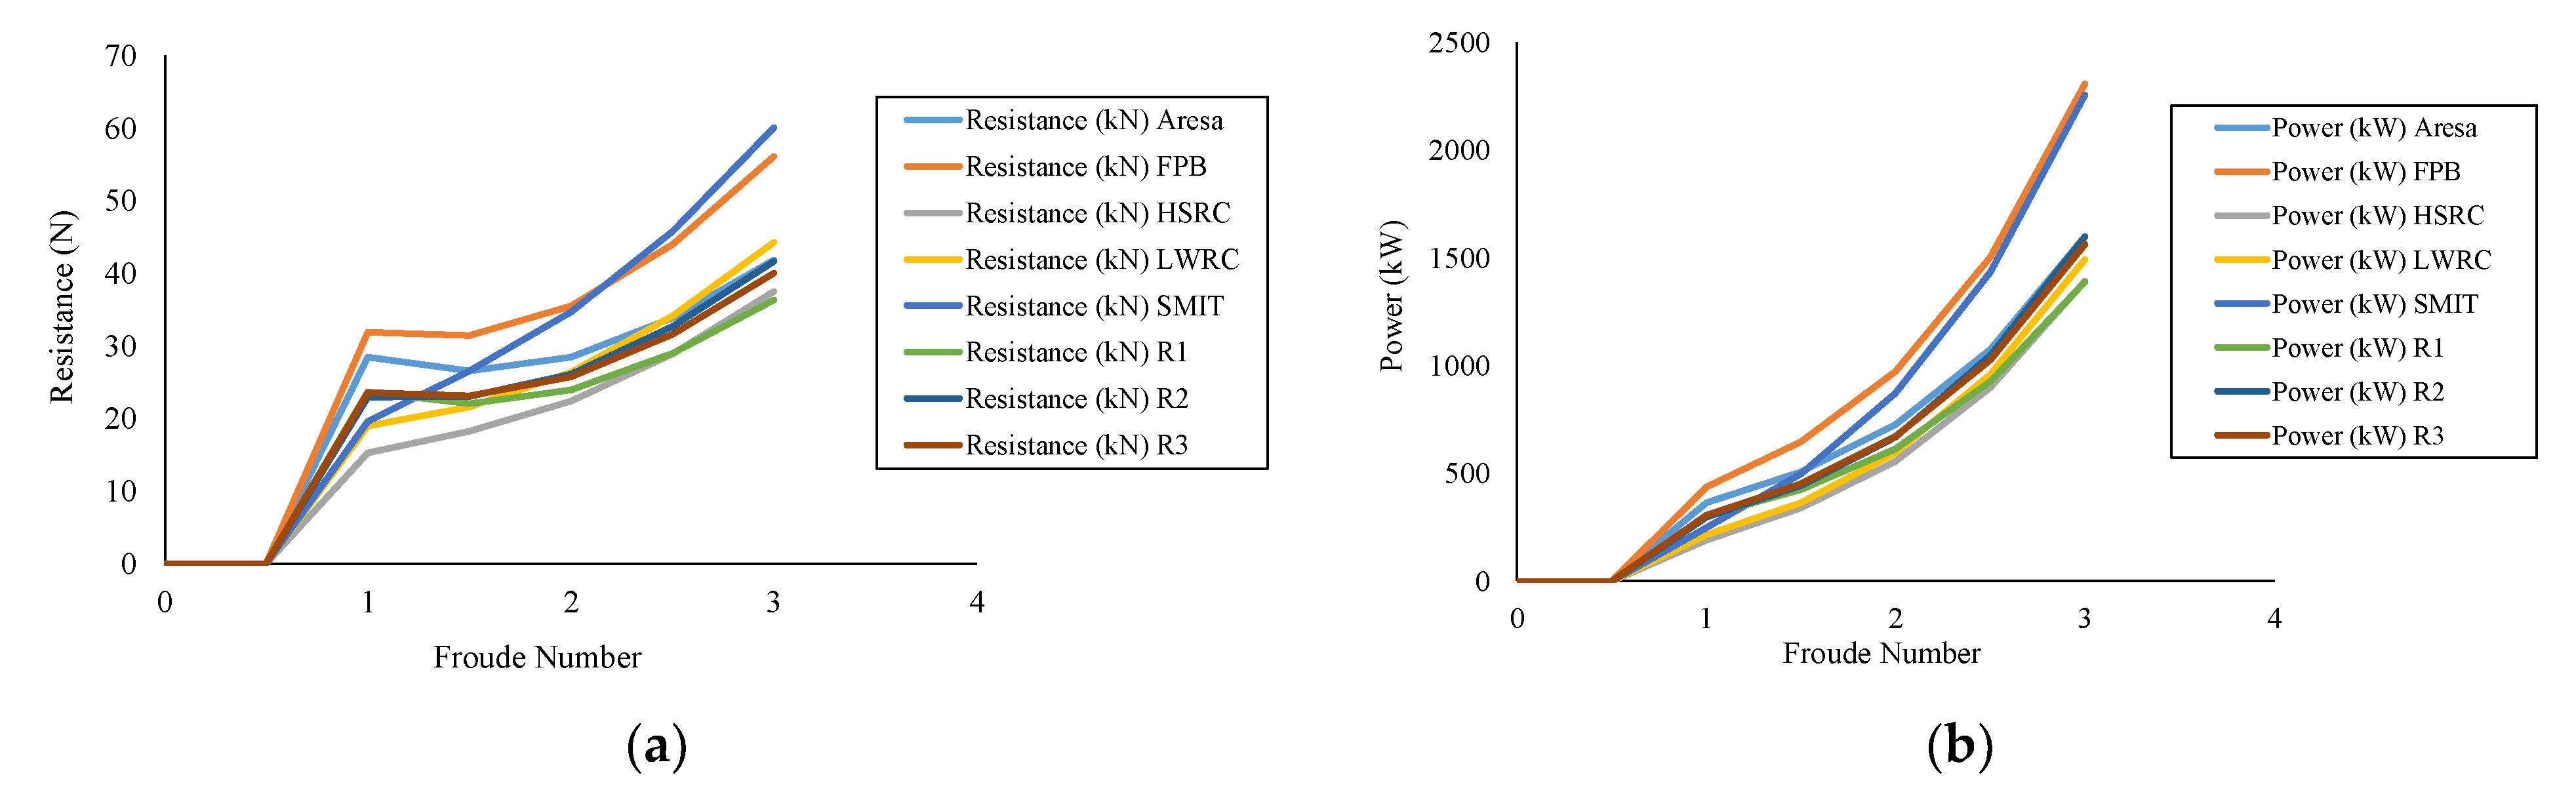
Figure 18.
Comparison of GZ values with the ship’s tilt angle between regression models and reference ships.
Figure 18.
Comparison of GZ values with the ship’s tilt angle between regression models and reference ships.

Figure 19.
RAO heaving motion graph for regression models and reference ships.

Figure 20.
RAO rolling motion graph for regression models and reference ships.
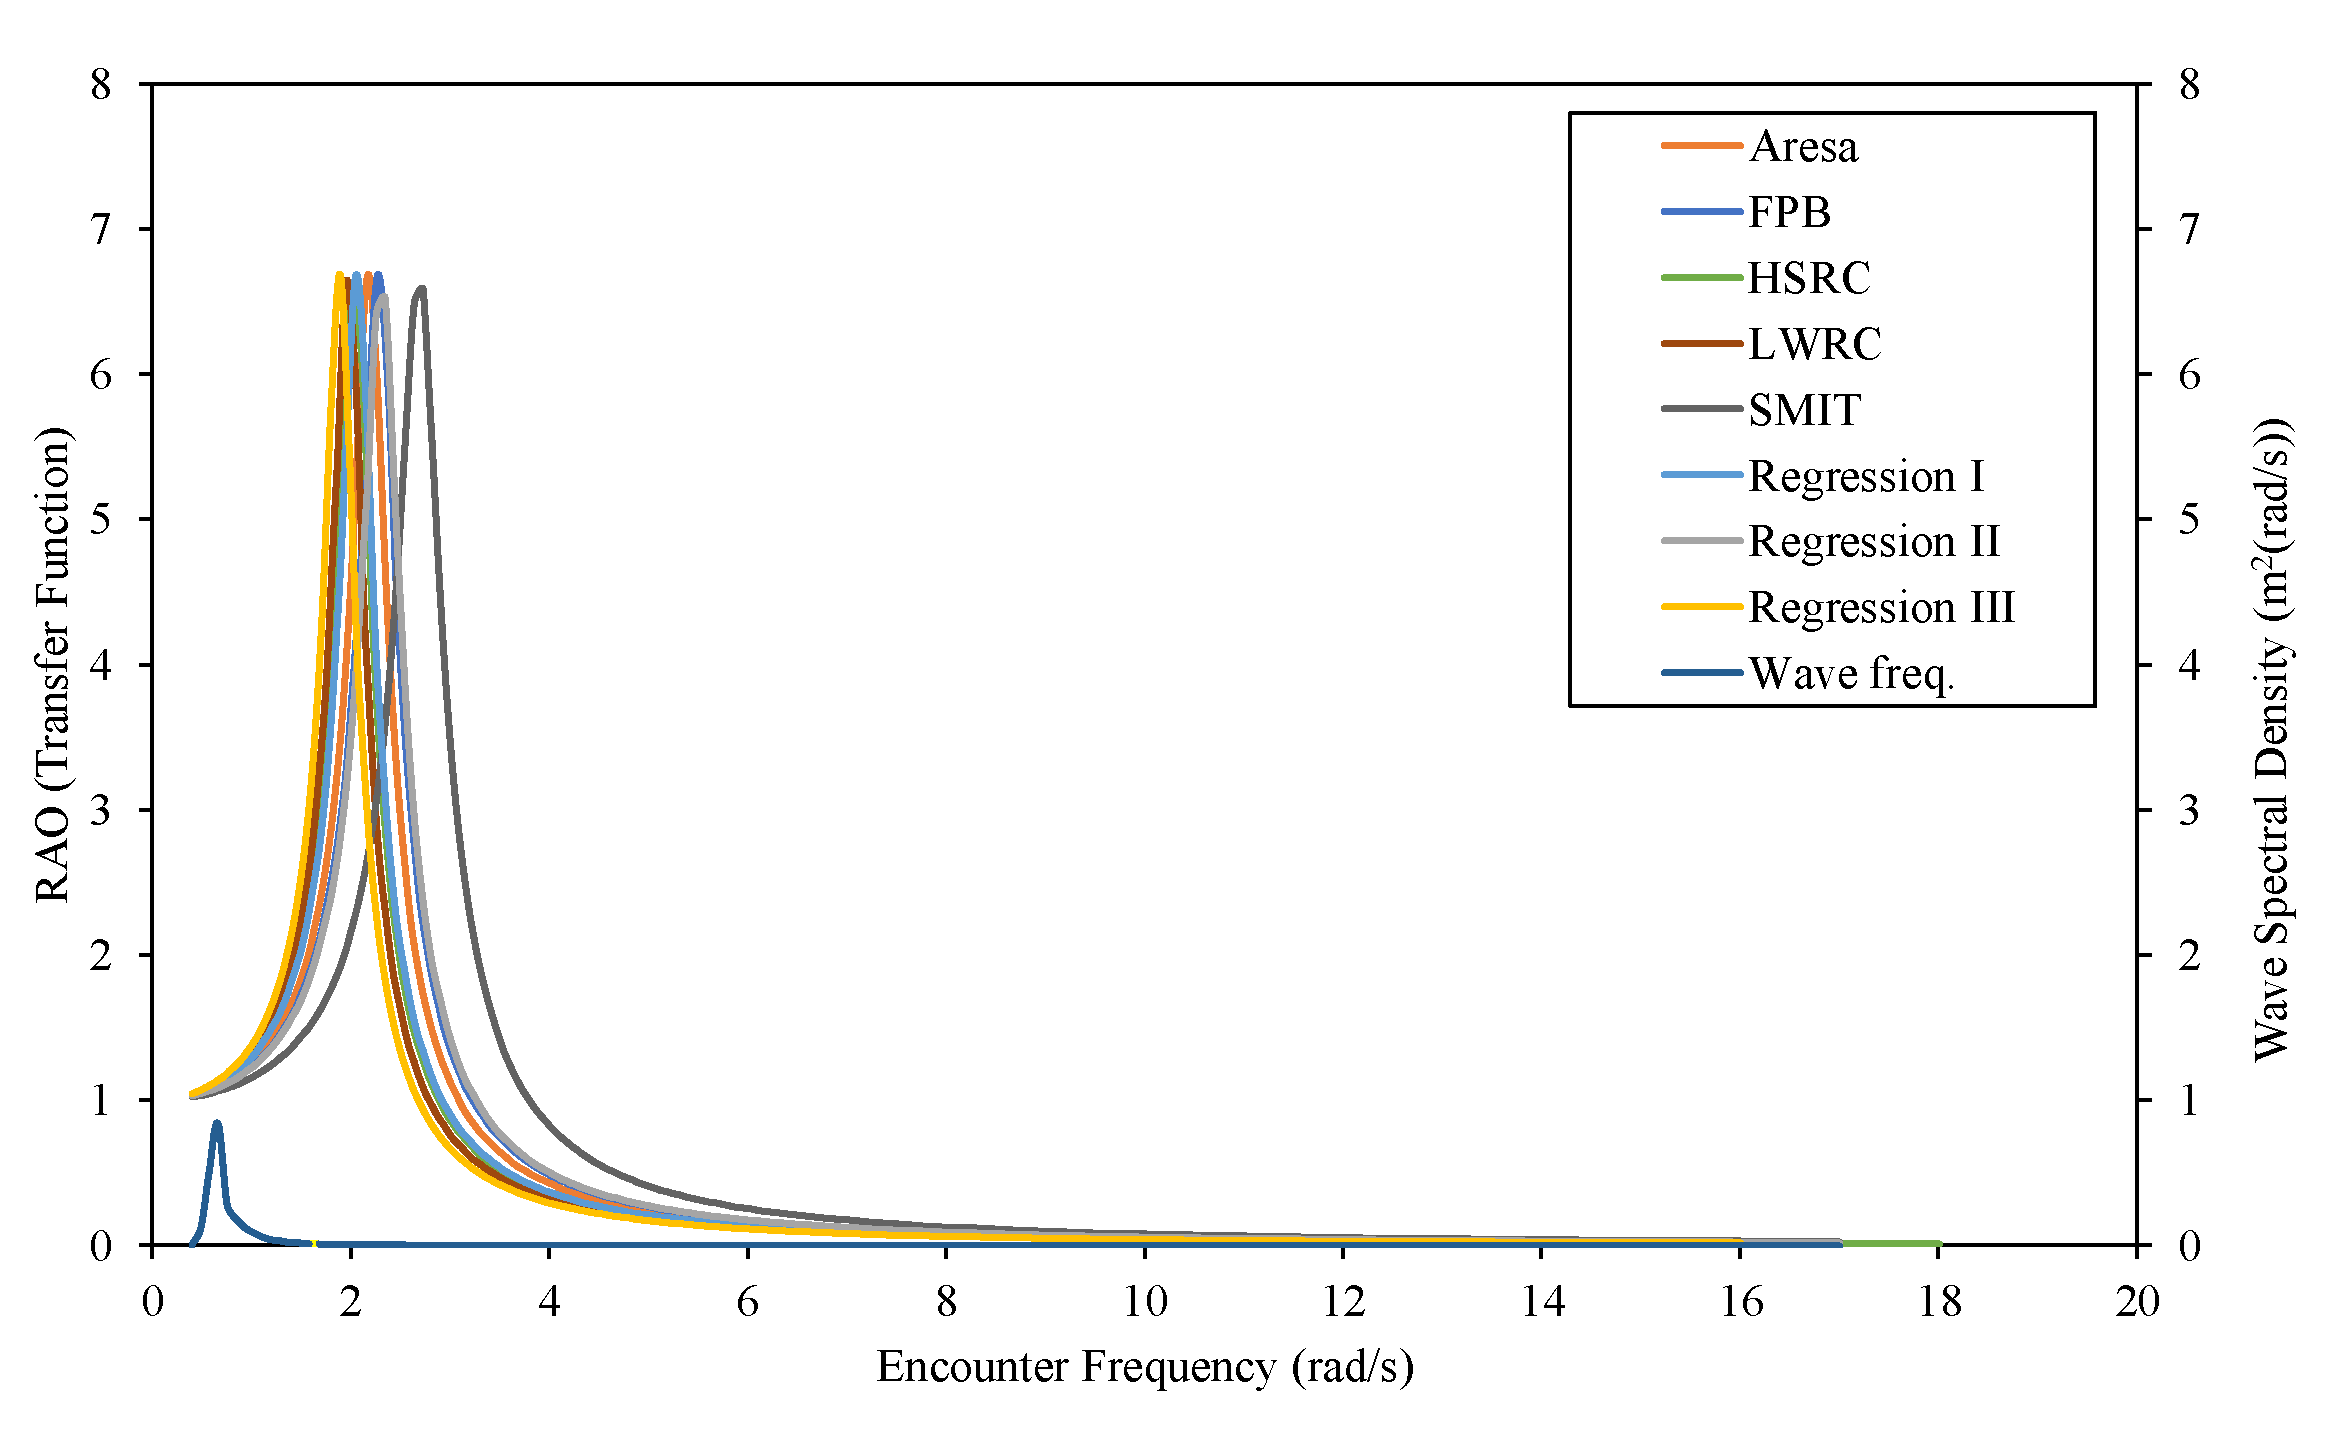
Figure 21.
RAO pitching motion graph for regression models and reference ships.
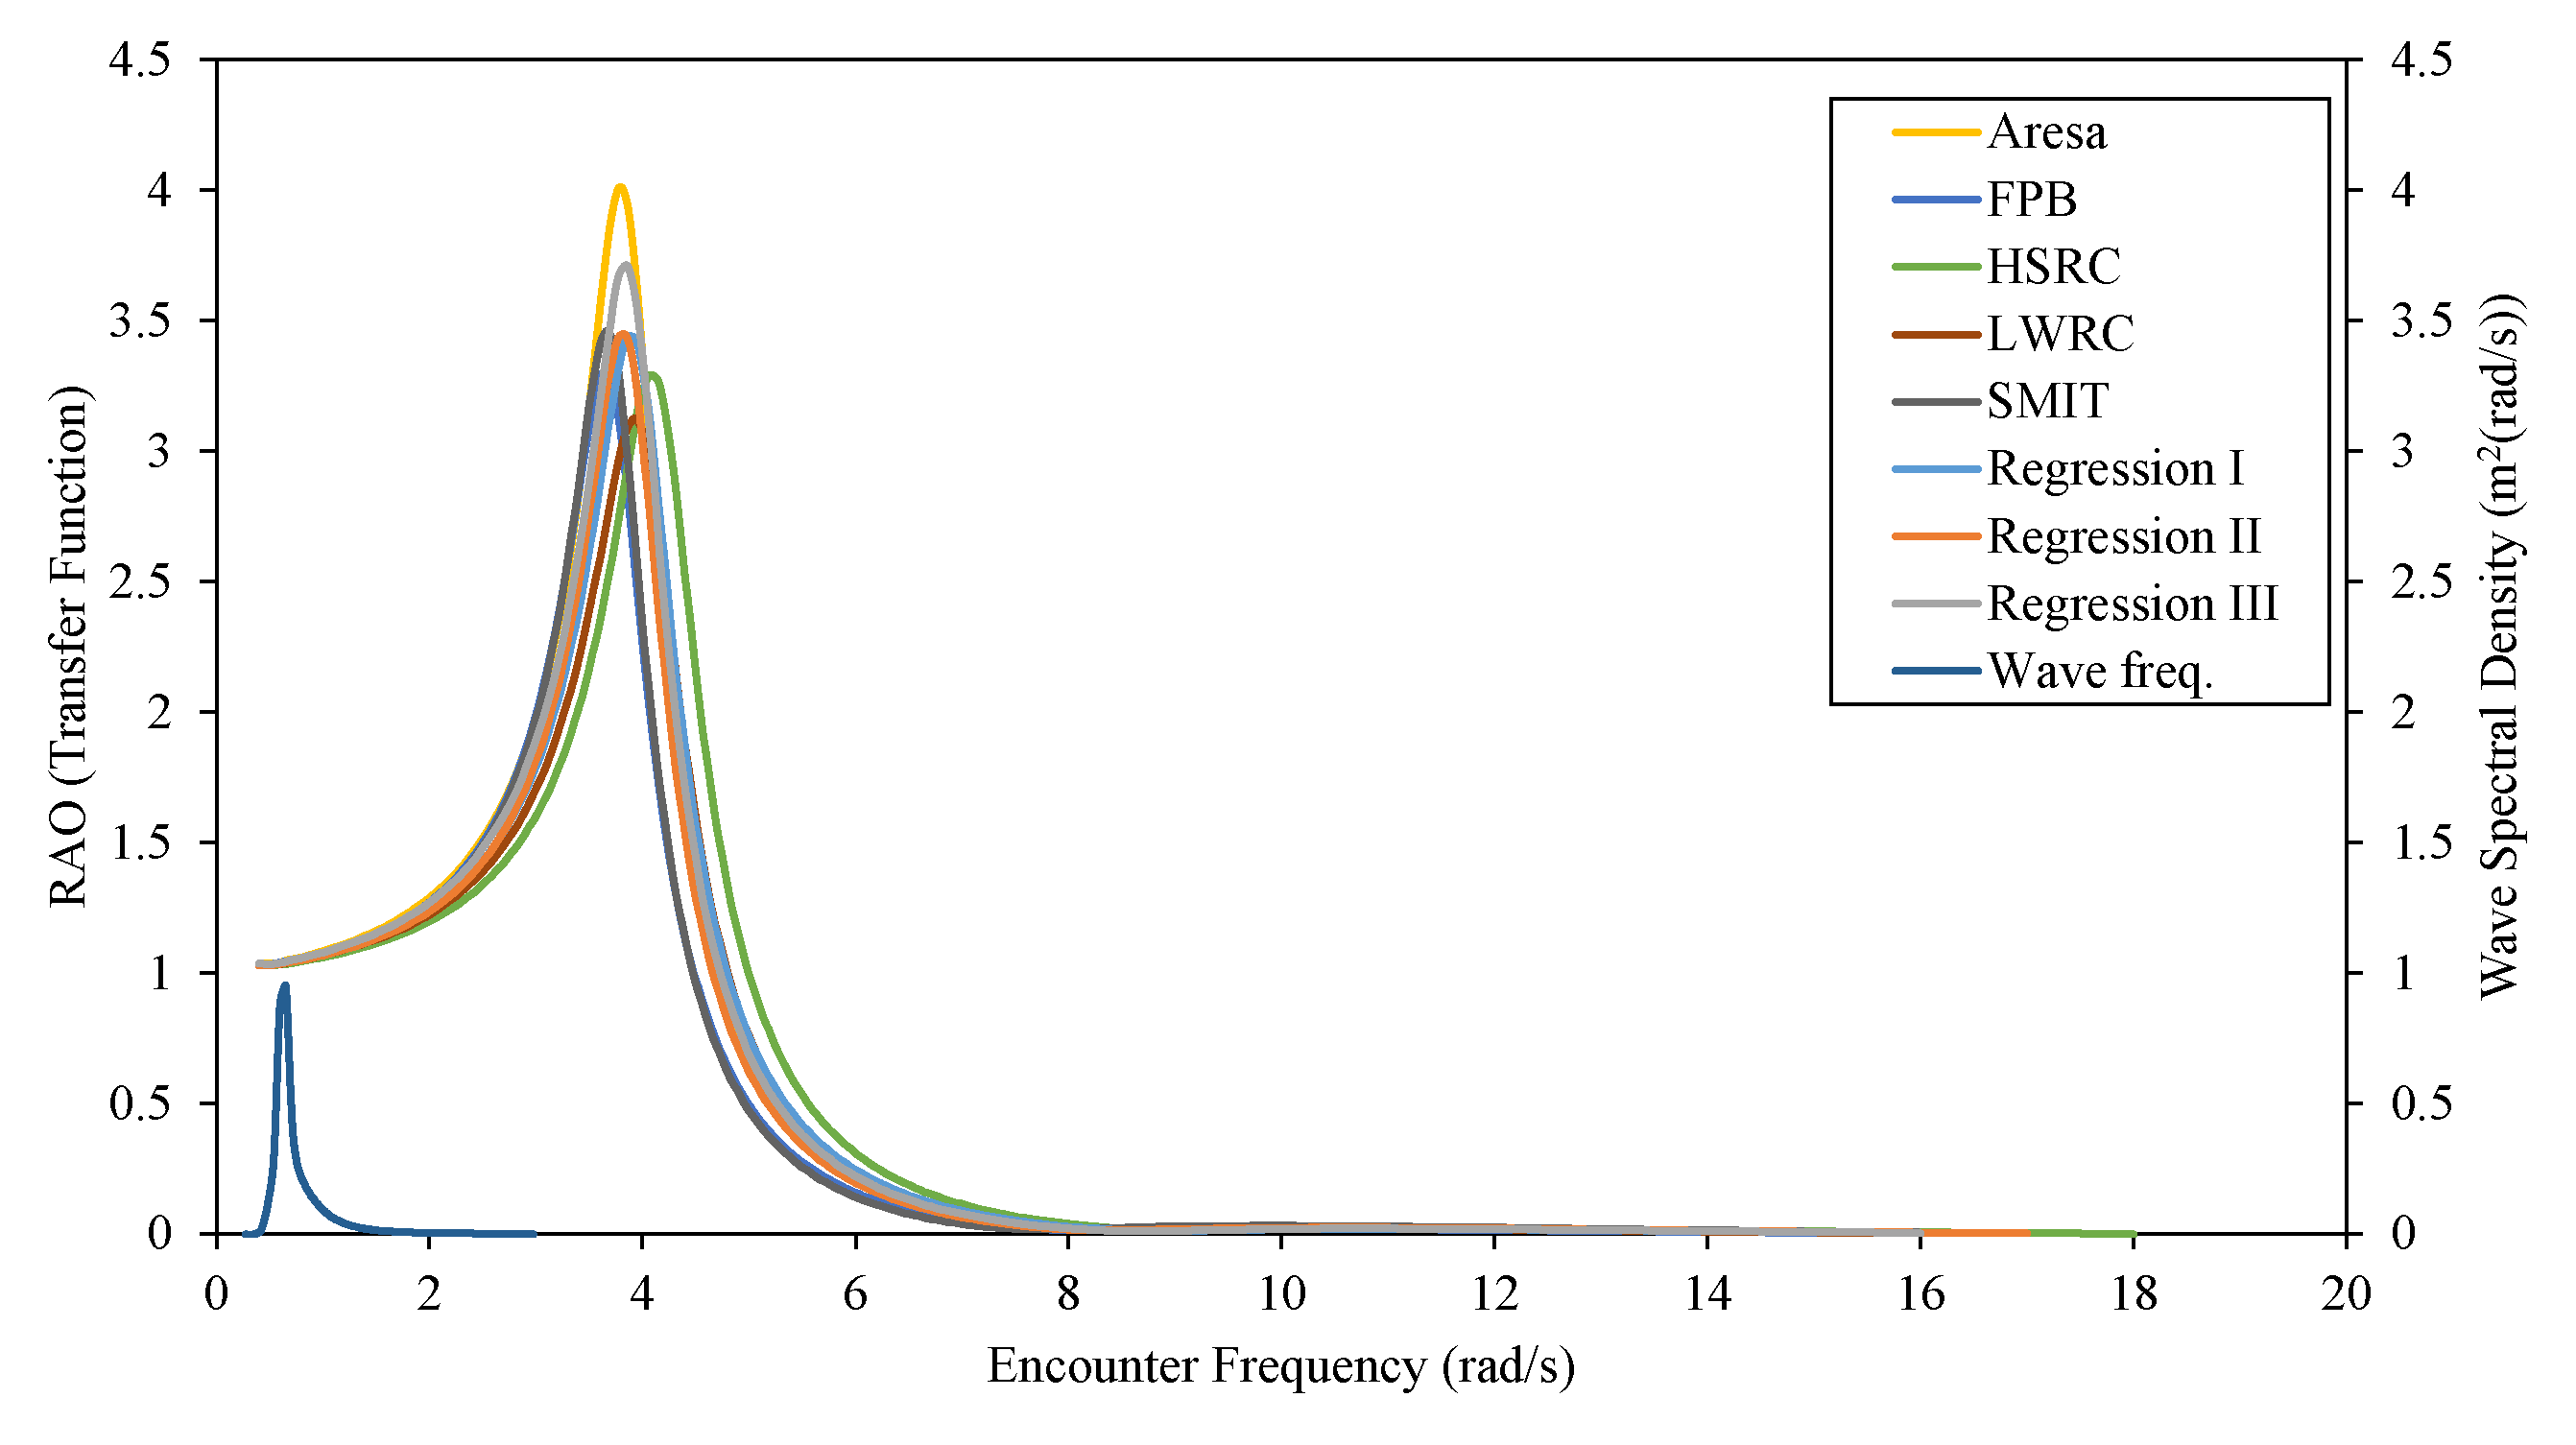
Figure 22.
MSI graph for regression models and reference ships.
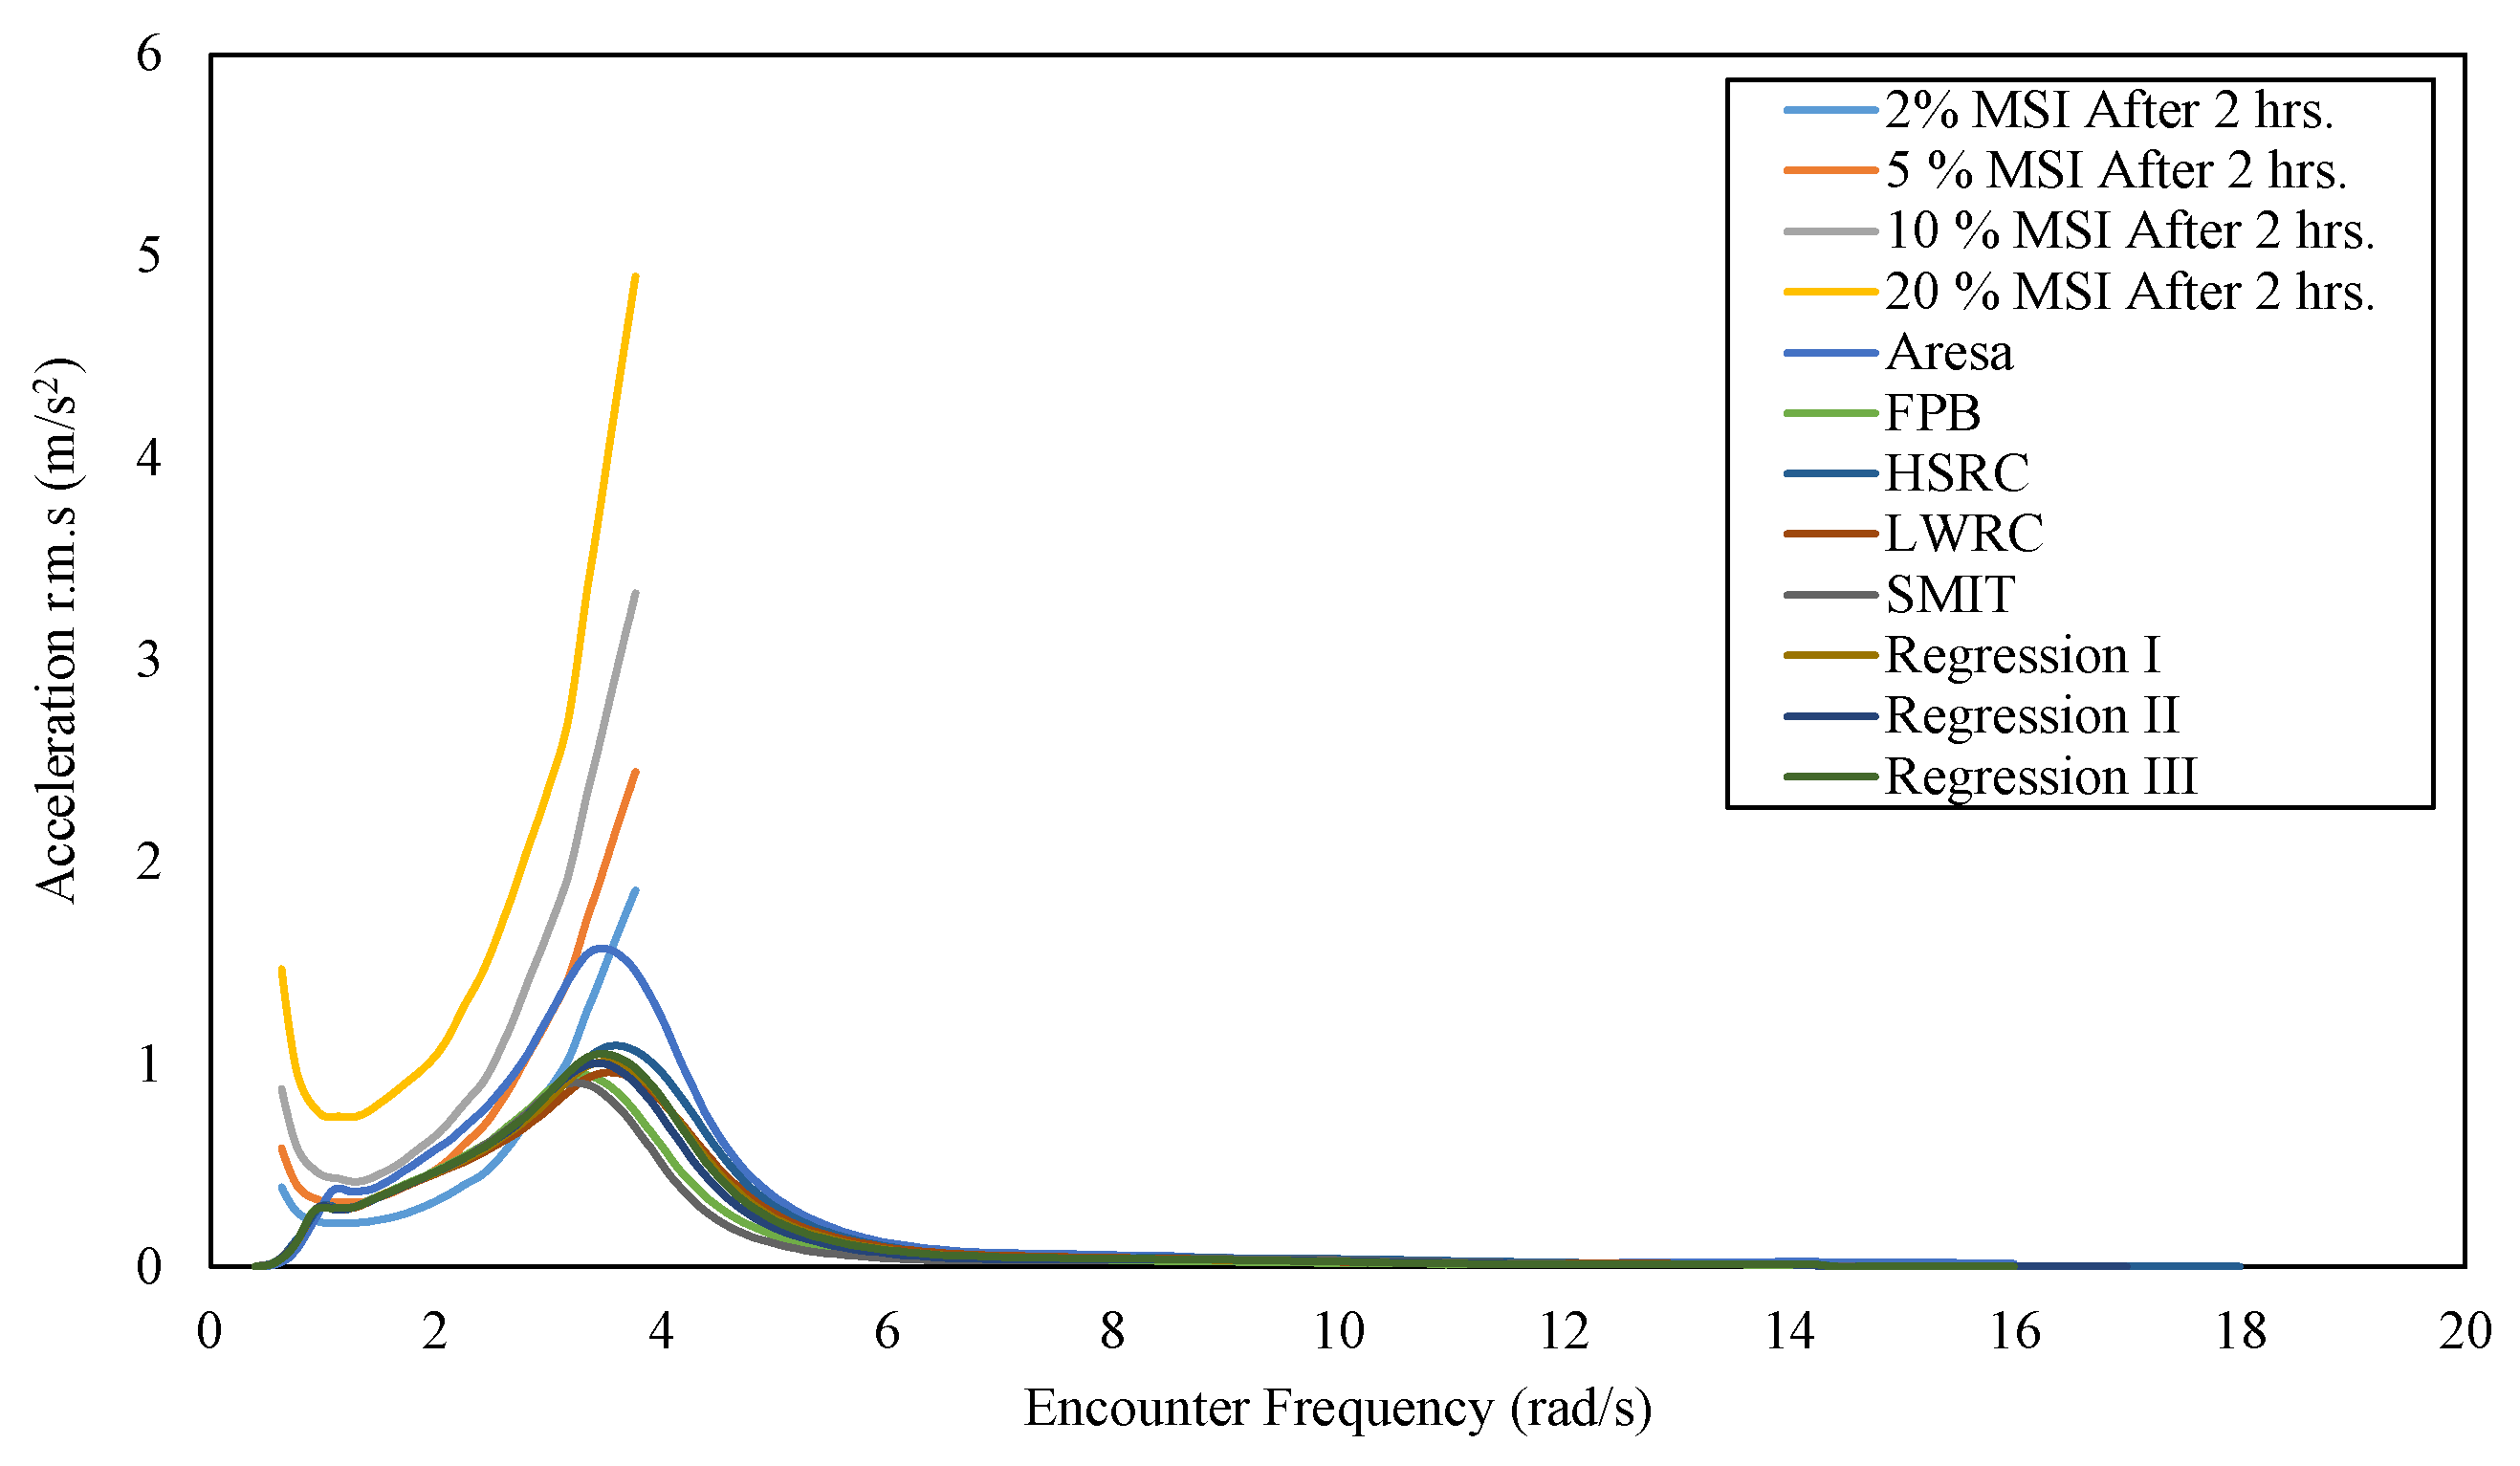
Figure 23.
Comparison between scaled and reference ship models: (a) Froude number with resistance; (b) Froude number with power.
Figure 23.
Comparison between scaled and reference ship models: (a) Froude number with resistance; (b) Froude number with power.
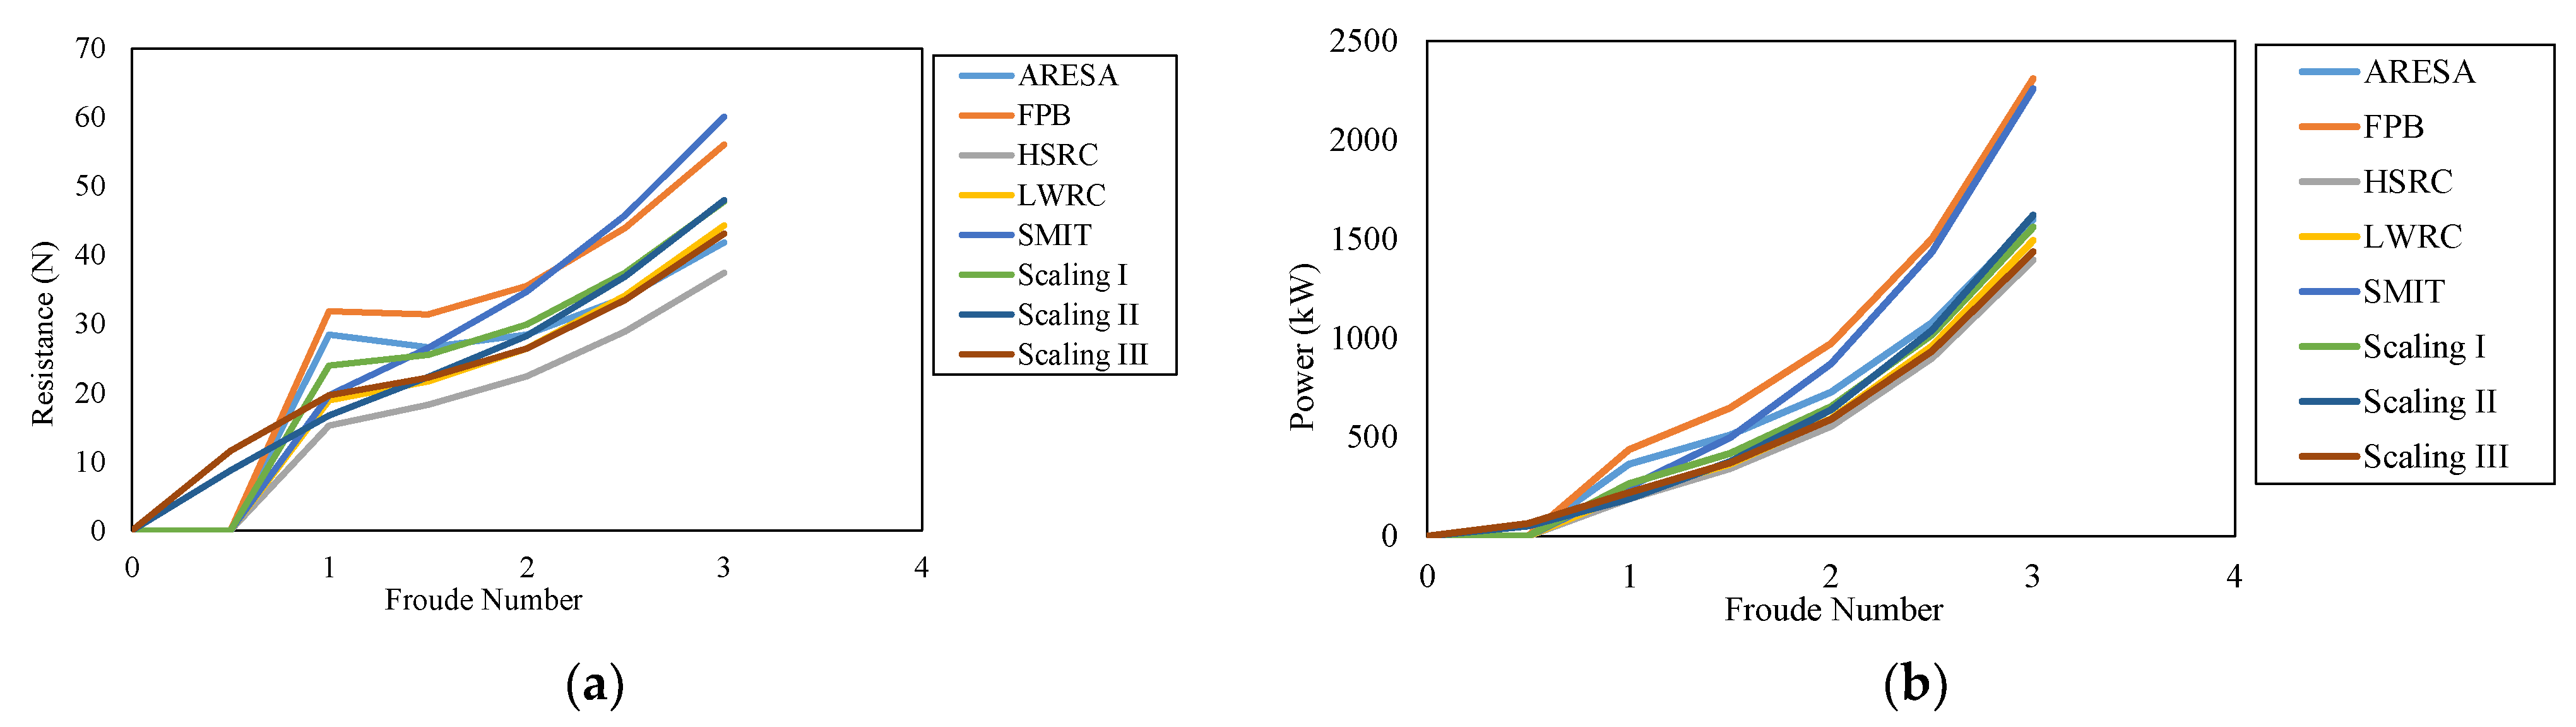
Figure 24.
Comparison of GZ values with ship’s tilt angle for scaling models and reference ships.
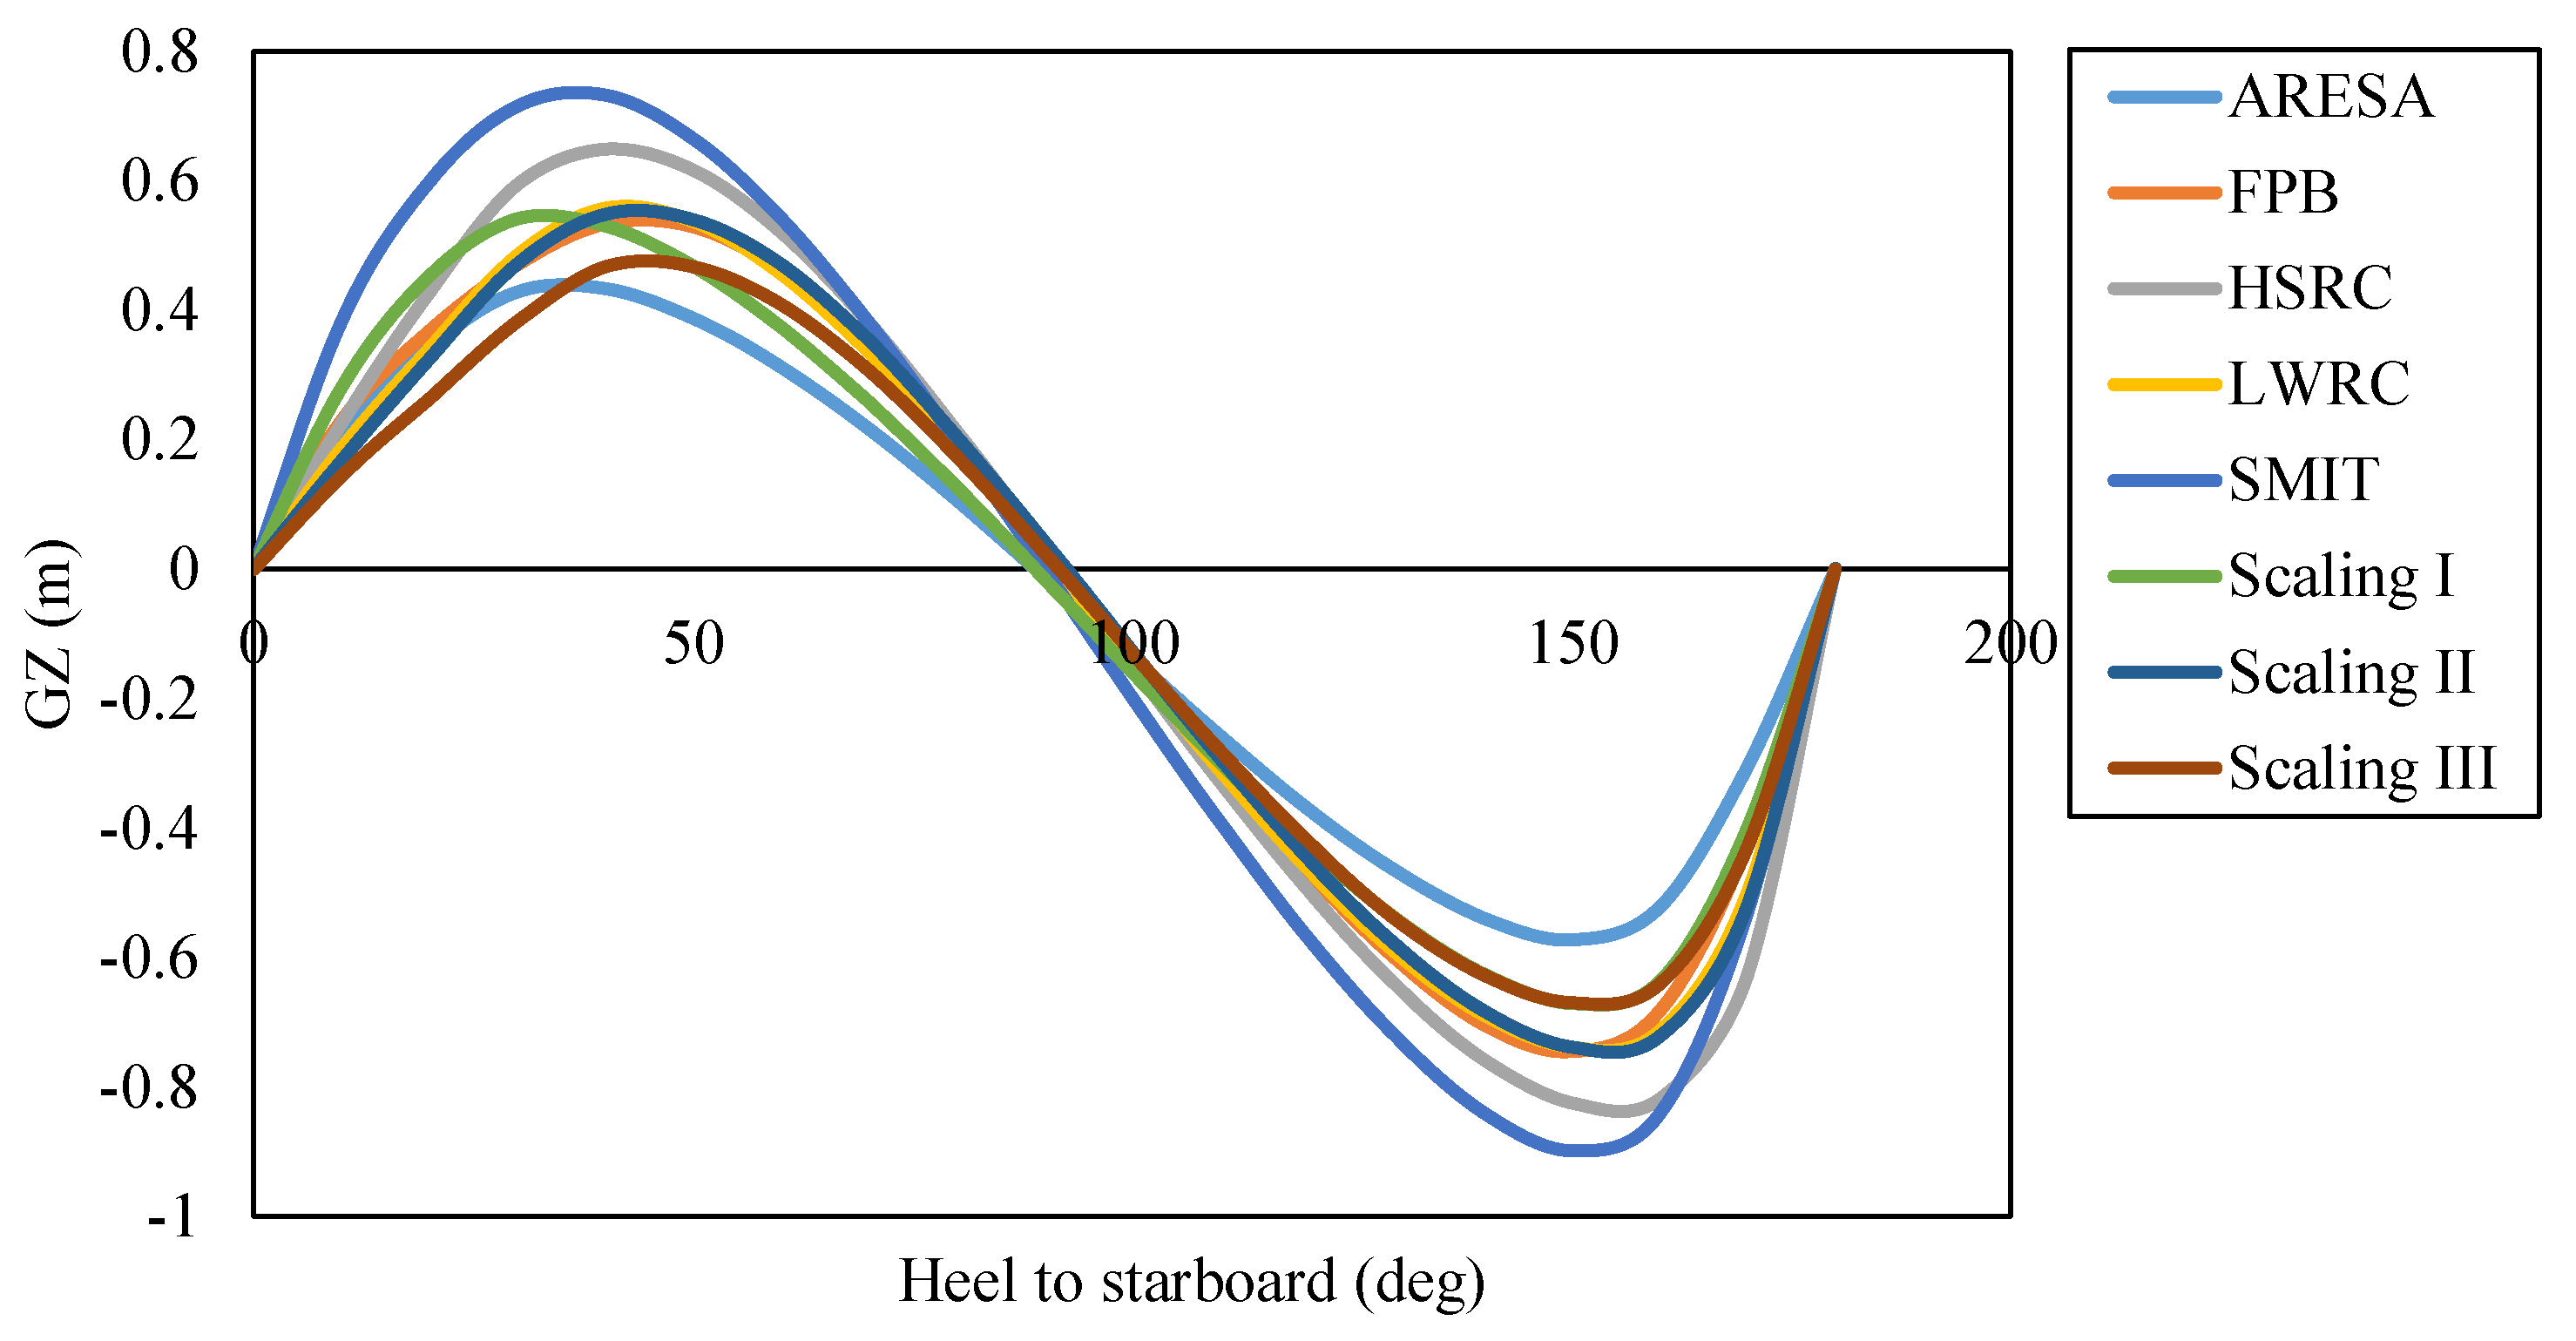
Figure 25.
RAO heaving motion graph for scaling models and reference ships.
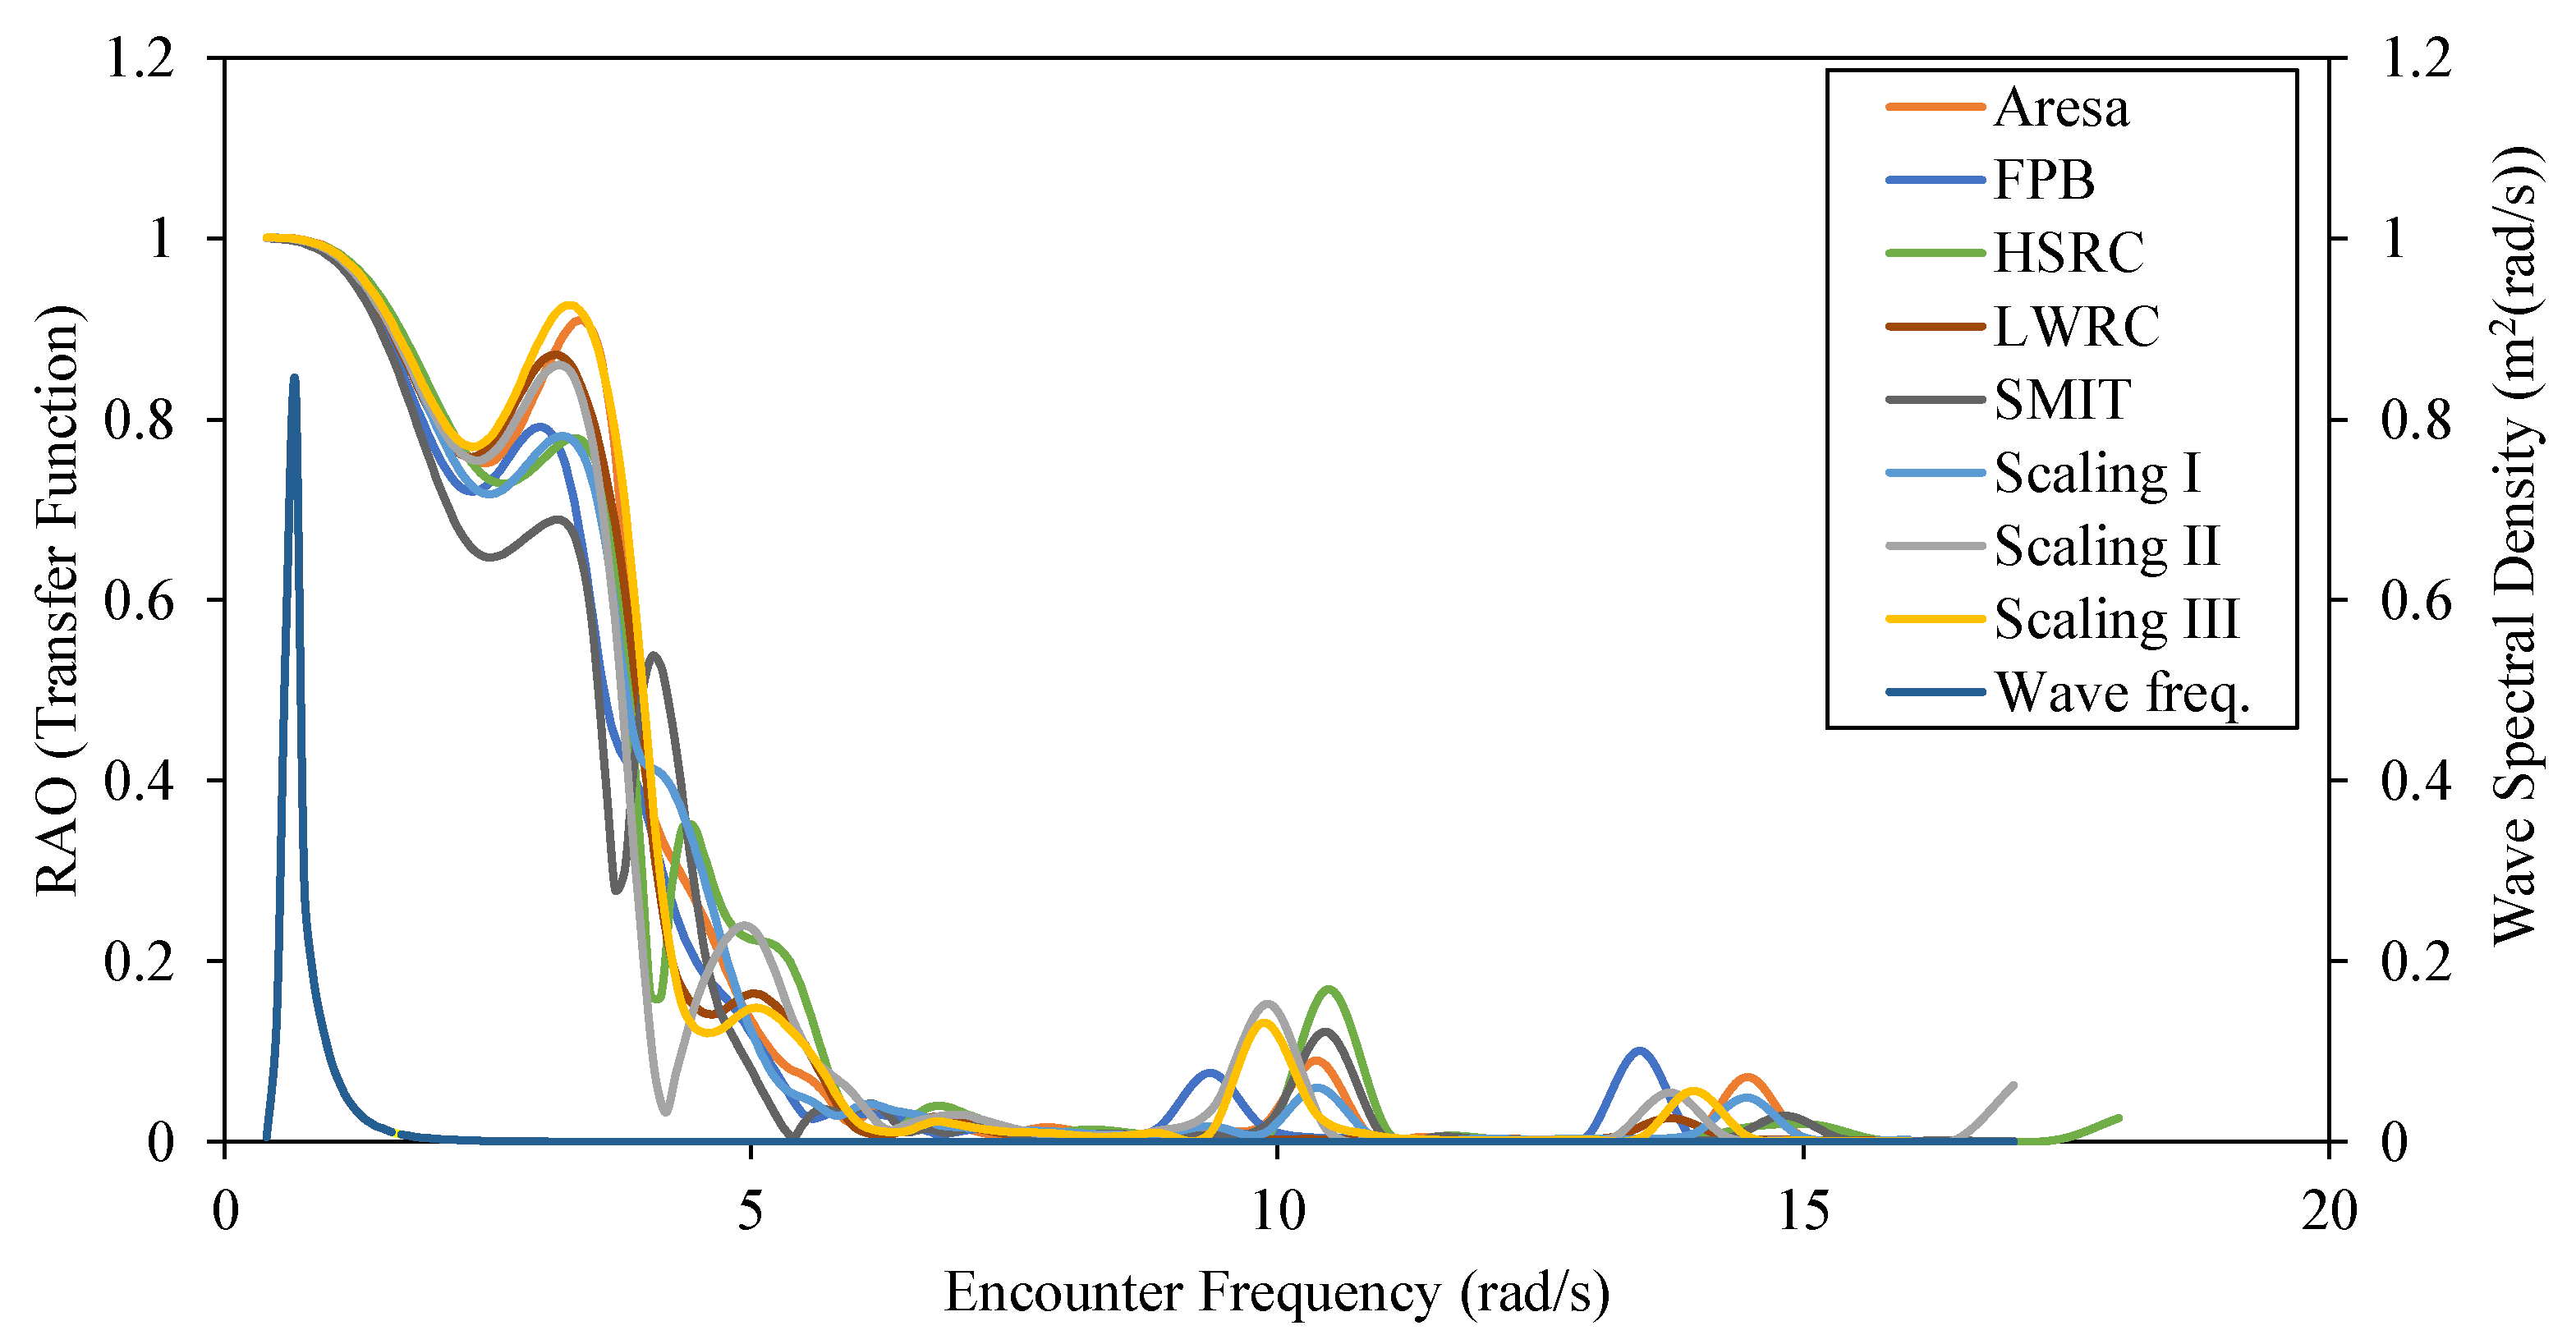
Figure 26.
RAO rolling motion graph for scaling models and reference ships.

Figure 27.
RAO pitching motion graph for scaling models and reference ships.
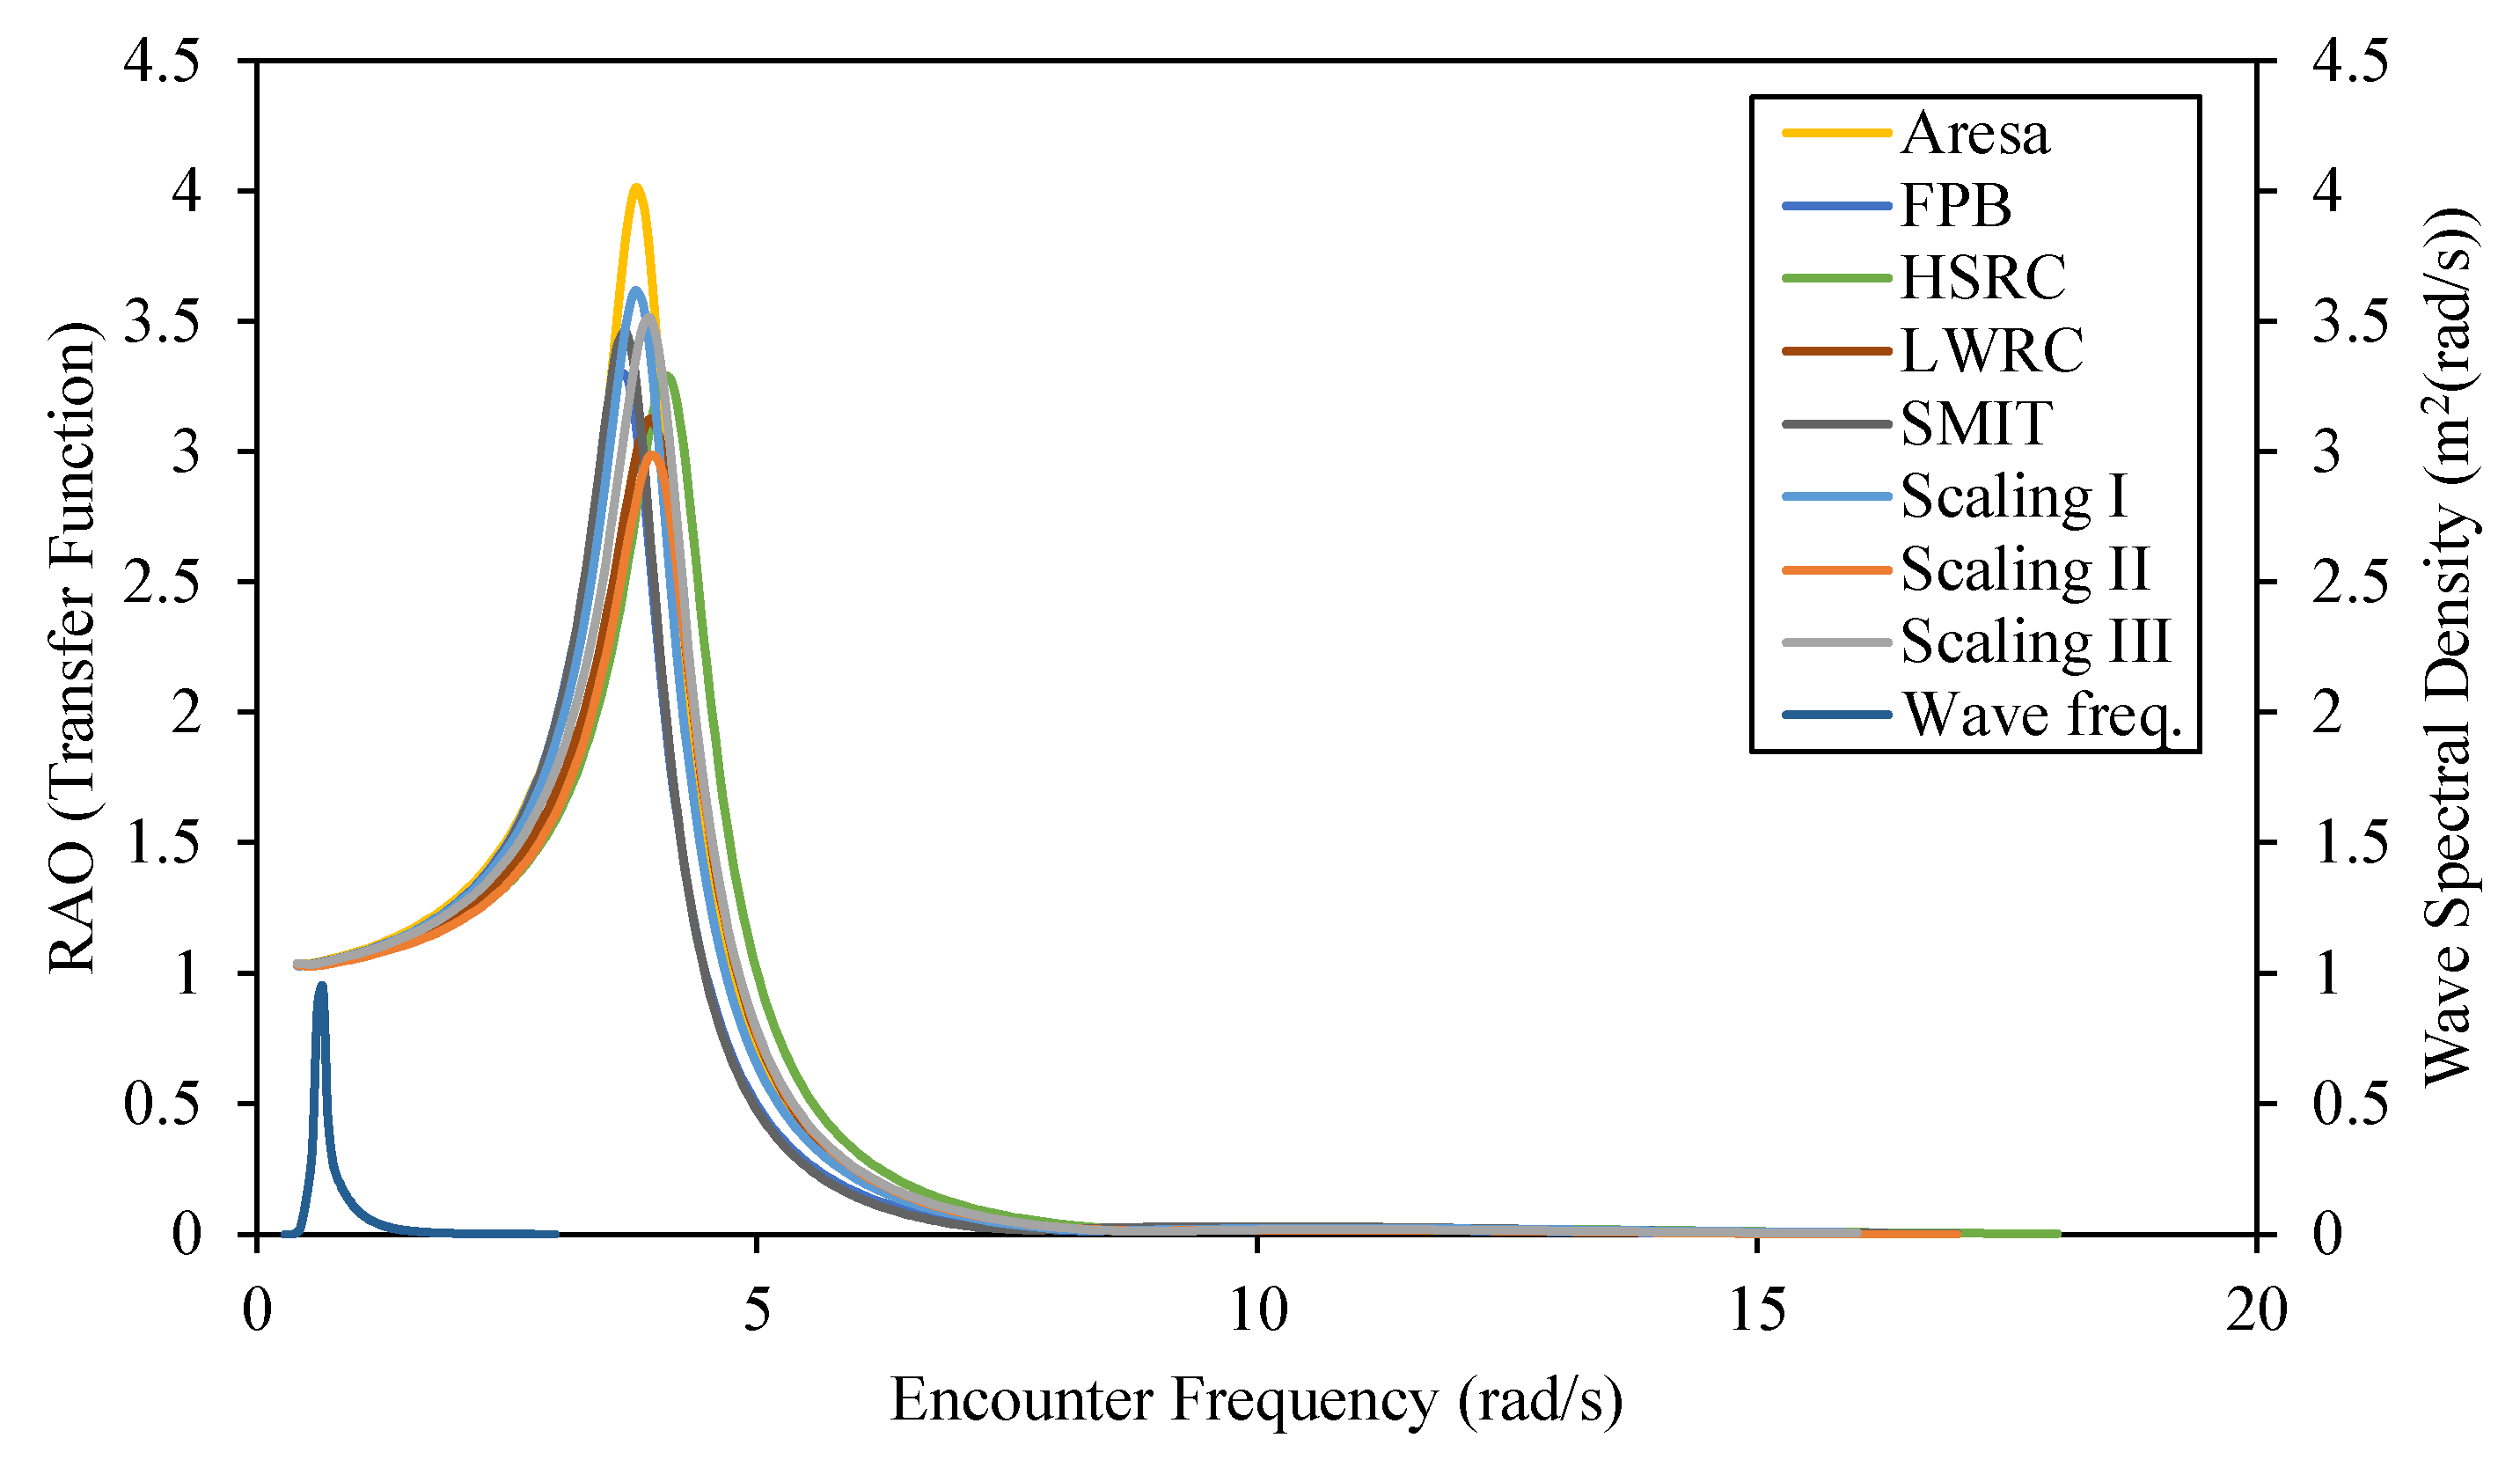
Figure 28.
MSI graph for scaling models and reference ships.
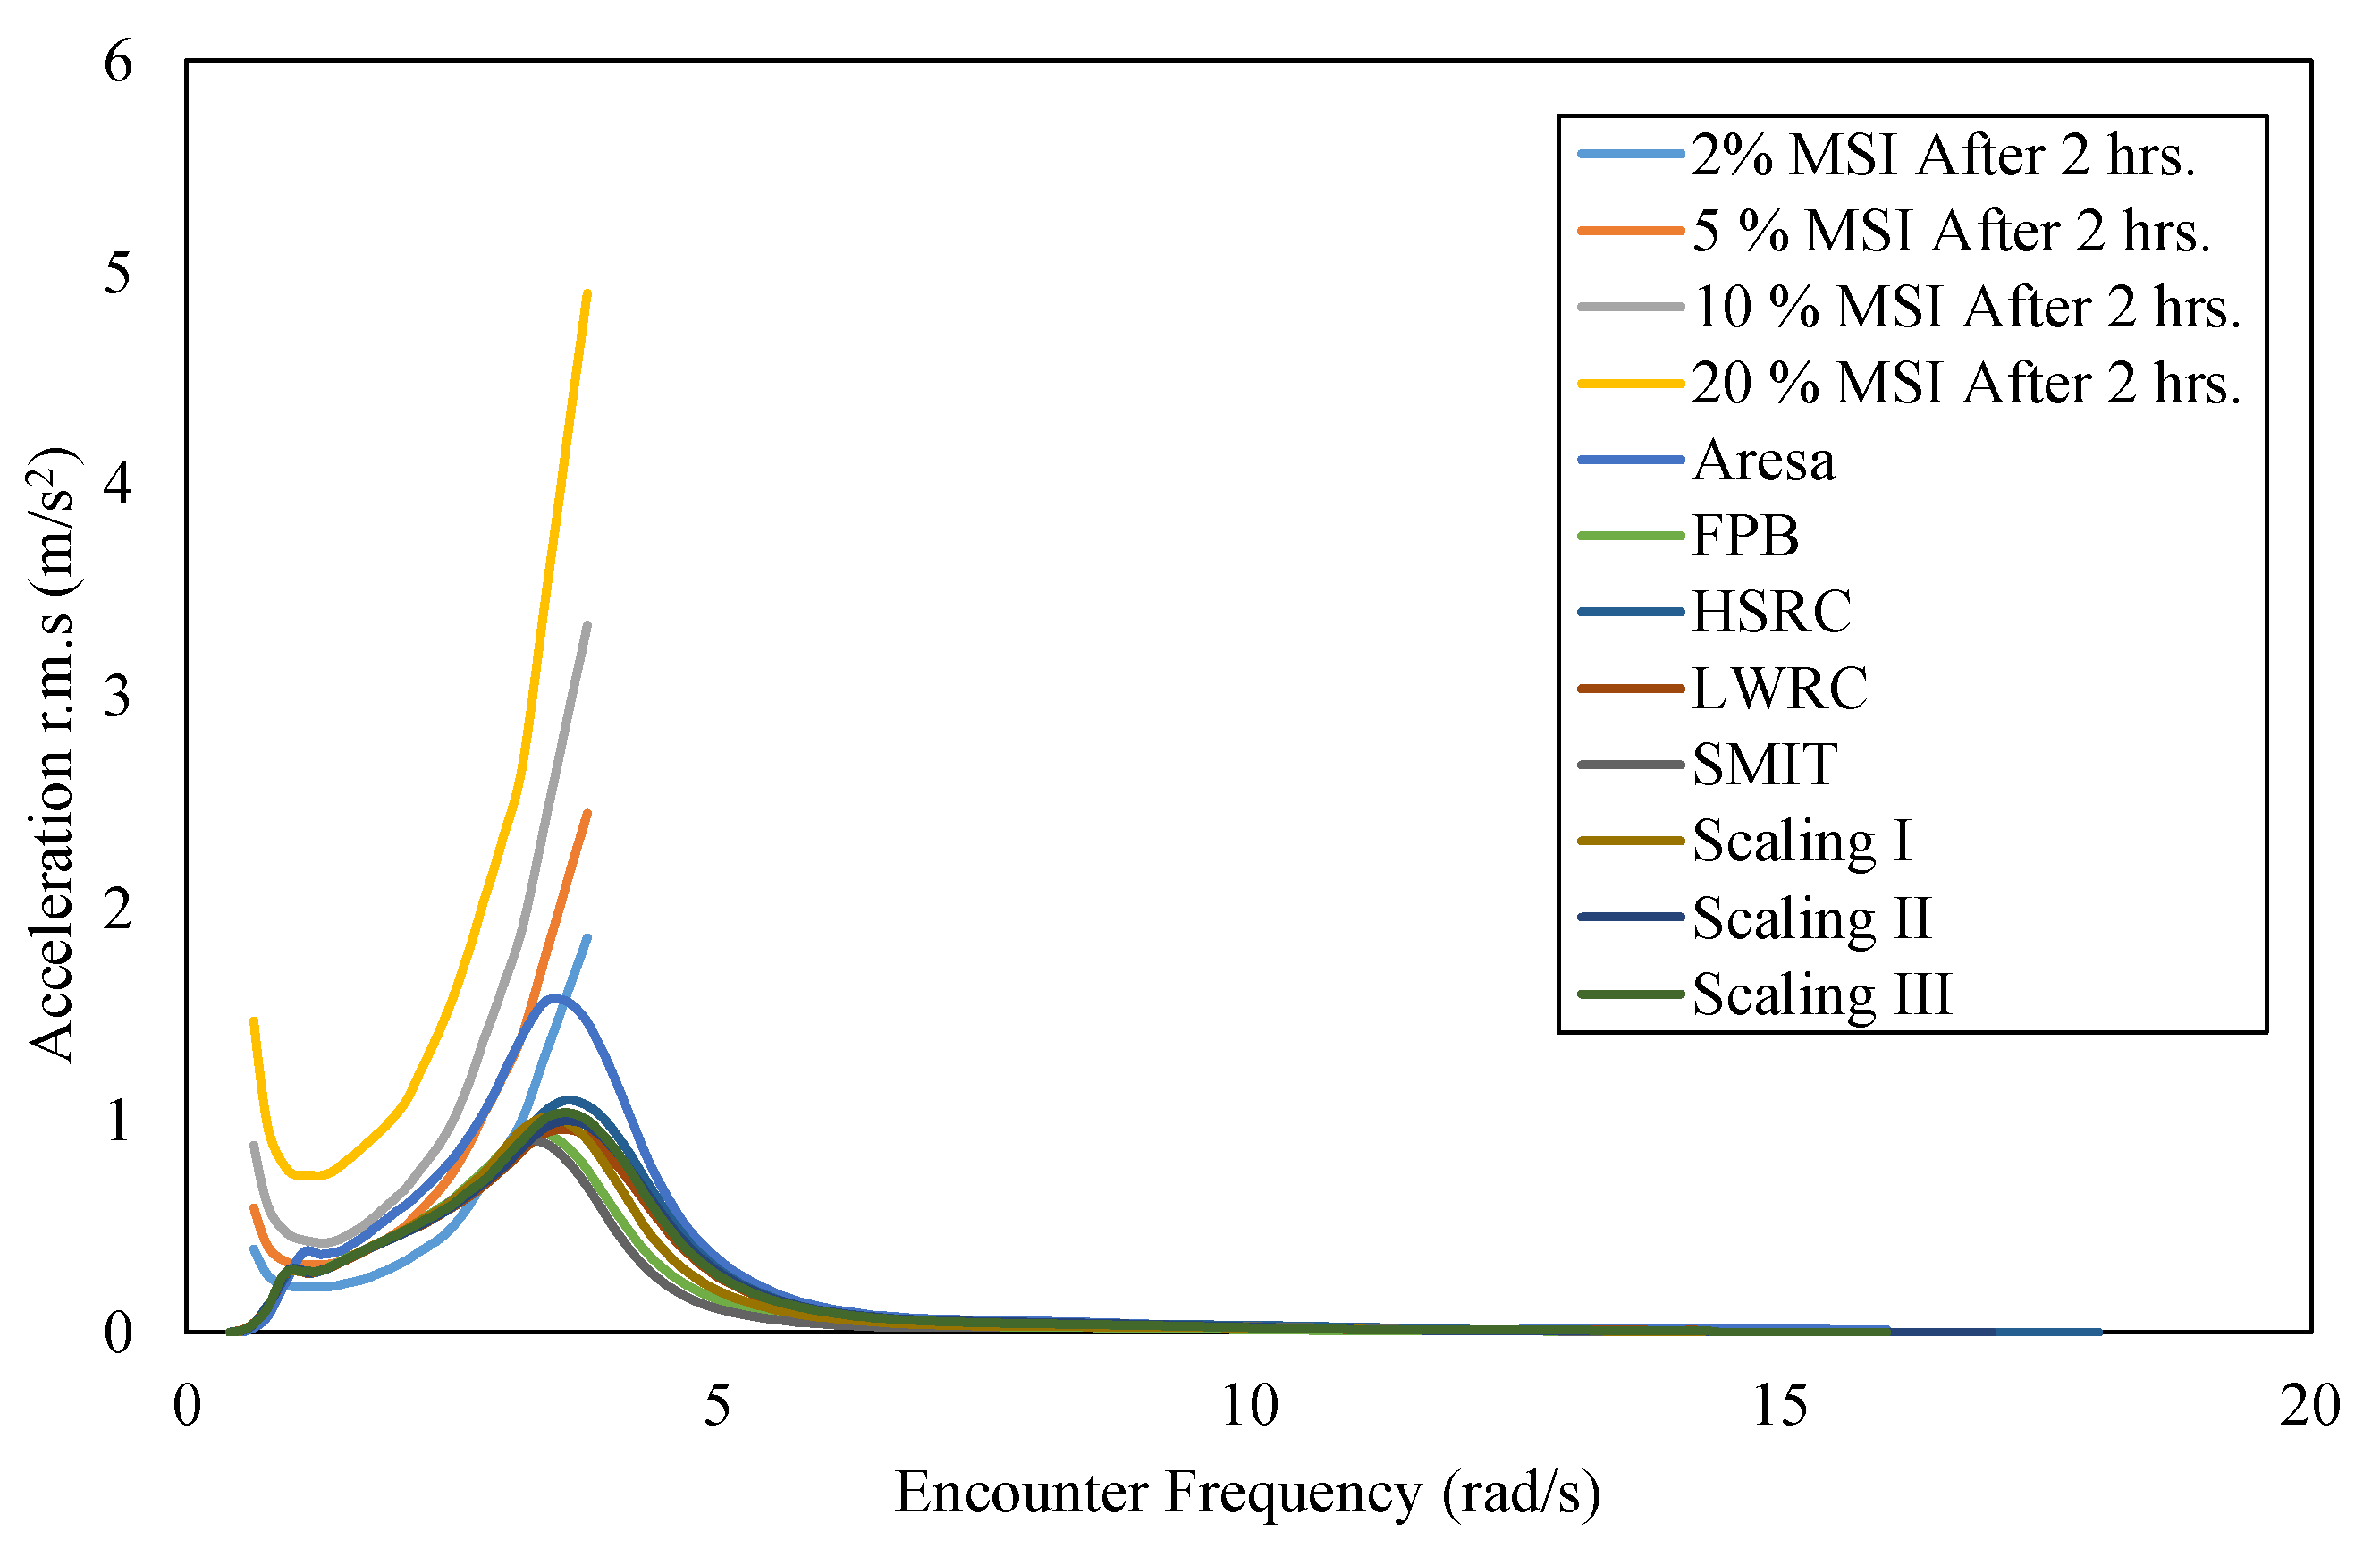

Table 1.
Primary data on reference patrol boats.
| Parameter | Type of Hull | ||||
|---|---|---|---|---|---|
| High-Speed Rescue Craft (12 m) | SMIT Patrol Boat | Lightweight Rescue Craft (13 m) | Fast Police Boat (15 m) | Aresa 1300 Sentinel RHIB | |
| DWT (t) | 3.200 | 2.300 | 3.000 | 2.500 | 2.100 |
| LOA (m) | 11.700 | 13.200 | 13.700 | 14.950 | 13.200 |
| Beam (m) | 4.200 | 4.100 | 4.200 | 4.100 | 3.600 |
| Depth (m) | 1.600 | 1.600 | 1.600 | 1.940 | 1.820 |
| Draft (m) | 0.700 | 0.700 | 0.700 | 0.850 | 0.800 |
| LWL (m) | 11.296 | 11.490 | 12.840 | 13.702 | 11.921 |
| Cb (-) | 0.435 | 0.530 | 0.435 | 0.421 | 0.454 |
| Displacement (t) | 10.910 | 17.270 | 13.010 | 18.930 | 14.560 |
Table 2.
Primary data of new patrol boat designs.
| Parameter | Value |
|---|---|
| DWT (t) | 2.60 |
| LOA (m) | 13.37 |
| Beam (m) | 4.032 |
| Depth (m) | 1.715 |
| Draft (m) | 0.751 |
Table 3.
Details of main dimensions of patrol boats from regression method.
| Parameter | Model | ||
|---|---|---|---|
| Regression I | Regression II | Regression III | |
| DWT (t) | 2.600 | 2.600 | 2.600 |
| LOA (m) | 13.370 | 13.370 | 13.370 |
| Beam (m) | 4.031 | 4.031 | 4.031 |
| Depth (m) | 1.715 | 1.715 | 1.715 |
| Draft (m) | 0.751 | 0.751 | 0.751 |
| LWL (m) | 11.967 | 12.042 | 12.393 |
| Cb (-) | 0.451 | 0.459 | 0.461 |
| Displacement (t) | 13.120 | 14.700 | 14.170 |
Table 4.
Results of reference ship resistance analysis.
| Froude Number | Resistance (kN) | Effective Power (kW) | ||||||||
|---|---|---|---|---|---|---|---|---|---|---|
| Aresa | FPB | HSRC | LWRC | SMIT | Aresa | FPB | HSRC | LWRC | SMIT | |
| 0 | 0 | 0 | 0 | 0 | 0 | 0 | 0 | 0 | 0 | 0 |
| 0.5 | 0 | 0 | 0 | 0 | 0 | 0 | 0 | 0 | 0 | 0 |
| 1 | 28.44 | 31.86 | 15.26 | 18.90 | 19.60 | 363.65 | 436.30 | 189.30 | 214.15 | 249.07 |
| 1.5 | 26.59 | 31.38 | 18.22 | 21.60 | 26.52 | 507.71 | 645.75 | 339.06 | 363.24 | 497.49 |
| 2 | 28.44 | 35.49 | 22.39 | 26.40 | 34.65 | 725.00 | 971.91 | 555.61 | 593.96 | 870.22 |
| 2.5 | 33.82 | 43.95 | 28.93 | 34.10 | 45.80 | 1077.20 | 1502.97 | 897.49 | 959.23 | 1434.57 |
| 3 | 41.85 | 56.08 | 37.46 | 44.30 | 60.09 | 1598.98 | 2308.20 | 1391.57 | 1492.36 | 2254.81 |
Table 5.
Details of primary dimensions of patrol boats from scale method.
| Parameter | Model | ||
|---|---|---|---|
| Scale I | Scale II | Scale III | |
| DWT (t) | 2.600 | 2.600 | 2.600 |
| LOA (m) | 13.370 | 13.370 | 13.370 |
| Beam (m) | 4.031 | 4.031 | 4.031 |
| Depth (m) | 1.715 | 1.715 | 1.715 |
| Draft (m) | 0.751 | 0.751 | 0.751 |
| LWL (m) | 12.027 | 12.909 | 12.535 |
| Cb (-) | 0.454 | 0.436 | 0.435 |
| Displacement (t) | 15.040 | 12.810 | 13.120 |
Table 6.
Comparison of resistance values in regression method and scaling method.
| Froude Number | Resistance (kN) | |||||
|---|---|---|---|---|---|---|
| Regression I | Regression II | Regression III | Scale I | Scale II | Scale III | |
| 0 | 0 | 0 | 0 | 0 | 0 | 0 |
| 0.5 | 0 | 0 | 0 | 0 | 8.70 | 11.50 |
| 1 | 23.62 | 22.96 | 23.57 | 23.90 | 16.70 | 19.60 |
| 1.5 | 22.05 | 23.02 | 23.10 | 25.50 | 22.30 | 22.20 |
| 2 | 23.96 | 26.13 | 25.73 | 29.90 | 28.30 | 26.40 |
| 2.5 | 28.97 | 32.67 | 31.60 | 37.40 | 36.90 | 33.50 |
| 3 | 36.29 | 41.63 | 39.98 | 47.80 | 48.00 | 43.10 |
Table 7.
Comparison of power values in regression method and scaling method.
| Froude Number | Power (kW) | |||||
|---|---|---|---|---|---|---|
| Regression I | Regression II | Regression III | Scale I | Scale II | Scale III | |
| 0 | 0 | 0 | 0 | 0 | 0 | 0 |
| 0.5 | 0 | 0 | 0 | 0 | 49.88 | 64.32 |
| 1 | 303.72 | 295.26 | 306.74 | 264.79 | 189.14 | 219.43 |
| 1.5 | 423.79 | 442.28 | 450.94 | 416.81 | 376.61 | 370.75 |
| 2 | 612.77 | 668.17 | 669.67 | 653.59 | 636.48 | 588,13 |
| 2.5 | 924.89 | 1048.07 | 1028.11 | 1018.44 | 1040.17 | 931.76 |
| 3 | 1389.25 | 1600.05 | 1560.83 | 1558.96 | 1619.79 | 1435.34 |
Table 8.
Values of ship stability in regression and scaling models.
| Model | Stability | |||
|---|---|---|---|---|
| GZ (m) | Max Heel Angle (deg) | Area Under GZ Curve (m.deg) | Angle of Vanishing Point (deg) | |
| Regression I | 0.533 | 44.500 | 30.280 | 91.834 |
| Regression II | 0.587 | 41.800 | 33.780 | 90.856 |
| Regression III | 0.479 | 43.600 | 26.590 | 90.978 |
| Scale I | 0.547 | 33.600 | 30.650 | 89.020 |
| Scale II | 0.554 | 43.600 | 31.350 | 92.549 |
| Scale III | 0.478 | 44.500 | 26.570 | 91.765 |
Table 9.
Probabilities of slamming and deck wetness in regression and scale models.
| No. | Criteria | Regression I | Regression II | Regression III | Scale I | Scale II | Scale III |
|---|---|---|---|---|---|---|---|
| 1 | Deck Wetness (MII/h) | 0.114 | 0.073 | 0.150 | 0.329 | 0.158 | 0.150 |
| 2 | Slamming (MII/h) | 0.536 | 0.426 | 0.570 | 0.455 | 0.502 | 0.450 |
Table 10.
Comparison of resistance values between regression method and reference ships.
| Froude Number | Resistance (kN) | |||||||
|---|---|---|---|---|---|---|---|---|
| Aresa | FPB | HSRC | LWRC | SMIT | Regression I | Regression II | Regression III | |
| 0 | 0 | 0 | 0 | 0 | 0 | 0 | 0 | 0 |
| 0.5 | 0 | 0 | 0 | 0 | 0 | 0 | 0 | 0 |
| 1 | 28.44 | 31.86 | 15.26 | 18.90 | 19.60 | 23.62 | 22.96 | 23.57 |
| 1.5 | 26.59 | 31.38 | 18.22 | 21.60 | 26.52 | 22.05 | 23.02 | 23.10 |
| 2 | 28.44 | 35.49 | 22.39 | 26.40 | 34.65 | 23.96 | 26.13 | 25.73 |
| 2.5 | 33.82 | 43.95 | 28.93 | 34.10 | 45.80 | 28.97 | 32.67 | 31.60 |
| 3 | 41.85 | 56.08 | 37.46 | 44.30 | 60.09 | 36.29 | 41.63 | 39.98 |
Table 11.
Comparison of power values between regression method and reference ships.
| Froude Number | Power (kW) | |||||||
|---|---|---|---|---|---|---|---|---|
| Aresa | FPB | HSRC | LWRC | SMIT | Regression I | Regression II | Regression III | |
| 0 | 0 | 0 | 0 | 0 | 0 | 0 | 0 | 0 |
| 0.5 | 0 | 0 | 0 | 0 | 0 | 0 | 0 | 0 |
| 1 | 363.65 | 436.30 | 189.30 | 214.15 | 249.07 | 303.72 | 295.26 | 306.74 |
| 1.5 | 507.71 | 645.75 | 339.06 | 363.244 | 497.49 | 423.79 | 442.28 | 450.94 |
| 2 | 725.00 | 971.91 | 555.61 | 593.962 | 870.22 | 612.77 | 668.17 | 669.67 |
| 2.5 | 1077.20 | 1502.97 | 897.49 | 959.234 | 1434.57 | 924.89 | 1048.07 | 1028.11 |
| 3 | 1598.98 | 2308.20 | 1391.57 | 1492.36 | 2254.81 | 1389.25 | 1600.05 | 1560.83 |
Table 12.
Values of ship stability for regression models and reference ships.
| Model | Stability | |||
|---|---|---|---|---|
| GZ (m) | Max Heel Angle (deg) | Area Under GZ Curve (m.deg) | Angle of Vanishing Point (deg) | |
| ARESA | 0.441 | 35.500 | 24.650 | 89.216 |
| FPB | 0.540 | 44.500 | 31.960 | 92.048 |
| HSRC | 0.648 | 40.900 | 36.800 | 91.765 |
| LWRC | 0.561 | 42.700 | 31.300 | 91.373 |
| SMIT | 0.737 | 36.400 | 42.640 | 90.000 |
| Regression I | 0.533 | 44.500 | 30.280 | 91.834 |
| Regression II | 0.587 | 41.800 | 33.780 | 90.856 |
| Regression III | 0.479 | 43.600 | 26.590 | 90.978 |
Table 13.
Probabilities of slamming and deck wetness for regression models and reference ships.
| No | Criteria | Aresa | FPB | HSRC | LWRC | SMIT | Regression I | Regression II | Regression III |
|---|---|---|---|---|---|---|---|---|---|
| 1 | Deck Wetness (MII/h) | 0.362 | 0.046 | 0.178 | 0.124 | 0.426 | 0.114 | 0.073 | 0.15 |
| 2 | Slamming (MII/h) | 0.510 | 0.371 | 0.557 | 0.621 | 1.9 | 0.536 | 0.426 | 0.57 |
Table 14.
Comparison of resistance values between scaling methods and reference ships.
| Froude Number | Resistance (kN) | |||||||
|---|---|---|---|---|---|---|---|---|
| ARESA | FPB | HSRC | LWRC | SMIT | Scaling I | Scaling II | Scaling III | |
| 0 | 0 | 0 | 0 | 0 | 0 | 0 | 0 | 0 |
| 0.5 | 0 | 0 | 0 | 0 | 0 | 0 | 8.70 | 11.50 |
| 1 | 28.44 | 31.86 | 15.26 | 18.90 | 19.60 | 23.90 | 16.70 | 19.60 |
| 1.5 | 26.59 | 31.38 | 18.22 | 21.60 | 26.52 | 25.50 | 22.30 | 22.20 |
| 2 | 28.44 | 35.49 | 22.39 | 26.40 | 34.65 | 29.90 | 28.30 | 26.40 |
| 2.5 | 33.82 | 43.95 | 28.93 | 34.10 | 45.80 | 37.40 | 36.90 | 33.50 |
| 3 | 41.85 | 56.08 | 37.46 | 44.30 | 60.09 | 47.80 | 48.00 | 43.10 |
Table 15.
Comparison of power values between scaling methods and reference ships.
| Froude Number | Power (kW) | |||||||
|---|---|---|---|---|---|---|---|---|
| ARESA | FPB | HSRC | LWRC | SMIT | Scale I | Scale II | Scale III | |
| 0 | 0 | 0 | 0 | 0 | 0 | 0 | 0 | 0 |
| 0.5 | 0 | 0 | 0 | 0 | 0 | 0 | 49.88 | 64.32 |
| 1 | 363.65 | 436.30 | 189.30 | 214.15 | 249.07 | 264.79 | 189.14 | 219.43 |
| 1.5 | 507.71 | 645.75 | 339.06 | 363.24 | 497.49 | 416.81 | 376.61 | 370.75 |
| 2 | 725.00 | 971.91 | 555.61 | 593.96 | 870.22 | 653.59 | 636.48 | 588.13 |
| 2.5 | 1077.20 | 1502.97 | 897.49 | 959.23 | 1434.57 | 1018.44 | 1040.17 | 931.76 |
| 3 | 1598.98 | 2308. 20 | 1391.57 | 1492.36 | 2254.81 | 1558.96 | 1619.78 | 1435.34 |
Table 16.
Values of ship stability in scaling models and reference ships.
| Model | Stability Parameter | |||
|---|---|---|---|---|
| Gz (m) | Max Heel Angle (deg) | Area Under GZ Curve (m.deg) | Angle of Vanishing Point (deg) | |
| ARESA | 0.441 | 35.500 | 24.650 | 89.216 |
| FPB | 0.540 | 44.500 | 31.960 | 92.048 |
| HSRC | 0.648 | 40.900 | 36.800 | 91.765 |
| LWRC | 0.561 | 42.700 | 31.300 | 91.373 |
| SMIT | 0.737 | 36.400 | 42.640 | 90.000 |
| Scale I | 0.547 | 33.600 | 30.650 | 89.020 |
| Scale II | 0.554 | 43.600 | 31.350 | 92.549 |
| Scale III | 0.478 | 44.500 | 26.570 | 91.765 |
Table 17.
Probabilities of slamming and deck wetness for regression models and reference ships.
| Criteria | ARESA | FPB | HSRC | LWRC | SMIT | Scale I | Scale II | Scale III |
|---|---|---|---|---|---|---|---|---|
| Deck Wetness (MII/h) | 0.362 | 0.046 | 0.178 | 0.124 | 0.426 | 0.329 | 0.158 | 0.150 |
| Slamming (MII/h) | 0.510 | 0.371 | 0.557 | 0.621 | 1.900 | 0.455 | 0.502 | 0.450 |
Table 18.
Recapitulation of resistance analysis results.
| Method | Model | Resistance (Fn = 3) | |
|---|---|---|---|
| Resistance (kN) | Power (kW) | ||
| Reference Ship | Aresa | 41.85 | 1598.98 |
| FPB | 56.08 | 2308.20 | |
| HSRC | 37.46 | 1391.57 | |
| LWRC | 44.30 | 1492.36 | |
| SMIT | 60.09 | 2254.81 | |
| Regression | Regression I | 36.29 | 1389.25 |
| Regression II | 41.63 | 1600.05 | |
| Regression III | 39.98 | 1560.83 | |
| Scaling | Scale I | 47.80 | 1558.97 |
| Scale II | 48.00 | 1619.79 | |
| Scale III | 43.10 | 1435.34 | |
Table 19.
Percentages of resistance similarities between regression models and reference models.
| Model Comparison | Similarity (%) | |
|---|---|---|
| Resistance | ||
| Regression I | Aresa | 86.714 |
| FPB | 64.711 | |
| HSRC | 96.877 | |
| LWRC | 81.919 | |
| SMIT | 60.393 | |
| Regression II | Aresa | 99.474 |
| FPB | 74.233 | |
| HSRC | 89.983 | |
| LWRC | 93.973 | |
| SMIT | 69.279 | |
| Regression III | Aresa | 95.532 |
| FPB | 71.291 | |
| HSRC | 93.697 | |
| LWRC | 90.248 | |
| SMIT | 66.534 | |
| MAX | 99.474 | |
| MIN | 60.393 | |
| AVERAGE | 82.324 | |
Table 20.
Percentages of resistance similarities between scale models and reference models.
| Model Comparison | Similarity (%) | |
|---|---|---|
| Resistance | ||
| Scale I | Aresa | 87.552 |
| FPB | 85.235 | |
| HSRC | 78.368 | |
| LWRC | 92.678 | |
| SMIT | 79.547 | |
| Scale II | Aresa | 87.188 |
| FPB | 85.592 | |
| HSRC | 78.042 | |
| LWRC | 92.292 | |
| SMIT | 79.880 | |
| Scale III | Aresa | 97.100 |
| FPB | 76.854 | |
| HSRC | 86.914 | |
| LWRC | 97.291 | |
| SMIT | 71.726 | |
| MAX | 97.291 | |
| MIN | 71.726 | |
| AVERAGE | 85.084 | |
Table 21.
Colour indicators in tables of similarity resistances between models.
| Colour | Description |
|---|---|
| Larger scale model | |
| Larger regression model | |
| Larger reference model |
Table 22.
Recapitulation of stability analysis results.
| Method | Model | Stability | |||
|---|---|---|---|---|---|
| Gz (m) | Max Heel Angle (deg) | Area Under GZ Curve (m.deg) | Angle of Vanishing Point (deg) | ||
| Reference Ship | Aresa | 0.441 | 35.5 | 24.65 | 89.216 |
| FPB | 0.540 | 44.5 | 31.96 | 92.048 | |
| HSRC | 0.648 | 40.9 | 36.80 | 91.765 | |
| LWRC | 0.561 | 42.7 | 31.30 | 91.373 | |
| SMIT | 0.737 | 36.4 | 42.64 | 90.000 | |
| Regression | Regression I | 0.533 | 44.5 | 30.28 | 91.834 |
| Regression II | 0.587 | 41.8 | 33.78 | 90.856 | |
| Regression III | 0.479 | 43.6 | 26.59 | 90.978 | |
| Scaling | Scale I | 0.547 | 33.6 | 30.65 | 89.020 |
| Scale II | 0.554 | 43.6 | 31.35 | 92.549 | |
| Scale III | 0.478 | 44.5 | 26.57 | 91.765 | |
Table 23.
Percentages of similarity stability between regression models and reference models.
| Model Comparison | Similarity (%) | |
|---|---|---|
| Surface Area under Curve | ||
| Regression I | Aresa | 81.407 |
| FPB | 94.743 | |
| HSRC | 82.283 | |
| LWRC | 96.741 | |
| SMIT | 71.013 | |
| Regression II | Aresa | 72.972 |
| FPB | 94.612 | |
| HSRC | 91.793 | |
| LWRC | 92.658 | |
| SMIT | 79.221 | |
| Regression III | Aresa | 92.704 |
| FPB | 83.198 | |
| HSRC | 72.255 | |
| LWRC | 84.952 | |
| SMIT | 62.359 | |
| MAX | 96.741 | |
| MIN | 62.359 | |
| AVERAGE | 83.528 | |
Table 24.
Percentages of similarity stability between scale models and reference models.
| Model Comparison | Similarity (%) | |
|---|---|---|
| Surface Area under Curve | ||
| Scale I | Aresa | 80.424 |
| FPB | 95.901 | |
| HSRC | 83.288 | |
| LWRC | 97.923 | |
| SMIT | 71.881 | |
| Scale II | Aresa | 78.628 |
| FPB | 98.091 | |
| HSRC | 85.190 | |
| LWRC | 99.841 | |
| SMIT | 73.523 | |
| Scale III | Aresa | 92.774 |
| FPB | 83.135 | |
| HSRC | 72.201 | |
| LWRC | 84.888 | |
| SMIT | 62.312 | |
| MAX | 99.841 | |
| MIN | 62.312 | |
| AVERAGE | 84.000 | |
Table 25.
Colour indicators in the stability similarity tables between models.
| Colour | Description |
|---|---|
| Larger scale model | |
| Larger regression model | |
| Larger reference model |
Table 26.
Recapitulation of seakeeping analysis results.
| Method | Model | Seakeeping | |||||
|---|---|---|---|---|---|---|---|
| Heaving (m/m) | Rolling (rad/rad) | Pitching (rad/rad) | MSI (%) | Deck Wetness (MII/h) | Slamming (MII/h) | ||
| Reference Ship | Aresa | 1.001 | 6.682 | 4.014 | 5.00 | 0.362 | 0.510 |
| FPB | 1.001 | 6.683 | 3.301 | 5.00 | 0.046 | 0.371 | |
| HSRC | 1.001 | 6.562 | 3.288 | 5.00 | 0.178 | 0.557 | |
| LWRC | 1.001 | 6.637 | 3.125 | 5.00 | 0.124 | 0.621 | |
| SMIT | 1.000 | 6.576 | 3.460 | 5.00 | 0.426 | 1.900 | |
| Regression | Regression I | 1.001 | 6.679 | 3.433 | 5.00 | 0.114 | 0.536 |
| Regression II | 1.001 | 6.516 | 3.440 | 5.00 | 0.073 | 0.426 | |
| Regression III | 1.001 | 6.679 | 3.708 | 5.00 | 0.150 | 0.570 | |
| Scaling | Scale I | 1.001 | 6.584 | 3.616 | 5.00 | 0.329 | 0.455 |
| Scale II | 1.001 | 6.629 | 2.984 | 5.00 | 0.158 | 0.502 | |
| Scale III | 1.001 | 6.506 | 3.513 | 5.00 | 0.150 | 0.450 | |
Table 27.
Percentages of seakeeping similarity between regression models and reference models.
| Model Comparison | Similarity (%) | |||
|---|---|---|---|---|
| Heaving | Rolling | Pitching | ||
| Regression I | Aresa | 99.973 | 99.960 | 85.516 |
| FPB | 99.978 | 99.948 | 96.156 | |
| HSRC | 99.994 | 98.237 | 95.798 | |
| LWRC | 99.994 | 99.200 | 86.415 | |
| SMIT | 99.971 | 98.448 | 99.200 | |
| Regression II | Aresa | 99.976 | 97.513 | 85.707 |
| FPB | 99.981 | 97.501 | 95.941 | |
| HSRC | 99.997 | 99.303 | 95.584 | |
| LWRC | 99.986 | 98.169 | 90.841 | |
| SMIT | 99.969 | 99.090 | 99.422 | |
| Regression III | Aresa | 99.986 | 99.961 | 92.390 |
| FPB | 99.991 | 99.949 | 89.001 | |
| HSRC | 99.994 | 98.236 | 88.670 | |
| LWRC | 99.995 | 99.370 | 84.270 | |
| SMIT | 99.959 | 98.447 | 93.306 | |
| MAX | 99.997 | 99.961 | 99.422 | |
| MIN | 99.959 | 97.501 | 84.270 | |
| AVERAGE | 99.983 | 98.889 | 91.881 | |
Table 28.
Percentages of seakeeping similarity between scale models and reference models.
| Model Comparison | Similarity (%) | |||
|---|---|---|---|---|
| Heaving | Rolling | Pitching | ||
| Scale I | Aresa | 99.985 | 98.537 | 90.096 |
| FPB | 99.990 | 98.525 | 91.267 | |
| HSRC | 99.995 | 99.655 | 90.927 | |
| LWRC | 99.994 | 99.200 | 86.415 | |
| SMIT | 99.960 | 99.870 | 95.681 | |
| Scale II | Aresa | 99.997 | 99.210 | 74.337 |
| FPB | 99.992 | 99.198 | 90.403 | |
| HSRC | 99.977 | 98.979 | 90.741 | |
| LWRC | 99.988 | 99.878 | 95.479 | |
| SMIT | 99.942 | 99.192 | 86.232 | |
| Scale III | Aresa | 99.995 | 97.370 | 87.527 |
| FPB | 100.000 | 97.358 | 93.946 | |
| HSRC | 99.985 | 99.157 | 93.596 | |
| LWRC | 99.996 | 98.025 | 88.952 | |
| SMIT | 99.950 | 98.944 | 98.490 | |
| MAX | 100.000 | 99.878 | 98.490 | |
| MIN | 99.942 | 97.358 | 74.337 | |
| AVERAGE | 99.983 | 98.873 | 90.273 | |
Table 29.
Colour indicators in seakeeping similarity tables between models.
| Colour | Description |
|---|---|
| Larger scale model | |
| Larger regression model | |
| Larger reference model | |
| Same value |
Table 30.
Percentages of similarity for regression and scaling models vs. reference model.
| Criteria | Similarity | |||||
|---|---|---|---|---|---|---|
| Regression vs. Reference Ship | Scale vs. Reference Ship | |||||
| Resistance | Stability | Seakeeping | Resistance | Stability | Seakeeping | |
| MAX | 99.474 | 96.741 | 99.793 | 97.291 | 99.841 | 99.456 |
| MIN | 60.393 | 62.359 | 93.910 | 71.726 | 62.312 | 90.546 |
| AVERAGE | 82.324 | 83.528 | 96.918 | 85.084 | 84.000 | 96.376 |
Table 31.
Weights of primary criteria.
| Criterion | Description | Weight |
|---|---|---|
| C1 | Resistance | 50% |
| C2 | Stability | 30% |
| C3 | Seakeeping | 20% |
Table 32.
Alternative design models.
| Alternative | Description |
|---|---|
| A1 | Aresa 1300 Sentinel |
| A2 | Fast Police Boat |
| A3 | High-Speed Rescue Craft |
| A4 | Lightweight Rescue Craft |
| A5 | SMIT Patrol Boat |
| A6 | Regression I |
| A7 | Regression II |
| A8 | Regression III |
| A9 | Scale I |
| A10 | Scale II |
| A11 | Scale III |
Table 33.
Data criteria for simulation results of design models.
| Alternative Model | Criteria | ||
|---|---|---|---|
| C1 | C2 | C3 | |
| A1 | 41.850 | 24.650 | 3.898 |
| A2 | 56.080 | 31.960 | 3.661 |
| A3 | 37.460 | 36.800 | 3.616 |
| A4 | 44.300 | 31.300 | 3.587 |
| A5 | 60.090 | 42.640 | 3.678 |
| A6 | 36.290 | 30.280 | 3.704 |
| A7 | 41.630 | 33.780 | 3.652 |
| A8 | 39.980 | 26.590 | 3.796 |
| A9 | 47.800 | 30.650 | 3.733 |
| A10 | 48.000 | 31.350 | 3.537 |
| A11 | 43.100 | 26.570 | 3.673 |
Table 34.
MADM normalised data.
| Normalisation | |||
|---|---|---|---|
| Alternative | C1 | C2 | C3 |
| A1 | 0.867 | 0.578 | 0.907 |
| A2 | 0.647 | 0.750 | 0.966 |
| A3 | 0.969 | 0.863 | 0.978 |
| A4 | 0.819 | 0.734 | 0.986 |
| A5 | 0.604 | 1.000 | 0.962 |
| A6 | 1.000 | 0.710 | 0.955 |
| A7 | 0.872 | 0.792 | 0.969 |
| A8 | 0.908 | 0.624 | 0.932 |
| A9 | 0.759 | 0.719 | 0.947 |
| A10 | 0.756 | 0.735 | 1.000 |
| A11 | 0.842 | 0.623 | 0.963 |
Table 35.
MADM weighted data.
| Alternative | Criterion | Total Weight | ||
|---|---|---|---|---|
| C1 | C2 | C3 | ||
| A1 | 0.434 | 0.173 | 0.181 | 0.788 |
| A2 | 0.324 | 0.225 | 0.193 | 0.742 |
| A3 | 0.484 | 0.259 | 0.196 | 0.939 |
| A4 | 0.410 | 0.220 | 0.197 | 0.827 |
| A5 | 0.302 | 0.300 | 0.192 | 0.794 |
| A6 | 0.500 | 0.213 | 0.191 | 0.904 |
| A7 | 0.436 | 0.238 | 0.194 | 0.867 |
| A8 | 0.454 | 0.187 | 0.186 | 0.827 |
| A9 | 0.380 | 0.216 | 0.189 | 0.785 |
| A10 | 0.378 | 0.221 | 0.200 | 0.799 |
| A11 | 0.421 | 0.187 | 0.193 | 0.801 |
Table 36.
MADM ranking results.
| Alternative Design | Total Weight | Ranking |
|---|---|---|
| A3 | 0.939 | 1 |
| A6 | 0.904 | 2 |
| A7 | 0.867 | 3 |
| A8 | 0.827 | 4 |
| A4 | 0.827 | 5 |
| A11 | 0.801 | 6 |
| A10 | 0.799 | 7 |
| A5 | 0.794 | 8 |
| A1 | 0.788 | 9 |
| A9 | 0.785 | 10 |
| A2 | 0.742 | 11 |
Table 37.
Details and time required for each method.
| Method | Process Details | Estimated Time (Minutes) |
|---|---|---|
| Reference Ship | Determining type of ship | 15 |
| Looking for primary data and shape of hull of five reference ships according to type of ship determined | 75 | |
| Modelling five selected reference ships | 150 | |
| Performing hydrodynamic analysis of entire hull of ship | 350 | |
| Performing analysis results calculations | 200 | |
| Total | 790 | |
| Regression | Determining type of ship | 15 |
| Looking for primary data of five ships according to type of ship determined | 50 | |
| Performing regression analysis calculations | 20 | |
| Modelling three ships according to regression results with new geometry | 150 | |
| Performing hydrodynamic analysis of three new hulls | 210 | |
| Performing analysis results calculations | 120 | |
| Total | 565 | |
| Scaling | Determining type of ship | 15 |
| Looking for primary data and shape of hull of five reference ships according to type of ship determined | 75 | |
| Modelling five selected reference ships | 150 | |
| Analyzing resistance of entire hull until three hulls with lowest resistance values are selected | 100 | |
| Defining new primary dimension | 20 | |
| Performing scaling process with help of 3D modelling software on three selected ships according to new size | 30 | |
| Performing hydrodynamic analyses of three new hulls | 210 | |
| Performing analysis results calculations | 120 | |
| Total | 720 |
Publisher’s Note: MDPI stays neutral with regard to jurisdictional claims in published maps and institutional affiliations. |
© 2022 by the authors. Licensee MDPI, Basel, Switzerland. This article is an open access article distributed under the terms and conditions of the Creative Commons Attribution (CC BY) license (https://creativecommons.org/licenses/by/4.0/).
Share and Cite
MDPI and ACS Style
Rahmaji, T.; Prabowo, A.R.; Tuswan, T.; Muttaqie, T.; Muhayat, N.; Baek, S.-J. Design of Fast Patrol Boat for Improving Resistance, Stability, and Seakeeping Performance. Designs 2022, 6, 105. https://doi.org/10.3390/designs6060105
AMA Style
Rahmaji T, Prabowo AR, Tuswan T, Muttaqie T, Muhayat N, Baek S-J. Design of Fast Patrol Boat for Improving Resistance, Stability, and Seakeeping Performance. Designs. 2022; 6(6):105. https://doi.org/10.3390/designs6060105
Chicago/Turabian StyleRahmaji, Tri, Aditya Rio Prabowo, Tuswan Tuswan, Teguh Muttaqie, Nurul Muhayat, and Seung-Jun Baek. 2022. "Design of Fast Patrol Boat for Improving Resistance, Stability, and Seakeeping Performance" Designs 6, no. 6: 105. https://doi.org/10.3390/designs6060105