
Congested Period in Professional Youth Soccer Players Showed a Different High Decelerations Profile in the Group Performance and a Specific Positional Behaviour
 , and
, and
Abstract
:1. Introduction
2. Materials and Methods
2.1. Subjects
2.2. Design
2.3. Statistics
3. Results
4. Discussion
5. Conclusions
Author Contributions
Funding
Institutional Review Board Statement
Informed Consent Statement
Data Availability Statement
Conflicts of Interest
References
- Orendurff, M.S.; Walker, J.D.; Jovanovic, M.; Tulchin, K.L.; Levy, M.; Hoffmann, D.K. Intensity and duration of intermittent exercise and recovery during a soccer match. J. Strength Cond. Res. 2010, 24, 2683–2692. [Google Scholar] [CrossRef] [PubMed] [Green Version]
- Stolen, T.; Chamari, K.; Castagna, C.; Wisloff, U. Physiology of soccer: An update. Sports Med. 2005, 35, 501–536. [Google Scholar] [CrossRef] [PubMed]
- Barnes, C.; Archer, D.T.; Hogg, B.; Bush, M.; Bradley, P.S. The evolution of physical and technical performance parameters in the English Premier League. Int. J. Sports Med. 2014, 35, 1095–1100. [Google Scholar] [CrossRef] [PubMed]
- Bush, M.; Barnes, C.; Archer, D.T.; Hogg, B.; Bradley, P.S. Evolution of match performance parameters for various playing positions in the English Premier League. Hum. Mov. Sci. 2015, 39, 1–11. [Google Scholar] [CrossRef] [PubMed]
- Bradley, P.S.; Archer, D.T.; Hogg, B.; Schuth, G.; Bush, M.; Carling, C.; Barnes, C. Tier-specific evolution of match performance characteristics in the English Premier League: It’s getting tougher at the top. J. Sports Sci. 2016, 34, 980–987. [Google Scholar] [CrossRef] [PubMed]
- Nassis, G.P.; Massey, A.; Jacobsen, P.; Brito, J.; Randers, M.B.; Castagna, C.; Mohr, M.; Krustrup, P. Elite football of 2030 will not be the same as that of 2020: Preparing players, coaches, and support staff for the evolution. Scand. J. Med. Sci. Sports 2020, 30, 962–964. [Google Scholar] [CrossRef]
- Carling, C.; Lacome, M.; McCall, A.; Dupont, G.; Le Gall, F.; Simpson, B.; Buchheit, M. Monitoring of Post-match Fatigue in Professional Soccer: Welcome to the Real World. Sports Med. 2018, 48, 2695–2702. [Google Scholar] [CrossRef] [Green Version]
- Julian, R.; Page, R.M.; Harper, L.D. The Effect of Fixture Congestion on Performance during Professional Male Soccer Match-Play: A Systematic Critical Review with Meta-Analysis. Sports Med. 2021, 51, 255–273. [Google Scholar] [CrossRef]
- Garcia, G.R.; Goncalves, L.G.C.; Clemente, F.M.; Nakamura, F.Y.; Nobari, H.; Bedo, B.L.S.; Azevedo, A.M.; Guerra, M.A., Jr.; Aquino, R. Effects of congested fixture and matches’ participation on internal and external workload indices in professional soccer players. Sci. Rep. 2022, 12, 1864. [Google Scholar] [CrossRef]
- Brito de Souza, D.; Lopez-Del Campo, R.; Resta, R.; Moreno-Perez, V.; Del Coso, J. Running Patterns in LaLiga Before and After Suspension of the Competition Due to COVID-19. Front. Physiol. 2021, 12, 666593. [Google Scholar] [CrossRef] [PubMed]
- Noor, D.; McCall, A.; Jones, M.; Duncan, C.; Ehrmann, F.; Meyer, T.; Duffield, R. Perceived load, fatigue and recovery responses during congested and non-congested micro-cycles in international football tournaments. J. Sci. Med. Sport 2021, 24, 1278–1283. [Google Scholar] [CrossRef] [PubMed]
- Dellal, A.; Lago-Penas, C.; Rey, E.; Chamari, K.; Orhant, E. The effects of a congested fixture period on physical performance, technical activity and injury rate during matches in a professional soccer team. Br. J. Sports Med. 2015, 49, 390–394. [Google Scholar] [CrossRef] [PubMed] [Green Version]
- Dupont, G.; Nedelec, M.; McCall, A.; McCormack, D.; Berthoin, S.; Wisloff, U. Effect of 2 soccer matches in a week on physical performance and injury rate. Am. J. Sports Med. 2010, 38, 1752–1758. [Google Scholar] [CrossRef] [PubMed]
- Lago-Penas, C.; Rey, E.; Lago-Ballesteros, J.; Casais, L.; Dominguez, E. The influence of a congested calendar on physical performance in elite soccer. J. Strength Cond. Res. 2011, 25, 2111–2117. [Google Scholar] [CrossRef] [PubMed]
- Djaoui, L.; Wong, D.P.; Pialoux, V.; Hautier, C.; Da Silva, C.D.; Chamari, K.; Dellal, A. Physical Activity during a Prolonged Congested Period in a Top-Class European Football Team. Asian J. Sports Med. 2014, 5, 47–53. [Google Scholar] [CrossRef] [Green Version]
- Doncaster, G.; White, P.; Svenson, R.; Page, R.M. The influence of fixture congestion on physical performance response to soccer match-play. Res. Sports Med. 2021, 7, 1–15. [Google Scholar] [CrossRef]
- Djaoui, L.; Owen, A.; Newton, M.; Nikolaidis, P.T.; Dellal, A.; Chamari, K. Effects of congested match periods on acceleration and deceleration profiles in professional soccer. Biol. Sport 2022, 39, 307–317. [Google Scholar] [CrossRef]
- Penedo-Jamardo, E.; Rey, E.; Padrón-Cabo, A.; Kalén, A. The impact of different recovery times between matches on physical and technical performance according to playing positions. Int. J. Perform. Anal. Sport 2017, 17, 271–282. [Google Scholar] [CrossRef]
- Jones, R.N.; Greig, M.; Mawene, Y.; Barrow, J.; Page, R.M. The influence of short-term fixture congestion on position specific match running performance and external loading patterns in English professional soccer. J. Sports Sci. 2019, 37, 1338–1346. [Google Scholar] [CrossRef]
- Lago-Ballesteros, J.; Lago-Penas, C.; Rey, E.; Casais, L.; Dellal, A. The effect of cumulative fatigue on activity profiles of professional soccer players during a congested fixture period. Biol. Sport 2010, 27, 181–185. [Google Scholar]
- Zanetti, V.; Aoki, M.S.; Bradley, P.; Carling, C.; Marino, T.K.; Moreira, A. Running Performance and Hormonal, Maturity and Physical Variables in Starting and Non-Starting Elite U14 Soccer Players During a Congested Match Schedule. J. Hum. Kinet. 2021, 80, 287–295. [Google Scholar] [CrossRef] [PubMed]
- Zanetti, V.; Carling, C.; Aoki, M.S.; Bradley, P.S.; Moreira, A. Are There Differences in Elite Youth Soccer Player Work Rate Profiles in Congested vs. Regular Match Schedules? J. Strength Cond. Res. 2021, 35, 473–480. [Google Scholar] [CrossRef] [PubMed] [Green Version]
- Castellano, J.; Martin-Garcia, A.; Casamichana, D. Most running demand passages of match play in youth soccer congestion period. Biol. Sport 2020, 37, 367–373. [Google Scholar] [CrossRef] [PubMed]
- Jimenez, S.L.; Mateus, N.; Weldon, A.; Bustamante-Sanchez, A.; Kelly, A.L.; Sampaio, J. Analysis of the most demanding passages of play in elite youth soccer: A comparison between congested and non-congested fixture schedules. Sci. Med. Footb. 2022, 29, 1–8. [Google Scholar] [CrossRef]
- Andrzejewski, M.; Konarski, M.J.; Chmura, J.; Pluta, B. Changes in the activity profiles of soccer players over a three-match training micro cycle. Int. J. Perform. Anal. Sport 2014, 14, 814–828. [Google Scholar] [CrossRef]
- Varley, M.C.; Di Salvo, V.; Modonutti, M.; Gregson, W.; Mendez-Villanueva, A. The influence of successive matches on match-running performance during an under-23 international soccer tournament: The necessity of individual analysis. J. Sports Sci. 2018, 36, 585–591. [Google Scholar] [CrossRef]
- Rampinini, E.; Impellizzeri, F.M.; Castagna, C.; Abt, G.; Chamari, K.; Sassi, A.; Marcora, S.M. Factors influencing physiological responses to small-sided soccer games. J. Sports Sci. 2007, 25, 659–666. [Google Scholar] [CrossRef]
- Di Salvo, V.; Pigozzi, F.; Gonzalez-Haro, C.; Laughlin, M.S.; De Witt, J.K. Match performance comparison in top English soccer leagues. Int. J. Sports Med. 2013, 34, 526–532. [Google Scholar] [CrossRef]
- Al Haddad, H.; Mendez-Villanueva, A.; Torreno, N.; Munguia-Izquierdo, D.; Suarez-Arrones, L. Variability of GPS-derived running performance during official matches in elite professional soccer players. J. Sports Med. Phys. Fit. 2018, 58, 1439–1445. [Google Scholar] [CrossRef]
- Doncaster, G.; Unnithan, V. Between-Game Variation of Physical Soccer Performance Measures in Highly Trained Youth Soccer Players. J. Strength Cond. Res. 2019, 33, 1912–1920. [Google Scholar] [CrossRef] [Green Version]
- Oliva-Lozano, J.M.; Muyor, J.M.; Fortes, V.; McLaren, S.J. Decomposing the variability of match physical performance in professional soccer: Implications for monitoring individuals. Eur. J. Sport Sci. 2021, 21, 1588–1596. [Google Scholar] [CrossRef] [PubMed]
- Arruda, A.F.; Carling, C.; Zanetti, V.; Aoki, M.S.; Coutts, A.J.; Moreira, A. Effects of a very congested match schedule on body-load impacts, accelerations, and running measures in youth soccer players. Int. J. Sports Physiol. Perform. 2015, 10, 248–252. [Google Scholar] [CrossRef] [PubMed]
- Mortatti, A.L.; Oliveira, R.S.C.; Pinto, J.; Galvao-Coelho, N.L.; de Almeida, R.N.; Aoki, M.S.; Moreira, A. A Congested Match Schedule Alters Internal Match Load and Affects Salivary Immunoglobulin A Concentration in Youth Soccer Players. J. Strength Cond. Res. 2022, 36, 1655–1659. [Google Scholar] [CrossRef]
- Pinto, J.; de Oliveira, R.S.C.; Galvao-Coelho, N.L.; de Almeida, R.N.; Moreira, A.; Mortatti, A.L. The Effects of Successive Soccer Matches on the Internal Match Load, Stress Tolerance, Salivary Cortisol and Jumping Performance in Youth Soccer Players. J. Hum. Kinet. 2021, 80, 173–184. [Google Scholar] [CrossRef] [PubMed]
- Mohr, M.; Krustrup, P.; Bangsbo, J. Match performance of high-standard soccer players with special reference to development of fatigue. J. Sports Sci. 2003, 21, 519–528. [Google Scholar] [CrossRef] [PubMed] [Green Version]
- Di Salvo, V.; Baron, R.; Tschan, H.; Calderon Montero, F.J.; Bachl, N.; Pigozzi, F. Performance characteristics according to playing position in elite soccer. Int. J. Sports Med. 2007, 28, 222–227. [Google Scholar] [CrossRef] [PubMed]
- Soroka, A.; Lago-Peñas, C. The effect of a succession of matches on the physical performance of elite football players during the World Cup Brazil 2014. Int. J. Perform. Anal. Sport 2016, 16, 434–441. [Google Scholar] [CrossRef]
- Williams, A.M.; Ford, P.R.; Drust, B. Talent identification and development in soccer since the millennium. J. Sports Sci. 2020, 38, 1199–1210. [Google Scholar] [CrossRef]
- Dodd, K.D.; Newans, T.J. Talent identification for soccer: Physiological aspects. J. Sci. Med. Sport 2018, 21, 1073–1078. [Google Scholar] [CrossRef]
- Winter, E.M.; Maughan, R.J. Requirements for ethics approvals. J. Sports Sci. 2009, 27, 985. [Google Scholar] [CrossRef]
- Sausaman, R.W.; Sams, M.L.; Mizuguchi, S.; DeWeese, B.H.; Stone, M.H. The Physical Demands of NCAA Division I Women’s College Soccer. J. Funct. Morphol. Kinesiol. 2019, 4, 73. [Google Scholar] [CrossRef] [PubMed]
- Asian-Clemente, J.; Rabano-Munoz, A.; Requena, B.; Suarez-Arrones, L. High-speed training in a specific context in soccer: Transition games. Int. J. Sports Med. 2022, 43, 881–888. [Google Scholar] [CrossRef] [PubMed]
- Asian-Clemente, J.; Rabano-Munoz, A.; Munoz, B.; Franco, J.; Suarez-Arrones, L. Can Small-side Games Provide Adequate High-speed Training in Professional Soccer? Int. J. Sports Med. 2021, 42, 523–528. [Google Scholar] [CrossRef]
- Hopkins, W.G.; Marshall, S.W.; Batterham, A.M.; Hanin, J. Progressive statistics for studies in sports medicine and exercise science. Med. Sci. Sports Exerc. 2009, 41, 3–13. [Google Scholar] [CrossRef] [Green Version]
- Ferraz, R.; Goncalves, B.; Coutinho, D.; Marinho, D.A.; Sampaio, J.; Marques, M.C. Pacing behaviour of players in team sports: Influence of match status manipulation and task duration knowledge. PLoS ONE 2018, 13, e0192399. [Google Scholar] [CrossRef] [PubMed] [Green Version]
- Johnston, R.J.; Watsford, M.L.; Austin, D.; Pine, M.J.; Spurrs, R.W. Player acceleration and deceleration profiles in professional Australian football. J. Sports Med. Phys. Fit. 2015, 55, 931–939. [Google Scholar]
- Silva, H.; Nakamura, F.Y.; Beato, M.; Marcelino, R. Acceleration and deceleration demands during training sessions in football: A systematic review. Sci. Med. Footb. 2022, 26, 1–16. [Google Scholar] [CrossRef] [PubMed]
- Martin-Garcia, A.; Casamichana, D.; Diaz, A.G.; Cos, F.; Gabbett, T.J. Positional Differences in the Most Demanding Passages of Play in Football Competition. J. Sports Sci. Med. 2018, 17, 563–570. [Google Scholar]
- Riboli, A.; Semeria, M.; Coratella, G.; Esposito, F. Effect of formation, ball in play and ball possession on peak demands in elite soccer. Biol. Sport 2021, 38, 195–205. [Google Scholar] [CrossRef]
- Jaspers, A.; Kuyvenhoven, J.P.; Staes, F.; Frencken, W.G.P.; Helsen, W.F.; Brink, M.S. Examination of the external and internal load indicators’ association with overuse injuries in professional soccer players. J. Sci. Med. Sport 2018, 21, 579–585. [Google Scholar] [CrossRef]
- Aquino, R.; Carling, C.; Palucci Vieira, L.H.; Martins, G.; Jabor, G.; Machado, J.; Santiago, P.; Garganta, J.; Puggina, E. Influence of Situational Variables, Team Formation, and Playing Position on Match Running Performance and Social Network Analysis in Brazilian Professional Soccer Players. J. Strength Cond. Res. 2020, 34, 808–817. [Google Scholar] [CrossRef] [PubMed]
- Augusto, D.; Brito, J.; Aquino, R.; Figueiredo, P.; Eiras, F.; Tannure, M.; Veiga, B.; Vasconcellos, F. Contextual Variables Affect Running Performance in Professional Soccer Players: A Brief Report. Front. Sports Act. Living 2021, 3, 778813. [Google Scholar] [CrossRef] [PubMed]
- Gonçalves, L.G.C.; Clemente, F.; Palucci Vieira, L.H.; Bedo, B.; Puggina, E.F.; Moura, F.; Mesquita, F.; Pereira Santiago, P.R.; Almeida, R.; Aquino, R. Effects of match location, quality of opposition, match outcome, and playing position on load parameters and players’ prominence during official matches in professional soccer players. Hum. Mov. 2021, 22, 35–44. [Google Scholar] [CrossRef]
- Palucci Vieira, L.H.; Carling, C.; Barbieri, F.A.; Aquino, R.; Santiago, P.R.P. Match Running Performance in Young Soccer Players: A Systematic Review. Sports Med. 2019, 49, 289–318. [Google Scholar] [CrossRef]
- Arjol-Serrano, J.L.; Lampre, M.; Diez, A.; Castillo, D.; Sanz-Lopez, F.; Lozano, D. The Influence of Playing Formation on Physical Demands and Technical-Tactical Actions According to Playing Positions in an Elite Soccer Team. Int. J. Environ. Res. Public Health 2021, 18, 41–48. [Google Scholar] [CrossRef]
- Forcher, L.; Hartel, S.; Jekauc, D.; Wasche, H.; Woll, A.; Gross, T.; Altmann, S. Does Technical Match Performance in Professional Soccer Depend on the Positional Role or the Individuality of the Player? Front. Psychol. 2022, 13, 813206. [Google Scholar] [CrossRef]
- Forcher, L.; Jekauc, D.; Woll, A.; Gross, T.; Altmann, S. Center backs work hardest when playing in a back three: The influence of tactical formation on physical and technical match performance in professional soccer. PLoS ONE 2022, 17, e0265501. [Google Scholar] [CrossRef]
- Bulgay, C.; Cetin, E.; Orhan, O.; Ergun, M.A. The effects of the ACTN3 and ACE genes on the sportive performance of athletes. Inonu Univ. J. Phys. Educ. Sport Sci. 2020, 7, 1–12. [Google Scholar]
- Altmann, S.; Neumann, R.; Woll, A.; Hartel, S. Endurance Capacities in Professional Soccer Players: Are Performance Profiles Position Specific? Front. Sports Act. Living 2020, 2, 549897. [Google Scholar] [CrossRef]

| Values | p Value | % | Q | ||
|---|---|---|---|---|---|
| M1 vs. M2 | |||||
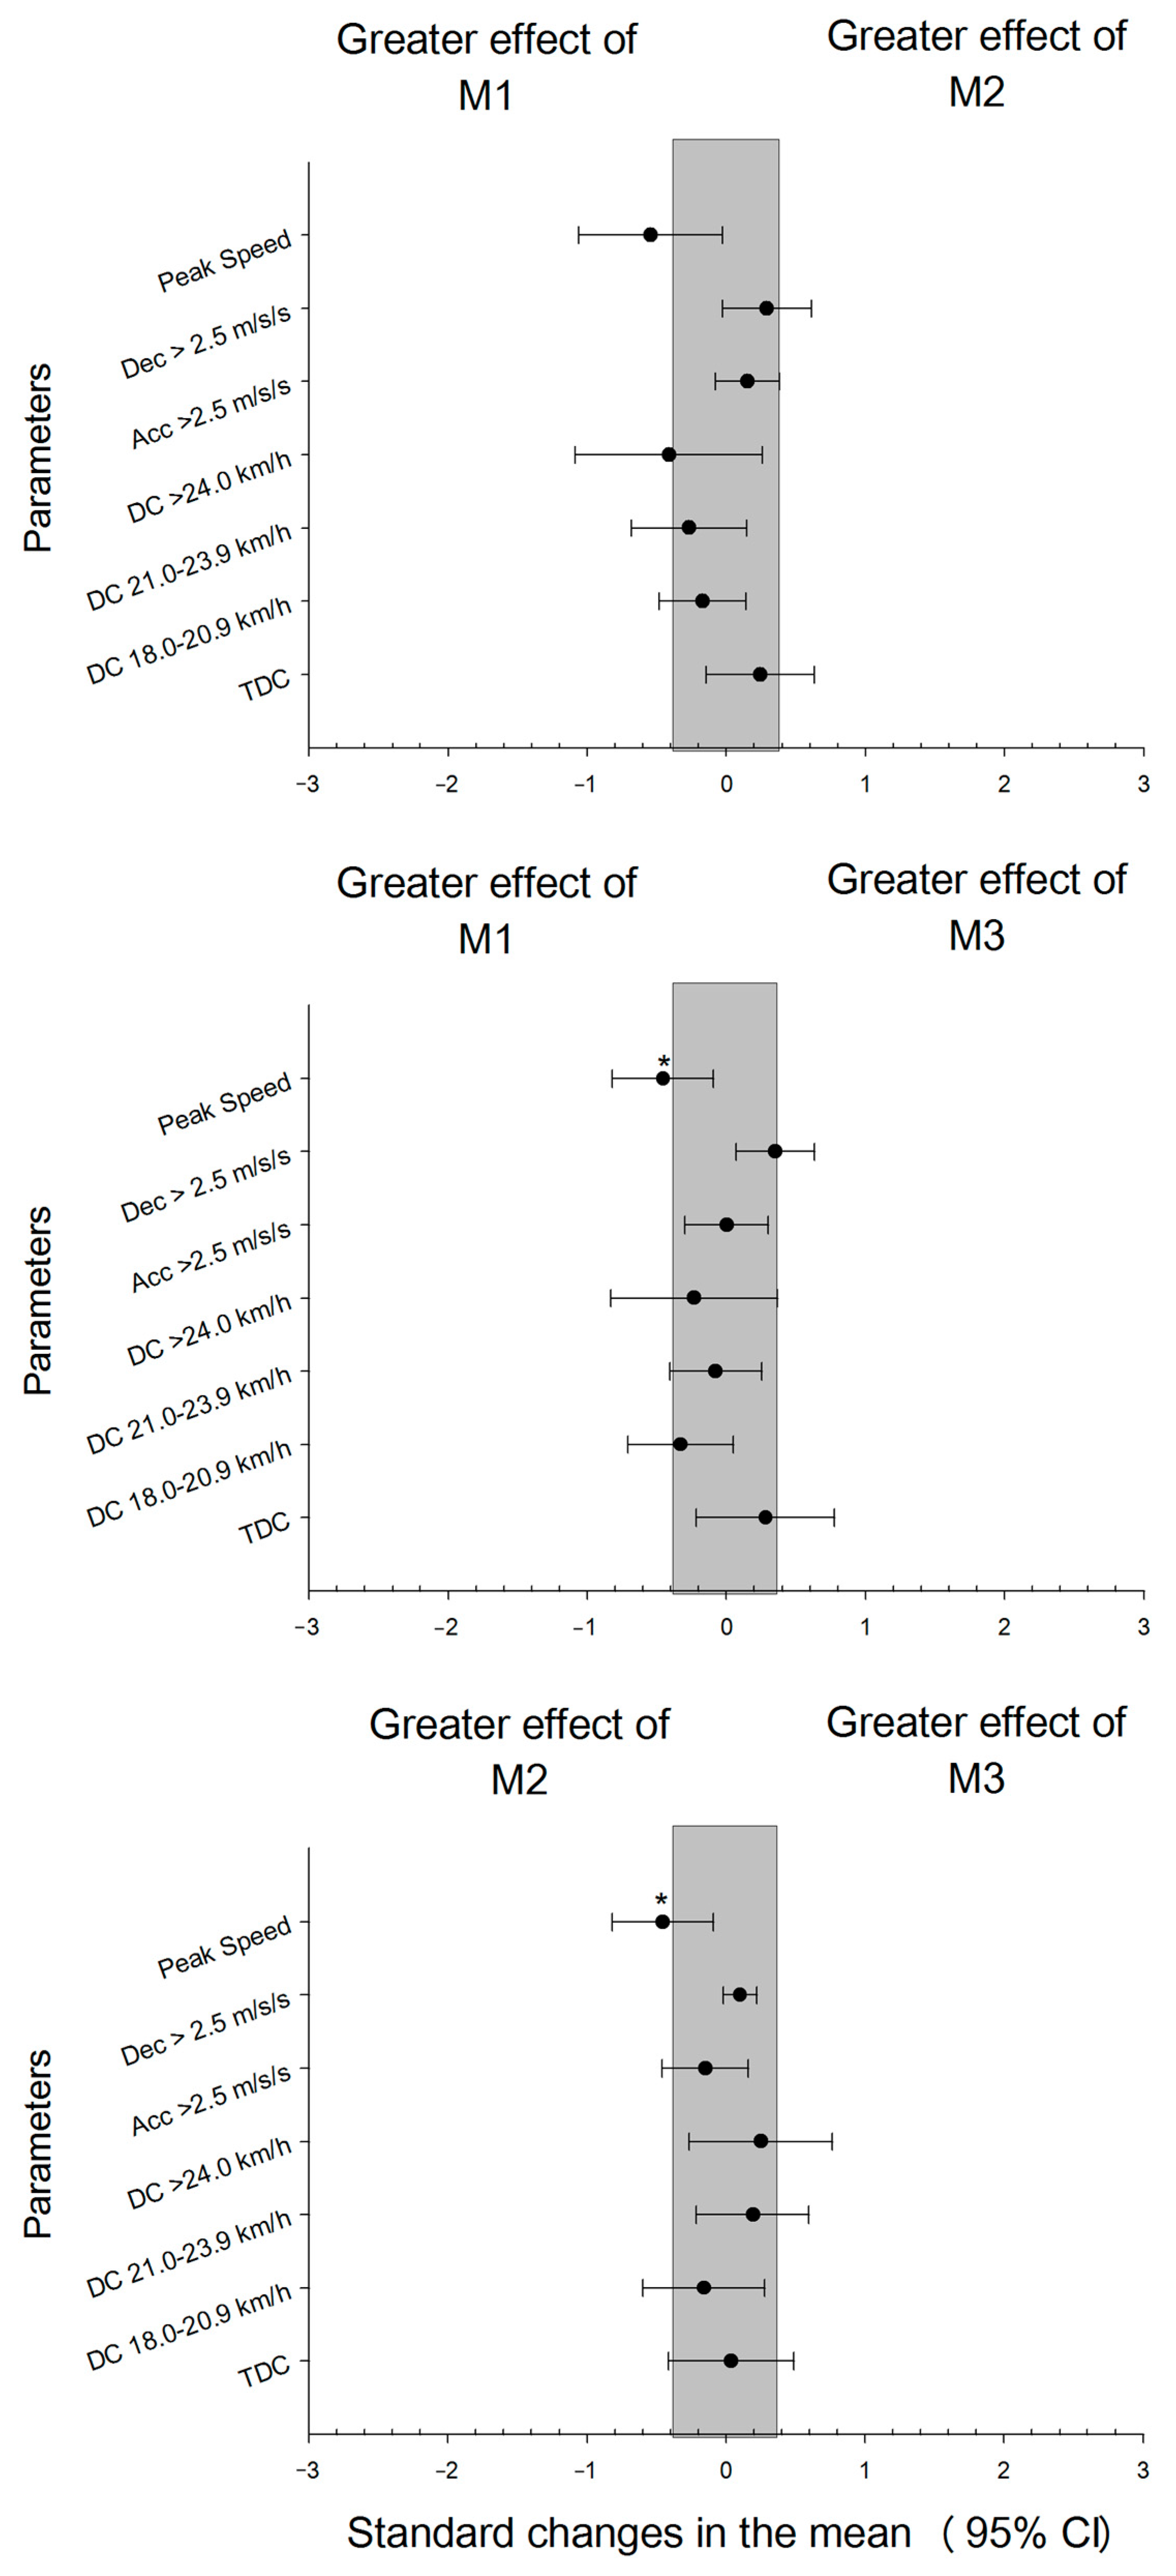
| TDC (m·min−1) | 104.4 ± 8.1 | 106.1 ± 7.9 | 0.28 | 58/39/3 | Possibly, may (not) |
| DC 18.0–20.9 km·h−1 (m·min−1) | 4.6 ± 1.5 | 4.5 ± 1.6 | 0.36 | 44/53/3 | Possibly, may (not) |
| DC 21.0–23.9 km·h−1 (m·min−1) | 2.6 ± 1.0 | 2.5 ± 1.2 | 0.27 | 61/35/3 | Possibly, may (not) |
| DC > 24.0 km·h−1 (m·min−1) | 1.4 ± 0.6 | 1.3 ± 0.9 | 0.30 | 70/23/7 | Possibly, may (not) |
| Acc > 2.5 m·s−2 (n·min−1) | 0.10 ± 0.05 | 0.12 ± 0.07 | 0.26 | 36/63/1 | Possibly, may (not) |
| Dec > 2.5 m·s−2 (n·min−1) | 0.05 ± 0.03 | 0.06 ± 0.05 | 0.14 | 68/31/1 | Possibly, may (not) |
| Peak speed (km·h−1) | 29.4 ± 1.5 | 28.6 ± 2.2 | 0.08 | 87/12/1 | Likely, probable |
| M1 vs. M3 | |||||
| TDC (m·min−1) | 104.4 ± 8.1 | 106.7 ± 12.3 | 0.34 | 61/34/6 | Possibly, may (not) |
| DC 18.0–20.9 km·h−1 (m·min−1) | 4.6 ± 1.5 | 4.3 ± 1.7 | 0.14 | 72/27/1 | Possibly, may (not) |
| DC 21.0–23.9 km·h−1 (m·min−1) | 2.6 ± 1.0 | 2.6 ± 0.9 | 0.69 | 26/66/8 | Possibly, may (not) |
| DC > 24.0 km·h−1 (m·min−1) | 1.4 ± 0.6 | 1.5 ± 1.0 | 0.50 | 54/35/11 | Possibly, may (not) |
| Acc > 2.5 m·s−2 (n·min−1) | 0.10 ± 0.05 | 0.10 ± 0.06 | 0.99 | 13/74/13 | Unlikely, probable |
| Dec > 2.5 m·s−2 (n·min−1) | 0.05 ± 0.03 | 0.07 ± 0.04 | 0.04 | 82/18/0 | Likely, probable |
| Peak speed (km·h−1) | 29.4 ± 1.5 | 28.7 ± 2.0 | 0.62 | 88/12/0 | Likely, probable |
| M2 vs. M3 | |||||
| TDC (m·min−1) | 106.1 ± 7.9 | 106.7 ± 12.3 | 0.88 | 27/55/19 | Possibly, may (not) |
| DC 18.0–20.9 km·h−1 (m·min−1) | 4.5 ± 1.6 | 4.3 ± 1.7 | 0.53 | 44/48/8 | Possibly, may (not) |
| DC 21.0–23.9 km·h−1 (m·min−1) | 2.5 ± 1.2 | 2.6 ± 0.9 | 0.42 | 49/46/5 | Possibly, may (not) |
| DC > 24.0 km·h−1 (m·min−1) | 1.3 ± 0.9 | 1.5 ± 1.0 | 0.41 | 58/11/31 | Possibly, may (not) |
| Acc > 2.5 m·s−2 (n·min−1) | 0.12 ± 0.07 | 0.10 ± 0.06 | 0.39 | 3/57/40 | Possibly, may (not) |
| Dec > 2.5 m·s−2 (n·min−1) | 0.06 ± 0.05 | 0.07 ± 0.04 | 0.17 | 8/92/0 | Unlikely, probable |
| Peak speed (km·h−1) | 28.6 ± 2.2 | 28.7 ± 2.0 | 0.81 | 14/79/6 | Possibly, may (not) |
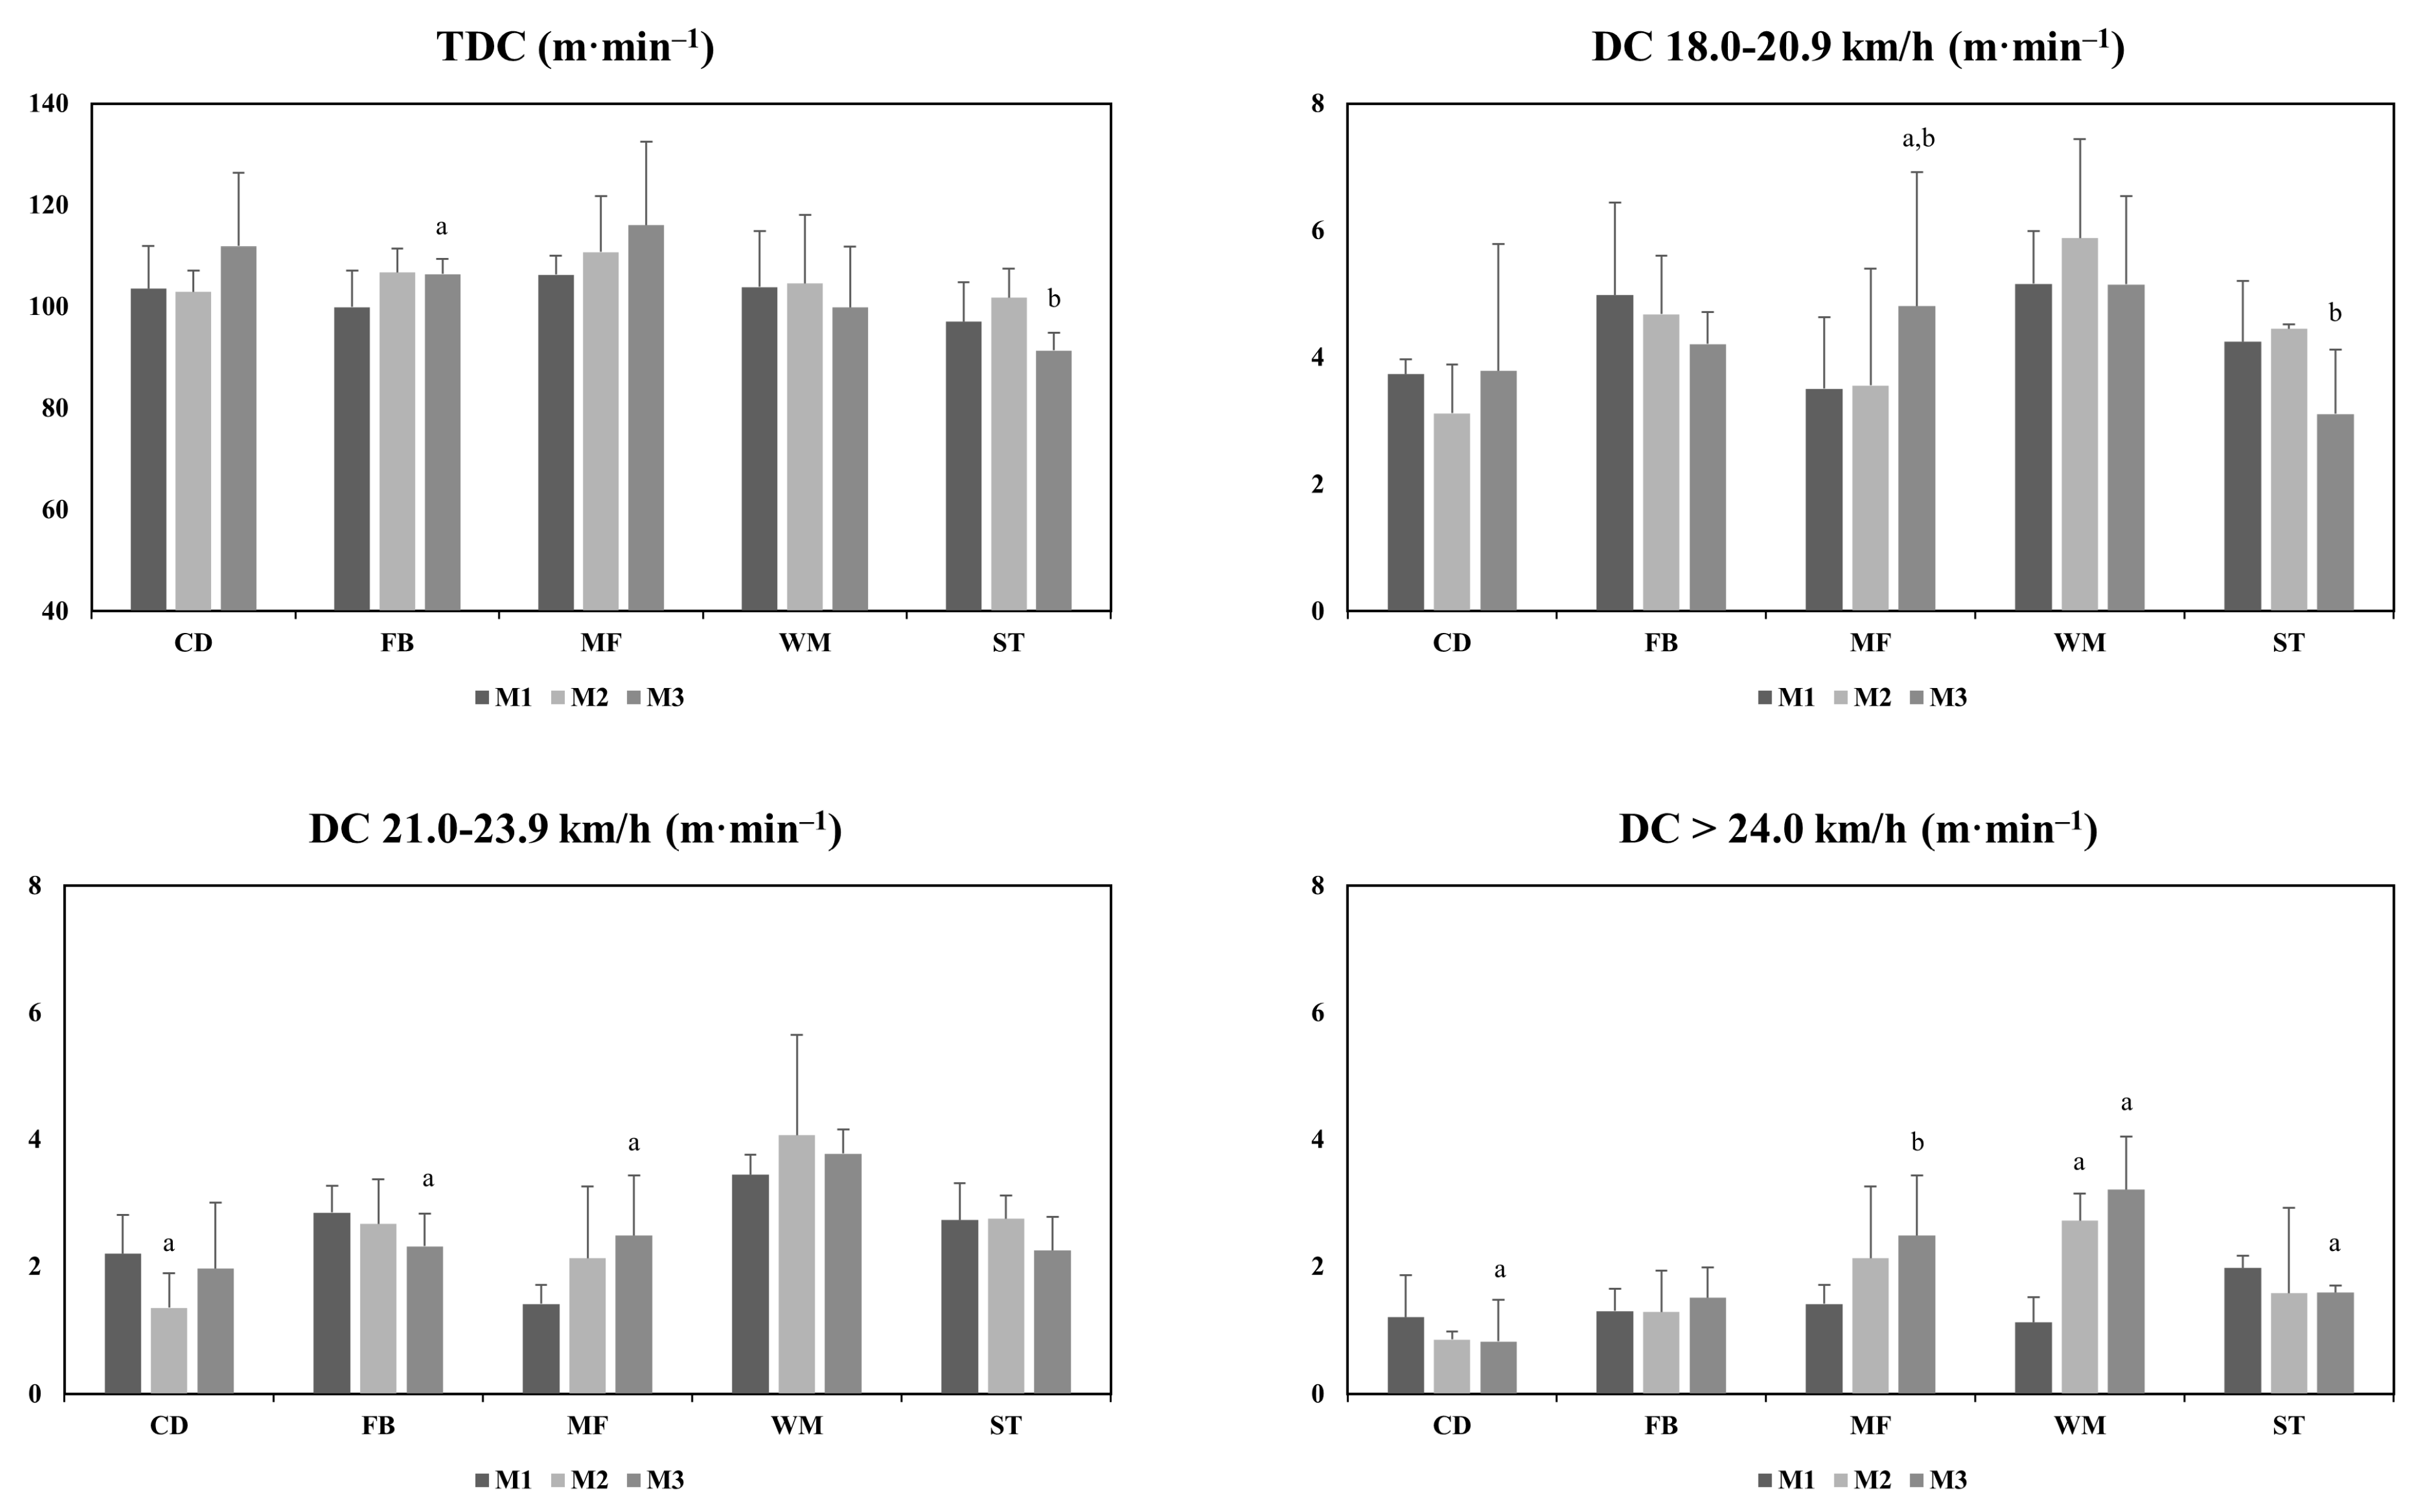
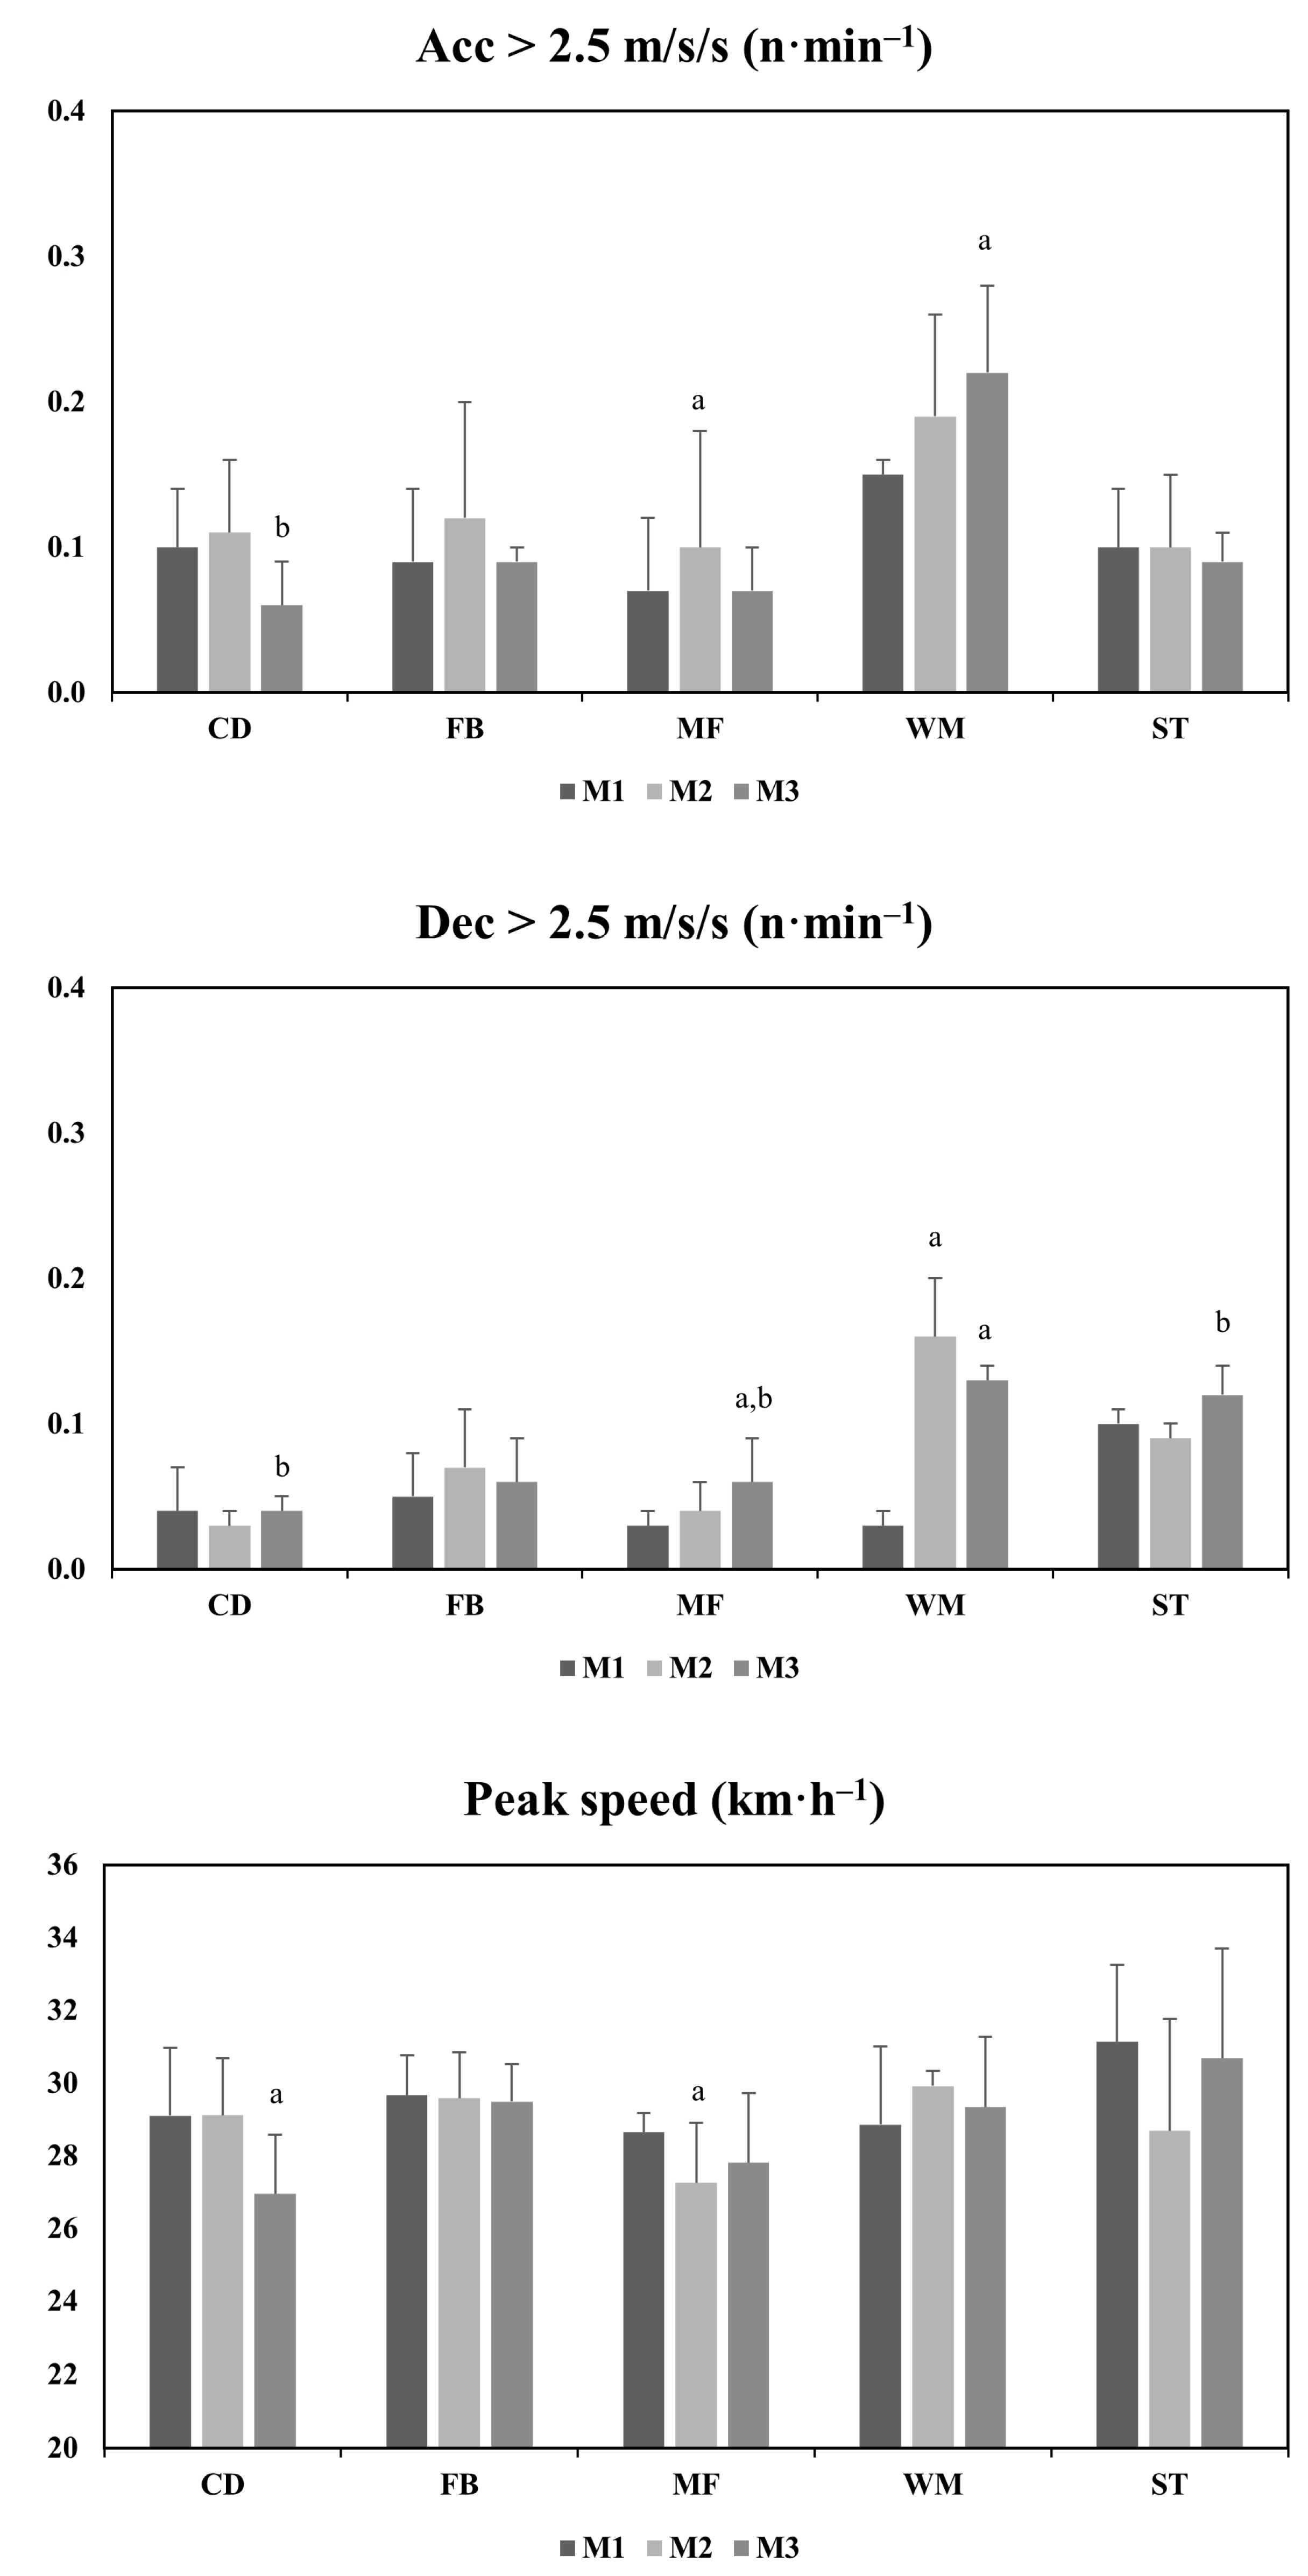
| TDC (m·min−1) | DC 18.0–20.9 km·h−1 (m·min−1) | DC 21.0–23.9 km·h−1 (m·min−1) | DC > 24.0 km·h−1 (m·min−1) | Acc > 2.5 m·s−2 (n·min−1) | Dec > 2.5 m·s−2 (n·min−1) | Peak Speed (km·h−1) | ||
|---|---|---|---|---|---|---|---|---|
| CD | M1 | 103.5 ± 8.4 | 3.7 ± 0.2 | 2.2 ± 0.6 | 1.2 ± 0.7 | 0.10 ± 0.04 | 0.04 ± 0.03 | 29.1 ± 1.9 |
| M2 | 103.0 ± 4.1 | 3.1 ± 0.8 | 1.4 ± 0.5 | 0.9 ± 0.1 | 0.11 ± 0.05 | 0.03 ± 0.01 | 29.1 ± 1.6 | |
| M3 | 111.9 ± 14.4 | 3.8 ± 2.0 | 2.0 ± 1.0 | 0.8 ± 0.7 | 0.06 ± 0.03 | 0.04 ± 0.01 | 27.0 ± 1.6 | |
| FB | M1 | 99.9 ± 7.2 | 5.0 ± 1.5 | 2.9 ± 0.4 | 1.3 ± 0.4 | 0.09 ± 0.05 | 0.05 ± 0.03 | 29.7 ± 1.1 |
| M2 | 106.8 ± 4.7 | 4.7 ± 0.9 | 2.7 ± 0.7 | 1.3 ± 0.7 | 0.12 ± 0.08 | 0.07 ± 0.04 | 29.6 ± 1.3 | |
| M3 | 106.4 ± 3.0 | 4.2 ± 0.5 | 2.3 ± 0.5 | 1.5 ± 0.5 | 0.09 ± 0.01 | 0.06 ± 0.03 | 29.5 ± 1.0 | |
| MF | M1 | 106.3 ± 3.8 | 3.5 ± 1.1 | 1.4 ± 0.3 | 0.9 ± 0.3 | 0.07 ± 0.05 | 0.03 ± 0.01 | 28.6 ± 0.6 |
| M2 | 110.8 ± 11.0 | 3.6 ± 1.8 | 2.1 ± 1.1 | 0.8 ± 0.5 | 0.10 ± 0.08 | 0.04 ± 0.02 | 27.3 ± 1.7 | |
| M3 | 116.0 ± 16.5 | 4.8 ± 2.1 | 2.5 ± 0.9 | 1.2 ± 0.9 | 0.07 ± 0.03 | 0.06 ± 0.03 | 27.8 ± 1.9 | |
| WM | M1 | 103.9 ± 11.0 | 5.2 ± 0.8 | 3.5 ± 0.3 | 1.1 ± 0.4 | 0.15 ± 0.01 | 0.03 ± 0.01 | 28.9 ± 2.1 |
| M2 | 104.6 ± 13.5 | 5.9 ± 1.6 | 4.1 ± 1.6 | 2.7 ± 0.4 | 0.19 ± 0.07 | 0.16 ± 0.04 | 29.9 ± 0.4 | |
| M3 | 99.9 ± 12.0 | 5.2 ± 1.4 | 3.8 ± 0.4 | 3.2 ± 0.8 | 0.22 ± 0.06 | 0.13 ± 0.01 | 29.3 ± 1.9 | |
| ST | M1 | 97.1 ± 7.8 | 4.3 ± 1.0 | 2.7 ± 0.6 | 2.0 ± 0.2 | 0.10 ± 0.04 | 0.10 ± 0.01 | 31.1 ± 2.1 |
| M2 | 101.8 ± 5.7 | 4.5 ± 0.1 | 2.8 ± 0.4 | 1.6 ± 1.3 | 0.10 ± 0.05 | 0.09 ± 0.01 | 28.7 ± 3.1 | |
| M3 | 91.4 ± 3.5 | 3.1 ± 1.0 | 2.3 ± 0.5 | 1.6 ± 0.1 | 0.09 ± 0.02 | 0.12 ± 0.02 | 30.7 ± 3.0 |
Publisher’s Note: MDPI stays neutral with regard to jurisdictional claims in published maps and institutional affiliations. |
© 2022 by the authors. Licensee MDPI, Basel, Switzerland. This article is an open access article distributed under the terms and conditions of the Creative Commons Attribution (CC BY) license (https://creativecommons.org/licenses/by/4.0/).
Share and Cite
Muñoz-Castellanos, B.; Rabano-Muñoz, A.; Requena, B.; Suarez-Arrones, L.; Asian-Clemente, J.A. Congested Period in Professional Youth Soccer Players Showed a Different High Decelerations Profile in the Group Performance and a Specific Positional Behaviour. J. Funct. Morphol. Kinesiol. 2022, 7, 108. https://doi.org/10.3390/jfmk7040108
Muñoz-Castellanos B, Rabano-Muñoz A, Requena B, Suarez-Arrones L, Asian-Clemente JA. Congested Period in Professional Youth Soccer Players Showed a Different High Decelerations Profile in the Group Performance and a Specific Positional Behaviour. Journal of Functional Morphology and Kinesiology. 2022; 7(4):108. https://doi.org/10.3390/jfmk7040108
Chicago/Turabian StyleMuñoz-Castellanos, Borja, Alberto Rabano-Muñoz, Bernardo Requena, Luis Suarez-Arrones, and Jose A. Asian-Clemente. 2022. "Congested Period in Professional Youth Soccer Players Showed a Different High Decelerations Profile in the Group Performance and a Specific Positional Behaviour" Journal of Functional Morphology and Kinesiology 7, no. 4: 108. https://doi.org/10.3390/jfmk7040108