Muscle-Specific Endurance of the Lower Back Erectors Using Electrical Twitch Mechanomyography


Abstract
:1. Introduction
2. Materials and Methods
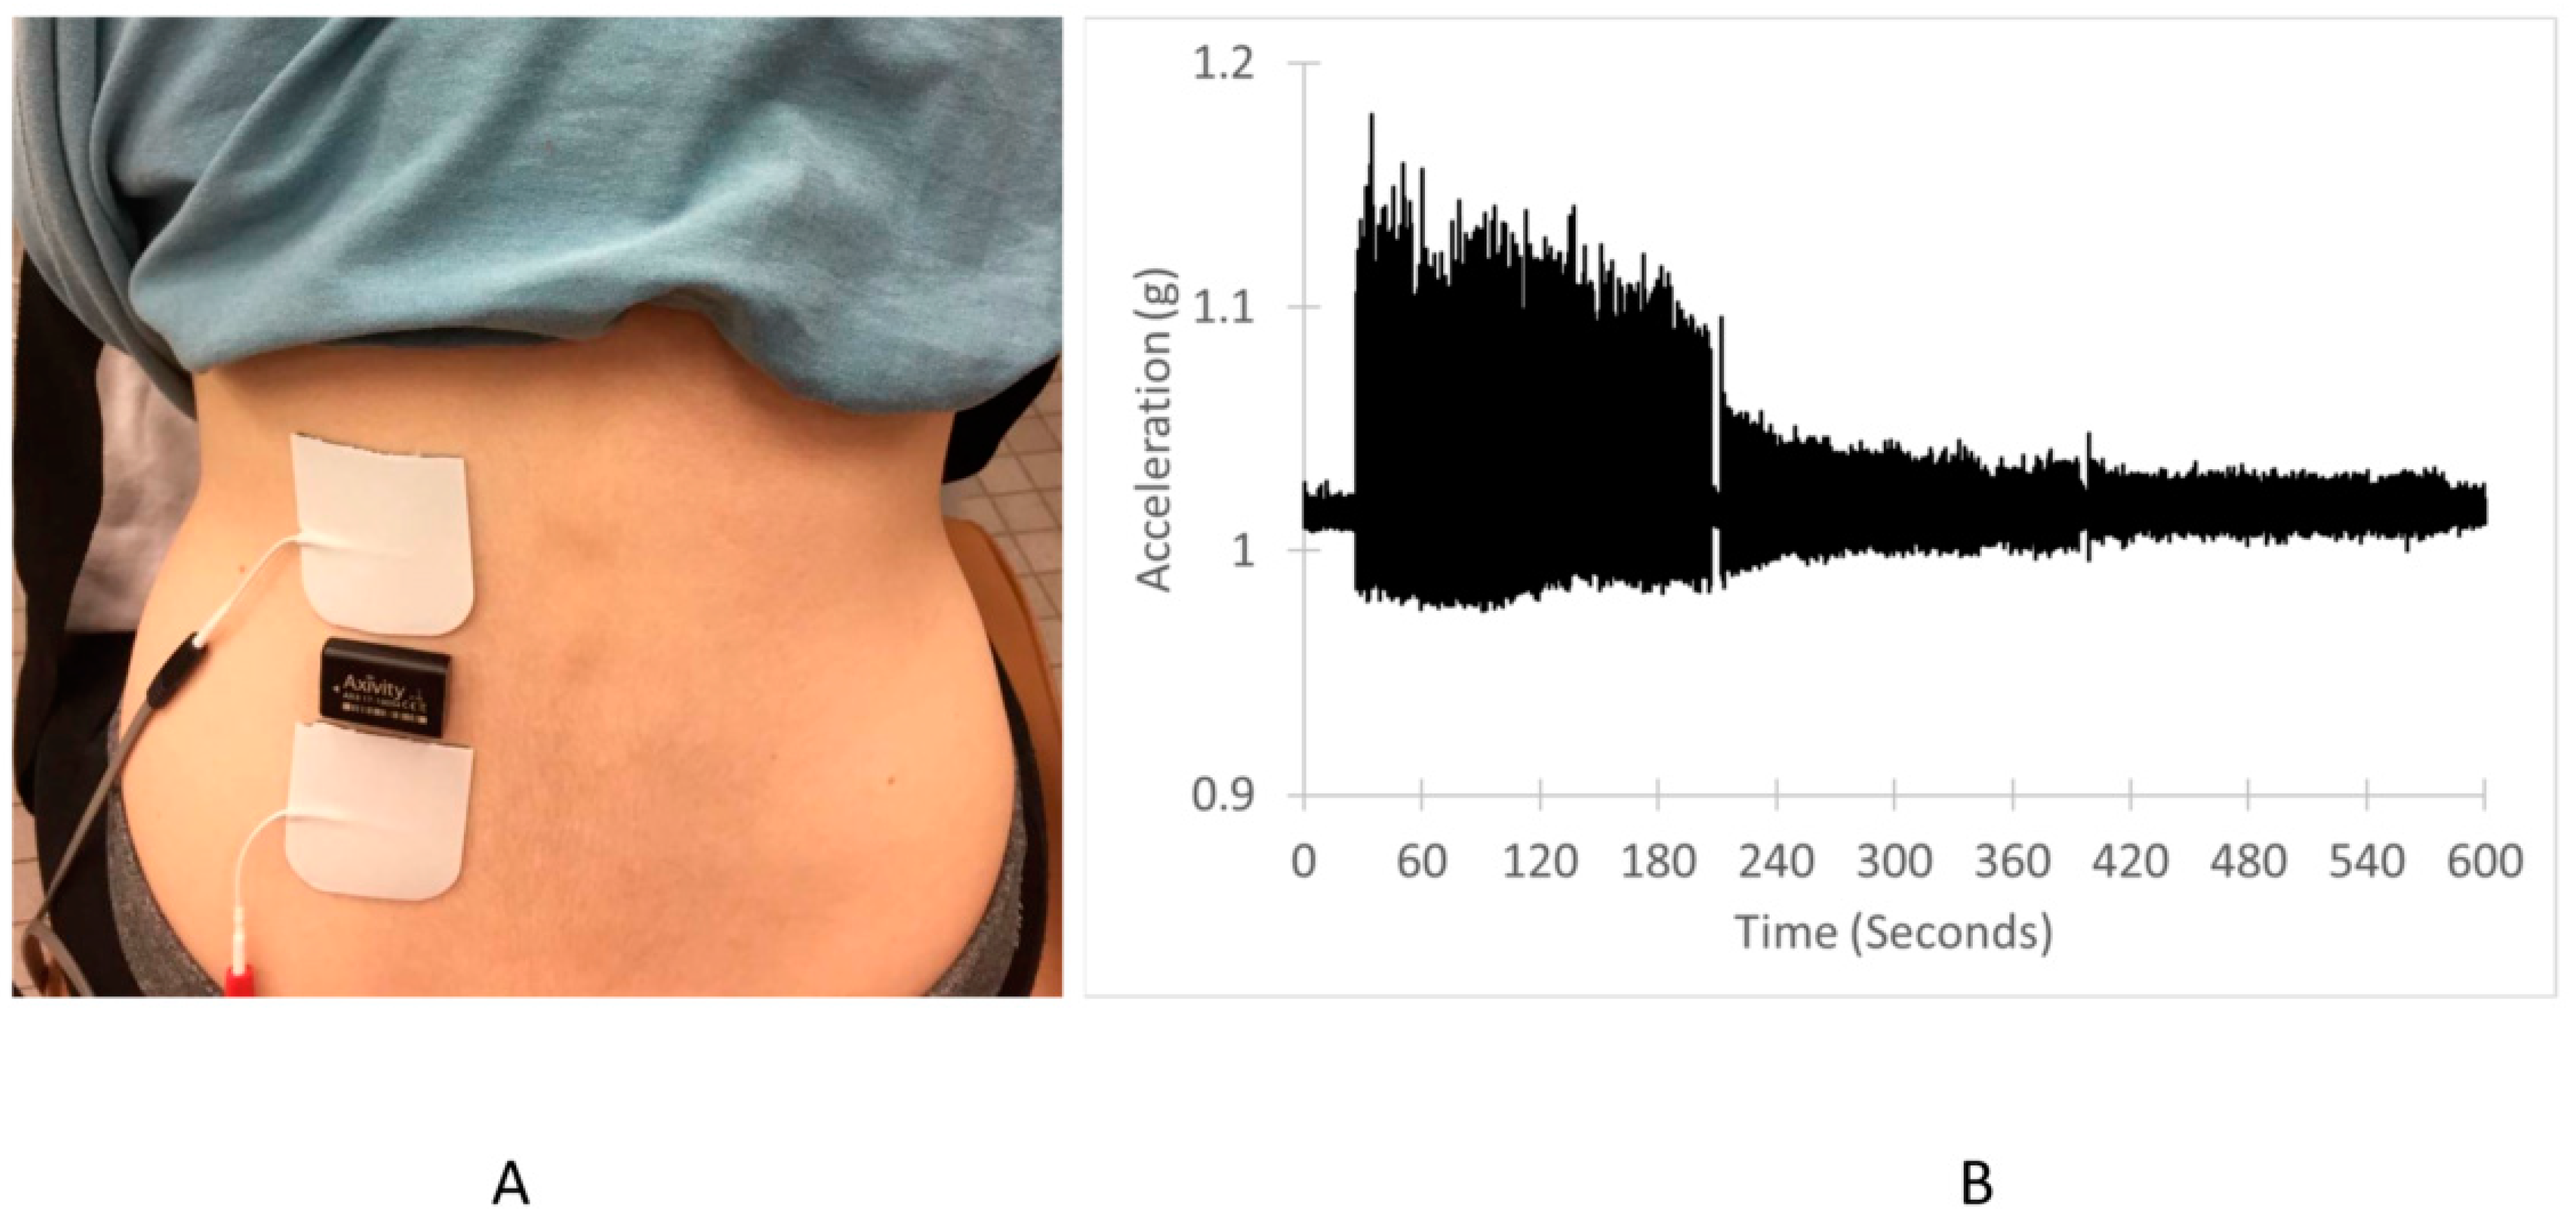
2.1. Participants
2.2. Experimental Design
2.3. Endurance Index Measurements
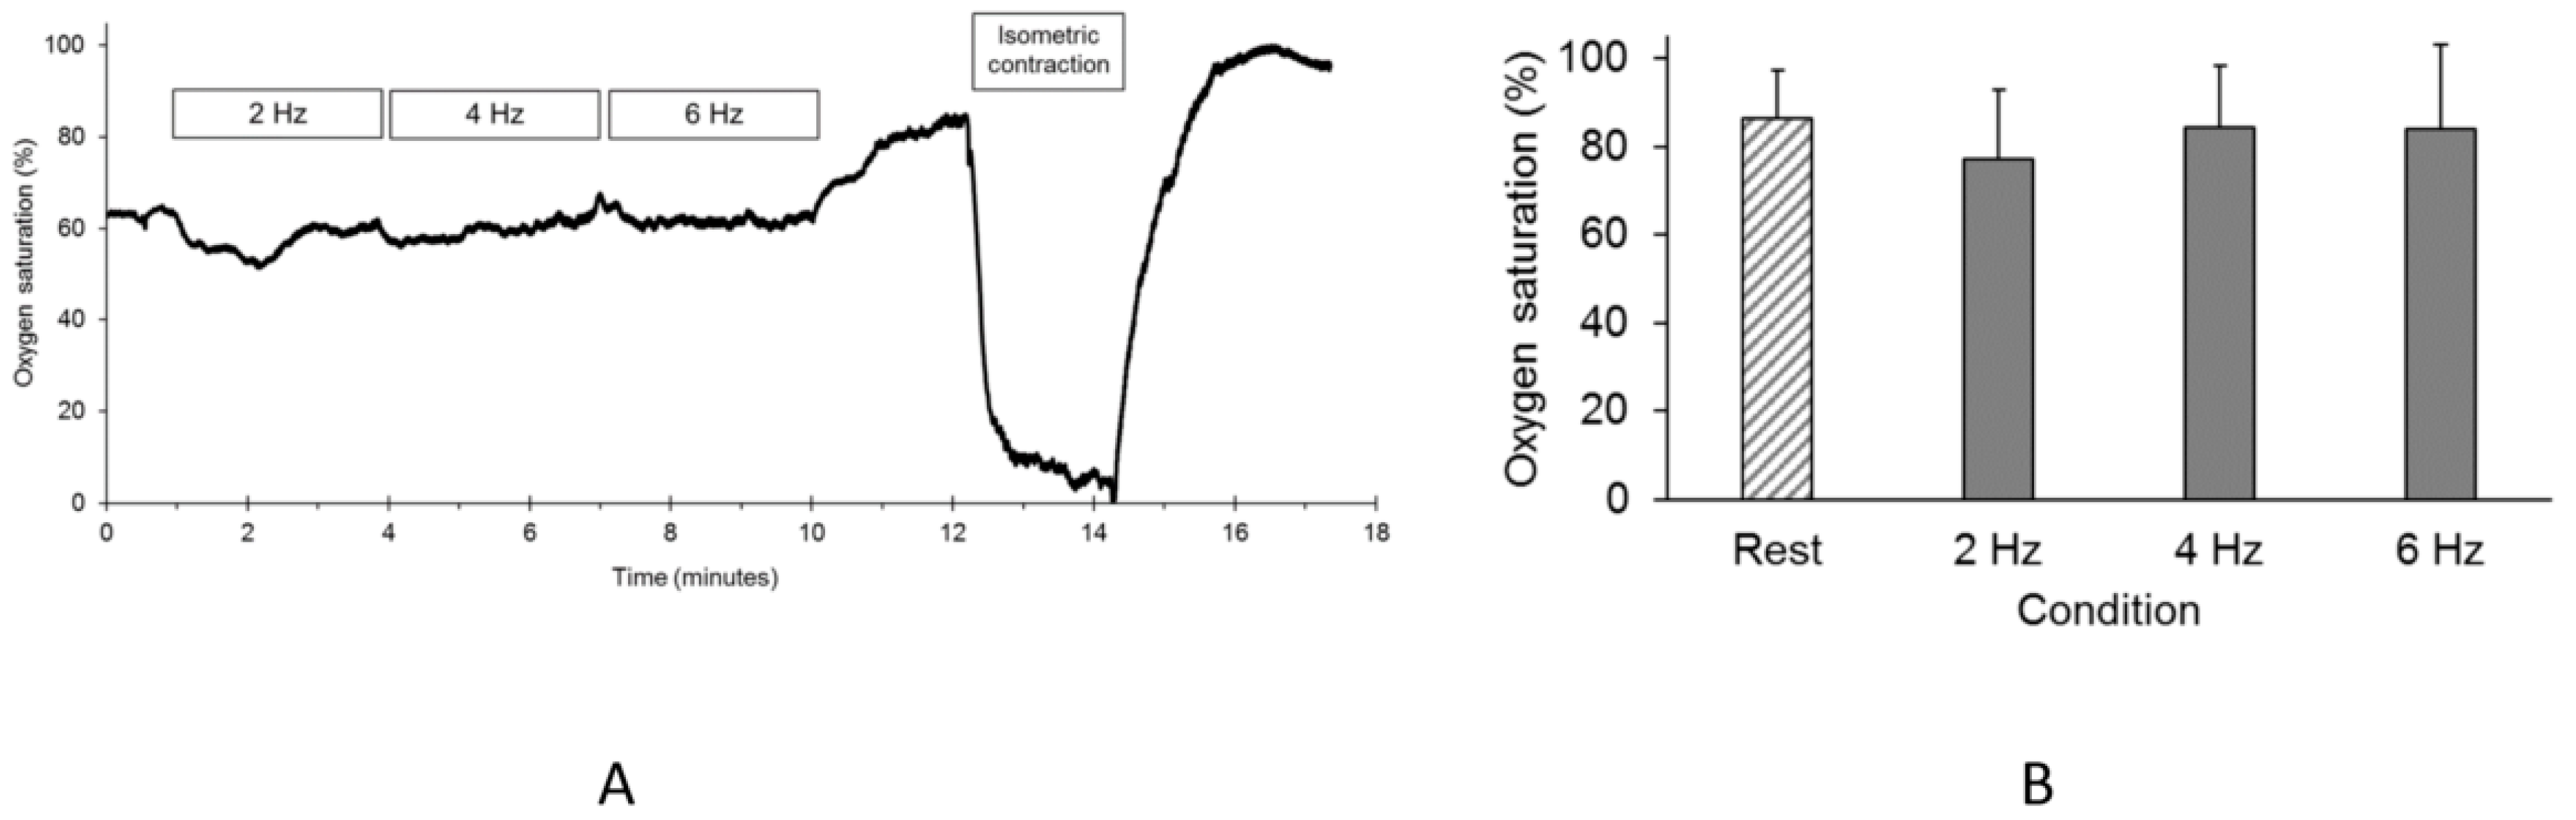
2.4. Oxygen Saturation During the Endurance Index Test
2.5. Analysis
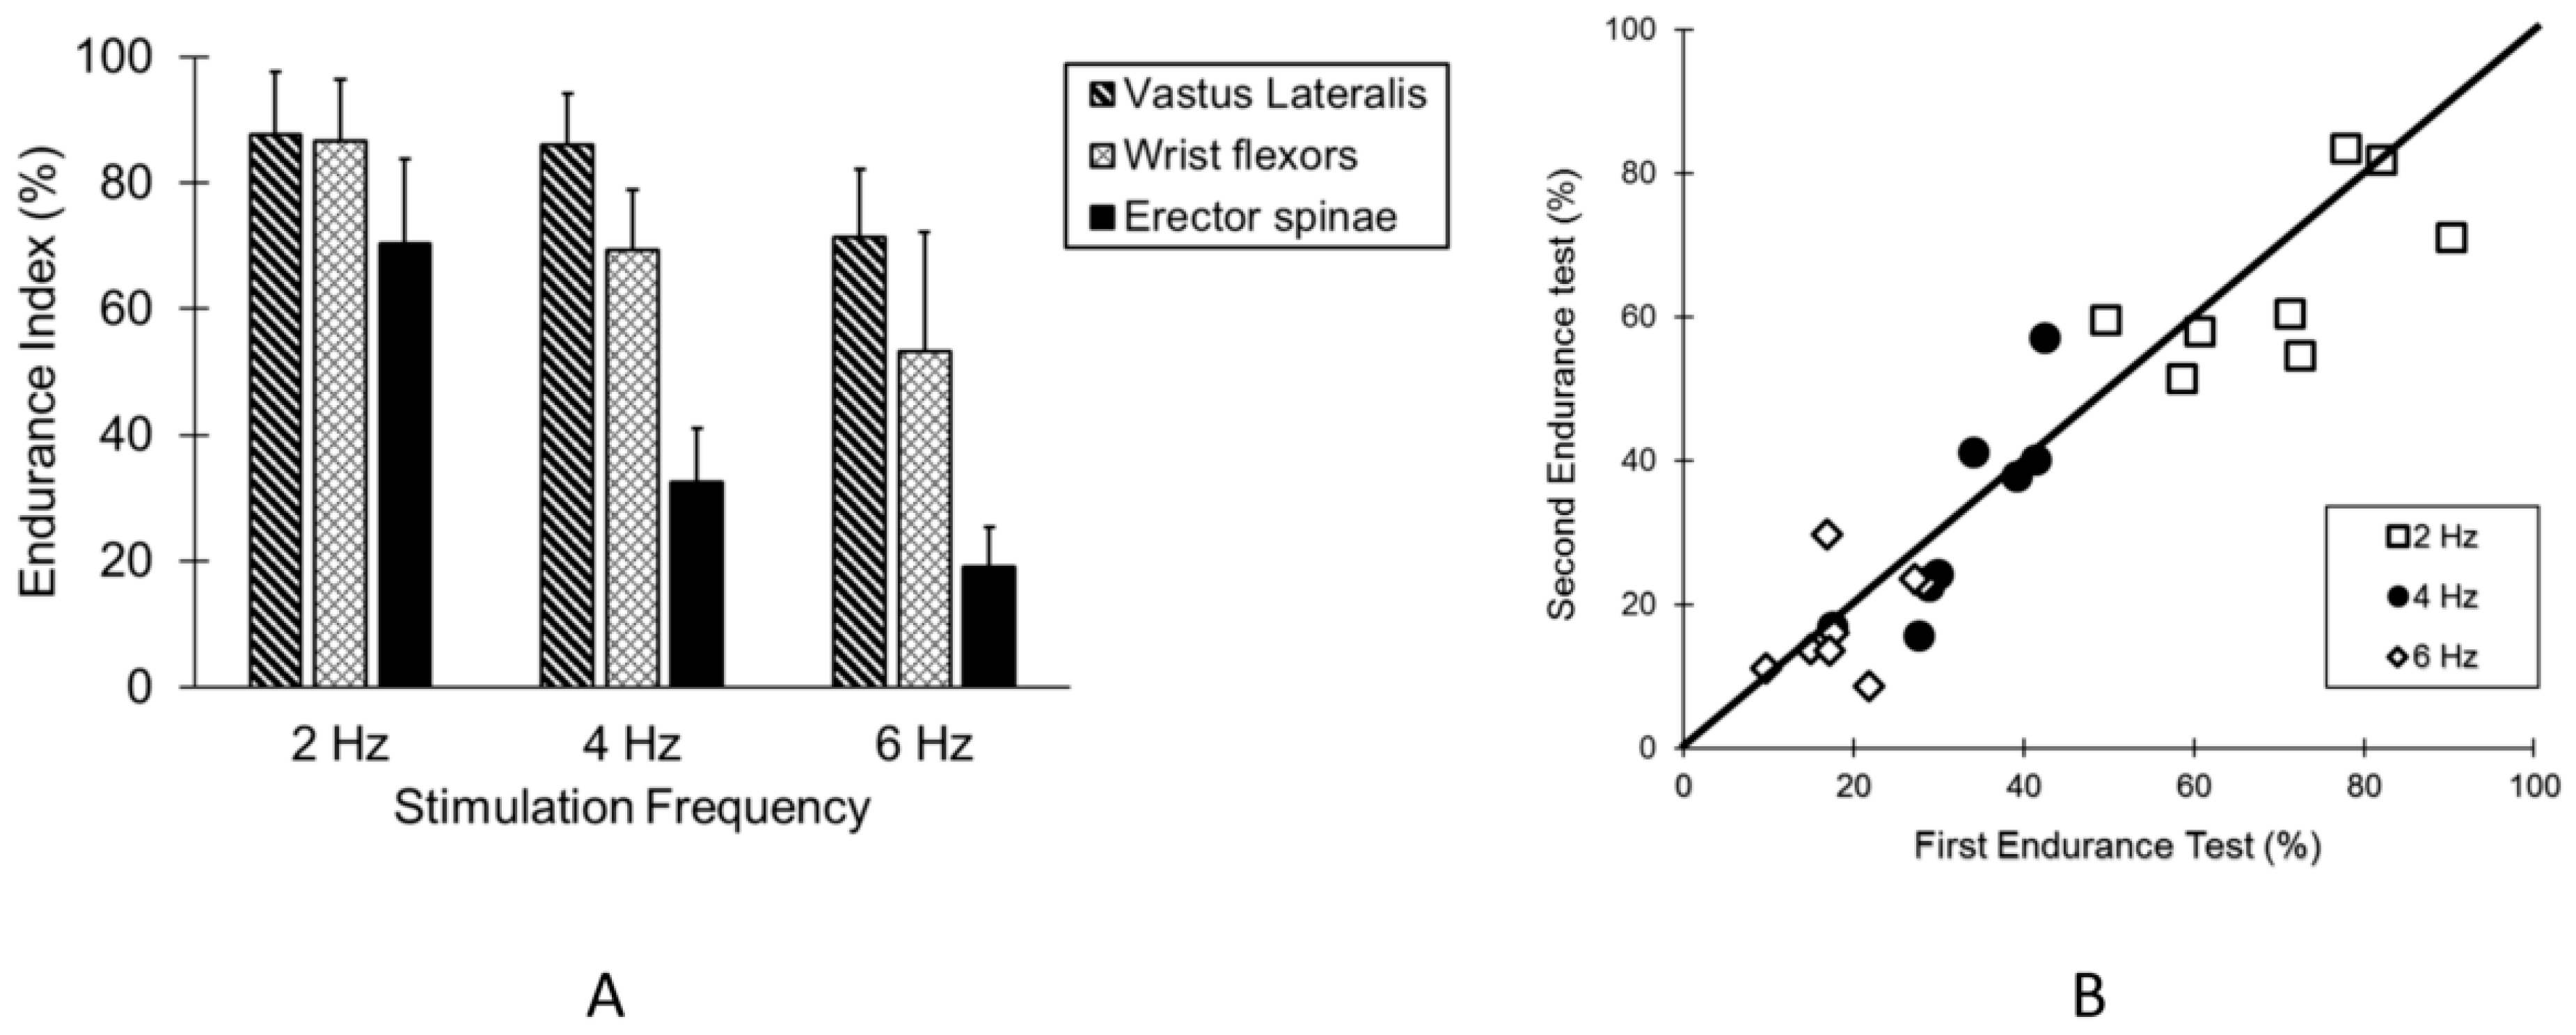
3. Results
4. Discussion
5. Conclusions
Author Contributions
Funding
Acknowledgments
Conflicts of Interest
References
- Deyo, R.A.; Dworkin, S.F.; Amtmann, D.; Andersson, G.; Borenstein, D.; Carragee, E.; Carrino, J.; Chou, R.; Cook, K.; DeLitto, A.; et al. Report of the Task Force on Research Standards for Chronic Low-Back Pain; Committee, N.P.C.E., Ed.; NIH: Bethesda, MD, USA, 2013; pp. 1–79. [Google Scholar]
- Villafane, J.H.; Gobbo, M.; Peranzoni, M.; Naik, G.; Imperio, G.; Cleland, J.A.; Negrini, S. Validity and everyday clinical applicability of lumbar muscle fatigue assessment methods in patients with chronic non-specific low back pain: A systematic review. Disabil. Rehabil. 2016, 38, 1859–1871. [Google Scholar] [CrossRef] [PubMed]
- Lariviere, C.; Gagnon, D.; Gravel, D.; Bertrand Arsenault, A. The assessment of back muscle capacity using intermittent static contractions. Part I—Validity and reliability of electromyographic indices of fatigue. J. Electromyogr. Kinesiol. 2008, 18, 1006–1019. [Google Scholar] [CrossRef] [PubMed]
- Cardozo, A.C.; Goncalves, M.; Dolan, P. Back extensor muscle fatigue at submaximal workloads assessed using frequency banding of the electromyographic signal. Clin. Biomech. (Bristol Avon) 2011, 26, 971–976. [Google Scholar] [CrossRef] [PubMed]
- Coorevits, P.; Danneels, L.; Cambier, D.; Ramon, H.; Vanderstraeten, G. Assessment of the validity of the Biering-Sorensen test for measuring back muscle fatigue based on EMG median frequency characteristics of back and hip muscles. J. Electromyogr. Kinesiol. 2008, 18, 997–1005. [Google Scholar] [CrossRef] [PubMed]
- Rzanny, R.; Grassme, R.; Reichenbach, J.R.; Scholle, H.C.; Kaiser, W.A. Investigations of back muscle fatigue by simultaneous 31P MRS and surface EMG measurements. Biomed. Tech. (Berl.) 2006, 51, 305–313. [Google Scholar] [CrossRef] [PubMed]
- Yoshitake, Y.; Ue, H.; Miyazaki, M.; Moritani, T. Assessment of lower-back muscle fatigue using electromyography, mechanomyography, and near-infrared spectroscopy. Eur. J. Appl. Physiol. 2001, 84, 174–179. [Google Scholar] [CrossRef] [PubMed]
- Lariviere, C.; Gravel, D.; Gagnon, D.; Arsenault, A.B. The assessment of back muscle capacity using intermittent static contractions. Part II: Validity and reliability of biomechanical correlates of muscle fatigue. J. Electromyogr. Kinesiol. 2008, 18, 1020–1031. [Google Scholar] [CrossRef] [PubMed]
- Akataki, K.; Mita, K.; Watakabe, M.; Itoh, K. Mechanomyogram and force relationship during voluntary isometric ramp contractions of the biceps brachii muscle. Eur. J. Appl. Physiol. 2001, 84, 19–25. [Google Scholar] [CrossRef]
- Barry, D.T.; Hill, T.; Im, D. Muscle fatigue measured with evoked muscle vibrations. Muscle Nerve 1992, 15, 303–309. [Google Scholar] [CrossRef]
- Gobbo, M.; Ce, E.; Diemont, B.; Esposito, F.; Orizio, C. Torque and surface mechanomyogram parallel reduction during fatiguing stimulation in human muscles. Eur. J. Appl. Physiol. 2006, 97, 9–15. [Google Scholar] [CrossRef]
- Orizio, C.; Diemont, B.; Esposito, F.; Alfonsi, E.; Parrinello, G.; Moglia, A.; Veicsteinas, A. Surface mechanomyogram reflects the changes in the mechanical properties of muscle at fatigue. Eur. J. Appl. Physiol. Occup. Physiol. 1999, 80, 276–284. [Google Scholar] [CrossRef] [PubMed]
- Willingham, T.B.; McCully, K.K. Assessment of Muscle Fatigue during Twitch Electrical Stimulation using Accelerometer-based Mechanomyography. Adv. Skelet. Muscle Funct. Assess. 2017, 1, 14–20. [Google Scholar]
- Ryan, T.E.; Brizendine, J.T.; McCully, K.K. A comparison of exercise type and intensity on the noninvasive assessment of skeletal muscle mitochondrial function using near-infrared spectroscopy. J. Appl. Physiol. 2013, 114, 230–237. [Google Scholar] [CrossRef] [PubMed] [Green Version]
- Southern, W.M.; Ryan, T.E.; Reynolds, M.A.; McCully, K. Reproducibility of near-infrared spectroscopy measurements of oxidative function and postexercise recovery kinetics in the medial gastrocnemius muscle. Appl. Physiol. Nutr. Metab. 2014, 39, 521–529. [Google Scholar] [CrossRef] [PubMed]
- McCully, K.K.; Prins, P.; Mistry, K.; Willingham, T.B. Muscle-specific endurance of the trapezius muscles using electrical twitch mechanomyography. Shoulder Elbow 2018, 10, 136–143. [Google Scholar] [CrossRef] [PubMed]
- Latimer, J.; Maher, C.G.; Refshauge, K.; Colaco, I. The reliability and validity of the Biering-Sorensen test in asymptomatic subjects and subjects reporting current or previous nonspecific low back pain. Spine (Phila Pa 1976) 1999, 24, 2085–2089; discussion 2090. [Google Scholar] [CrossRef]
- Bossie, H.M.; Willingham, T.B.; Schoick, R.A.V.; O’Connor, P.J.; McCully, K.K. Mitochondrial capacity, muscle endurance, and low energy in friedreich ataxia. Muscle Nerve 2017, 56, 773–779. [Google Scholar] [CrossRef] [PubMed]
- Willingham, T.B.; Melbourn, J.; Moldavskiy, M.; McCully, K.K.; Backus, D. Case Report: Effect of Antigravity Treadmill Training on Muscle Oxidative Capacity, Muscle Endurance, and Walking Function in a Person with Multiple Sclerosis. Int. J. MS Care 2018, 20, 186–190. [Google Scholar] [CrossRef] [PubMed]
- O’Connor, P.J.; Poudevigne, M.S.; Cress, M.E.; Motl, R.W.; Clapp, J.F., 3rd. Safety and efficacy of supervised strength training adopted in pregnancy. J. Phys. Act. Health 2011, 8, 309–320. [Google Scholar]
- Pollock, M.L.; Leggett, S.H.; Graves, J.E.; Jones, A.; Fulton, M.; Cirulli, J. Effect of resistance training on lumbar extension strength. Am. J. Sports Med. 1989, 17, 624–629. [Google Scholar] [CrossRef]
- Gray, S.; Staub, N. Resistance to blood flow in leg muscles of dog during tetanic isometric contraction. Am. J. Physiol. 1967, 213, 677–682. [Google Scholar] [CrossRef] [PubMed]
- Kell, R.T.; Bhambhani, Y. Relationship between erector spinae static endurance and muscle oxygenation-blood volume changes in healthy and low back pain subjects. Eur. J. Appl. Physiol. 2006, 96, 241–248. [Google Scholar] [CrossRef] [PubMed]
- Kell, R.T.; Bhambhani, Y. Relationship between erector spinae muscle oxygenation via in vivo near infrared spectroscopy and static endurance time in healthy males. Eur. J. Appl. Physiol. 2008, 102, 243–250. [Google Scholar] [CrossRef] [PubMed]
- Vrana, A.; Scholkmann, F.; Wirth, B.; Flueck, M.; Humphreys, B.K. Changes in Spinal Muscle Oxygenation and Perfusion During the Biering-Sorensen Test: Preliminary Results of a Study Employing NIRS-Based Muscle Oximetry. Adv. Exp. Med. Biol. 2018, 1072, 103–109. [Google Scholar] [CrossRef] [PubMed]
© 2019 by the authors. Licensee MDPI, Basel, Switzerland. This article is an open access article distributed under the terms and conditions of the Creative Commons Attribution (CC BY) license (http://creativecommons.org/licenses/by/4.0/).
Share and Cite
McCully, K.K.; Moraes, C.; Patel, S.V.; Green, M.; Willingham, T.B. Muscle-Specific Endurance of the Lower Back Erectors Using Electrical Twitch Mechanomyography. J. Funct. Morphol. Kinesiol. 2019, 4, 12. https://doi.org/10.3390/jfmk4010012
McCully KK, Moraes C, Patel SV, Green M, Willingham TB. Muscle-Specific Endurance of the Lower Back Erectors Using Electrical Twitch Mechanomyography. Journal of Functional Morphology and Kinesiology. 2019; 4(1):12. https://doi.org/10.3390/jfmk4010012
Chicago/Turabian StyleMcCully, Kevin K., Caio Moraes, Sahil V. Patel, Max Green, and T. Bradley Willingham. 2019. "Muscle-Specific Endurance of the Lower Back Erectors Using Electrical Twitch Mechanomyography" Journal of Functional Morphology and Kinesiology 4, no. 1: 12. https://doi.org/10.3390/jfmk4010012