Article

TGF-β1-Dependent Downregulation of HDAC9 Inhibits Maturation of Human Osteoblasts

Siegfried Weller Institute for Trauma Research at the BG Trauma Center, Eberhard Karls Universität, D-72076 Tübingen, Germany
*
Author to whom correspondence should be addressed.
J. Funct. Morphol. Kinesiol. 2017, 2(4), 41; https://doi.org/10.3390/jfmk2040041
Submission received: 18 October 2017 / Revised: 6 November 2017 / Accepted: 8 November 2017 / Published: 13 November 2017

Abstract

:
Transforming growth factor β (TGF-β) is a key regulator of bone density. Recently, we have shown that TGF-β1 effectively blocks bone morphogenetic protein-induced maturation of human osteoblasts (hOBs) in a histone deacetylase (HDAC)-dependent manner. To better understand the underlying mechanisms and to identify possible therapeutic targets, the current study aimed at characterizing the expression changes of different HDACs in hOBs following recombinant human TGF-β1 treatment and investigating the effect of the altered HDACs on both the proliferation and maturation of hOBs and osteogenic cell lines. As expected from our previous work, exposure to rhTGF-β1 induced the expression of HDACs (HDAC1, -2, -3, -6). However, to our surprise, rhTGF-β1 treatment strongly suppressed the expression of HDAC9 during osteogenic differentiation. HDAC9 is reported to suppress osteoclastogenesis; however, little is known about the role of HDAC9 in osteogenesis. Chemical inhibition of HDAC9 with TMP269 increased cell numbers of hOBs, but significantly decreased their osteogenic function (alkaline phosphatase activity and matrix mineralization). In osteogenic cell lines (MG-63, CAL-72 and SAOS-2), the expression of HDAC9 negatively correlates with their proliferation capacity and positively correlates with their osteogenic differentiation potential. Being able to boost osteoclasts while inhibiting osteoblasts makes HDAC9 an interesting therapeutic target to support fracture healing and bone metabolisms.

Graphical Abstract

1. Introduction

Transforming growth factor β (TGF-β) is the most abundant cytokine in bone matrix, affecting both bone cell growth and differentiation [1]. Bone cells secrete three different isoforms of TGF-β (TGF-β1, -β2, and -β3), which are incorporated in the bone matrix in their inactive form. Upon proteolytic activation, TGF-β1–3 bind to a common set of serine/threonine kinase receptors and mediate their signaling via Smad transcription factors [1,2].
The activated TGF-β acts as a chemoattractant for osteoblast progenitor cells, which promotes the migration and proliferation of these cells [1]. Animal models revealing both positive [3,4,5] and negative [6,7,8] effects of TGF-β1 on bone strength have been reported. Likewise, poor bone quality and delayed fracture healing in patients is associated with both the lack of TGF-β1 and chronically elevated TGF-β1 levels [9,10,11,12,13,14,15]. We have recently shown that continuous exposure to human recombinant TGF-β1 (rhTGF-β1) inhibits bone morphogenetic protein (rhBMP2 and rhBMP7)-dependent maturation of primary human osteoblasts (hOBs) in a histone deacetylase (HDAC)-dependent manner [16]. However, using a broad band inhibitor, our study could not identify which of the 11 currently known HDAC isoforms [17] are involved in this mechanism.
In the past years, the mechanisms of how HDACs regulate osteogenesis have attracted increasing interest. Chemical inhibition of HDAC activity could improve osteogenic differentiation, suggesting both a direct acetylation-dependent [16,18], as well as a MAPKinase-dependent mechanism [19]. There is evidence that several HDACs affect the expression and activity of the key osteogenic transcription factor Runx2. Runx2 expression is shown to be inhibited by HDAC1 and HDAC3 [20,21,22]. Runx2 transcriptional activity is reduced by the binding of class II HDACs (HDAC4, -5, -6, and -7) to Runx2 [23,24,25,26]. In addition, enhanced expression of HDAC6 causes deacetylation of α-tubulin, causing a shortening and distortion of the cells primary cilia (mechanosensors) and thus impairing mechanically driven osteogenesis [27]. The expression of HDAC9, which plays a crucial role in immunity, is reported to negatively correlate with osteoclastogenesis [28].
In order to investigate how rhTGF-β1 affects osteoblast maturation, the current study aimed at determining the expression profile of different HDAC isoforms in hOBs during osteogenic differentiation in the presence or absence of rhTGF-β1, and investigating the effect of the altered HDACs on both the proliferation and osteogenic differentiation of hOBs and osteogenic cell lines.

2. Materials and Methods

2.1. Materials

Culture media and chemicals were obtained from Sigma-Aldrich (Munich, Germany) if not stated differently. Fetal calf serum (FCS) was purchased from Thermo Fisher Scientific (Darmstadt, Germany). PCR primers were obtained from Eurofins Genomics (Ebersberg, Germany).

2.2. Ethics Statement

All human studies were performed in accordance with the 1964 Declaration of Helsinki. Isolation of hOBs and all following experiments were in accordance with the ethical vote (ID 364/2012BO) approved (7 August 2012) by the ethics committee of the medical faculty of the Eberhard-Karls-Universität and University clinic Tübingen. In accordance with the ethical vote, informed consent (signature) was obtained from each patient donating bone samples. The donors’ average age was 65.4 ± 13.2 years (seven male and 17 female). Potential tumor patients or patients with viral or bacterial infections were excluded from this study.

2.3. Isolation and Expansion of Primary Human Osteoblasts (hOBs)

Briefly, cancellous bone was disintegrated mechanically and washed with PBS (phosphate buffered saline). After 1 h of collagenase digestion (0.07% Collagenase II) at 37 °C, released hOBs were transferred to cell culture flasks in growth medium (MEM (minimum essential medium)/Ham’s F12, 10% FCS, 50 µM l-ascorbate-2-phosphate, 50 µM β-glycerol-phosphate). Experiments were performed in passage 3 and 4 when osteoblast cultures were negative for CD14 and CD45 and positive for CD90 and CD105. Cells were plated at a density of 15,000 cells/cm2 in growth medium. After cell adherence (24 to 48 h), medium was changed to osteogenic medium (MEM/Ham’s F12, 1% FCS, 200 µM l-ascorbate-2-phosphate, 5 mM β-glycerol-phosphate, 25 mM HEPES, 1.5 mM CaCl2, 100 nM dexamethasone). Medium was changed every 3–4 days [12,16].

2.4. Culture and Differentiation of Osteogenic Cell Lines

MG-63 (Sigma-Aldrich), CAL-72 (DSMZ, ACC-439), and SAOS-2 (DSMZ, ACC-243) cells were cultured in RMPI1640 (10% FCS). For osteogenic differentiation, cells were plated at a density of 20,000 cells/cm2 in growth medium. After cell adherence (24 h), medium was changed to osteogenic medium (RPMI1640, 1% FCS, 200 µM l-ascorbate-2-phosphate, 5 mM β-glycerol-phosphate, 25 mM HEPES, 1.5 mM CaCl2, 100 nM dexamethasone). Medium was changed every 3–4 days.

2.5. (q)RT-PCR

Total RNA was isolated using Trifast reagent (Peqlab, Erlangen, Germany). Screening for HDAC expression was performed with the RT2 Profiler PCR Array for human epigenetic chromatin modification enzymes (Qiagen, Hilden, Germany) as indicated by the manufacturer. The array was performed in duplicates (n = 2) with pooled (N = 16 donors) samples. phOBs without rhTGF-β1 treatment were used as a control. Data were analyzed with the corresponding online software.
Gene expression changes were confirmed by semi-quantitative PCR using the KAPA2G Fast Ready Mix (Peqlab) with the respective primers (HDAC9: forward TGGCCATCACGCTGAAGAAT and reverse GTGGCTCCAGCTCATTTCCT; GAPDH: forward GTCAGTGGTGGACCTGACCT and reverse AGGGGTCTACATGGCAACTG). PCR products were separated by gel electrophoresis and visualized by ethidium bromide (GelDoc, Intas, Göttingen, Germany). Signal intensities were quantified using ImageJ software (NIH, Bethesda, MD, USA) [16].

2.6. Sulforhodamine B (SRB) Staining

Total protein content was determined by SRB (Sulforhodamine B) staining. Briefly, cells were fixed for 1 h with ice cold ethanol. Cells were stained with 0.4% SRB (in 1% acetic acid) for 20 min at ambient temperature. After washing four to five times with 1% acetic acid, bound SRB was resolved with 10 mM unbuffered TRIS solution (pH~10.5) and absorption (λ = 565 nm; Omega plate reader, BMG Labtech, Ortenberg, Germany) was determined. Cells numbers were determined using specific standard curves for each cell type.

2.7. Resazurin Conversion Assay

Cell viability (mitochondrial activity) was measured by resazurin conversion assay. Briefly, cells were covered with 0.0025% resazurin in medium. After 30 min incubation at 37 °C, the resulting resorufin fluorescence was measured (exitation/emission wavelength = 540/590 nm; Omega plate reader) as described [12,16].

2.8. AP (Alkaline Phosphatase) Activity Assay

As an early osteogenic marker, AP activity was measured. Briefly, cells were covered with AP reaction buffer (0.2% 4-nitrophenyl-phosphate, 50 mM glycine, 1 mM MgCl2, 100 mM TRIS, pH 10.5) for 30 min at 37 °C. Formed 4-nitrophenol was determined photometrically (λ = 405 nm; Omega plate reader) as described. Directly after, the measurement cells were fixed for SRB staining for normalization to relative cell numbers [12,16].

2.9. Assessing Matrix Mineralization by Alizarin Red Staining

As a late osteogenic marker, matrix mineralization was measured. Cells were fixed with ice cold ethanol for 1 h. After washing with tap water, cells were incubated with 0.5% Alizarin Red solution (pH 4.0) for 30 min at RT. After washing with tap water, the resulting staining (red) was assessed microscopically. Alizarin Red staining was quantified photometrically (λ = 562 nm; Omega plate reader) after resolving with 10% cetylpyridiumchloride solution [12,16].

2.10. Statistics

Results are expressed as a bar chart (mean ± 95% confidence interval) of at least four independent experiments (N ≥ 4) measured as triplicates or more (n ≥ 3). The exact number of biological (N) and technical (n) replicates is given in the figure legends. Datasets were compared by one-way ANOVA (Kruskall Wallis test; GraphPad Software Inc., La Jolla, CA, USA) followed by Dunn’s multiple comparison test. p < 0.05 was taken as the minimum level of significance.

3. Results

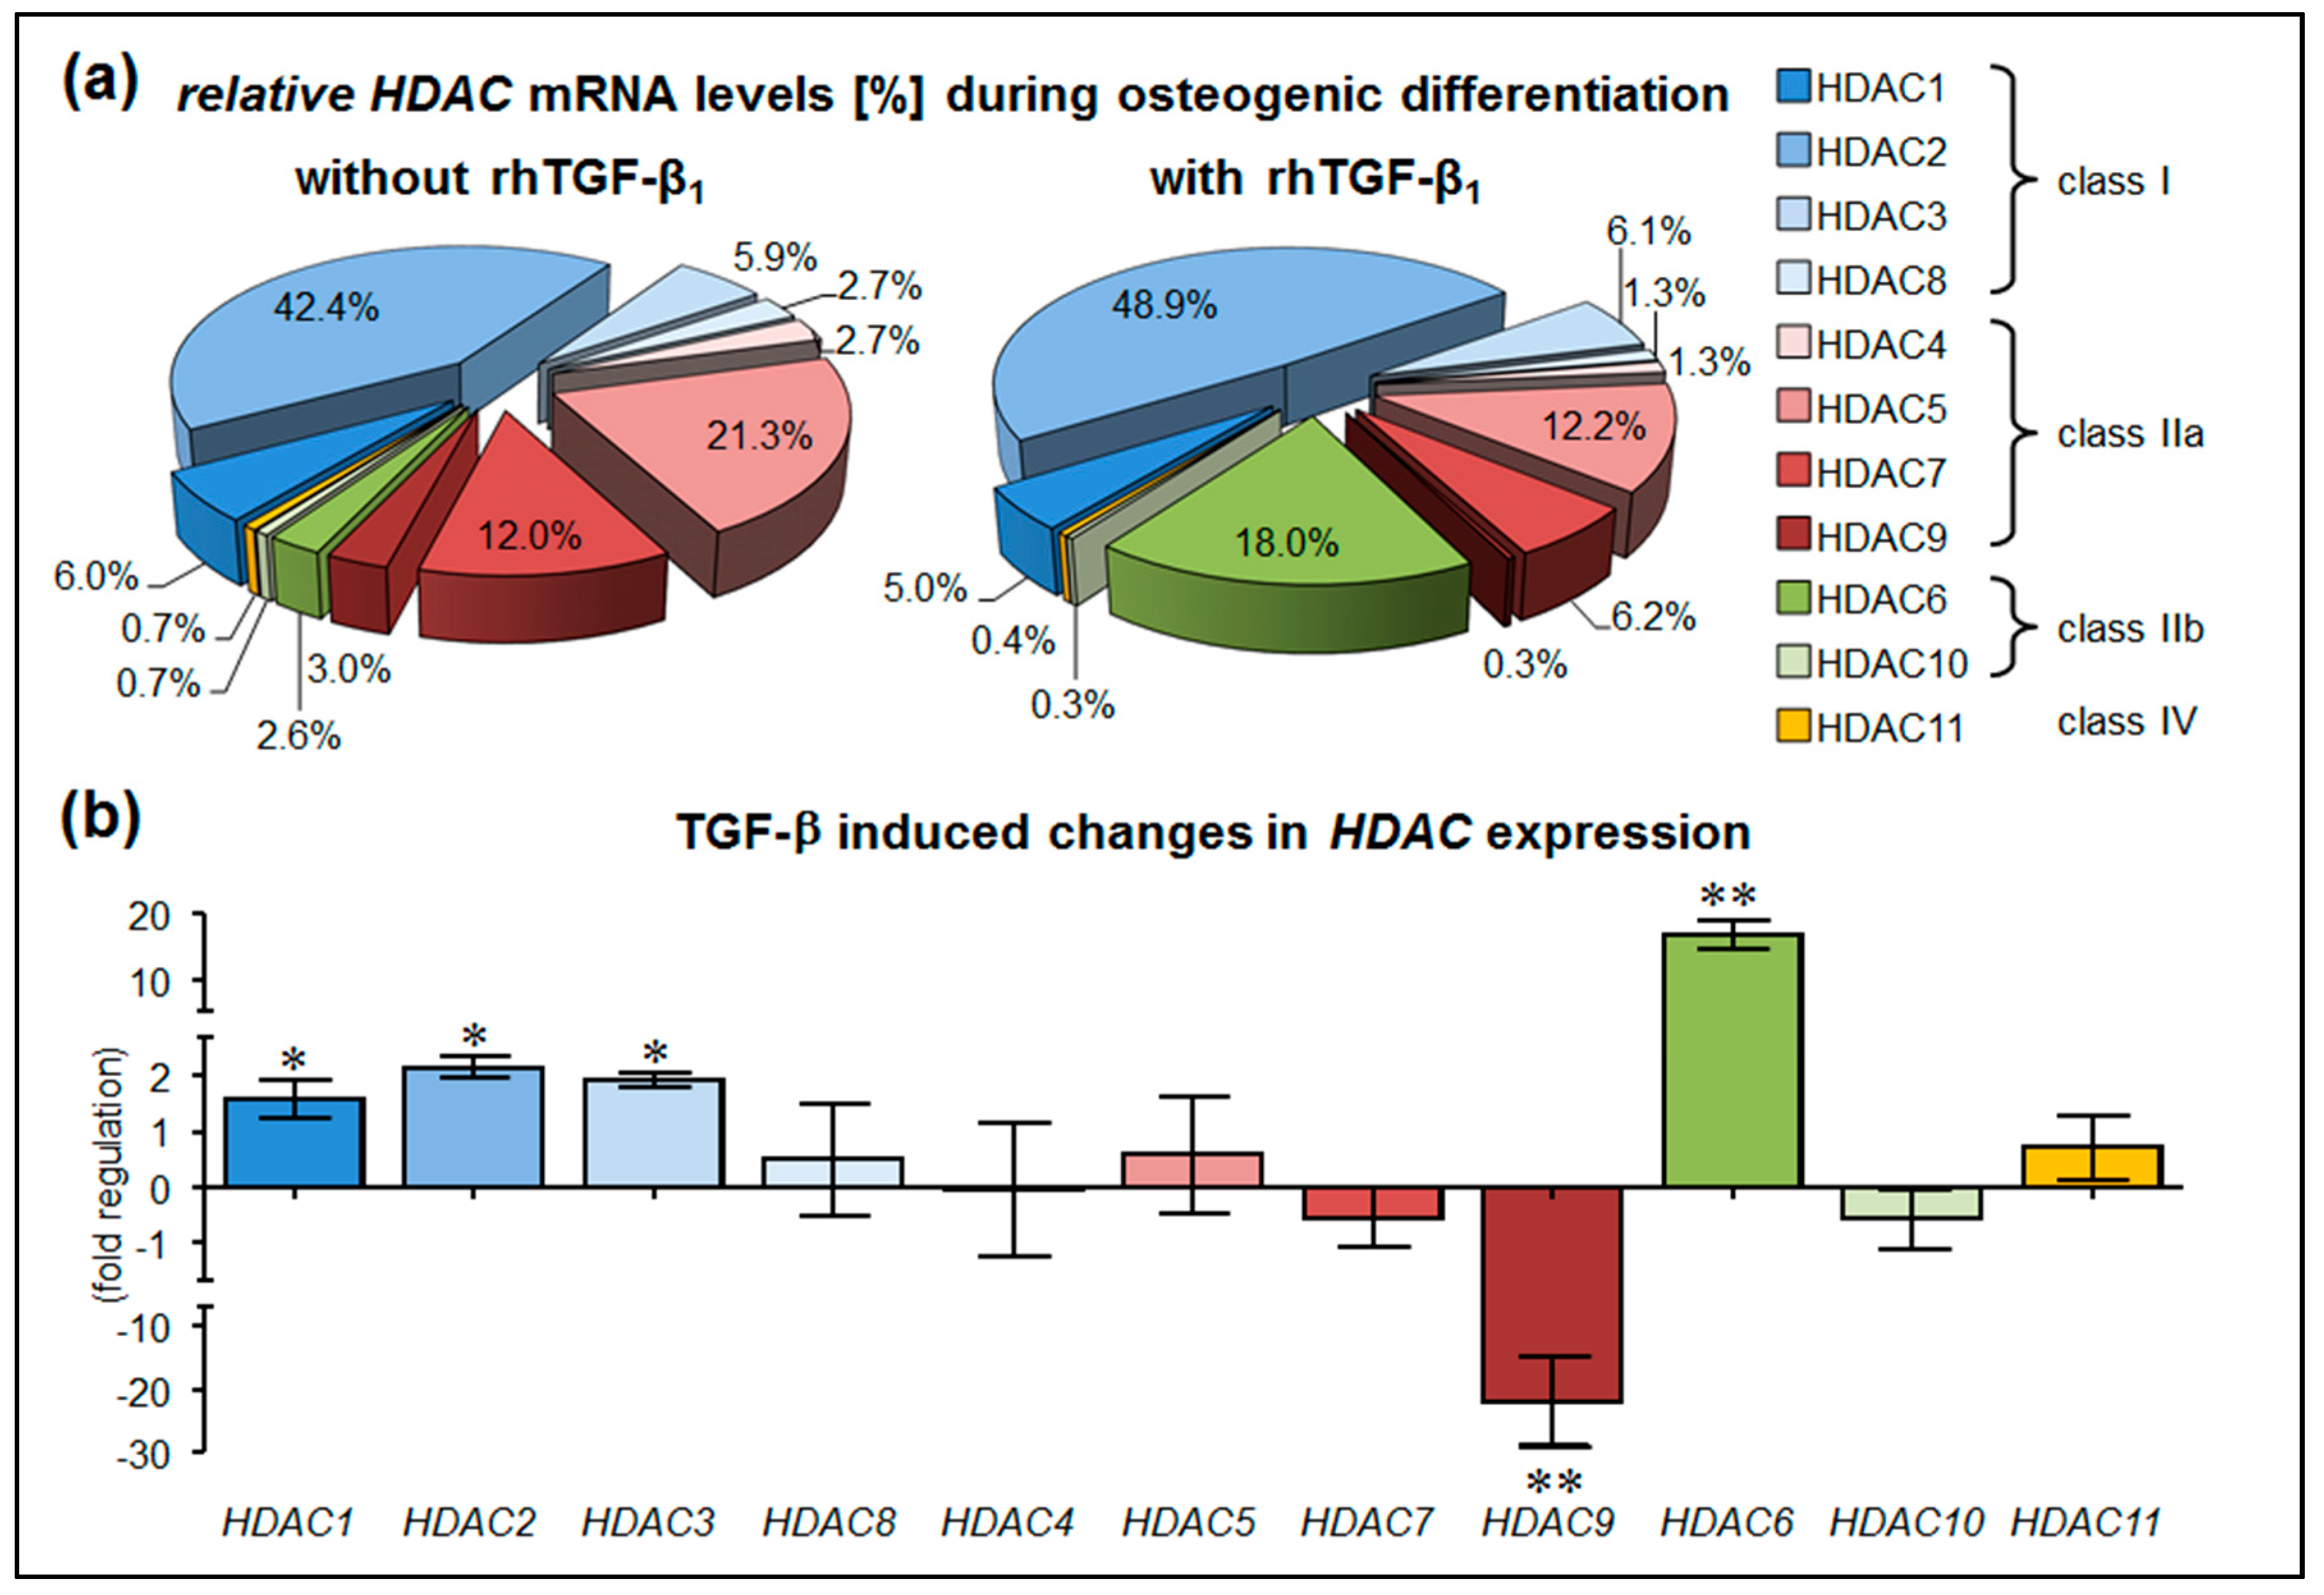
3.1. Stimulation with rhTGF-β1 Alters HDAC Expression in hOBs

Previous experiments have shown that rhTGF-β1 inhibits rhBMP2 and rhBMP7 signaling in hOBs in an HDAC-dependent manner [16]. Thus, we first aimed at characterizing the expression of specific HDAC isoforms in hOBs before and after treatment with 5 ng/mL rhTGF-β1. In line with our previous study, basal expression levels were in descending order: HDAC2, -5, -7, -3, -1, -9, -8, -4, and -6. Basal expression levels of HDAC11 and -10 were close to the detection limit [27]. During the osteogenic differentiation process, 75% of the HDACs expressed were the isoforms HDAC2 (42.4%), HDAC5 (21.3%), and HDAC7 (12.0%). HDAC1 (~6.0%), HDAC3 (~5.9%), HDAC9 (~3.0%), HDAC8 (~2.7%), HDAC4 (~2.7%), and HDAC6 (~2.7%) showed moderate expression levels. Expression levels of HDAC11 and -10 remained close to the detection limit (Figure 1a). In the presence of 5 ng/mL rhTGF-β1, the expression of HDAC6, -2, -3, and -1 increased significantly, while the expression of HDAC9 decreased significantly (Figure 1b). This results in relative expression levels, where almost 80% of the HDACs expressed were the isoforms HDAC2 (48.9%), HDAC6 (18.0%), and HDAC5 (12.2%). HDAC7 (~6.2%), HDAC3 (~6.1%), HDAC1 (~5.0%), HDAC8 (~1.3%), and HDAC4 (~1.3%) showed moderate expression levels. The expression levels of HDAC11, -10, and -9 were close to the detection limit (Figure 1a).

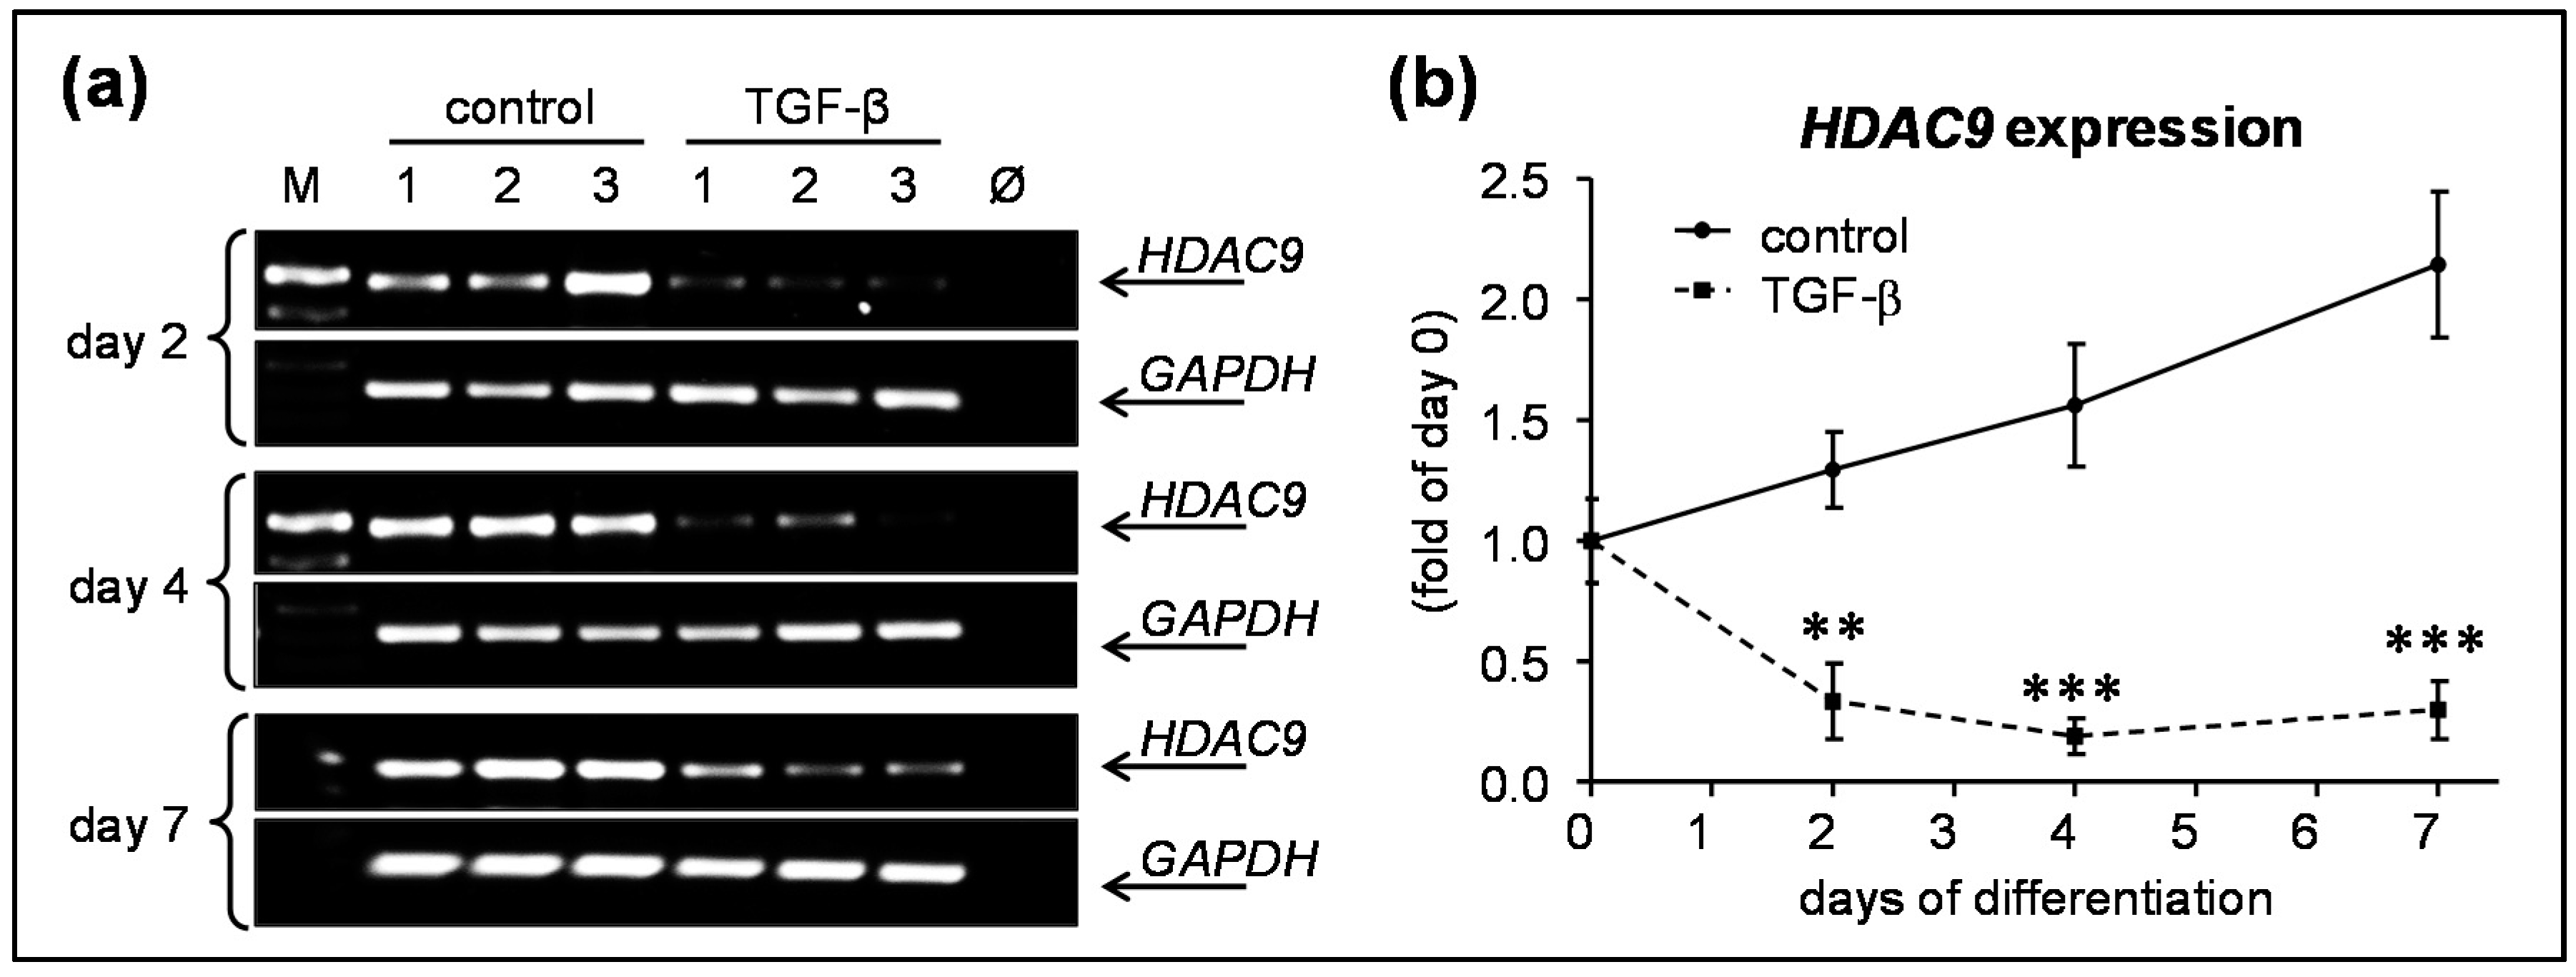
3.2. rhTGF-β1 Treatment Significantly Downregulated HDAC9 Expression in hOBs

Expression of class I HDACs (HDAC1, -2 and -3) has been reported to negatively correlate with the expression the key osteogenic transcription factor Runx2 [20,21,22]. In our group, we could show that the upregulation of HDAC6 results in shortened and deformed primary cilia, which impairs the mechanically driven osteogenesis [27]. Besides the increased expression of these HDACs, the expression of HDAC9 was significantly reduced. HDAC9-deficient mice show extremely low bone mineral densities, however, this effect has been associated with an increased osteoclastogenesis [28]. So far little is known about the role of HDAC9 in hOBs.
Thus, in the next step we aimed at confirming the effect of rhTGF-β1 on HDAC9 expression. HOBs (N = 8) were cultured in osteogenic differentiation medium in the presence or absence of 5 ng/mL rhTGF-β1. After 0, 2, 4, and 7 days, the expression of HDAC9 was analyzed. HDAC9 levels continuously increased during the maturation process. The addition of 5 ng/mL rhTGF-β1 significantly suppressed HDAC9 expression at the timepoints investigated (Figure 2a,b).

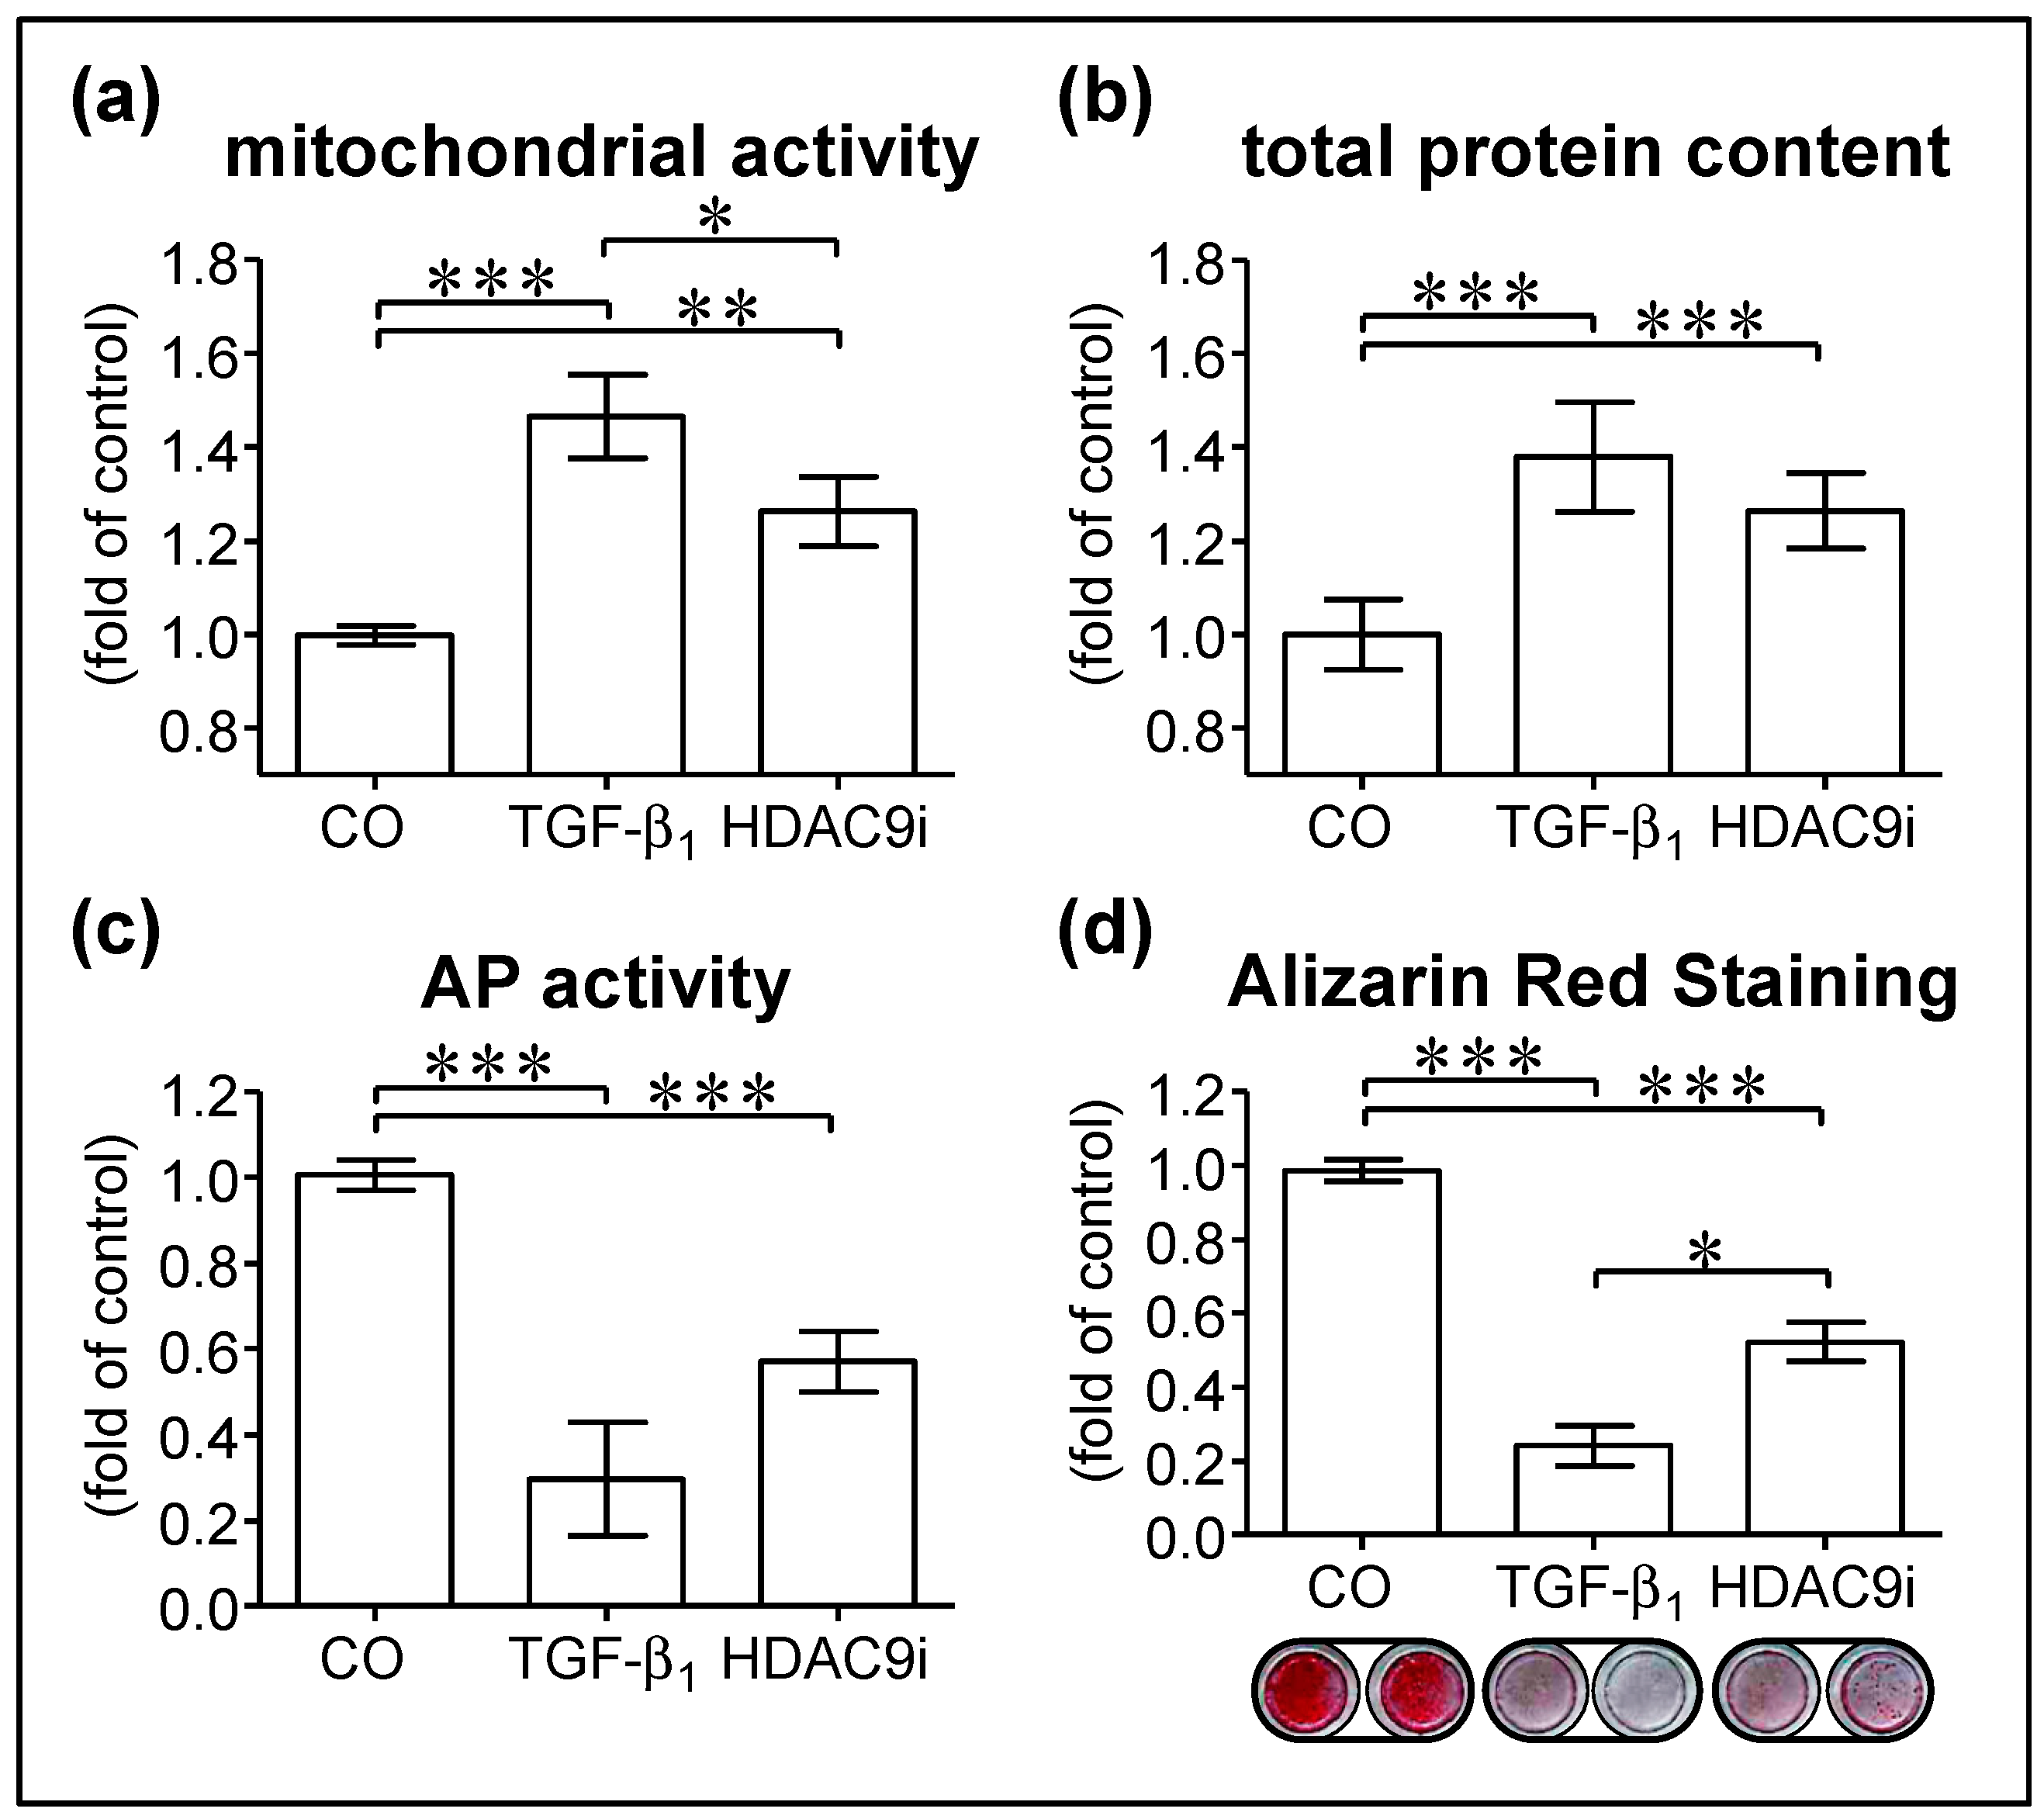
3.3. Inhibition of HDAC9 Impairs Osteogenic Differentiation of hOBs

In order to further investigate which effects the suppression of HDAC9 has on hOBs proliferation and osteogenic function, we inhibited its activity chemically. TMP269 is reported to selectively inhibit HDAC9 activity with an IC50 as low as 23 nM [29]. Our hOBs showed no toxic effects (LDH release) up to a concentration of 160 nM. To effectively block HDAC9 activity, a concentration of 40 nM TMP269 was chosen, which is well below the IC50 of the other HDACs (HDAC4, -5, and 7) that might also be blocked by this chemical [29].
hOBs were osteogenically differentiated for 14 days in the presence or absence of either 5 ng/mL rhTGF-β1 or 40 nM TMP269 (HDAC9i). As reported earlier, the addition of 5 ng/mL rhTGF-β1 significantly increased mitochondrial activity (Figure 3a) and total protein content (Figure 3b) in hOBs. Similarly, though not as pronounced, 40 nM TMP269 (HDAC9i) significantly increased mitochondrial activity (Figure 3a) and total protein content (Figure 3b) in hOBs. This indicates an increased proliferation in these cells. Contrarily, both conditions significantly suppressed hOBs maturation, as can be seen in the significantly decreased AP activity (Figure 3c) early in the differentiation process (day 7) and the resulting matrix mineralization (Figure 3d) as the endpoint of the maturation (day 21). Again, the effect of the rhTGF-β1 treatment was more pronounced as HDAC9 inhibition (TMP269 treatment) alone.

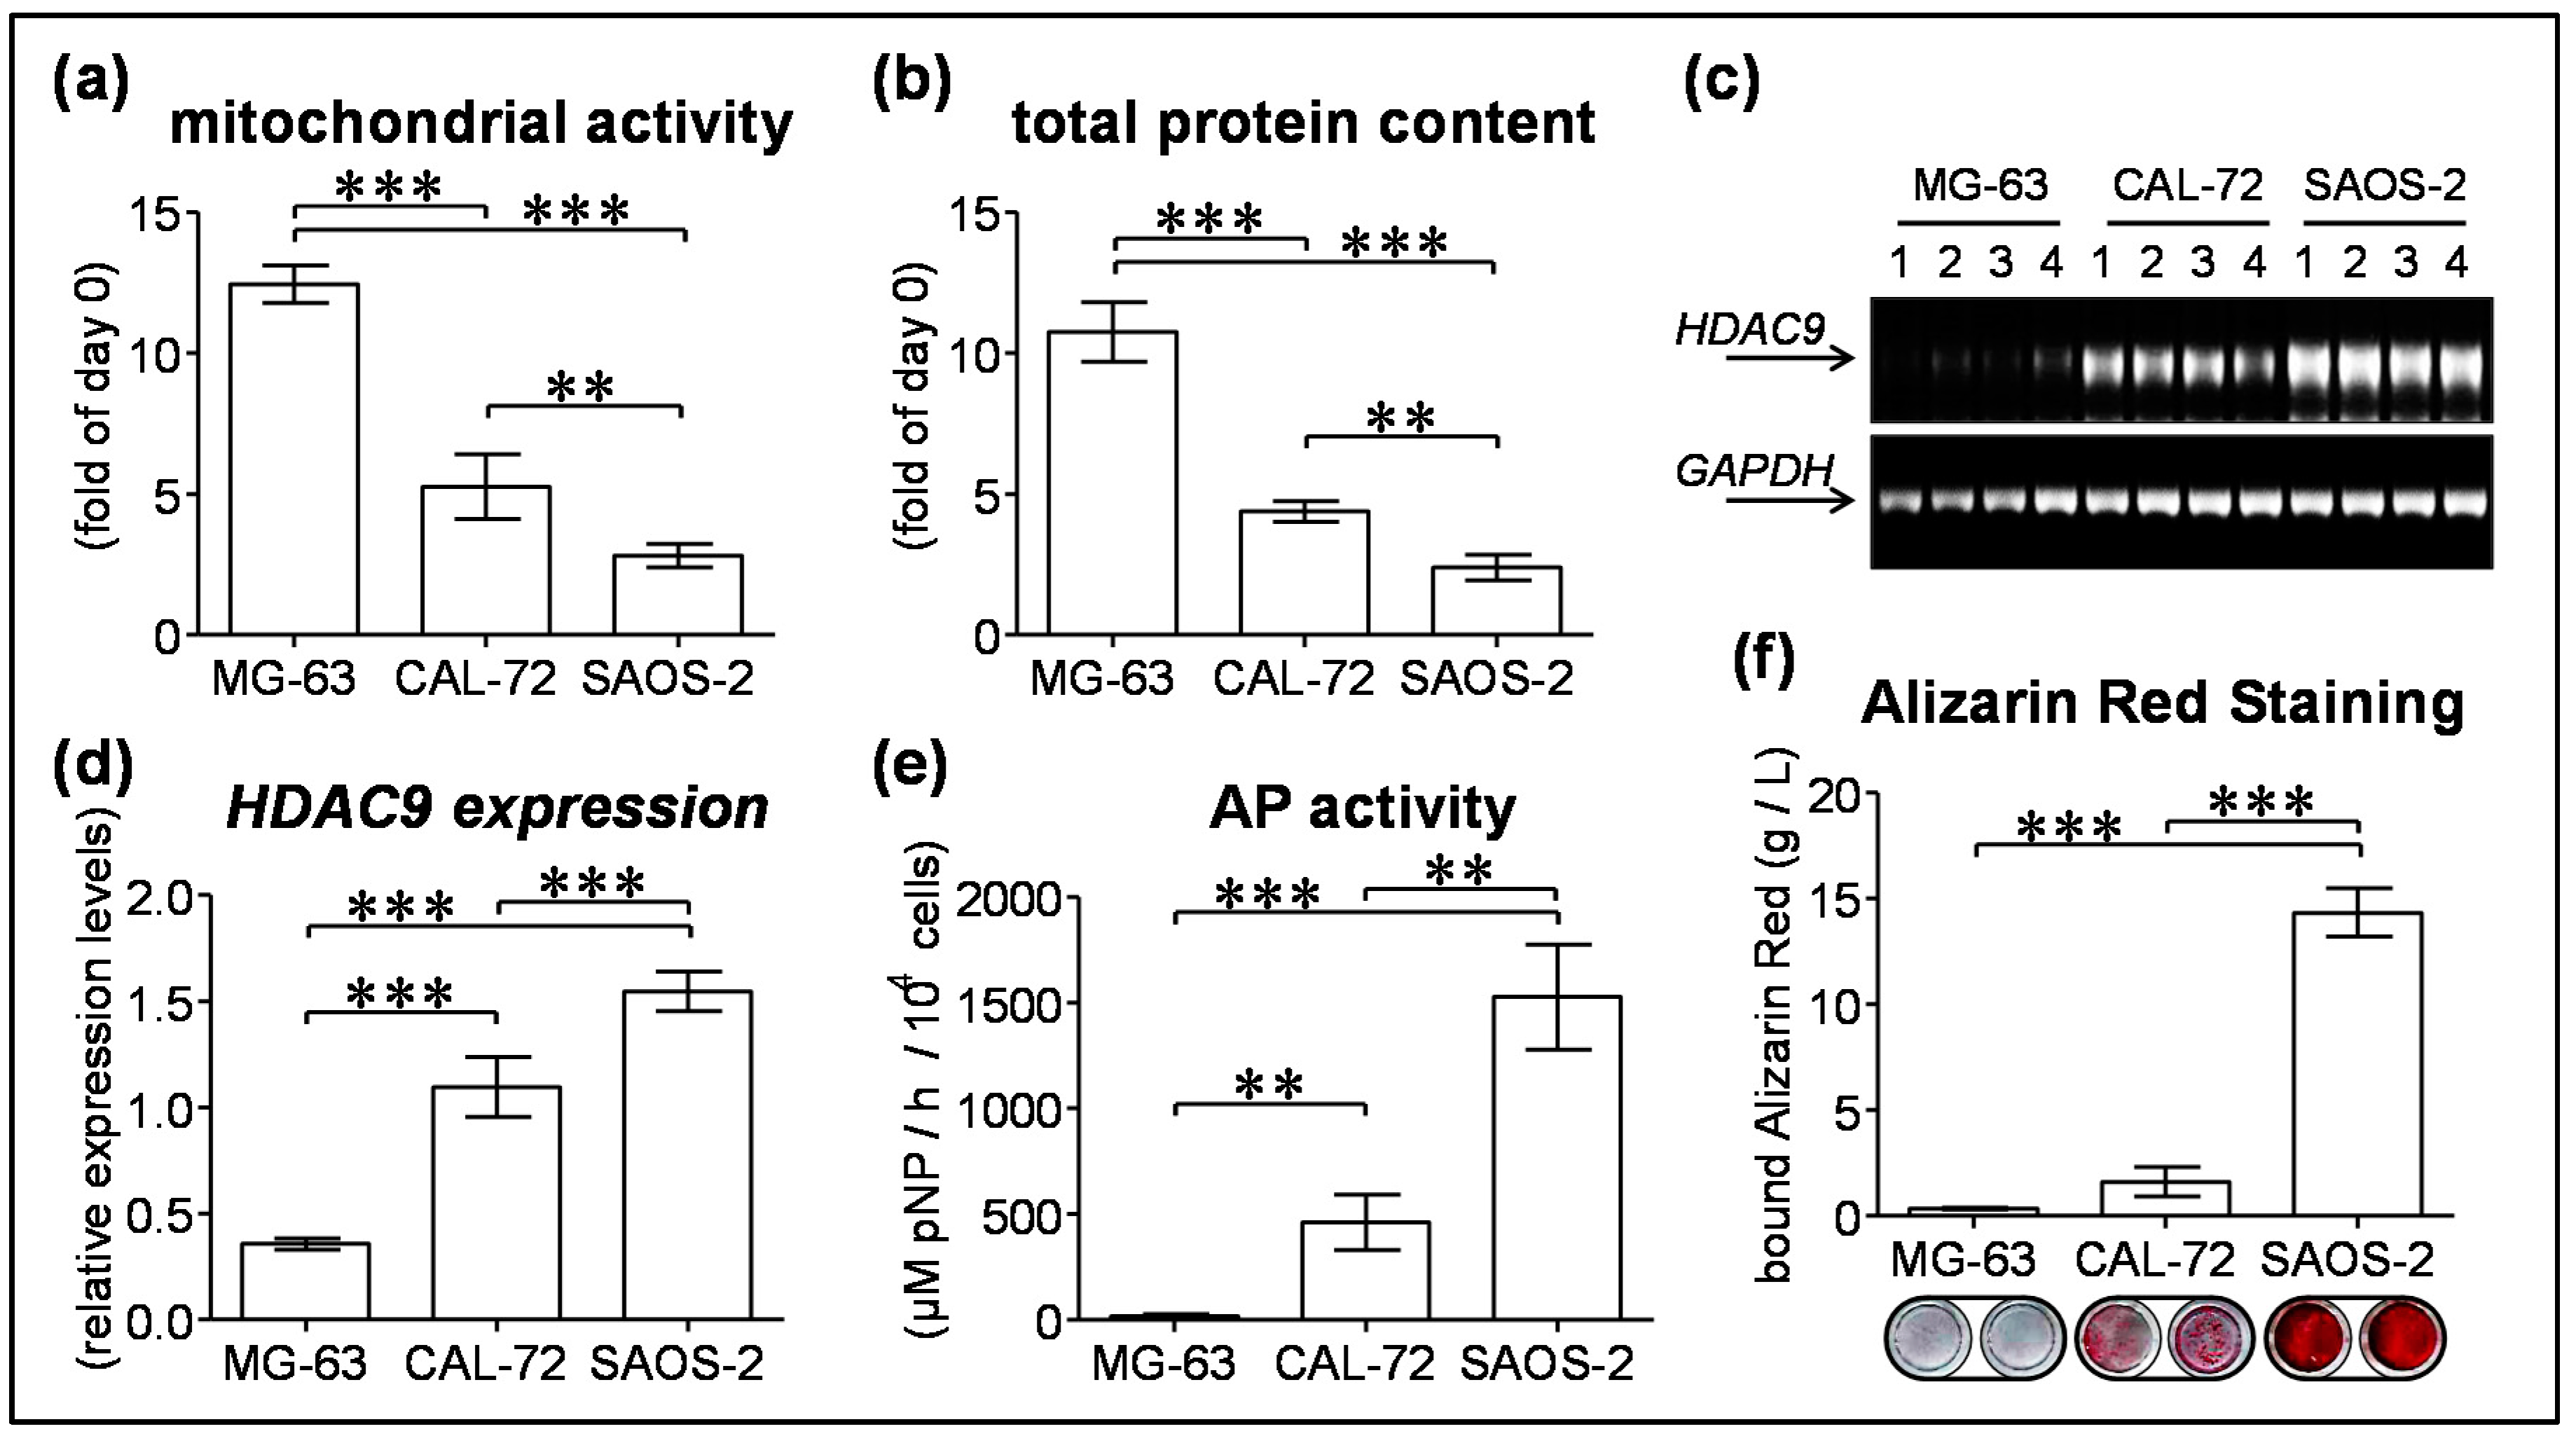
3.4. HDAC9 Expression Negatively Correlates with Proliferation and Positively Correlates with Maturation of Osteogenic Cell Lines

The observed data suggest that HDAC9 expression or activity negatively correlates with cell proliferation and positively correlates with osteogenic differentiation. Thus, in the next step different osteogenic cell lines with different differentiation states were tested. The osteogenic cell lines MG-63, CAL-72, and SAOS-2 were osteogenically differentiated for 14 days (each N = 4, n = 4). In order to determine the proliferation rate, mitochondrial activity and total protein content were determined on day 0 and 4 of differentiation. Within these 4 days, the mitochondrial activity and total protein content in MG-63 cells increased most (12.4-fold and 10.7-fold, respectively), followed by CAL-72 cells (5.3-fold and 4.4-fold, respectively) and SAOS-2 cells (2.8-fold and 2.4-fold, respectively). These data indicate that MG-63 cells proliferate the fastest and SAOS-2 cells the slowest (Figure 4a,b).
In these cells, HDAC9 expression levels were determined in the beginning of the differentiation process (day 2). MG-63 cells showed the lowest expression for HDAC9. CAL-72 cells showed approximately 3-fold higher HDAC9 expression and SAOS-2 cells showed approximately 4.5-fold higher HDAC9 expression (Figure 4c,d).
As an early osteogenic marker, AP activity was measured on day 7 of differentiation. The highest AP activity was measured in SAOS-2 cells, followed by CAL-72 cells and MG-63 cells (Figure 4e). Similarly, the resulting matrix mineralization, as determined by Alizarin red staining, was strongest in SAOS-2 cells, followed by CAL-72 cells and MG-63 cells (Figure 4f).
A correlation analysis revealed that HDAC9 expression levels negatively correlate with cell proliferation, determined both by changes in mitochondrial activity (slope = −7.537 ± 0.929/r2 = 0.8680) and changes in total protein content (slope = −6.639 ± 0.691/r2 = 0.9022). Inversely, HDAC9 expression levels positively correlate with cell maturation, as determined by AP activity (slope = 1.155 ± 0.211/r2 = 0.7495) and matrix mineralization (slope = 9.935 ± 2.411/r2 = 0.6294).

4. Discussion

Although it is generally accepted that TGF-β signaling plays a crucial role in bone remodeling, its regulatory role in terms of bone mass maintenance is not yet clearly characterized [3,4,5,6,7]. We have previously shown that rhTGF-β1 effectively blocks rhBMP2- and rhBMP7-dependent maturation of hOBs, in an HDAC-dependent manner [16]. This raised the question of which HDACs play a role in this mechanism. In the present study, we first aimed at identifying changes in HDAC expression induced by rhTGF-β1 treatment during osteogenic differentiation. In hOBs, the strongest basal gene expression levels were observed for class I HDACs (HDAC1, -2, -3, and -8) and class IIa HDACs (HDAC4, -5, -7, and -9). HDACs of class IIb (HDAC6 and -10) and class IV (HDAC11) were hardly expressed. Gene expression levels of the different HDACs did not alter significantly during osteogenic differentiation. However, the addition of 5 ng/mL rhTGF-β1 strongly induced the expression of HDAC6 (>20-fold) and doubled the expression of HDAC1, -3, -5, and -7. This is in line with our earlier observation that rhTGF-β1 treatment significantly induces HDAC activity [16]. Thus, it is astonishing that the expression of HDAC9 almost disappears upon treatment with rhTGF-β1.
In the promoter of HDAC9 there are several binding sites for MEF2A and MEF2C, which have been reported to regulate the expression of HDAC9 [30,31]. Liu and colleagues could show that TGF-β suppresses MEF2 function by the direct interaction of the transcription factor Smad3 with MEF2C [32]. This could explain the observed drop in HDAC9 expression in rhTGF-β1-treated cells. Thus, patients with chronically elevated TGF-β1-levels (e.g., diabetics, patients with chronic inflammation, etc.), frequently suffering from delayed fracture healing, are at a high risk for decreased HDAC9 levels.
HDAC9 is described to be a critical regulator in immune response; however, little is known about the role of HDAC9 in bone metabolism. HDAC9 knockout mice have significantly lower bone mineral densities, as a consequence of increased osteoclastogenesis [28]. HDAC9 is a target of miRNA188, being upregulated with age. In miRNA188 knockout mice, which have high HDAC9 levels, age-dependent switch from osteogenesis to adipogenesis in bone is delayed [33], suggesting that HDAC9 plays a direct role in osteogenesis. In our experiments, the reduced expression of HDAC9 as well as the inhibition of HDAC9 activity resulted in reduced osteogenic function of hOBs.
It has been described that HDAC9 is strongly suppressed during adipogenesis. The lack of HDAC9 increases the transcriptional activity of C/EBPα, PPARγ, and FABP4 in adipocytes [34]. Osteoblast-specific overexpression of PPARγ markedly affects bone mineral density. However, the decrease in bone mineral density was associated with a decrease in OPG to RANKL ratio and thus an increased osteoclastogenesis [35]. This was confirmed with the massive bone growth of mice having an osteoclast-specific knockdown of PPARγ [36]. In our osteogenic cell lines, OPG expression was strongest for MG-63 and SaOS-2 cells, and RANKL expression was strongest for SaOS-2 cells. The resulting OPG to RANKL ratio was lowest for SaOS-2 cells, where HDAC9 expression was highest, suggesting that other mechanisms might play a role and that the osteoblast-specific overexpression of HDAC9 might increase bone turnover.
Furthermore, in our mono-cultures, osteoclasts were the main target of HDAC9. As the HDAC9 inhibitor TMP269 was able to suppress osteogenic differentiation, this points towards a direct HDAC9-dependent mechanism. It has been shown that HDAC9 expression is not only controlled by MEF2A and MEF2C, but can regulate the transcriptional activity of MEF2 itself [31]. MEF2 transcriptional activity is crucial for osteogenic differentiation, as it regulates the expression of the key osteogenic transcription factor Runx2 and other osteogenic marker genes [37,38]. This could explain why hOBs treated with the HDAC9 inhibitor (TMP269) showed suppressed osteogenic function. However, the effect was not as pronounced as for those with rhTGF-β1 treatment. This might be due to the other HDACs that were upregulated by rhTGF-β1 treatment. Improved osteogenic differentiation by using small chemical inhibitors for HDACs [16,18] points towards a direct acetylation-dependent mechanism. This is described for HDAC1 and -3 overexpression, which inhibits the expression of the key osteogenic transcription factor Runx2 [20,21,22]. Furthermore, the overexpression of HDAC6 causes a de-acetylation of α-tubulin, resulting in damaged primary cilia and impaired mechanically driven osteogenesis [27]. Conversely, HDAC4, -5, -6, -7, and -8 have been described to bind Runx2 and thus interfere with its transcriptional activity [23,24,25,26]. Thus, the decrease in HDAC9 in combination with the increased expression of HDAC1, -2, -3, and -6 in our rhTGF-β1-treated hOBs could be responsible for the observed loss of function.
Interestingly, with the decrease in osteogenic differentiation, the hOBs proliferation increased, as could be seen in the increased mitochondrial activity and total protein content. Using different osteogenic (osteosarcoma) cell lines, we found a negative correlation of HDAC9 expression with cell proliferation as well as a positive correlation of HDAC9 expression with osteogenic maturation of these cells. This is in clear contrast to the work from Zhao, which showed that the overexpression of HDAC9 in U2OS and MG-63 osteosarcoma cells promoted their proliferation by suppressing p53 transcriptional activity [39]. Thus, further experiments have to be done to investigate how HDAC9 regulates hOBs and osteosarcoma cell proliferation, or whether the expression of HDAC9 can be used to predict the osteogenic differentiation potential of these cells.

5. Conclusions

Summarizing our results, rhTGF-β1 treatment significantly suppressed the expression of HDAC9 in hOBs, which resulted in increased proliferation and decreased maturation of these cells. Considering also the reports that HDAC9 knockout induced osteoclastogenesis, HDAC9 represents an interesting therapeutic target for bone, especially for patients with chronically elevated TGF-β1-levels (e.g., diabetics, patients with chronic inflammation, etc.), who frequently suffer from poor bone quality, increased fracture risk, and delayed fracture healing.

Acknowledgments

This work was partially supported by the intramural funding of the Eberhard Karls Universität Tübingen (fortüne Junior 2174-0-0).

Author Contributions

Sabrina Ehnert, Andreas K. Nussler and Stefan Pscherer conceived and designed the experiments; Elisabeth Heuberger, Caren Linnemann and Sabrina Ehnert performed the experiments; Sabrina Ehnert and Elisabeth Heuberger analyzed the data; Stefan Pscherer contributed reagents/materials/analysis tools; Sabrina Ehnert and Stefan Pscherer wrote the paper. All authors critically reviewed the manuscript.

Conflicts of Interest

The authors declare no conflict of interest.

References

  1. Janssens, K.; ten Dijke, P.; Janssens, S.; van Hul, W. Transforming growth factor-β1 to the bone. Endocr. Rev. 2005, 26, 743–774. [Google Scholar] [CrossRef] [PubMed]
  2. Wu, M.; Chen, G.; Li, Y.P. Tgf-β and bmp signaling in osteoblast, skeletal development, and bone formation, homeostasis and disease. Bone Res. 2016, 4, 16009. [Google Scholar] [CrossRef] [PubMed]
  3. Geiser, A.G.; Zeng, Q.Q.; Sato, M.; Helvering, L.M.; Hirano, T.; Turner, C.H. Decreased bone mass and bone elasticity in mice lacking the transforming growth factor-β1 gene. Bone 1998, 23, 87–93. [Google Scholar] [CrossRef]
  4. Noda, M.; Camilliere, J.J. In vivo stimulation of bone formation by transforming growth factor-β. Endocrinology 1989, 124, 2991–2994. [Google Scholar] [CrossRef] [PubMed]
  5. Joyce, M.E.; Roberts, A.B.; Sporn, M.B.; Bolander, M.E. Transforming growth factor-β and the initiation of chondrogenesis and osteogenesis in the rat femur. J. Cell Biol. 1990, 110, 2195–2207. [Google Scholar] [CrossRef] [PubMed]
  6. Erlebacher, A.; Derynck, R. Increased expression of tgf-β 2 in osteoblasts results in an osteoporosis-like phenotype. J. Cell Biol. 1996, 132, 195–210. [Google Scholar] [CrossRef] [PubMed]
  7. Filvaroff, E.; Erlebacher, A.; Ye, J.; Gitelman, S.E.; Lotz, J.; Heillman, M.; Derynck, R. Inhibition of tgf-β receptor signaling in osteoblasts leads to decreased bone remodeling and increased trabecular bone mass. Development 1999, 126, 4267–4279. [Google Scholar] [PubMed]
  8. Mohammad, K.S.; Chen, C.G.; Balooch, G.; Stebbins, E.; McKenna, C.R.; Davis, H.; Niewolna, M.; Peng, X.H.; Nguyen, D.H.; Ionova-Martin, S.S.; et al. Pharmacologic inhibition of the tgf-β type i receptor kinase has anabolic and anti-catabolic effects on bone. PLoS ONE 2009, 4, e5275. [Google Scholar] [CrossRef] [PubMed]
  9. Ehnert, S.; Freude, T.; Ihle, C.; Mayer, L.; Braun, B.; Graeser, J.; Flesch, I.; Stockle, U.; Nussler, A.K.; Pscherer, S. Factors circulating in the blood of type 2 diabetes mellitus patients affect osteoblast maturation - description of a novel in vitro model. Exp. Cell Res. 2015, 332, 247–258. [Google Scholar] [CrossRef] [PubMed]
  10. Nussler, A.K.; Wildemann, B.; Freude, T.; Litzka, C.; Soldo, P.; Friess, H.; Hammad, S.; Hengstler, J.G.; Braun, K.F.; Trak-Smayra, V.; et al. Chronic ccl4 intoxication causes liver and bone damage similar to the human pathology of hepatic osteodystrophy: A mouse model to analyse the liver-bone axis. Arch. Toxicol. 2014, 88, 997–1006. [Google Scholar] [CrossRef] [PubMed]
  11. Pscherer, S.; Freude, T.; Forst, T.; Nussler, A.K.; Braun, K.F.; Ehnert, S. Anti-diabetic treatment regulates pro-fibrotic tgf-β serum levels in type 2 diabetics. Diabetol. Metab. Syndr. 2013, 5, 48. [Google Scholar] [CrossRef] [PubMed]
  12. Ehnert, S.; Baur, J.; Schmitt, A.; Neumaier, M.; Lucke, M.; Dooley, S.; Vester, H.; Wildemann, B.; Stockle, U.; Nussler, A.K. Tgf-β1 as possible link between loss of bone mineral density and chronic inflammation. PLoS ONE 2010, 5, e14073. [Google Scholar] [CrossRef] [PubMed]
  13. Zimmermann, G.; Henle, P.; Kusswetter, M.; Moghaddam, A.; Wentzensen, A.; Richter, W.; Weiss, S. Tgf-β1 as a marker of delayed fracture healing. Bone 2005, 36, 779–785. [Google Scholar] [CrossRef] [PubMed]
  14. Grafe, I.; Yang, T.; Alexander, S.; Homan, E.P.; Lietman, C.; Jiang, M.M.; Bertin, T.; Munivez, E.; Chen, Y.; Dawson, B.; et al. Excessive transforming growth factor-β signaling is a common mechanism in osteogenesis imperfecta. Nat. Med. 2014, 20, 670–675. [Google Scholar] [CrossRef] [PubMed]
  15. Zhen, G.; Wen, C.; Jia, X.; Li, Y.; Crane, J.L.; Mears, S.C.; Askin, F.B.; Frassica, F.J.; Chang, W.; Yao, J.; et al. Inhibition of tgf-β signaling in mesenchymal stem cells of subchondral bone attenuates osteoarthritis. Nat. Med. 2013, 19, 704–712. [Google Scholar] [CrossRef] [PubMed]
  16. Ehnert, S.; Zhao, J.; Pscherer, S.; Freude, T.; Dooley, S.; Kolk, A.; Stockle, U.; Nussler, A.K.; Hube, R. Transforming growth factor β1 inhibits bone morphogenic protein (bmp)-2 and bmp-7 signaling via upregulation of ski-related novel protein n (snon): Possible mechanism for the failure of bmp therapy? BMC Med. 2012, 10, 101. [Google Scholar] [CrossRef] [PubMed]
  17. De Ruijter, A.J.; van Gennip, A.H.; Caron, H.N.; Kemp, S.; van Kuilenburg, A.B. Histone deacetylases (hdacs): Characterization of the classical hdac family. Biochem. J. 2003, 370, 737–749. [Google Scholar] [CrossRef] [PubMed]
  18. Maroni, P.; Brini, A.T.; Arrigoni, E.; de Girolamo, L.; Niada, S.; Matteucci, E.; Bendinelli, P.; Desiderio, M.A. Chemical and genetic blockade of hdacs enhances osteogenic differentiation of human adipose tissue-derived stem cells by oppositely affecting osteogenic and adipogenic transcription factors. Biochem. Biophys. Res. Commun. 2012, 428, 271–277. [Google Scholar] [CrossRef] [PubMed]
  19. Saito, T.; Nishida, K.; Furumatsu, T.; Yoshida, A.; Ozawa, M.; Ozaki, T. Histone deacetylase inhibitors suppress mechanical stress-induced expression of runx-2 and adamts-5 through the inhibition of the mapk signaling pathway in cultured human chondrocytes. Osteoarthr. Cartil. 2013, 21, 165–174. [Google Scholar] [CrossRef] [PubMed] [Green Version]
  20. Liu, T.; Hou, L.; Zhao, Y.; Huang, Y. Epigenetic silencing of hdac1 by mir-449a upregulates runx2 and promotes osteoblast differentiation. Int. J. Mol. Med. 2015, 35, 238–246. [Google Scholar] [CrossRef] [PubMed]
  21. Lee, H.W.; Suh, J.H.; Kim, A.Y.; Lee, Y.S.; Park, S.Y.; Kim, J.B. Histone deacetylase 1-mediated histone modification regulates osteoblast differentiation. Mol. Endocrinol. 2006, 20, 2432–2443. [Google Scholar] [CrossRef] [PubMed]
  22. Schroeder, T.M.; Kahler, R.A.; Li, X.; Westendorf, J.J. Histone deacetylase 3 interacts with runx2 to repress the osteocalcin promoter and regulate osteoblast differentiation. J. Biol. Chem. 2004, 279, 41998–42007. [Google Scholar] [CrossRef] [PubMed]
  23. Jensen, E.D.; Schroeder, T.M.; Bailey, J.; Gopalakrishnan, R.; Westendorf, J.J. Histone deacetylase 7 associates with runx2 and represses its activity during osteoblast maturation in a deacetylation-independent manner. J. Bone Miner. Res. 2008, 23, 361–372. [Google Scholar] [CrossRef] [PubMed]
  24. Fu, Y.; Zhang, P.; Ge, J.; Cheng, J.; Dong, W.; Yuan, H.; Du, Y.; Yang, M.; Sun, R.; Jiang, H. Histone deacetylase 8 suppresses osteogenic differentiation of bone marrow stromal cells by inhibiting histone h3k9 acetylation and runx2 activity. Int. J. Biochem. Cell. Biol. 2014, 54, 68–77. [Google Scholar] [CrossRef] [PubMed]
  25. Westendorf, J.J.; Zaidi, S.K.; Cascino, J.E.; Kahler, R.; van Wijnen, A.J.; Lian, J.B.; Yoshida, M.; Stein, G.S.; Li, X. Runx2 (cbfa1, aml-3) interacts with histone deacetylase 6 and represses the p21(cip1/waf1) promoter. Mol. Cell. Biol. 2002, 22, 7982–7992. [Google Scholar] [CrossRef] [PubMed]
  26. Kang, J.S.; Alliston, T.; Delston, R.; Derynck, R. Repression of runx2 function by tgf-β through recruitment of class ii histone deacetylases by smad3. EMBO J. 2005, 24, 2543–2555. [Google Scholar] [CrossRef] [PubMed]
  27. Ehnert, S.; Sreekumar, V.; Aspera-Werz, R.H.; Sajadian, S.O.; Wintermeyer, E.; Sandmann, G.H.; Bahrs, C.; Hengstler, J.G.; Godoy, P.; Nussler, A.K. Tgf-β1 impairs mechanosensation of human osteoblasts via hdac6-mediated shortening and distortion of primary cilia. J. Mol. Med. 2017, 95, 653–663. [Google Scholar] [CrossRef] [PubMed]
  28. Jin, Z.; Wei, W.; Huynh, H.; Wan, Y. Hdac9 inhibits osteoclastogenesis via mutual suppression of ppargamma/rankl signaling. Mol. Endocrinol. 2015, 29, 730–738. [Google Scholar] [CrossRef] [PubMed]
  29. Lobera, M.; Madauss, K.P.; Pohlhaus, D.T.; Wright, Q.G.; Trocha, M.; Schmidt, D.R.; Baloglu, E.; Trump, R.P.; Head, M.S.; Hofmann, G.A.; et al. Selective class iia histone deacetylase inhibition via a nonchelating zinc-binding group. Nat. Chem. Biol. 2013, 9, 319–325. [Google Scholar] [CrossRef] [PubMed]
  30. Di Giorgio, E.; Brancolini, C. Regulation of class iia hdac activities: It is not only matter of subcellular localization. Epigenomics 2016, 8, 251–269. [Google Scholar] [CrossRef] [PubMed]
  31. Haberland, M.; Arnold, M.A.; McAnally, J.; Phan, D.; Kim, Y.; Olson, E.N. Regulation of hdac9 gene expression by mef2 establishes a negative-feedback loop in the transcriptional circuitry of muscle differentiation. Mol. Cell. Biol. 2007, 27, 518–525. [Google Scholar] [CrossRef] [PubMed]
  32. Liu, D.; Kang, J.S.; Derynck, R. Tgf-β-activated smad3 represses mef2-dependent transcription in myogenic differentiation. EMBO J. 2004, 23, 1557–1566. [Google Scholar] [CrossRef] [PubMed]
  33. Li, C.J.; Cheng, P.; Liang, M.K.; Chen, Y.S.; Lu, Q.; Wang, J.Y.; Xia, Z.Y.; Zhou, H.D.; Cao, X.; Xie, H.; et al. Microrna-188 regulates age-related switch between osteoblast and adipocyte differentiation. J. Clin. Investig. 2015, 125, 1509–1522. [Google Scholar] [CrossRef] [PubMed]
  34. Chatterjee, T.K.; Idelman, G.; Blanco, V.; Blomkalns, A.L.; Piegore, M.G., Jr.; Weintraub, D.S.; Kumar, S.; Rajsheker, S.; Manka, D.; Rudich, S.M.; et al. Histone deacetylase 9 is a negative regulator of adipogenic differentiation. J. Biol. Chem. 2011, 286, 27836–27847. [Google Scholar] [CrossRef] [PubMed]
  35. Cho, S.W.; Yang, J.Y.; Her, S.J.; Choi, H.J.; Jung, J.Y.; Sun, H.J.; An, J.H.; Cho, H.Y.; Kim, S.W.; Park, K.S.; et al. Osteoblast-targeted overexpression of ppargamma inhibited bone mass gain in male mice and accelerated ovariectomy-induced bone loss in female mice. J. Bone Miner. Res. 2011, 26, 1939–1952. [Google Scholar] [CrossRef] [PubMed]
  36. Wan, Y.; Chong, L.W.; Evans, R.M. Ppar-gamma regulates osteoclastogenesis in mice. Nat. Med. 2007, 13, 1496–1503. [Google Scholar] [CrossRef] [PubMed]
  37. Arnold, M.A.; Kim, Y.; Czubryt, M.P.; Phan, D.; McAnally, J.; Qi, X.; Shelton, J.M.; Richardson, J.A.; Bassel-Duby, R.; Olson, E.N. Mef2c transcription factor controls chondrocyte hypertrophy and bone development. Dev. Cell. 2007, 12, 377–389. [Google Scholar] [CrossRef] [PubMed]
  38. Shen, S.; Huang, D.; Feng, G.; Zhu, L.; Zhang, Y.; Cao, P.; Zheng, K.; Zhang, D.; Feng, X. Mef2 transcription factor regulates osteogenic differentiation of dental pulp stem cells. Cell. Reprogram. 2016, 18, 237–245. [Google Scholar] [CrossRef] [PubMed]
  39. Zhao, Y.X.; Wang, Y.S.; Cai, Q.Q.; Wang, J.Q.; Yao, W.T. Up-regulation of hdac9 promotes cell proliferation through suppressing p53 transcription in osteosarcoma. Int. J. Clin. Exp. Med. 2015, 8, 11818–11823. [Google Scholar] [PubMed]
Figure 1. Effect of rhTGF-β1 treatment on HDAC expression during osteogenic differentiation of hOBs: The expression of HDACs was determined using the human RT2 Profiler PCR Array for epigenetic chromatin modification enzymes (Qiagen, Hilden, Germany), in hOBs (N = 16/pooled; n = 2) osteogenically differentiated for 2 days in the presence or absence of 5 ng/mL rhTGF-β1. (a) Pie chart of the mean percental distribution of the HDAC isoforms (2−ΔCt) during osteogenic differentiation in the absence or presence of 5 ng/mL rhTGF-β1; (b) Expression changes of the different HDAC isoforms induced by 5 ng/mL rhTGF-β1 treatment (fold regulation). * p < 0.05 and ** p < 0.01 as compared to untreated cells.
Jfmk 02 00041 g001
Figure 2. rhTGF-β1 treatment suppresses HDAC9 expression during osteogenic differentiation of hOBs: hOBs (N = 8) were osteogenically differentiated in the presence or absence of 5 ng/mL rhTGF-β1. On day 0, 2, 4, and 7, the expression of HDAC9 was determined by RT-PCR. GAPDH was used as a housekeeping gene. (a) Representative figure of the RT-PCR products (N = 3); (b) Densitometric analysis (N = 8; n = 2) of all RT-PCR signals. hOBs without rhTGF-β1 treatment are represented as circles connected with straight lines and cells with rhTGF-β1 treatment are represented as rectangles connected with dotted lines. ** p < 0.01 and *** p < 0.001 as compared to untreated cells.
Jfmk 02 00041 g002
Figure 3. Chemical inhibition of HDAC9 suppresses osteogenic differentiation of hOBs: hOBs (N = 11, n = 4) were osteogenically differentiated for 21 days in the presence of either 5 ng/mL rhTGF-β1 or 40 nM TMP269 (HDAC9i). (a) Mitochondrial activity (resazurin conversion) on day 7 of differentiation; (b) Total protein content (sulforhodamine B staining) on day 7 of differentiation; (c) alkaline phosphatase (AP) activity on day 7 of differentiation; (d) Matrix mineralization (Alizarin Red staining) on day 21 of differentiation. * p < 0.05, ** p < 0.01, and *** p < 0.001 as indicated.
Jfmk 02 00041 g003
Figure 4. HDAC9 expression negatively correlates with proliferation and positively correlates with maturation in osteogenic cell lines: osteogenic cell lines (MG-63, CAL-72 and SAOS-2/N = 4, n = 4) were osteogenically differentiated for 14 days. (a) Increase in mitochondrial activity (resazurin conversion) until day 4 of differentiation; (b) Increase in total protein content (SRB staining) until day 4 of differentiation; (c) Representative figure of the RT-PCR products (HDAC9 and GAPDH) on day 2 of differentiation; (d) Densitometric analysis of all RT-PCR signals; (e) AP activity on day 4 of differentiation; (f) Matrix mineralization (Alizarin Red staining) on day 14 of differentiation. ** p < 0.01 and *** p < 0.001 as indicated.
Jfmk 02 00041 g004

