
Peripheral Electrical and Magnetic Stimulation to Augment Resistance Training

Abstract
:1. Introduction
2. Materials and Methods
2.1. Participants
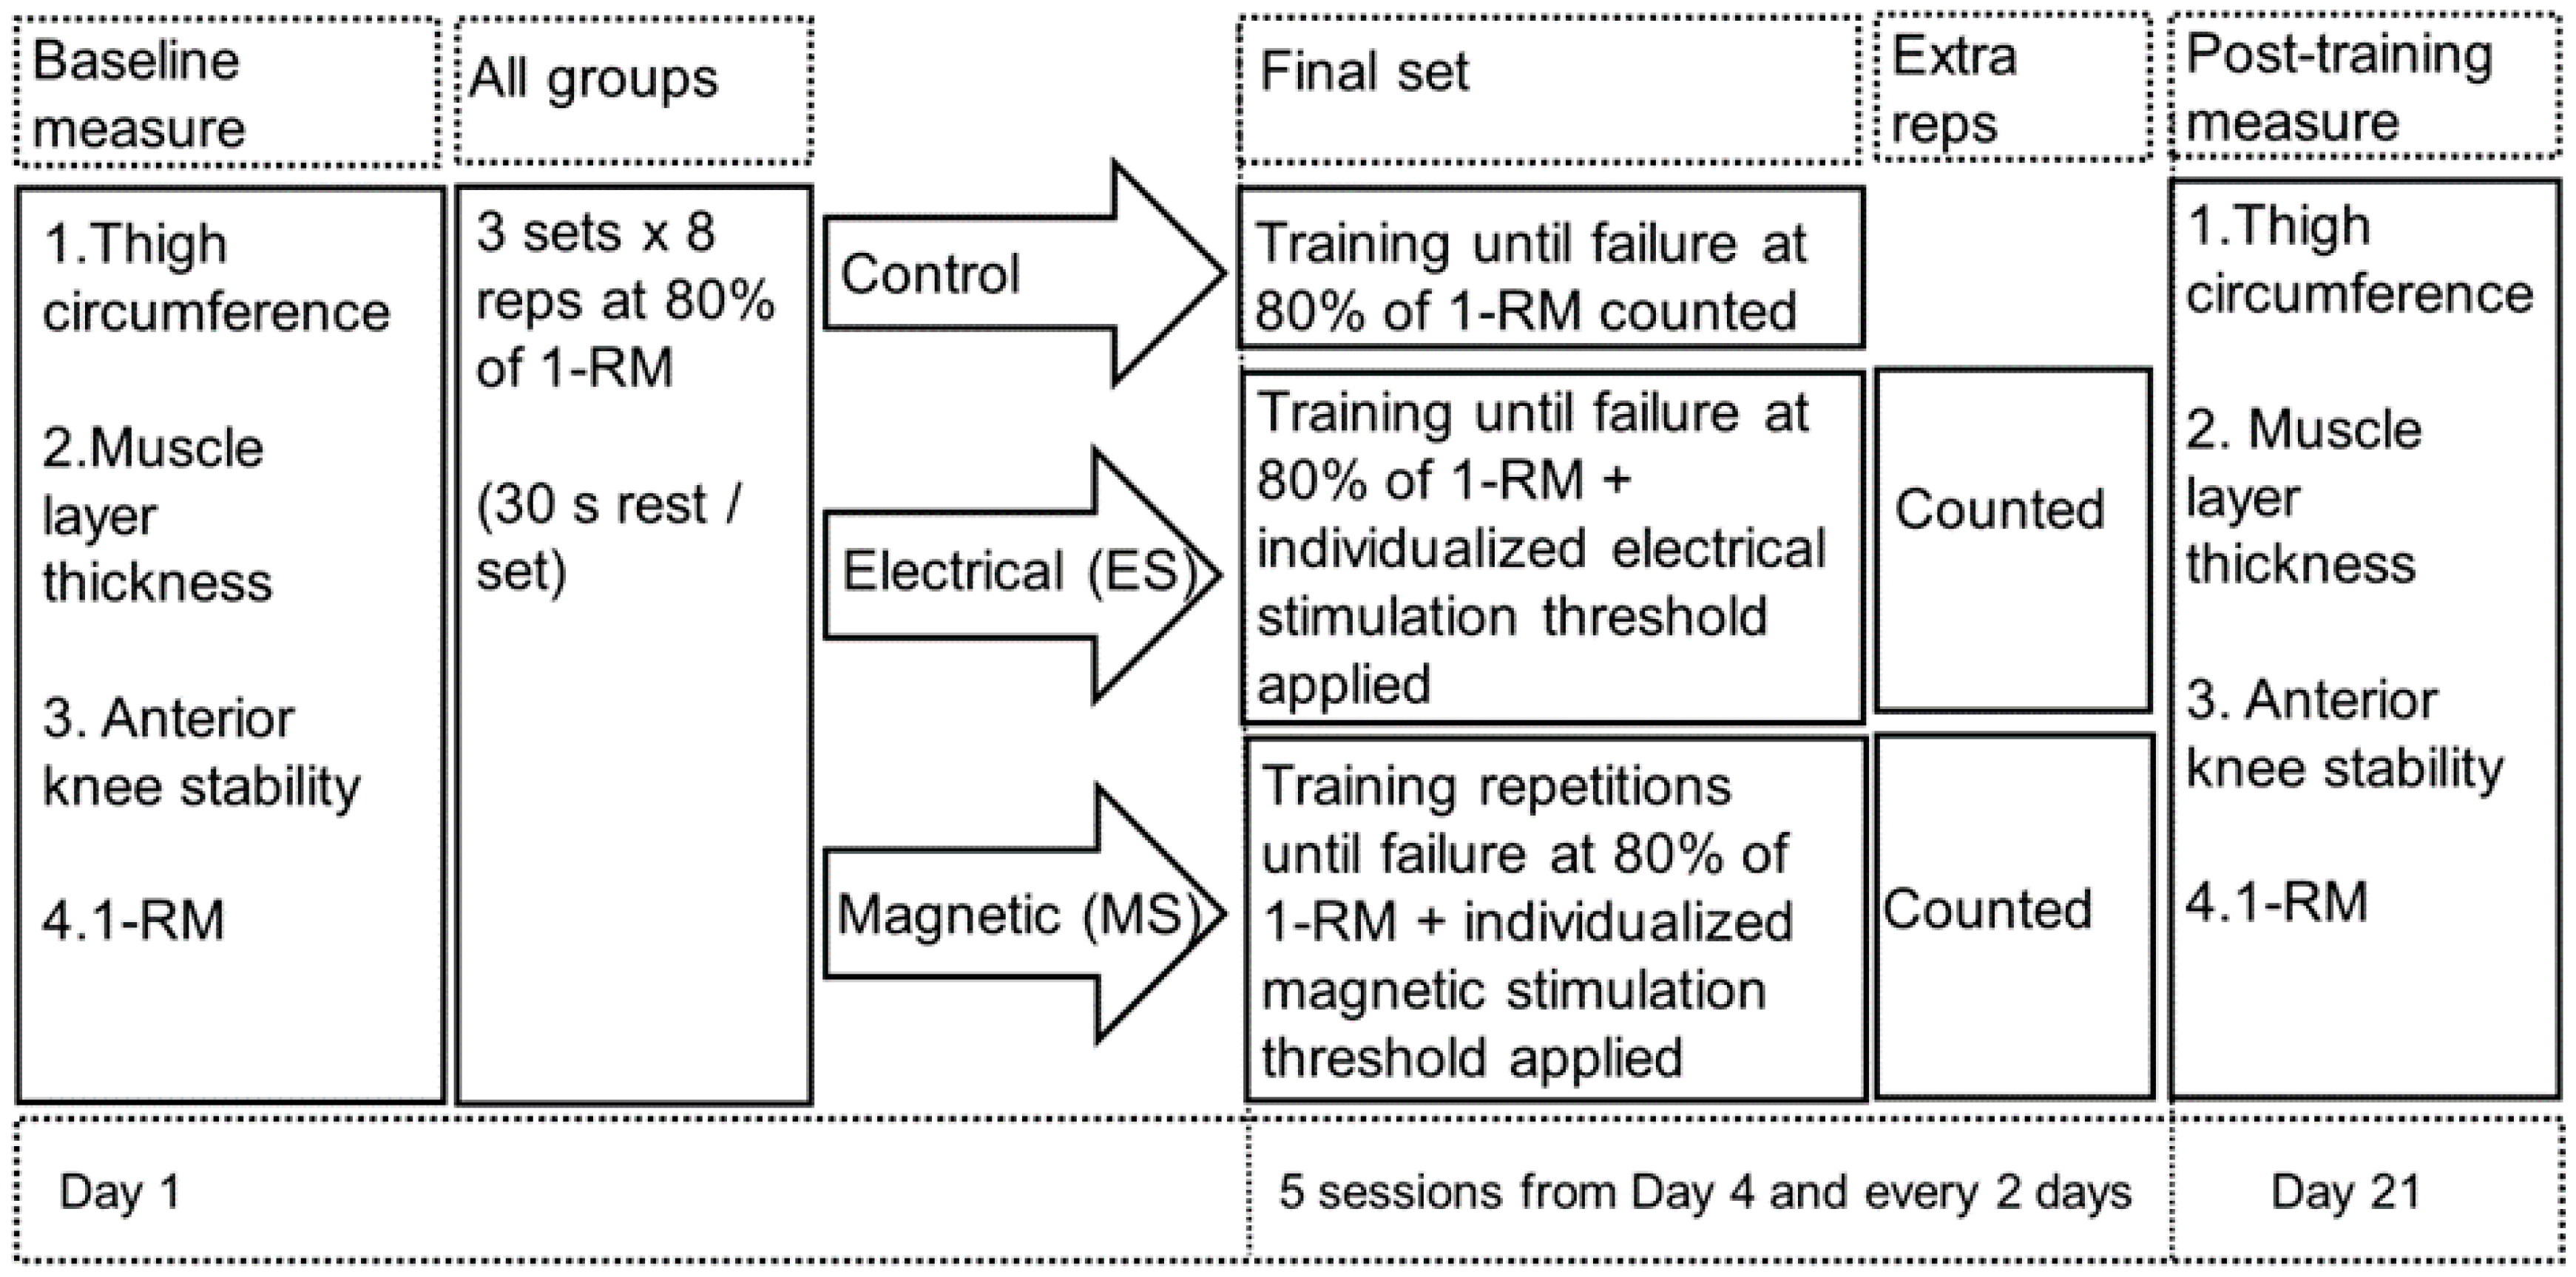
2.2. Study Design
2.3. Procedures
2.4. Assessment Methods
2.4.1. Thigh Circumference
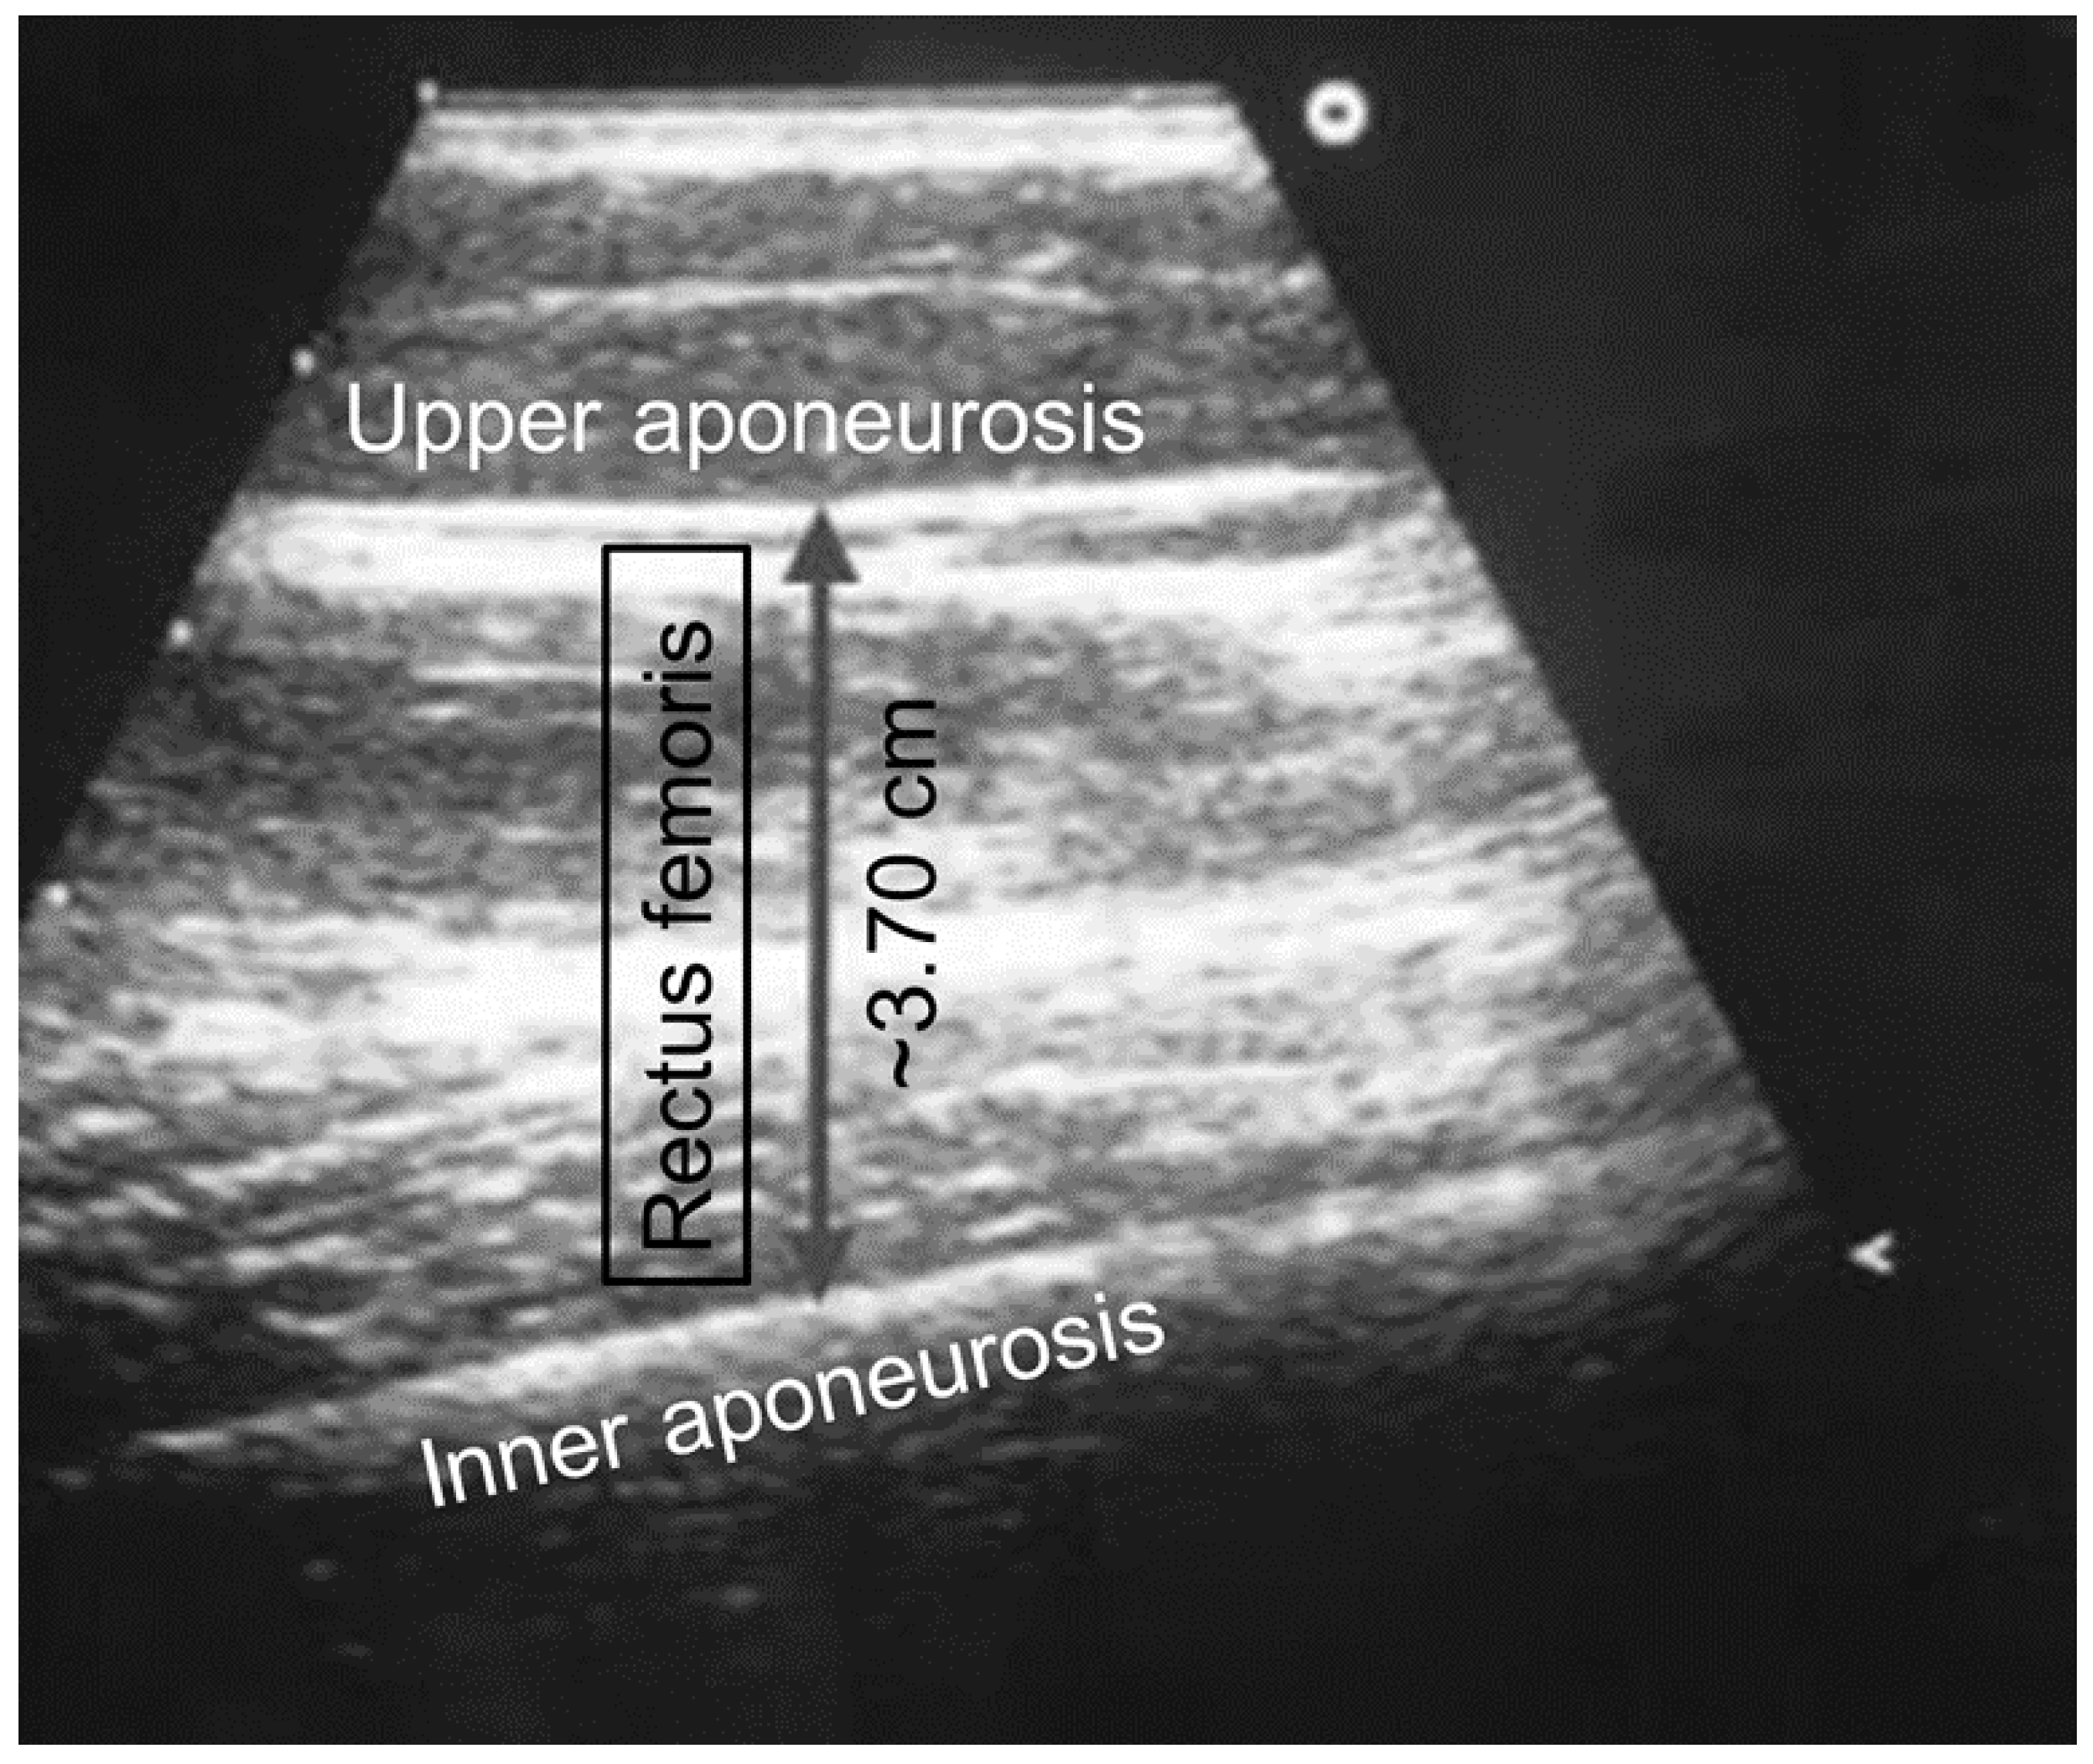
2.4.2. Muscle Layer Thickness
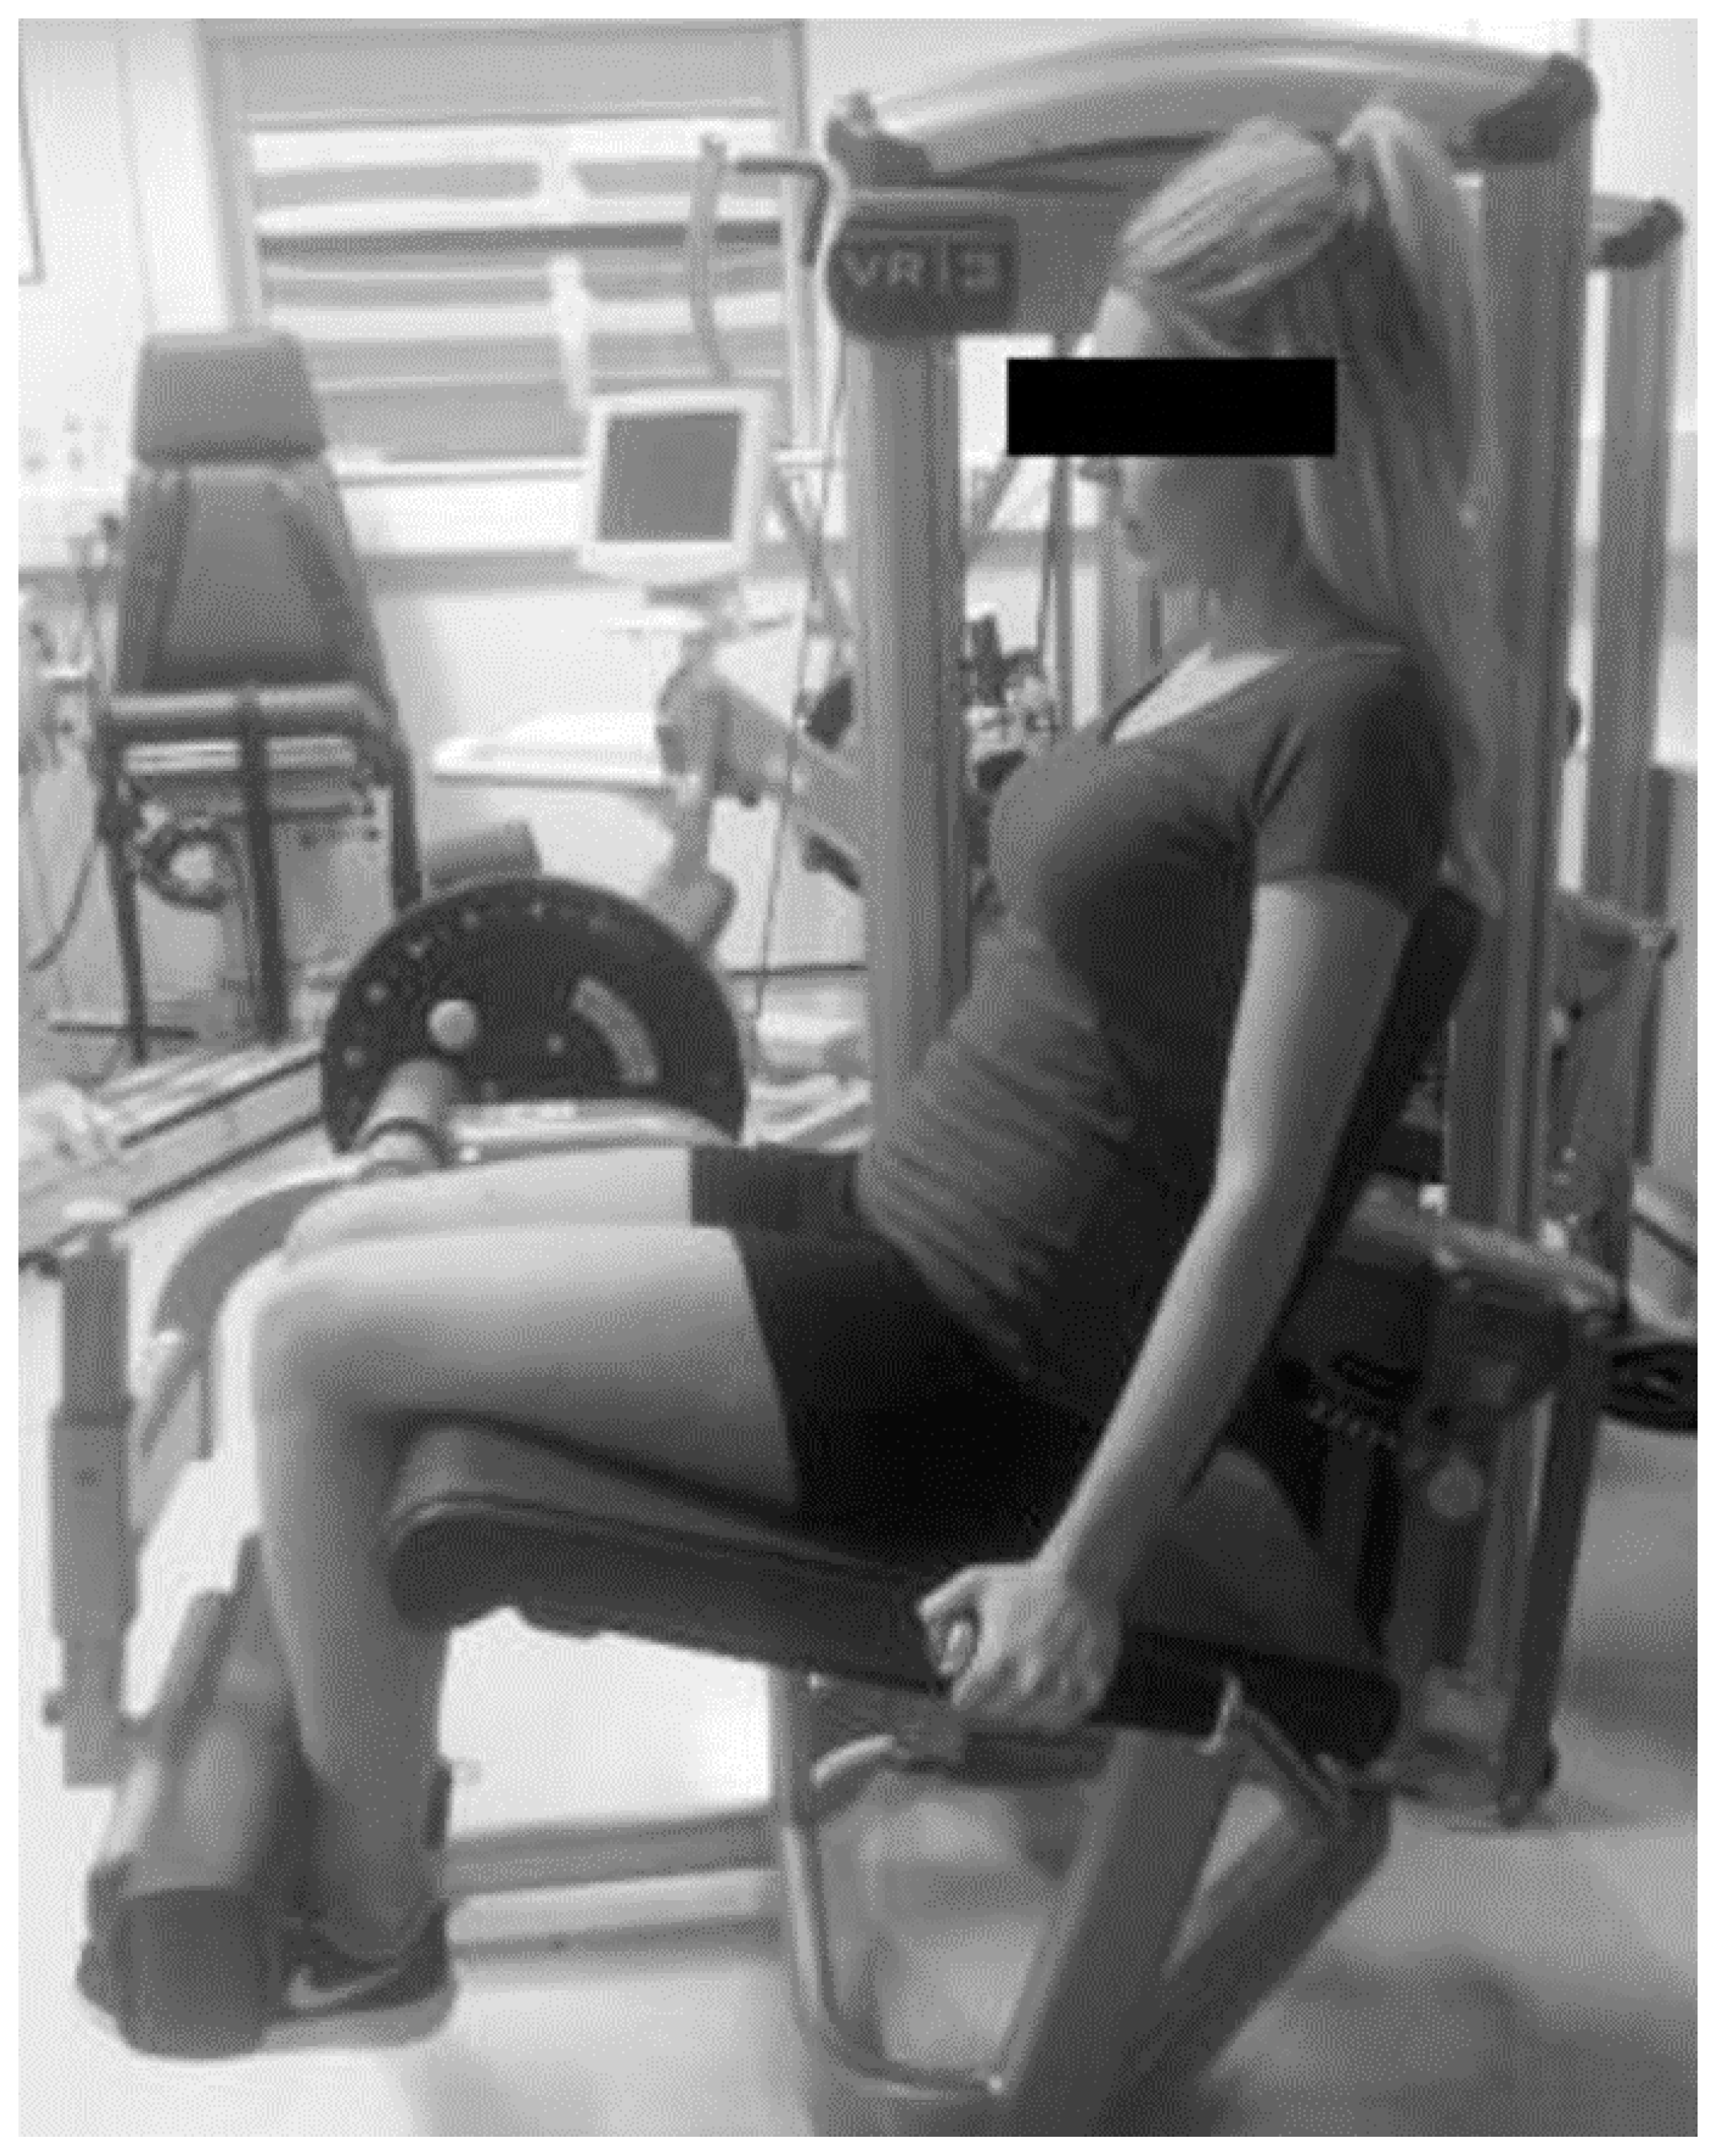
2.4.3. Maximal Leg Extension
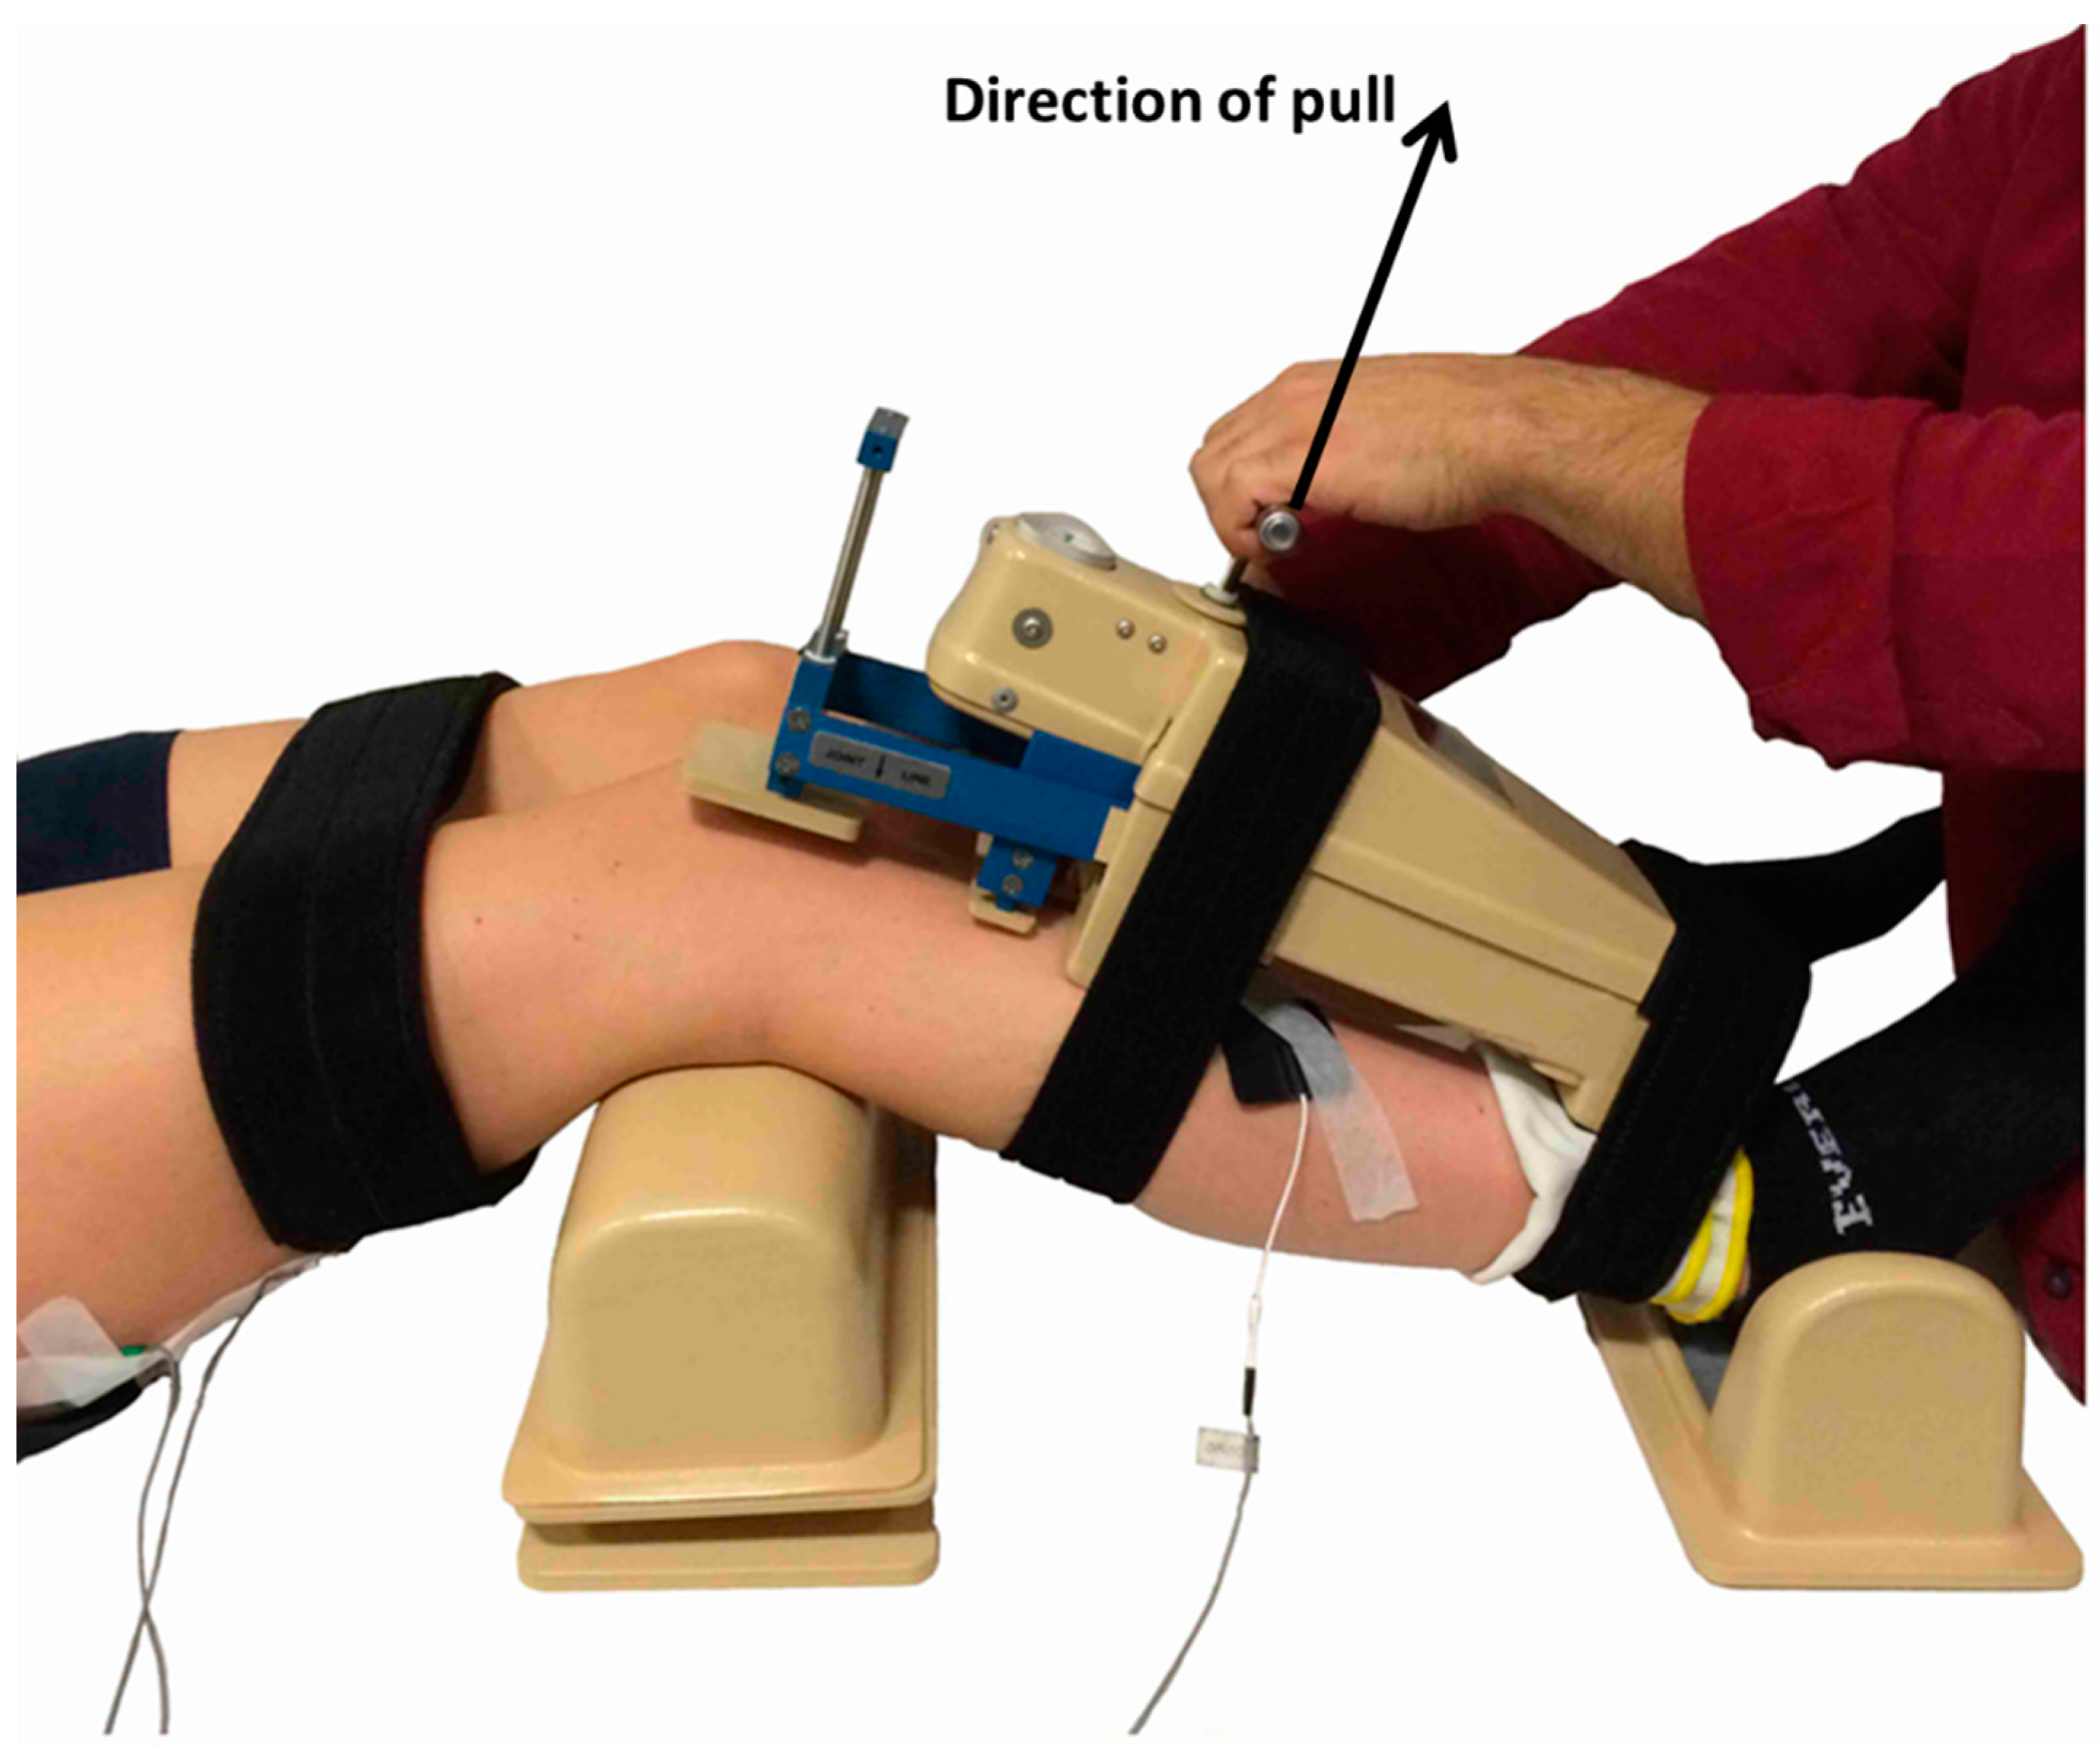
2.4.4. Knee Anterioposterior Laxity Test
2.5. Statistical Analysis
3. Results
4. Discussion
5. Conclusions
Acknowledgments
Author Contributions
Conflicts of Interest
References
- Szecsi, J.; Straube, A.; Fornusek, C. Comparison of the pedalling performance induced by magnetic and electrical stimulation cycle ergometry in able-bodied subjects. Med. Eng. Phys. 2014, 36, 484–489. [Google Scholar] [CrossRef] [PubMed]
- Laughman, R.K.; Youdas, J.W.; Garrett, T.R.; Chao, E.Y. Strength changes in the normal quadriceps femoris muscle as a result of electrical stimulation. Phys. Ther. 1983, 63, 494–499. [Google Scholar] [PubMed]
- Kubiak, R.J., Jr.; Whitman, K.M.; Johnston, R.M. Changes in quadriceps femoris muscle strength using isometric exercise versus electrical stimulation. J. Orthop. Sports Phys. Ther. 1987, 8, 537–541. [Google Scholar] [CrossRef] [PubMed]
- Kyung-Min Kim, T.C.; Jay, H.; Susan, S. Effects of neuromuscular electrical stimulation after anterior cruciate ligament reconstruction on quadriceps strength, function, and patient-oriented outcomes: A systematic review. J. Orthop. Sports Phys. Ther. 2010, 40, 383–391. [Google Scholar]
- Imoto, A.M.; Peccin, S.; Almeida, G.J.M.; Saconato, H.; Atallah, Á.N. Effectiveness of electrical stimulation on rehabilitation after ligament and meniscal injuries: A systematic review. Sao Paulo Med. J. 2011, 129, 414–423. [Google Scholar] [PubMed]
- Draper, V.; Ballard, L. Electrical stimulation versus electromyographic biofeedback in the recovery of quadriceps femoris muscle function following anterior cruciate ligament surgery. Phys. Ther. 1991, 71, 455–461. [Google Scholar] [PubMed]
- Taradaj, J.; Halski, T.; Kucharzewski, M.; Walewicz, K.; Smykla, A.; Ozon, M.; Slupska, L.; Dymarek, R.; Ptaszkowski, K.; Rajfur, J. The effect of neuromuscular electrical stimulation on quadriceps strength and knee function in professional soccer players: Return to sport after acl reconstruction. BioMed. Res. Int. 2013, 2013. [Google Scholar] [CrossRef] [PubMed]
- Barcellona, M.; Morrissey, M.; Milligan, P.; Clinton, M.; Amis, A. The effect of knee extensor open kinetic chain resistance training in the acl-injured knee. Knee Surg. Sports Traumatol. Arthrosc. 2015, 23, 3168–3177. [Google Scholar] [CrossRef] [PubMed]
- Millet, G.Y.; Bachasson, D.; Temesi, J.; Wuyam, B.; Féasson, L.; Vergès, S.; Lévy, P. Potential interests and limits of magnetic and electrical stimulation techniques to assess neuromuscular fatigue. Neuromuscul. Disord. 2012, 22 (Suppl. S3), S181–S186. [Google Scholar] [CrossRef] [PubMed]
- Howlett, O.A.; Lannin, N.A.; Ada, L.; McKinstry, C. Functional electrical stimulation improves activity after stroke: A systematic review with meta-analysis. Arch. Phys. Med. Rehabil. 2015, 96, 934–943. [Google Scholar] [CrossRef] [PubMed]
- Negm, A.; Lorbergs, A.; MacIntyre, N.J. Efficacy of low frequency pulsed subsensory threshold electrical stimulation vs. placebo on pain and physical function in people with knee osteoarthritis: Systematic review with meta-analysis. Osteoarthr. Cartil. 2013, 21, 1281–1289. [Google Scholar] [CrossRef] [PubMed]
- Hasan, S. Quadriceps femoris strength training: Effect of neuromuscular electrical stimulation vs. isometric exercise in osteoarthritis of knee. Indian J. Physiother. Occup. Ther. Int. J. 2015, 9, 129–134. [Google Scholar] [CrossRef]
- Abulhasan, J.F.; Snow, M.D.; Anley, C.M.; Bakhsh, M.M.; Grey, M.J. An extensive evaluation of different knee stability assessment measures: A systematic review. J. Funct. Morphol. Kinesiol. 2016, 1, 209–229. [Google Scholar] [CrossRef]
- Beretta-Piccoli, M.; Schneebeli, A.; Egloff, M.; Cescon, C.; Clijsen, R.; Togninalli, D.; Barbero, M. Myoelectric manifestations of fatigue after acl reconstruction: A cross-sectional study after postoperative rehabilitation. J. Funct. Morphol. Kinesiol. 2016, 1, 193–199. [Google Scholar] [CrossRef]
- Barcellona, M.; Morrissey, M.; Milligan, P.; Amis, A. The effect of thigh muscle activity on anterior knee laxity in the uninjured and anterior cruciate ligament-injured knee. Knee Surg. Sports Traumatol. Arthrosc. 2014, 22, 2821–2829. [Google Scholar] [CrossRef] [PubMed]
- Bax, L.; Staes, F.; Verhagen, A. Does neuromuscular electrical stimulation strengthen the quadriceps femoris? Sports Med. 2005, 35, 191–212. [Google Scholar] [CrossRef] [PubMed]
- Atzori, T.; Vettori, A.; Coli, C.; Gagliardi, E.; Innocenti Bruni, G.; Carrai, R.; Gigliotti, F.; Grippo, A. Muscle repetitive magnetic stimulation in the rehabilitation protocol: Assessment of feasibility and efficacy in normal subjects and in patients with muscle disease. Clin. Neurophysiol. 2013, 124, e205. [Google Scholar] [CrossRef]
- Kim, S.-B.; Kim, J.-Y.; Park, S.-W.; Lee, N.-R.; Kim, Y.-H.; Lee, K.-J.; Lee, Y.-H. Effects of pemfs (pulsed electromagnetic fields) stimulation on acupoint in quadriceps fatigue recovery. Int. J. Precis. Eng. Manuf. 2012, 13, 1697–1703. [Google Scholar] [CrossRef]
- Thakral, G.; Kim, P.J.; LaFontaine, J.; Menzies, R.; Najafi, B.; Lavery, L.A. Electrical stimulation as an adjunctive treatment of painful and sensory diabetic neuropathy. J. Diabetes Sci. Technol. 2013, 7, 1202–1209. [Google Scholar] [CrossRef] [PubMed]
- Doix, A.-C.M.; Matkowski, B.; Martin, A.; Roeleveld, K.; Colson, S.S. Effect of neuromuscular electrical stimulation intensity over the tibial nerve trunk on triceps surae muscle fatigue. Eur. J. Appl. Physiol. 2014, 114, 317–329. [Google Scholar] [CrossRef] [PubMed]
- Green, S.; Robinson, E.; Wallis, E. Assessment of calf muscle fatigue during submaximal exercise using transcranial magnetic stimulation versus transcutaneous motor nerve stimulation. Eur. J. Appl. Physiol. 2014, 114, 113–121. [Google Scholar] [CrossRef] [PubMed]
- McMaster, D.T.; Gill, N.; Cronin, J.; McGuigan, M. A brief review of strength and ballistic assessment methodologies in sport. Sports Med. 2014, 44, 603–623. [Google Scholar] [CrossRef] [PubMed]
- Peterson, M.D.; Rhea, M.R.; Alvar, B.A. Maximizing strength development in athletes: A meta-analysis to determine the dose-response relationship. J. Strength Cond. Res. 2004, 18, 377–382. [Google Scholar] [CrossRef] [PubMed]
- Thornton, M.K.; Potteiger, J.A. Effects of resistance exercise bouts of different intensities but equal work on epoc. Med. Sci. Sports Exerc. 2002, 34, 715–722. [Google Scholar] [CrossRef] [PubMed]
- Kong, T.Q.; Goldberger, J.J.; Parker, M.; Wang, T.; Kadish, A.H. Circadian variation in human ventricular refractoriness. Circulation 1995, 92, 1507–1516. [Google Scholar] [CrossRef] [PubMed]
- Coldwells, A.; Atkinson, G.; Reilly, T. Sources of variation in back and leg dynamometry. Ergonomics 1994, 37, 79–86. [Google Scholar] [CrossRef] [PubMed]
- Phillips, W.T.; Batterham, A.M.; Valenzuela, J.E.; Burkett, L.N. Reliability of maximal strength testing in older adults1. Arch. Phys. Med. Rehabil. 2004, 85, 329–334. [Google Scholar] [CrossRef] [PubMed]
- Levinger, I.; Goodman, C.; Hare, D.L.; Jerums, G.; Toia, D.; Selig, S. The reliability of the 1rm strength test for untrained middle-aged individuals. J. Sci. Med. Sport 2009, 12, 310–316. [Google Scholar] [CrossRef] [PubMed]
- Abdul-Hameed, U.; Rangra, P.; Shareef, M.Y.; Hussain, M.E. Reliability of 1-repetition maximum estimation for upper and lower body muscular strength measurement in untrained middle aged type 2 diabetic patients. Asian J. Sports Med. 2012, 3, 267–273. [Google Scholar] [CrossRef] [PubMed]
- Kraemer, W.J.; Fry, A.; Ratamess, N.; French, D. Strength testing: Development and evaluation of methodology. Physiol. Assess. Hum. Fit. 1995, 2, 119–150. [Google Scholar]
- Fleck, S.J.; Kraemer, W. Designing Resistance Training Programs, 4th ed.; Human Kinetics: Champaign, IL, USA, 2014. [Google Scholar]
- Ikai, M.; Steinhaus, A.H. Some factors modifying the expression of human strength. J. Appl. Physiol. 1961, 16, 157–163. [Google Scholar] [PubMed]
- Belanger, A.; McComas, A.T. Extent of motor unit activation during effort. J. Appl. Physiol. 1981, 51, 1131–1135. [Google Scholar] [PubMed]
- Cinar-Medeni, O.; Baltaci, G.; Bayramlar, K.; Yanmis, I. Core stability, knee muscle strength, and anterior translation are correlated with postural stability in anterior cruciate ligament-reconstructed patients. Am. J. Phys. Med. Rehabil. 2015, 94, 280–287. [Google Scholar] [CrossRef] [PubMed]
- Palmieri-Smith, R.M.; Lepley, L.K. Quadriceps strength asymmetry after anterior cruciate ligament reconstruction alters knee joint biomechanics and functional performance at time of return to activity. Am. J. Sports Med. 2015, 43, 1662–1669. [Google Scholar] [CrossRef] [PubMed]
- Gorgey, A.; Khalil, R. Neuromuscular electrical stimulation training increases intermuscular fascial length but not tendon cross-sectional area after spinal cord injury. Top. Spinal Cord Inj. Rehabil. 2015, 21, 87–92. [Google Scholar] [CrossRef] [PubMed]
- Sillen, M.J.H.; Franssen, F.M.E.; Gosker, H.R.; Wouters, E.F.M.; Spruit, M.A. Metabolic and structural changes in lower-limb skeletal muscle following neuromuscular electrical stimulation: A systematic review. PLoS ONE 2013, 8, e69391. [Google Scholar] [CrossRef] [PubMed]
- Hasegawa, S.; Kobayashi, M.; Arai, R.; Tamaki, A.; Nakamura, T.; Moritani, T. Effect of early implementation of electrical muscle stimulation to prevent muscle atrophy and weakness in patients after anterior cruciate ligament reconstruction. J. Electromyogr. Kinesiol. 2011, 21, 622–630. [Google Scholar] [CrossRef] [PubMed]
- Tremblay, A.; Després, J.P.; Leblanc, C.; Craig, C.L.; Ferris, B.; Stephens, T.; Bouchard, C. Effect of intensity of physical activity on body fatness and fat distribution. Am. J. Clin. Nutr. 1990, 51, 153–157. [Google Scholar] [PubMed]
- Billot, M.; Duclay, J.; Simoneau-buessinger, E.M.; Ballay, Y.; Martin, A. Is co-contraction responsible for the decline in maximal knee joint torque in older males? Age 2014, 36, 899–910. [Google Scholar] [CrossRef] [PubMed]
- Carolan, B.; Cafarelli, E. Adaptations in coactivation after isometric resistance training. J. Appl. Physiol. 1992, 73, 911–917. [Google Scholar] [PubMed]
- Brook, M.S.; Wilkinson, D.J.; Mitchell, W.K.; Lund, J.N.; Szewczyk, N.J.; Greenhaff, P.L.; Smith, K.; Atherton, P.J. Skeletal muscle hypertrophy adaptations predominate in the early stages of resistance exercise training, matching deuterium oxide-derived measures of muscle protein synthesis and mechanistic target of rapamycin complex 1 signaling. FASEB J. 2015, 29, 4485–4496. [Google Scholar] [CrossRef] [PubMed]
- Farup, J.; Kjølhede, T.; Sørensen, H.; Dalgas, U.; Møller, A.B.; Vestergaard, P.F.; Ringgaard, S.; Bojsen-Møller, J.; Vissing, K. Muscle morphological and strength adaptations to endurance vs. Resistance training. J. Strength Cond. Res. 2012, 26, 398–407. [Google Scholar] [CrossRef] [PubMed]
- Ribeiro, A.S.; Avelar, A.; Schoenfeld, B.J.; Fleck, S.J.; Souza, M.F.; Padilha, C.S.; Cyrino, E.S. Analysis of the training load during a hypertrophy-type resistance training programme in men and women. Eur. J. Sport Sci. 2015, 15, 256–264. [Google Scholar] [CrossRef] [PubMed]
- McBride, J.M.; Blaak, J.B.; Triplett-McBride, T. Effect of resistance exercise volume and complexity on emg, strength, and regional body composition. Eur. J. Appl. Physiol. 2003, 90, 626–632. [Google Scholar] [CrossRef] [PubMed]
- Viitasalo, J.; Saukkonen, S.; Komi, P. Reproducibility of measurements of selected neuromuscular performance variables in man. Electromyogr. Clin. Neurophysiol. 1979, 20, 487–501. [Google Scholar]
- Mitsiopoulos, N.; Baumgartner, R.; Heymsfield, S.; Lyons, W.; Gallagher, D.; Ross, R. Cadaver validation of skeletal muscle measurement by magnetic resonance imaging and computerized tomography. J. Appl. Physiol. 1998, 85, 115–122. [Google Scholar] [PubMed]
- Heymsfield, S.; Smith, R.; Aulet, M.; Bensen, B.; Lichtman, S.; Wang, J.; Pierson, R.N. Appendicular skeletal muscle mass: Measurement by dual-photon absorptiometry. Am. J. Clin. Nutr. 1990, 52, 214–218. [Google Scholar] [PubMed]
- Jacobson, J.A.; van Holsbeeck, M.T. Musculoskeletal ultrasonography. Orthop. Clin. N. Am. 1998, 29, 135–167. [Google Scholar] [CrossRef]
- Chhem, R.; Cardinal, E. Guidelines and Gamuts in Musculoskeletal Ultrasound; John Wiley & Sons: Hoboken, NJ, USA, 1999. [Google Scholar]
- De Maeseneer, M.; Marcelis, S.; Boulet, C.; Kichouh, M.; Shahabpour, M.; de Mey, J.; Cattrysse, E. Ultrasound of the knee with emphasis on the detailed anatomy of anterior, medial, and lateral structures. Skelet. Radiol. 2014, 43, 1025–1039. [Google Scholar] [CrossRef] [PubMed]
- Seynnes, O.R.; de Boer, M.; Narici, M.V. Early skeletal muscle hypertrophy and architectural changes in response to high-intensity resistance training. J. Appl. Physiol. 2007, 102, 368–373. [Google Scholar] [CrossRef] [PubMed]
- DeFreitas, J.M.; Beck, T.W.; Stock, M.S.; Dillon, M.A.; Kasishke, P.R. An examination of the time course of training-induced skeletal muscle hypertrophy. Eur. J. Appl. Physiol. 2011, 111, 2785–2790. [Google Scholar] [CrossRef] [PubMed]
- Heymsfield, S.; Wang, Z.; Baumgartner, R.N.; Ross, R. Human body composition: Advances in models and methods. Annu. Rev. Nutr. 1997, 17, 527–558. [Google Scholar] [CrossRef] [PubMed]
- Campos, G.E.; Luecke, T.J.; Wendeln, H.K.; Toma, K.; Hagerman, F.C.; Murray, T.F.; Ragg, K.E.; Ratamess, N.A.; Kraemer, W.J.; Staron, R.S. Muscular adaptations in response to three different resistance-training regimens: Specificity of repetition maximum training zones. Eur. J. Appl. Physiol. 2002, 88, 50–60. [Google Scholar] [CrossRef] [PubMed]
- Tsarouhas, A.; Giakas, G.; Malizos, K.N.; Spiropoulos, G.; Sideris, V.; Koutedakis, Y.; Hantes, M.E. Dynamic effect of quadriceps muscle activation on anterior tibial translation after single-bundle and double-bundle anterior cruciate ligament reconstruction. Arthrosc. J. Arthrosc. Relat. Surg. 2015, 31, 1303–1309. [Google Scholar] [CrossRef] [PubMed]
- Stojanovic, M.D.; Ostojic, S.M. Preventing acl injuries in team-sport athletes: A systematic review of training interventions. Res. Sports Med. 2012, 20, 223–238. [Google Scholar] [PubMed]
- Herring, B. Responsive Kinetic Training Positively Increases Knee Joint Stability. Honors Thesis, The College at Brockport, Brockport, NY, USA, 5 September 2015. [Google Scholar]
- Häkkinen, K.; Kraemer, W.J.; Newton, R.U.; Alen, M.; Häkkinen, M.; Kraemer, M.; Newton, M. Changes in electromyographic activity, muscle fibre and force production characteristics during heavy resistance/power strength training in middle-aged and older men and women. Acta Physiol. Scand. 2001, 171, 51–62. [Google Scholar] [CrossRef] [PubMed]
- Markolf, K.L.; Graff-Radford, A.; Amstutz, H. In vivo knee stability. A quantitative assessment using an instrumented clinical testing apparatus. J. Bone Jt. Surg. Am. 1978, 60, 664–674. [Google Scholar] [PubMed]
- Iversen, B.F.; Stürup, J.; Jacobsen, K.; Andersen, J. Implications of muscular defense in testing for the anterior drawer sign in the knee a stress radiographic investigation. Am. J. Sports Med. 1989, 17, 409–413. [Google Scholar] [CrossRef] [PubMed]
- Daniel, D.M.; Malcom, L.L.; Losse, G.; Stone, M.L.; Sachs, R.; Burks, R. Instrumented measurement of anterior laxity of the knee. J. Bone Jt. Surg. Am. 1985, 67, 720–726. [Google Scholar] [PubMed]
- Ekstrand, J.; Hägglund, M.; Waldén, M. Injury incidence and injury patterns in professional football: The uefa injury study. Br. J. Sports Med. 2011, 45, 553–558. [Google Scholar] [CrossRef] [PubMed]
- Prodromos, C.C.; Han, Y.; Rogowski, J.; Joyce, B.; Shi, K. A meta-analysis of the incidence of anterior cruciate ligament tears as a function of gender, sport, and a knee injury–reduction regimen. Arthroscopy 2007, 23, 1320–1325. [Google Scholar] [CrossRef] [PubMed]
- Roi, G.S.; Nanni, G.; Tavana, R.; Tencone, F. Prevalence of anterior cruciate ligament reconstructions in professional soccer players. Sport Sci. Health 2006, 1, 118–121. [Google Scholar] [CrossRef]
- Waldén, M.; Hägglund, M.; Werner, J.; Ekstrand, J. The epidemiology of anterior cruciate ligament injury in football (soccer): A review of the literature from a gender-related perspective. Knee Surg. Sports Traumatol. Arthrosc. 2011, 19, 3–10. [Google Scholar] [CrossRef] [PubMed]


© 2016 by the authors; licensee MDPI, Basel, Switzerland. This article is an open access article distributed under the terms and conditions of the Creative Commons Attribution (CC-BY) license (http://creativecommons.org/licenses/by/4.0/).
Share and Cite
Abulhasan, J.F.; Rumble, Y.L.D.; Morgan, E.R.; Slatter, W.H.; Grey, M.J. Peripheral Electrical and Magnetic Stimulation to Augment Resistance Training. J. Funct. Morphol. Kinesiol. 2016, 1, 328-342. https://doi.org/10.3390/jfmk1030328
Abulhasan JF, Rumble YLD, Morgan ER, Slatter WH, Grey MJ. Peripheral Electrical and Magnetic Stimulation to Augment Resistance Training. Journal of Functional Morphology and Kinesiology. 2016; 1(3):328-342. https://doi.org/10.3390/jfmk1030328
Chicago/Turabian StyleAbulhasan, Jawad F., Yvonne L. D. Rumble, Emma R. Morgan, William H. Slatter, and Michael J. Grey. 2016. "Peripheral Electrical and Magnetic Stimulation to Augment Resistance Training" Journal of Functional Morphology and Kinesiology 1, no. 3: 328-342. https://doi.org/10.3390/jfmk1030328
APA StyleAbulhasan, J. F., Rumble, Y. L. D., Morgan, E. R., Slatter, W. H., & Grey, M. J. (2016). Peripheral Electrical and Magnetic Stimulation to Augment Resistance Training. Journal of Functional Morphology and Kinesiology, 1(3), 328-342. https://doi.org/10.3390/jfmk1030328