Protection of Service-Oriented Environments Serving Critical Infrastructures


Department of Digital Systems, University of Piraeus, Karaoli & Dimitriou 80, 18534 Piraeus, Greece
Inventions 2018, 3(3), 62; https://doi.org/10.3390/inventions3030062
Submission received: 26 July 2018
/
Revised: 20 August 2018
/
Accepted: 23 August 2018
/
Published: 30 August 2018
(This article belongs to the Special Issue Innovation in Machine Intelligence for Critical Infrastructures)
Abstract
:The emergence of service-oriented architectures has driven the shift towards a service-oriented paradigm, which has been adopted in several application domains. The advent of cloud computing facilities and recently of edge computing environments has increased the aforementioned paradigm shift towards service provisioning. In this context, various “traditional” critical infrastructure components have turned to services, being deployed and managed on top of cloud and edge computing infrastructures. However, the latter poses a specific challenge: the services of the critical infrastructures within and across application verticals/domains (e.g., transportation, health, industrial venues, etc.) need to be continuously available with near-zero downtime. In this context, this paper presents an approach for high-performance monitoring and failure detection of critical infrastructure services that are deployed in virtualized environments. The failure detection framework consists of distributed agents (i.e., monitoring services) to ensure timely collection of monitoring data, while it is enhanced with a voting algorithm to minimize the case of false positives. The goal of the proposed approach is to detect failures in datacenters that support critical infrastructures by targeting both the acquisition of monitoring data in a performant way and the minimization of false positives in terms of potential failure detection. The specific approach is the baseline towards decision making and triggering of actions in runtime to ensure service high availability, given that it provides the required data for decision making on time with high accuracy.
1. Introduction
Ensuring continuity in the face of infrastructure failures has been a constant and resource-consuming challenge in the Information and Communication Technologies (ICT) industry. In the last decade, the evolution of demand for computing services, and of the methods for supplying those services, has highlighted an increasing significance of addressing this challenge. The convergence of advanced network, cloud and Internet of Things (IoT) environments is creating significant opportunities for more efficient operation of critical infrastructures. An archetypical IoT system collects data from sensors and/or users, which is stored and analyzed (often at a remote data center), and the results used to support or automate operational management decisions. IoT architectures are also increasingly based on the use of standard protocols and reusable software and hardware components, reducing costs and making it easy to connect them over existing networks including the Internet. Supervisory Control and Data Acquisition (SCADA) and other Industrial Automation and Control Systems (IACS) are increasingly built using or embedded into IoT architectures, benefiting from these technical innovations and maximizing the value extracted from data. At the core of such architectures and environments are cloud computing infrastructures, which serve as a backbone for hosting critical infrastructure services and data obtained from IoT/sensor devices in critical infrastructures. However, this revolution comes with a dark side. The distributed nature of such environments (including sensors and devices in critical infrastructures, gateways, edge nodes, and virtualized cloud resources) raises challenges regarding the dependability and availability of these combined systems. Therefore, following the growing trend for services to become global, critical infrastructures pose the need for their deployed services to be available 24/7 (and thus leaving almost no room for the associated downtime). The latter is further stressed since as operations become more streamlined, critical infrastructures increasingly depend on ICT components. This dependency increases risk to critical infrastructures in two ways:
- ICT risks: any compromise in the availability or integrity of information systems and data may lead to serious disruption in the dependent infrastructure; and
- ICT risk amplification: any problem in part of the infrastructure that invalidates previously acquired data may impact other parts of the infrastructure the operation of which is managed using that data.
These risks arising from inter-dependency present a major challenge. An overall approach to risk management is well established, and is based on the Denning cycle. However, standard approaches to identify risks address ICT and non-ICT cases separately and provide little support on how to deal with interdependency within and between ICT and non-ICT systems. This gap in methodology was recognized and highlighted by the European Commission (EC) [1], and may result in an incomplete analysis of risks, due to a lack of knowledge of the “cascading” effects. This makes it difficult to design risk mitigation strategies, or to recognize which threats are the root causes of problems when they arise.
Recent reports show that these concerns have not been addressed. The United Nations Office for Disaster Risk Reduction (UNISDR) concluded that the previous years raised several challenges for critical infrastructures [2], with availability issues being in the news on a regular basis, and vulnerabilities (some over 10 years old) exploited on a massive scale, yet nearly half of all incidents were still caused by human error. Hewlett Packard (HP) found that 20% of security operations centers failed to provide even minimum availability monitoring capabilities to their organizations [3], and that IoT devices are especially prone to misconfiguration [4]. The Ponemon Institute [5] reported that while critical infrastructure enterprises recognize the need for dependability and availability, over 50% of those surveyed had only one or two dedicated staff, and over 50% admitted to having insufficient or no awareness of potential vulnerabilities that would cause services to become unavailable.
In this paper, a key enabler for availability and dependability risks and threats is presented: a high-performance failure detection framework. The framework actually represents a distributed monitoring mechanism that deploys a set of distributed agents (as “watchdogs”) to obtain information for the status and the health of the underlying ICT environments supporting the critical infrastructures. The framework is enhanced with a voting algorithm in order to deal with cases of false positives, when for example a deployed service (in a virtual machine or container) is not responding but which could be because of a temporary network failure and not because of a fail in the specific virtual machine/container or in the service deployed in it.
The remainder of the paper is structured as follows: Section 2 presents related work in the area under investigation, including also aspects of how threats are identified in IoT environments (as representative environments in critical infrastructures that include deployed sensors) as well as aspects of distributed systems in industrial automation (as key architectures adapted by various critical infrastructures). Section 3 presents the proposed approach including its specification as well as implementation details, while Section 4 presents evaluation results. The paper concludes in Section 5 with a discussion on the potential of the current work and future research items.
2. Related Work
Availability and dependability of critical infrastructures is a subject of intensive research in different domains, spanning from IoT environments to cloud and edge computing. Many papers have been produced that identify specific IoT threats alongside a novel (but not yet standard) solution. General IoT security threats have been covered in Reference [6], sources of threats and potential attacks in Reference [6], and threats and countermeasures in wireless sensor networks and Radio-frequency identification (RFID) systems in Reference [7]. Lists of threats and open challenges in building dependable IoT systems have been discussed by the authors in References [8,9], including traffic analysis, data mining, intruder models, denial of service, physical attacks and eavesdropping, while Reference [10,11] provides a similar list focusing on threats to privacy. There has been little advancement in the production of reusable dependability and availability model assets and tools that can be leveraged in the development lifecycle of IoT systems in the scope of critical infrastructures to ensure high-availability and/or runtime identification of potential threats and failures. An interesting approach has been proposed by Aman and Snekkenes [12], who produced a model of events for IoT systems with a view to associating events with rules to determine at run time the level of risk and the appropriate responses. In the domain of IoT, standards are still emerging, and given that it is still the subject of new research, it is not surprising that they provide less comprehensive coverage of dependability. IoT-A is a reference architecture described by Bauer et al. [13], that provides a set of common best practices for the development of IoT systems. Architectures of new systems can be evaluated to comply with these best practices (meta-architecture) before they are concretely realized. IoT-A includes cross-cutting dependability features (e.g., self-healing) but without specifying solutions. IoT-A has also performed a risk analysis and identified several threats to IoT-A compliant systems [14]. The latest and most comprehensive standard for interoperable implementation is OneM2M [15], ensuring cross domain exchange of information via common interface and data formats. Alongside the basic service architecture and protocol specifications is an availability specification that includes a set of services to be integrated into OneM2M. As in IoT-A, there is also a white paper [16] which provides a list of 22 threats and 25 countermeasures. These are broadly similar to the set identified by the IoT-A analysis, and include general threats found in research papers (e.g., failures in devices) but miss many of the physical threats. On the other hand, OneM2M does consider a number of threats that are specific to the OneM2M architectures (e.g., compromised keys discovered on devices that could lead to availability failures). OneM2M approach is comprehensive and addresses many threats; however, the standard is complex and does not fully describe how to easily integrate the solutions into the base standard or how to adopt and adapt it for critical infrastructures. There are no tools or methodologies available to assess compliance; furthermore, there has been no effort to advance integration.
Regarding high-availability and dependability, these have been addressed also in the scope of intrusion detection systems (IDS). Such systems are traditionally classified on the basis of recognized events and the methodology used for identification of incidents [17]. IDSs are usually classified as network-based (NIDS) or host-based (HIDS). NIDS monitors the traffic in particular network segments and examines the activities of network and application layer protocols in order to identify potential dependability vulnerabilities. HIDS monitors features of a particular host and its events with the objective to detect incidents. Basic methodologies for incidents detection comprise signature-based detection, anomaly-based detection and stateful protocol analysis [18]. Signature-based detection techniques compare monitored events with patterns that correspond to known threats (signatures) to identify possible incidents. These methods are very efficient in detection of known threats, but completely inefficient when new or unknown threats or modified attacks appear. Anomaly-based detection techniques compare monitored events with the list of activities, which have been predefined as normal to identify significant deviations. IDS creates static or dynamic models (profiles) representing normal behavior of users, hosts, network connections, and applications. According to the nature of processing involved in the behavioral model, anomaly-based techniques can be classified into three main categories: statistical-based, knowledge-based, and machine learning-based [19]. Statistical-based techniques use statistical properties and tests to determine whether the observed behavior deviates significantly from the expected behavior using univariate, multivariate and time-series modelling methods. Knowledge-based techniques try to capture the claimed behavior from the available system data using finite automata, description languages and expert systems. Machine learning-based techniques establish an explicit or implicit model that allows classification of analyzed patterns using Bayesian networks, Markov models, neural network, and a range of clustering and outlier detection algorithms. The main advantage of anomaly-based techniques refers to efficient detection of unknown threats, which could result to failures in the critical infrastructure. However, erroneous inclusion of malicious activities in profiles is a typical problem of these techniques. Another issue concerns accuracy of generated profiles and appears as a consequence of complex activities in the network. Attempts have been made to define classification trees for IDSs that are used in cyber physical and other control systems, in order to facilitate systematization of the existing detection techniques [19,20]. Both approaches distinguish knowledge-based and behavioral-based techniques as the two main categories of real-time intrusion detection techniques.
The main approaches to digital decentralized control of manufacturing systems and critical infrastructures have focused on the deployment of intelligent agents [21,22] and Service-Oriented Architecture (SOA) technologies. Decentralized control architectures are more scalable in the handling of large amounts of sensor and process data, and are expected to be increasingly deployed as manufacturing systems increase in scale and complexity, facilitating also plug and play connectivity [23]. Regarding the former (i.e., intelligent agents and multi-agent systems), these are deployed in cases of industrial applications that are subject to time-criticality and high robustness requirements [24] or even require fast local reconfiguration and solutions to complex problems (e.g., dynamic production scheduling) [25]. Agent based approaches can be classified into [26]: (i) Functional decomposition approaches, where agents correspond to functional modules that are assigned to manufacturing or enterprise processes (e.g., planning, scheduling, handling of materials, product distribution), and (ii) Physical decomposition approaches, where agents are used to represent entities in the physical world (e.g., machines, tools, cells, products, parts, features, operations).
The second approach to digital decentralized control utilizes SOA technologies to interconnect services in an agile way and overcome the limitations of initiatives such as UPnP (Universal Plug and Play) [27]. A number of European-funded projects have also emphasized on the interworking between device level components (such as PLCs), including SIRENA [28], SODA [29], SOA4D [30] and SOCRADES [31]. Several SOA implementations have focused on the implementation of execution environments for Functional Block Instances (FBI) [32], including functional blocks compliant to the IEC 61499 standard, which defines an architecture and guidelines for the use of function blocks in distributed Industrial-Process Measurement and Control Systems (IPMCSs) [33,34]. Nevertheless, SOA approaches to decentralized industrial control suffer from performance constraints, especially when it comes to dealing with real-time control functions [35]. Current approaches on edge computing architectures permit the deployment of execution logic at the edges of the critical infrastructures network. These approaches distribute the production logic across multiple machines, while at the same time exploiting the scalability and capacity characteristics of edge and cloud computing environments. Furthermore, these critical infrastructure services are deployed across multiple machines and their controlling edge servers in order to benefit from the container concept of edge computing. However, a key issue is how to identify potential threats and detect failures in such distributed environments given that there might be several reasons for the failure, which need to be identified in real-time with high accuracy, thus eliminating cases of false positives. The distributed nature of the environments poses an additional challenge on where the corresponding monitoring mechanisms need to be deployed and how the information will be communicated and aggregated in order to reach accurate decisions on time.
3. Proposed Approach
3.1. Overview
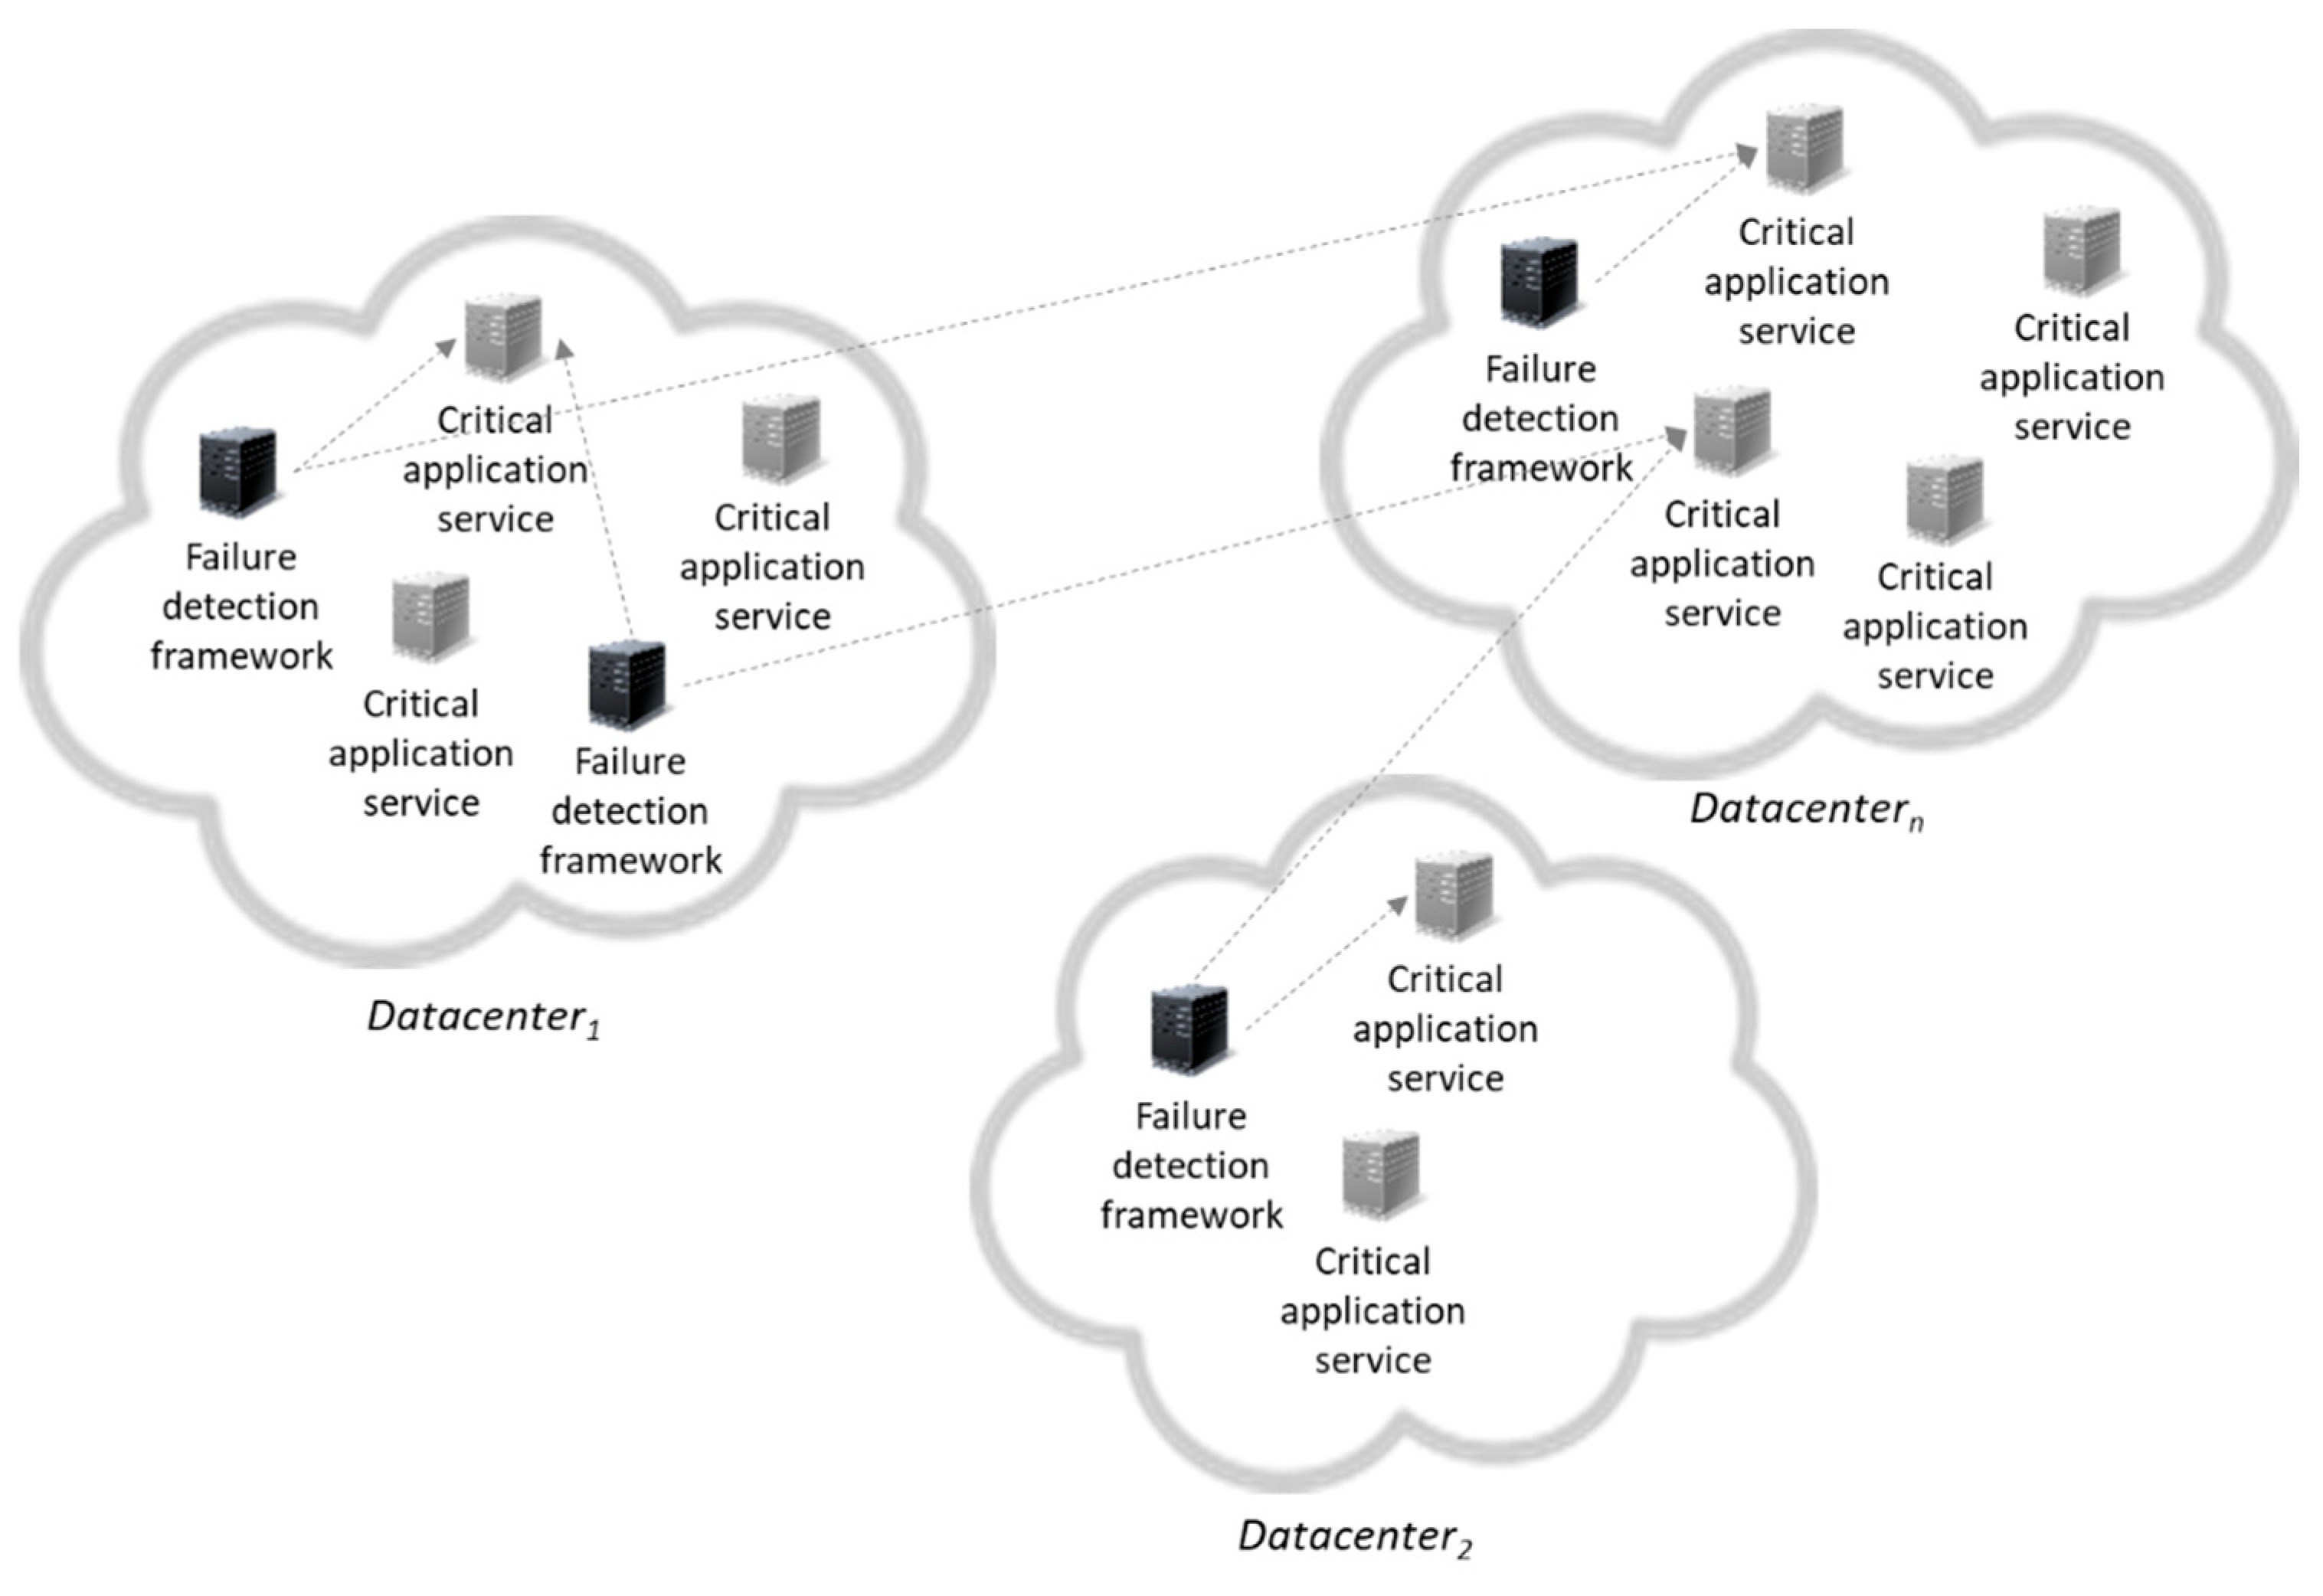
The proposed approach aims at addressing the aforementioned gap by enabling the timely and accurate identification of failures in datacenters—physical machines or virtual machines (VMs)—providing the backbone of critical infrastructures. In this context, two cases/scenarios need to be tackled, as shown in Figure 1: whole datacenter failure or a VM failure within a datacenter, while the rest of the datacenter is still up and running. In the first scenario a whole datacenter fails due to a security vulnerability, due to a network connectivity issue or even for physical reasons. In this significant case the detection can be accomplished using a set of servers (physical ones or VMs) as representatives of the datacenter. One should take into consideration that in the server failure scenario, the indicator should not consume significant resources because the server can also be used to launch users’ VMs. In the second case (i.e., VM case), a VM can migrate and intermittent short failures of connectivity (usually detected as time outs) can occur, which are not indicative of a failure—these are cases of false positives that need to be avoided. Moreover, the set of indicators (i.e., the servers described above) is not fixed in time. Indicators are created, destroyed or can fail (by assuming a fail-stop model).
Before describing the solution, some useful terminology is provided:
- Datacenter: A collection of servers collectively residing in a discrete subnet. Each datacenter is identified through a datacenter identifier, which is for the purposes of the failure detection software an integer in the Go programming language implementation. A datacenter has a pool of private IP addresses.
- Indicator: The server software that resides in a VM or a physical server and can be pinged through Internet Control Message Protocol (ICMP) messages in order to assess its status and health. An indicator is represented by an additional IPv4 address externalized by the data center.
- Datacenter Ping: A UDP ping (unidirectional) message from an indicator in a data center to an indicator in a different datacenter.
- Datacenter Opinion: A Remote Procedure Call (RPC) from an indicator in a datacenter towards another indicator in the same datacenter asking for the other indicator’s opinion on the availability of the target data center.
- Datacenter Disaster: The event when no indicator in a datacenter can be pinged through its externalized IP address.
- Datacenter Pinger: An indicator in one data center that pings all the indicators in another data center. The Pinger implements the approach of distributed agents, given that Pingers are deployed in different datacenters and assess the health status within and across datacenters.
- Partner Voter: An indicator in the same datacenter as this indicator (acting as a voter).
- Protector Database: A distributed database containing inter-datacenter indicator information. It also acts as a distributed state lock that indicators use periodically to update information. It also contains a ping routing table as a list of pairs (between different data centers). Left members of the pair cannot appear in more than one pair in the proposed approach.
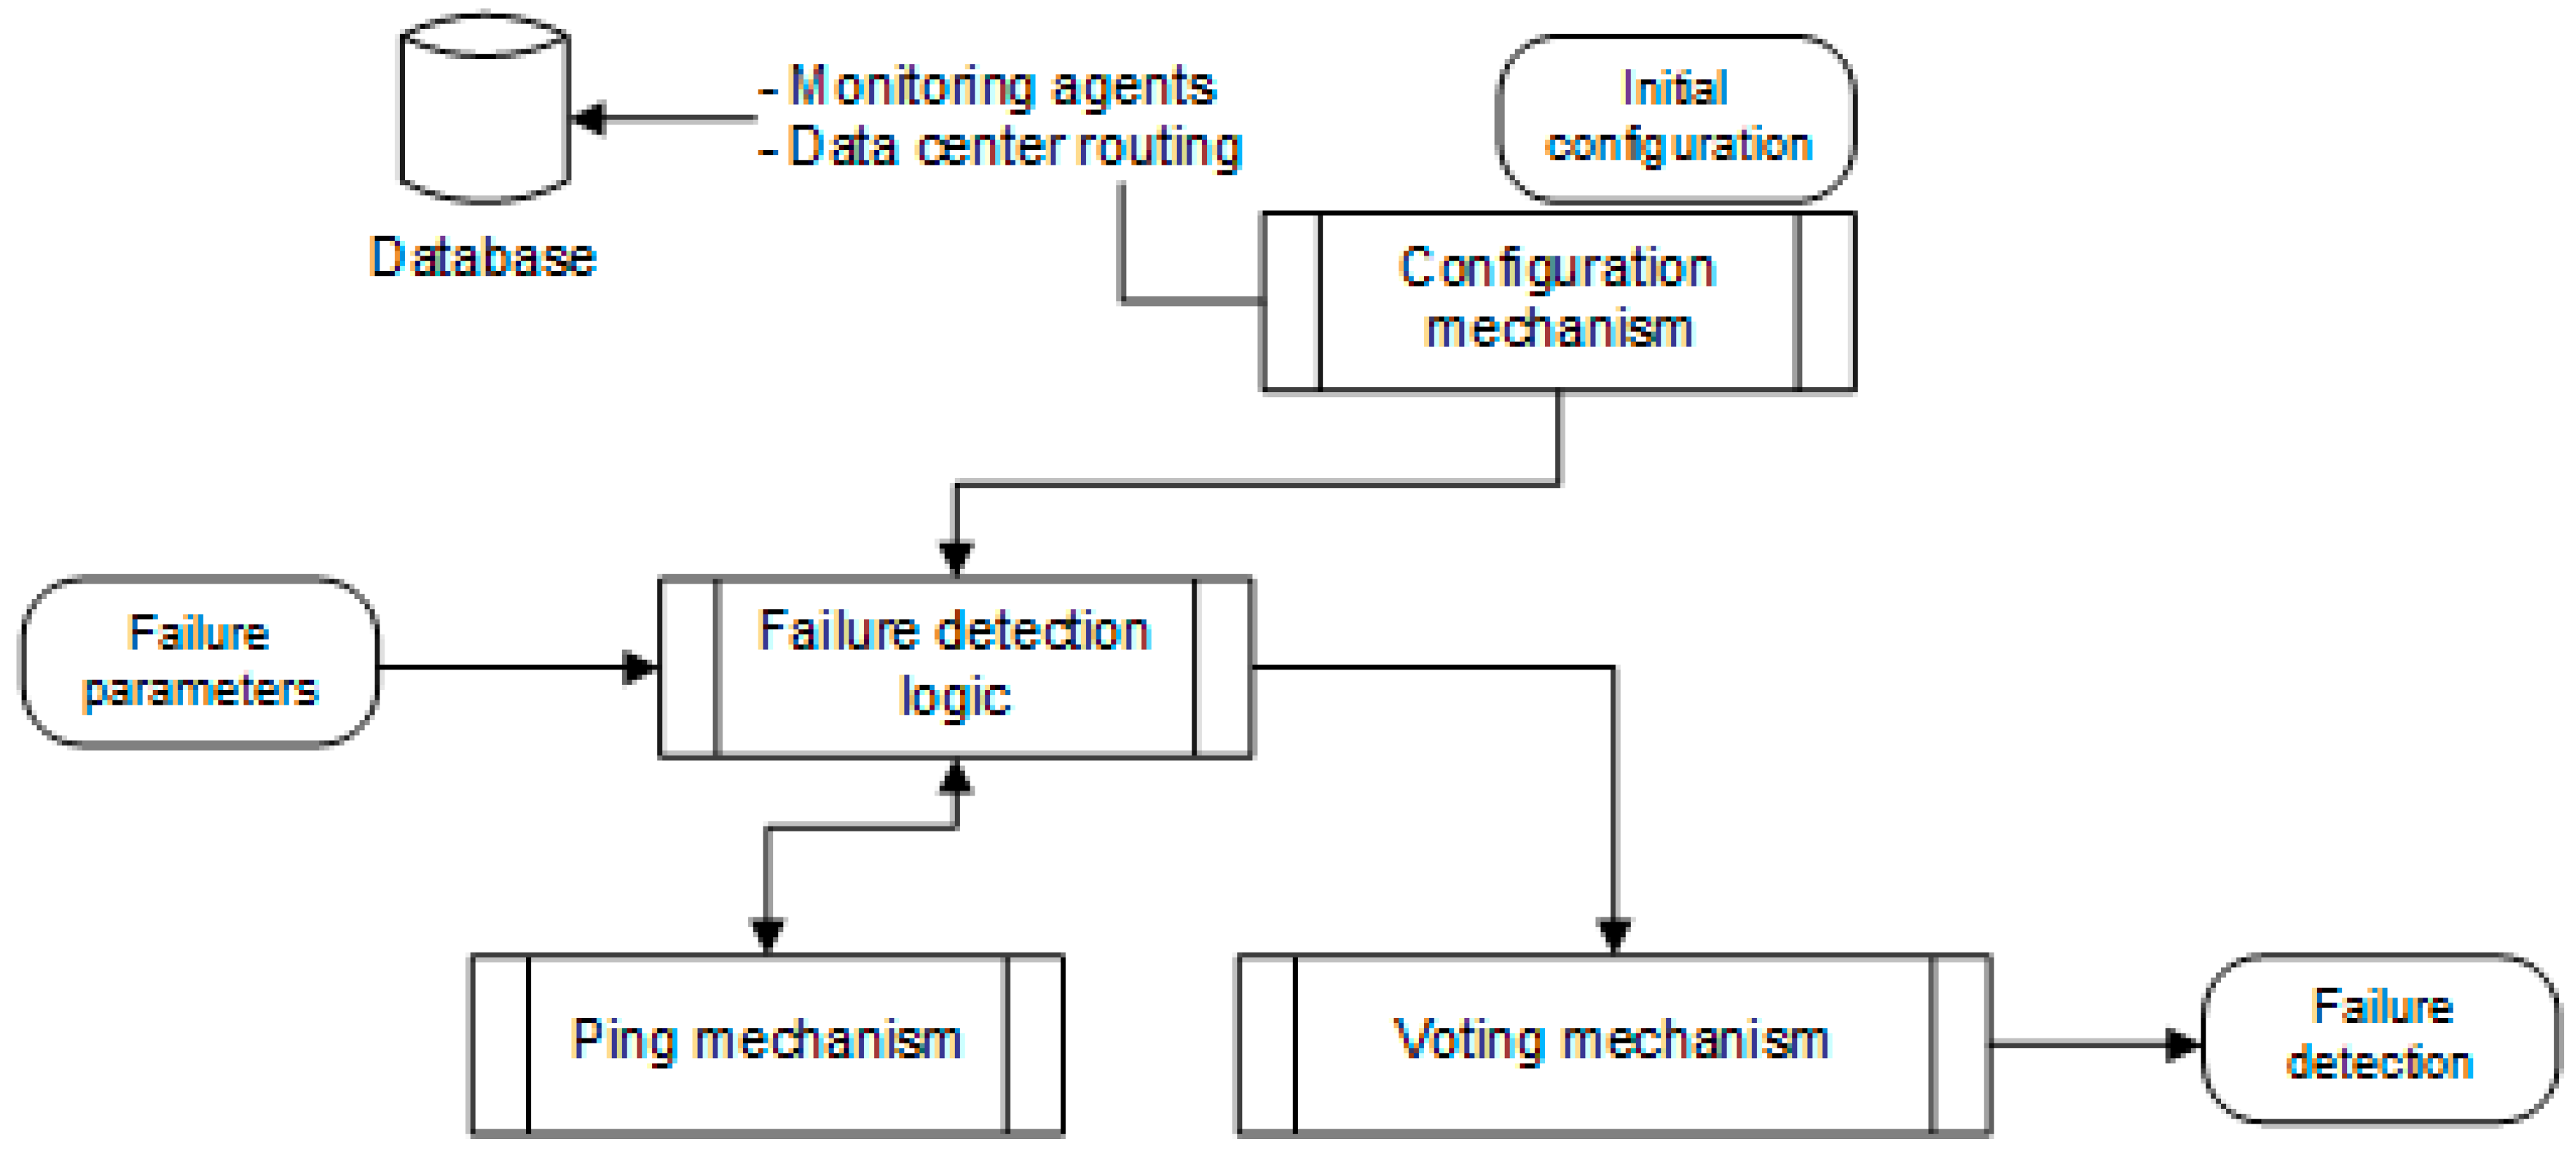
The failure detection framework incorporates a set of components/services that enable the overall goal of accurate and timely failure detection, as cited in Figure 2. In total, five components provide the required functionality, as follows:
- Database: The database (DB) holds initial configuration data. These are the exposed port of the front end, the internal and external IP addresses and the address of another database that is used for the distributed transactional lock implementation. It also holds the retries of the Ping mechanism, the retries of the Voting mechanism, the ping interval, the voting interval and the voting majority threshold. Furthermore, the database holds the updating interval and the datacenter membership identifier.
- Configuration mechanism: The configuration mechanism performs several activities. During the initialization phase, it registers the indicator of a data center as a Ping and as a Voting mechanism. It uses the datacenter identifier to discover the target data center to be pinged. During normal runtime, at updating intervals, it queries the database in order to update the target indicators and the additional (residing in the same datacenter) voters. During the normal phase, one can put an indicator into an idle state (termed as “sleeping” state within the corresponding source code) by indicating in the routing table that the datacenter pings the specific datacenter. This way someone can also repurpose the datacenter for pinging another datacenter by first setting the corresponding destination pinging to an empty string and then, upon entering the idle state, the administrator can change again the destination in the corresponding entry to the desired datacenter. The Configuration mechanism communicates these changes.
- Ping mechanism: The Ping mechanism can be deployed as distributed agent in different datacenters and it implements the functionality of pinging the targeted indicators at the intervals specified by the configuration mechanism. Acknowledging intermittent networking delays and errors, it retries pings after a number of failures. If all the indicators are non-pingable it sends a “datacenter down” signal to the Voting mechanism.
- Voting mechanism: Upon a down signal (received from the Ping mechanism), the Voting mechanism uses a voting timeout to request an opinion on the status of the target datacenter from additional voters. If more than half of the list of voters respond, then a voting begins. If the majority of them (defined in the following equation) replies as down or up, then the status is determined and signaled. The opinion collection and voting processes are repeated up to a maximum number of attempts.
If the result is a datacenter down, the proposed failure detection framework signals the failure detection to the datacenter recovery mechanisms and it switches status to idle (“sleeping”).
Each of the components uses events to convey its information but can also be queried. The typical Golang [36] way of conveying information are channels and with the latest (i.e., Golang version 1.10) and Go routines, multiple processors can be utilized automatically.
3.2. Failure Detection Framework Internal Components and Algorithm
In the high-level description of the proposed approach, specific components/services aim at protecting a datacenter. These components are the Configuration mechanism, the Voting mechanism, the Ping mechanism and the database (i.e., Indicators DB). The Configuration mechanism makes calls to the database to update the list of the Ping and Voting mechanisms. Having done this, it passes the information through asynchronous Golang channels to the Ping and Voting mechanisms. Upon detection of a datacenter being down, the Ping mechanism uses asynchronous Golang channels to forward the detection to the Voting mechanism. The latter starts the opinion collection phase by utilizing additional distributed agents/monitoring watchdogs as depicted in Figure 3. Thus, as additional Ping mechanisms are deployed, these act as distributed agents that collect monitoring information to be considered during the voting phase to minimize potential false positives. The Voting mechanism either decides on the detection of a failure and uses the OpenStack Application Programming Interface (API) of a datacenter to notify for the failure, or passes the control, through asynchronous channels to the Ping mechanism. The software uses an OpenStack exported URL for calling a datacenter recover action.
As presented in the following figure (Figure 3) an indicator initially loads a configuration and registers with the distributed key-value store. If the initial registration phase with the database or the updating phase fails due to connectivity issues with the database, it crashes in order to implement a fail-stop model. Following this action, it changes state to sleeping/idle state. A Configuration mechanism is also started upon successful registration, which uses the database to fetch the pinged datacenter from the routing table, the Voting and the Ping mechanisms. If the Configuration mechanism cannot fetch them for a reason, the system crashes in the fail-stop model. When the Configuration mechanism fetches a non-empty datacenter identifier different from indicators datacenter, the Indicator changes to the running state.
During the running state, the indicator pings the datacenter and if it receives at least one response after a number of retries it consults the Configuration mechanism. If the Configuration mechanism fetches an empty datacenter entry it changes to the sleeping state. If the datacenter entry is different from the current datacenter entry the pinging is retargeted to the new datacenter. Otherwise, the pinging continues for the current datacenter entry.
If the target datacenter is down, the voting starts. The current voter list (regularly updated by the Configuration mechanism) is used to collect votes on the status of the datacenter. They are 1 (up), −1 (down). The indicator initiating the voting contributes a vote of −1. Failed voters contribute with 0. By using the majority vote equation, when the datacenter is down the disaster recovery of OpenStack is notified and the system enters the sleeping state. This sleeping state can be escaped only when a non-empty datacenter entry arrives, different from the active. Then pinging restarts. Otherwise, the system remains in the working state and consults the Configuration mechanism. If the datacenter entry is different from the current datacenter entry the Ping mechanism is retargeted to the new datacenter, unless the updated entry is empty, and then it changes state to sleeping. Otherwise, the pinging continues for the current datacenter entry.
The simplified flow is presented in Figure 4 as follows.
Moreover, the overall approach has been implemented and incorporated in an algorithm, which is presented in the corresponding Table 1.
3.3. Implementation
The overall approach includes an API (HTTP REST front-end) that can be used to query the status of the pinged datacenter and some metrics, like voting retries to reach a down decision and the false positive rate. It distinguishes between two cases: Internal false positives and external false positives. The next Table 2 presents the exposed HTTP REST API.
Furthermore, and since initially a set of configuration parameters (i.e., timeouts, update intervals, and voting thresholds) is not known, the aforementioned API allows users to set these parameters and experiment with different cases. Another aspect of the presented approach refers to the collection of information in order to automate and optimize the setting of the value for these parameters. Thus, monitoring data are collected regarding the average number of retries per indicator to set the timeouts the update intervals and the voting thresholds. The false positives are determined by analyzing the number of indicators. Finally, the delay to discover a disaster can be controlled by reducing the timeouts in both the Ping and the Voting mechanisms. The updating interval also plays a role in the false positives. A big timing interval gives an erroneous picture about the protectors available for pinging and voting. As the number of indicators grows, the number of failures also grows, and this has the effect of reducing the updating interval.
The configuration is performed through a JavaScript Object Notation (JSON) file shown in Table 3 for the parameters presented in Table 4. One of the key aspects is the URLs of the database (MongoDB has been chosen) where the distributed data lock is implemented and a collection of identifiers for the servers. Since it is of major importance to access the DB, the proposed approach allows for a number of replicas to be deployed and thus more than one URLs to be provided as configuration. Additional configuration information refers to the external IP address, the exposed REST port, the internal IP address and the datacenter to which the server belongs. Even more important are the parameters that allow a user to control the algorithmic behavior of the software: the ping retries/timeout and voting retries/timeout. Typically, the timeout should not be too high but small enough so as to defer the sampling to the retries. The update interval controls the interval between updates. A failure to update, results in a crash.
Through the database, the framework obtains a collection of “indicators”, while it also provides information for additional Voting and Ping mechanisms that can be utilized. The corresponding parameters are cited in the following Table 5.
Finally, there is a “routing” collection that acts as a ping direction specification (presented in Table 6), referring to the different datacenters that are being monitored for failures. The framework resides in one datacenter, while the critical infrastructure components/services are deployed in the second datacenter (i.e., the “target” one).
4. Evaluation Results
The experiment used to validate the presented approach was performed for a real-world scenario that focuses on an industrial environment with a critical infrastructure supporting the health of the employers, while also aiming to optimize operations and services within the production line. The corresponding services that have been deployed in a cloud environment are laid in the field of computer vision, following previous experimentation regarding cloud deployment of such services [37], and particularly in the field of:
- Object Identification: It uses Hidden Markov Models (HMMs) for object identification and categorization. The training phase for these models demands heavy processing and memory requirements. Visual features are extracted for each image frame and the HMMs are trained with a long time series (i.e., video sequences of long duration). The models’ parameters are stored and re-used in the testing phase for the remaining video frames. The outcome of this process is object identification within specific frames and as a result within a video.
- Process Recognition: It uses artificial intelligence techniques and allows experts to define restricted areas in a factory/industry, the intrusion of which may be severe as far as quality assurance for the products is concerned, safety and security. The implemented algorithm enables processes to be identified by characterizing specific areas within an environment and along with the processes being identified any violation/intrusion or change in these processes is reported.
The algorithms implemented from the aforementioned services use as input three (3) real-world datasets (videos) recorded in Nissan Iberica automobile construction industry [38]. The dataset depicts employers executing specific activities (tasks) that compose workflows, with a view to assembling a car chassis, in a cluttered industrial environment. Three footages at three different time periods were shot using four cameras, thus resulting in a total duration of more than 35 h of data. The recorded frames depict metal sparks, cars’ equipment racks, and workers performing the assembly as well as robotic movements and fires. In greater detail, the used datasets refer to:
- Dataset #1: It includes videos of four (4) IP PTZ cameras recording different views of the industrial field. The cameras capture 18 to 25 frames per second while the frame resolution is of 704 × 576 pixels. The duration of the first dataset is one-day long. It comprises 20 working cycles in the industry while each cycle consists of several tasks.
- Dataset #2: The second dataset has been enriched with one more camera capturing a panoramic view of the industrial field. Frame rate and frame resolution is the same as Dataset #1. The duration for the second set is of two days, or equivalently of 40 working cycles. It should be mentioned that the content of the second dataset is much more complex than the content of Dataset #1 since in the first simultaneous processes can be executed by the workers.
- Dataset #3: The third dataset is of three days’ activities in the industrial environment, while frame rate and resolution are the same as above.
Besides these application-oriented services that represent a critical infrastructure scenario (in this case of an industrial environment), the experiment also includes a typical cloud storage service used in the majority of application cases (as depicted in Figure 5). The latter is used to store the output of the process recognition service as well as the output of the object identification service:
Regarding the underlying infrastructure, it consists of eight (8) nodes and it has been exploited as a testbed for the validation of the mechanism results. The nodes have the following characteristics: 16 GB RAM, Intel i7-4790 @ 3.60 GHz × 8 CPU Cores, 2 TB Storage. OpenStack Queens has been deployed and in total 24 VMs have been made available for experimentation, presenting a small-scale representative cloud environment.
One of the main aspects under investigation refers to the evaluation of the proposed framework in terms of latency as well as in terms of the effectiveness of the presented voting algorithm. Latency is of major importance given that for critical infrastructures latency of failure detection would lead to delays in corrective actions. To this end, several experiments have been performed with the aforementioned infrastructure elements (i.e., VMs) and the deployed monitoring agents (i.e., watchdogs). The following figure (Figure 6) depicts the latency in failure detection (based on the deployed Pinger mechanisms), which is on average 7.1 s. Two spikes have been identified. These spikes are due to the fact that several watchdogs have been deployed and the voting mechanism that was triggered results to increase in terms of latency. In greater detail, the first spike (latency of 23 s) was identified for the case of 11 watchdogs providing information and votes, for which initially 2 were positive and 9 were negative (in terms of the Ping mechanism results and the corresponding votes). When increasing the number of monitoring agents to 21 (maximum since the other 3 VMs have been used for the aforementioned application services), the latency in the case of potential failure (which was “implemented” by submitting a kill signal to an application VM) has shown the second spike of 32 s. However, it should be noted that this can be considered as an “extreme” case of 21 VMs monitoring an application (and as a result a critical infrastructure). Moreover, as depicted in Figure 6, the proposed approach has been compared with Prometheus [39], a well-established monitoring framework with distributed monitoring probes. Prometheus outperforms the proposed approach where several distributed agents (Pingers) are deployed and the voting results are not yet consistent. The latter occurs due to the fact of different configurations in terms of monitoring intervals and thus potential failure alerts are not yet the majority in the votes since other agents are still reporting the previous “health” state. As soon as voting reaches majority the latency drops significantly.
The second key aspect under evaluation has been the effectiveness of the voting algorithm. Figure 7 and Figure 8 depict the total number of monitoring agents/watchdogs that have been deployed and the corresponding positive or negative notes. One can identify that as the number of the agents grows, there are agents that have an “incorrect” view of the system under monitoring. This is mainly caused by the network infrastructure, which is however balanced by the number of the monitoring agents and the voting process that takes place. Figure 7 shows that even in cases of unbalance (e.g., 6th min or 18th min of the framework’s operation) in terms of both negative and positive votes, the voting approach that has been proposed provides efficient results and minimizes the false positives. Furthermore, Figure 7 shows that there could be cases that would lead to false positives or in general inaccurate results. The latter is due to the fact that monitoring frameworks, such as the Prometheus framework that has been used to compare the existing approach, do not employ voting algorithms or similar approaches but aim at providing monitoring information and based on rule-based approaches to create the corresponding alerts. As shown in Figure 7, there have been seven cases (marked with red rectangles) where diverse monitoring data have been collected from different monitoring agents due to different monitoring time intervals. The latter has been the case both for the presented failure detection mechanism and for Prometheus. Prometheus would raise an alert as soon as monitoring data have been received reporting a failure. However, due to the incorporated voting algorithm, the presented approach would not raise an alert in all cases since voting takes place to conclude whether a failure has actually occurred.
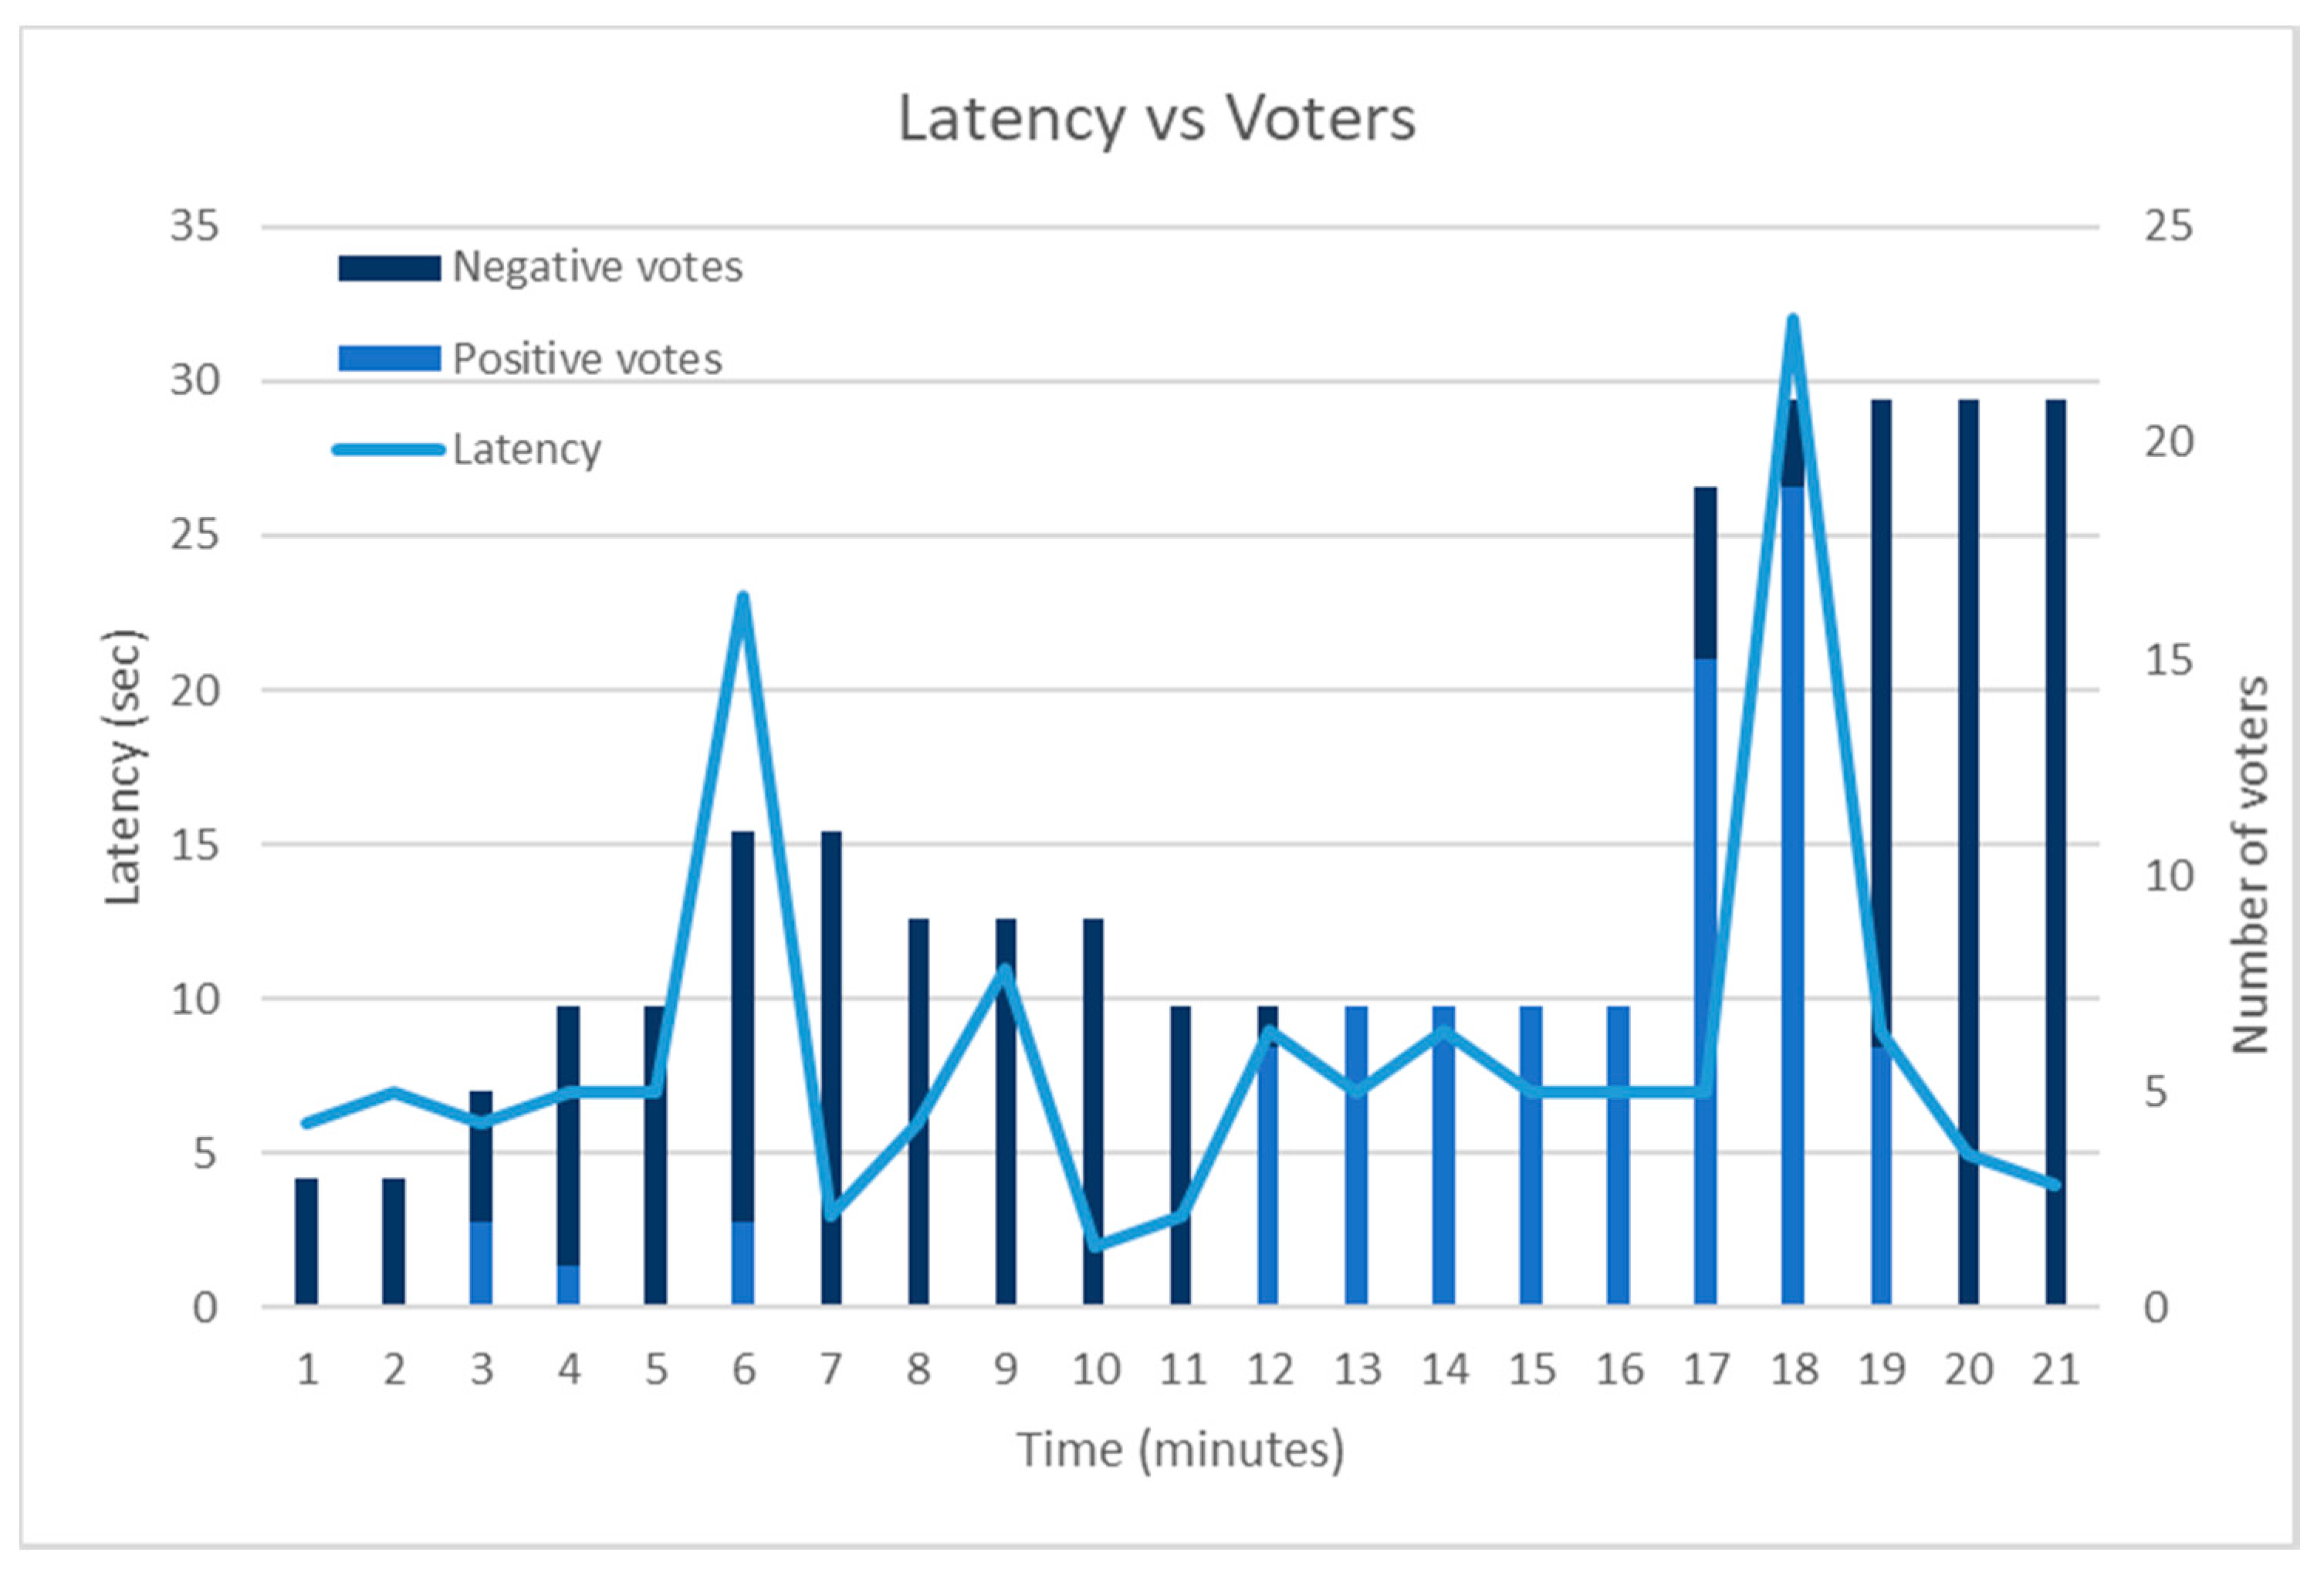
Towards identifying how the number of the monitoring agents (and the potential distribution of positive and negative votes) correlates with the latency of the failure detection framework, Figure 8 combines the collected results. As is depicted in the figure, when the number of voters increases and there is unbalance (e.g., in the 6th and the 18th min of the framework’s operation), the latency increases. A smaller number of monitoring agents—and, as a result, of voters—causes a smaller latency even if there is unbalance. However, if there is not unbalance (which was for example the case after the 18th min) the latency drops significantly.
5. Conclusions
As a result of the rise of the IoT, cloud and edge computing environments, several critical infrastructure deployments have been conducted in such environments. Multi-sensor IoT devices (acting as edge devices) are deployed close to machines of critical infrastructure and execute edge functionalities related to the acquisition of the status of the machines. Each IoT device is able to interface with the machine and acquire information about its status. Moreover, cloud computing environments (acting as back-end) collect information from all the machines and perform analytics at multiple levels (e.g., of a production order, of a batch of production orders) concerning multiple indicators (e.g., statistics about individual machines, groups of machines of the same vendor, machines utilization statistics, etc.). Analytics functions are displayed on dashboards and provided to ERP/MRP systems in order to inject critical infrastructure intelligence in various processes and serve the needs of the users of these critical infrastructures.
In this context, dependability and high-availability is critical to the success and effectiveness of critical infrastructures, given that it is important to ensure that data and information associated with them remain available. In this paper, an overall approach has been presented enabling the identification of potential failures regardless of the failure reason (e.g., security attack, physical failures, application failures, etc.). The main innovation of the proposed approach refers to the fact that distributed agents monitor the datacenter serving the critical infrastructure and through a voting mechanism come to a timely decision whether a failure has been detected. The latter increases accuracy in failure detection and minimizes corrective actions (e.g., provisioning or migration of services). Future work will include the incorporation of IoT/edge devices and also the distribution of monitoring agents on these devices in order to evaluate whether the proposed approach can be applied in a hybrid environment in terms of monitoring agents distribution and votes collection.
Funding
This research received no external funding.
Conflicts of Interest
The authors declare no conflicts of interest.
References
- European Commission. Communication to the European Parliament, the Council, the European Economic and Social Committee and the Committee of the Regions on Critical Information Infrastructure Protection “Achievements and Next Steps: Towards Global Cyber-Security”; European Commission: Brussels, Belgium, 2011. [Google Scholar]
- The United Nations Office for Disaster Risk Reduction (UNISDR). Critical Infrastructure and Disaster Resilience: Issue Brief by Private Sector. Available online: https://www.preventionweb.net/files/55922_55922criticalinfrastructureanddisas.pdf (accessed on 25 July 2018).
- Hewlett Packard. State of Security Operations. Available online: https://news.hpe.com/state-of-security-operations-2017 (accessed on 25 July 2018).
- Hewlett Packard. Internet of Things Research Study. Available online: http://www8.hp.com/h20195/V2/GetPDF.aspx/4AA5-4759ENW.pdf (accessed on 25 July 2018).
- The Ponemon Institute LLC. Critical Infrastructure: Security Preparedness and Maturity; Unisys Corporation: Blue Bell, PA, USA, 2014. [Google Scholar]
- Abomhara, M.; Køien, G.M. Cyber Security and the Internet of Things: Vulnerabilities, Threats, Intruders and Attacks. J. Cyber Secur. 2015, 4, 65–88. [Google Scholar] [CrossRef]
- Atamli, A.W.; Martin, A. Threat-Based Security Analysis for the Internet of Things. In Proceedings of the International Workshop on Secure Internet of Things (SIoT), Wroclaw, Poland, 10 September 2014; pp. 35–43. [Google Scholar]
- Li, Z.; Xin, T. Threat Modeling and Countermeasures Study for the Internet of Things. J. Converg. Inf. Technol. 2013, 8. [Google Scholar] [CrossRef]
- Roman, R.; Zhou, J.; Lopez, J. On the features and challenges of security and privacy in distributed internet of things. Comput. Netw. 2013, 57, 2266–2279. [Google Scholar] [CrossRef]
- Kozlov, D.; Veijalainen, J.; Ali, Y. Security and privacy threats in IoT architectures. In Proceedings of the 7th International Conference on Body Area Networks, Oslo, Norway, 24–26 September 2012. [Google Scholar]
- Ziegeldorf, J.H.; Morchon, O.G.; Wehrle, K. Privacy in the Internet of Things: Threats and challenges. Secur. Commun. Netw. 2014, 7, 2728–2742. [Google Scholar] [CrossRef]
- Aman, W.; Snekkenes, E. Event Driven Adaptive Security in Internet of Things. In Proceedings of the Eighth International Conference on Mobile Ubiquitous Computing, Systems, Services and Technologies (UBICOMM 2014), Rome, Italy, 24–28 August 2014. [Google Scholar]
- Bauer, M.B.M.; Bui, N.; De Loof, J.; Magerkurth, C.; Meissner, S.; Nettsträter, A.; Stefa, J.; Thoma, M.; Walewski, J.W. IoT Reference Architecture. In Enabling Things to Talk; Springer: Berlin/Heidelberg, Germany, 2013; pp. 163–211. [Google Scholar] [Green Version]
- IoT-A Deliverable D1.5—Final Architectural Reference Model for the IoT. Available online: http://www.iot-a.eu/public/public-documents/d1.5/view (accessed on 25 July 2018).
- The oneM2M Consortium Partners. Standards for M2M and the Internet of Things. Available online: http://www.onem2m.org (accessed on 25 July 2018).
- oneM2M. Analysis of Security Solutions for the oneM2M System; oneM2M, 2014. [Google Scholar]
- Krutz, R.L. Securing SCADA Systems; Wiley Publishing Inc.: Hoboken, NJ, USA, 2006. [Google Scholar]
- Scarfone, K.; Mell, P. NIST Special Publication 800-94: Guide to Intrusion Detection and Prevention Systems; National Institute of Standards and Technology: Gaithersburg, MD, USA, 2007. [Google Scholar]
- Garcia-Teodoro, P.; Diaz-Verdejo, J.; Macia-Fernandez, G.; Vazquez, E. Anomaly-based network intrusion detection: Techniques, systems and challenges. Comput. Secur. 2009, 28, 18–28. [Google Scholar] [CrossRef]
- Shankar, S.; Zhu, B. SCADA-specific intrusion detection/prevention systems: A survey and taxonomy. In Proceedings of the 1st Workshop on Secure Control Systems (SCS), Stockholm, Sweden, 12 April 2010. [Google Scholar]
- Mitchell, R.; Chen, I.R. A survey of intrusion detection techniques for cyber physical systems. ACM Comput. Surv. 2014, 46, 55. [Google Scholar] [CrossRef]
- Van Brussel, H.; Valckenaers, P. Holonic manufacturing systems and multi agent manufacturing control. In Proceedings of the 9th International Manufacturing Conference, Hong Kong, China, 16–17 August 2000. [Google Scholar]
- Schreiber, S.; Fay, A. Requirements for the benchmarking of decentralized manufacturing control systems. In Proceedings of the 16th IEEE International Conference on Emerging Technologies & Factory Automation (ETFA), Toulouse, France, 5–9 September 2011. [Google Scholar]
- Vrba, P. Review of Industrial Applications of Multi-agent Technologies. In Service Orientation in Holonic and Multi Agent Manufacturing and Robotics, Studies in Computational Intelligence; Borangiu, T., Thomas, A., Trentesaux, D., Eds.; Springer: Berlin, Germany, 2013; Volume 472, pp. 327–338. [Google Scholar]
- Badr, I. Agent-Based Dynamic Scheduling for Flexible Manufacturing Systems; University of Stuttgart: Stuttgart, Germany, 2011; Volume 1. [Google Scholar]
- Leitão, P. Agent-based distributed manufacturing control: A state-of-the-art survey. Eng. Appl. Artif. Intell. 2009, 22, 979–991. [Google Scholar] [CrossRef] [Green Version]
- Jammes, F.; Smit, H. Service-oriented paradigms in industrial automation. IEEE Trans. Ind. Inf. 2005, 1, 62–70. [Google Scholar] [CrossRef]
- SIRENA Project. Available online: https://itea3.org/project/sirena.html (accessed on 25 July 2018).
- SODA Project. Available online: https://itea3.org/project/soda.html (accessed on 25 July 2018).
- SOCRADES Project. Available online: http://www.socrades.net/ (accessed on 25 July 2018).
- SOA4D Project. Available online: https://forge.soa4d.org/soft waremap/trove_list.php (accessed on 25 July 2018).
- Doukas, G.; Thramboulidis, K. A Real-Time Linux Based Framework for Model-Driven Engineering in Control and Automation. IEEE Trans. Ind. Electron. 2011, 58, 914–924. [Google Scholar] [CrossRef]
- Basile, F.; Chiacchio, P.; Gerbasio, D. On the Implementation of Industrial Automation Systems Based on PLC. IEEE Trans. Autom. Sci. Eng. 2013, 10. [Google Scholar] [CrossRef]
- Dai, W.; Vyatkin, V.; Christensen, J.H.; Dubinin, V.N. Bridging Service-Oriented Architecture and IEC 61499 for Flexibility and Interoperability. IEEE Trans. Ind. Inf. 2015, 11, 771–781. [Google Scholar] [CrossRef]
- Cucinotta, T.; Mancina, A.; Anastasi, G.F.; Lipari, G.; Mangeruca, L.; Checcozzo, R.; Rusina, F. A Real-Time Service-Oriented Architecture for Industrial Automation. IEEE Trans. Ind. Inf. 2009, 5, 267–277. [Google Scholar] [CrossRef] [Green Version]
- Golang. Available online: https://golang.org/ (accessed on 25 July 2018).
- Kyriazis, D.; Kostantos, K.; Kapsalis, A.; Gogouvitis, S.; Varvarigou, T. Real-time computer vision in clouds through effective monitoring and workflow management. In Proceedings of the 5th IEEE International Conference on Broadband Network & Multimedia Technology (IC-BNMT), Guilin, China, 17–19 November 2013; pp. 317–322. [Google Scholar]
- Voulodimos, A.; Kosmopoulos, D.; Vasileiou, G.; Sardis, E.; Anagnostopoulos, V.; Lalos, C.; Doulamis, A.; Varvarigou, T. A threefold dataset for activity and workflow recognition in complex industrial environments. IEEE Multimed. 2012, 19. [Google Scholar] [CrossRef]
- Prometheus. Available online: https://prometheus.io (accessed on 18 August 2018).
Figure 1.
Distributed failure detection within and across datacenters.

Figure 2.
Conceptual architecture of the proposed approach.

Figure 3.
Failure detection overview.
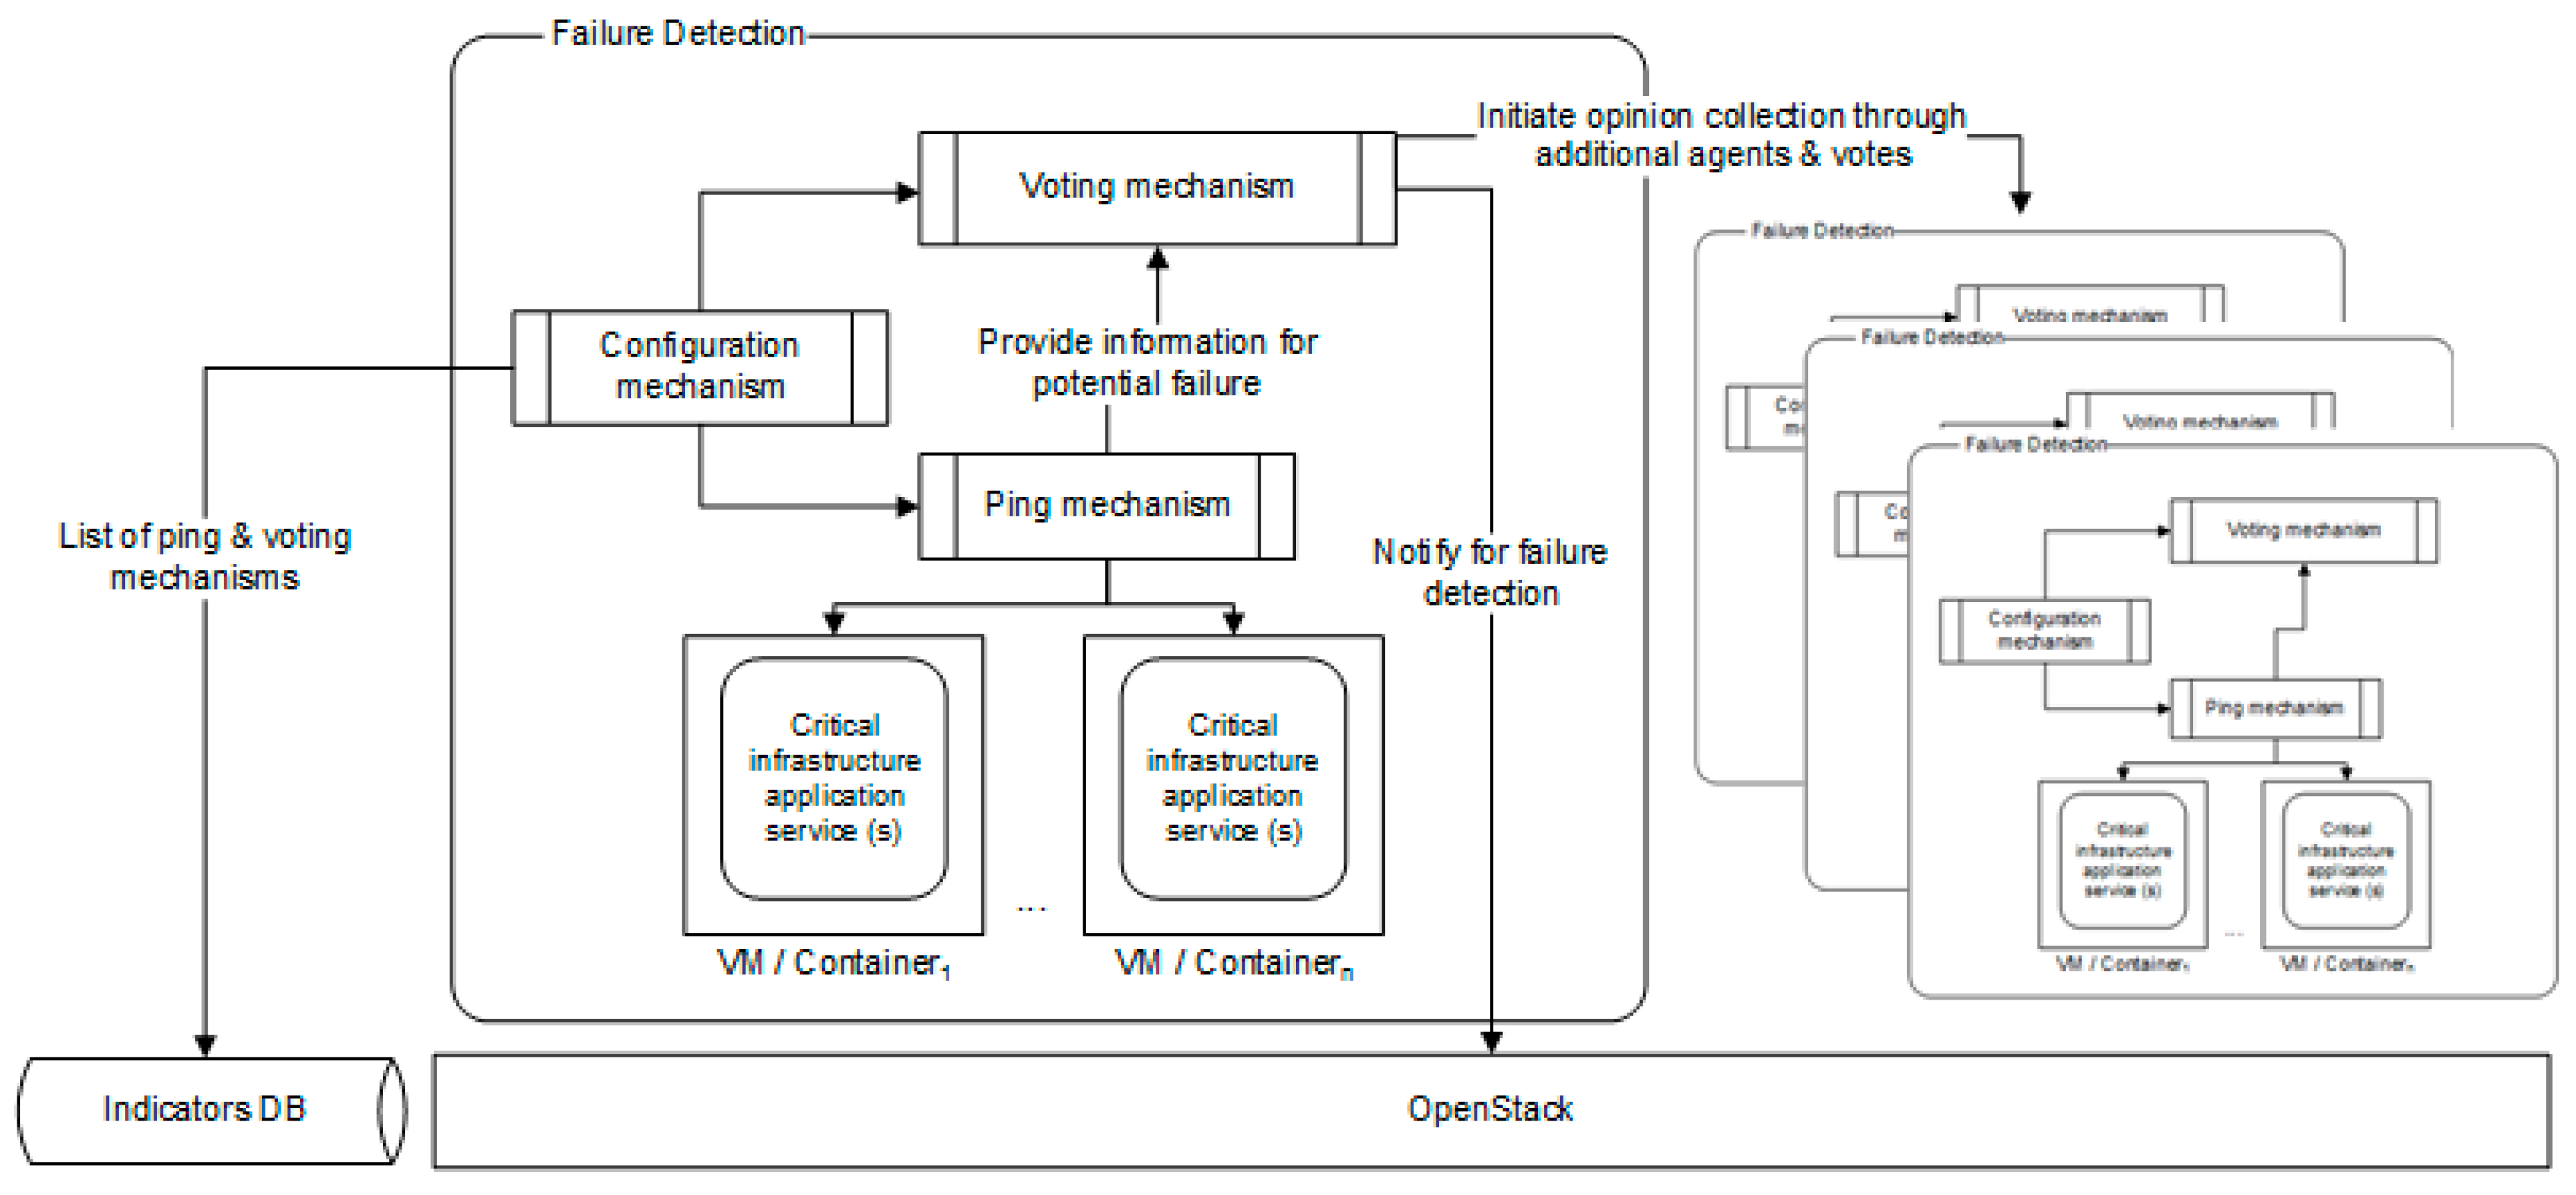
Figure 4.
Overall sequence of failure detection mechanism.
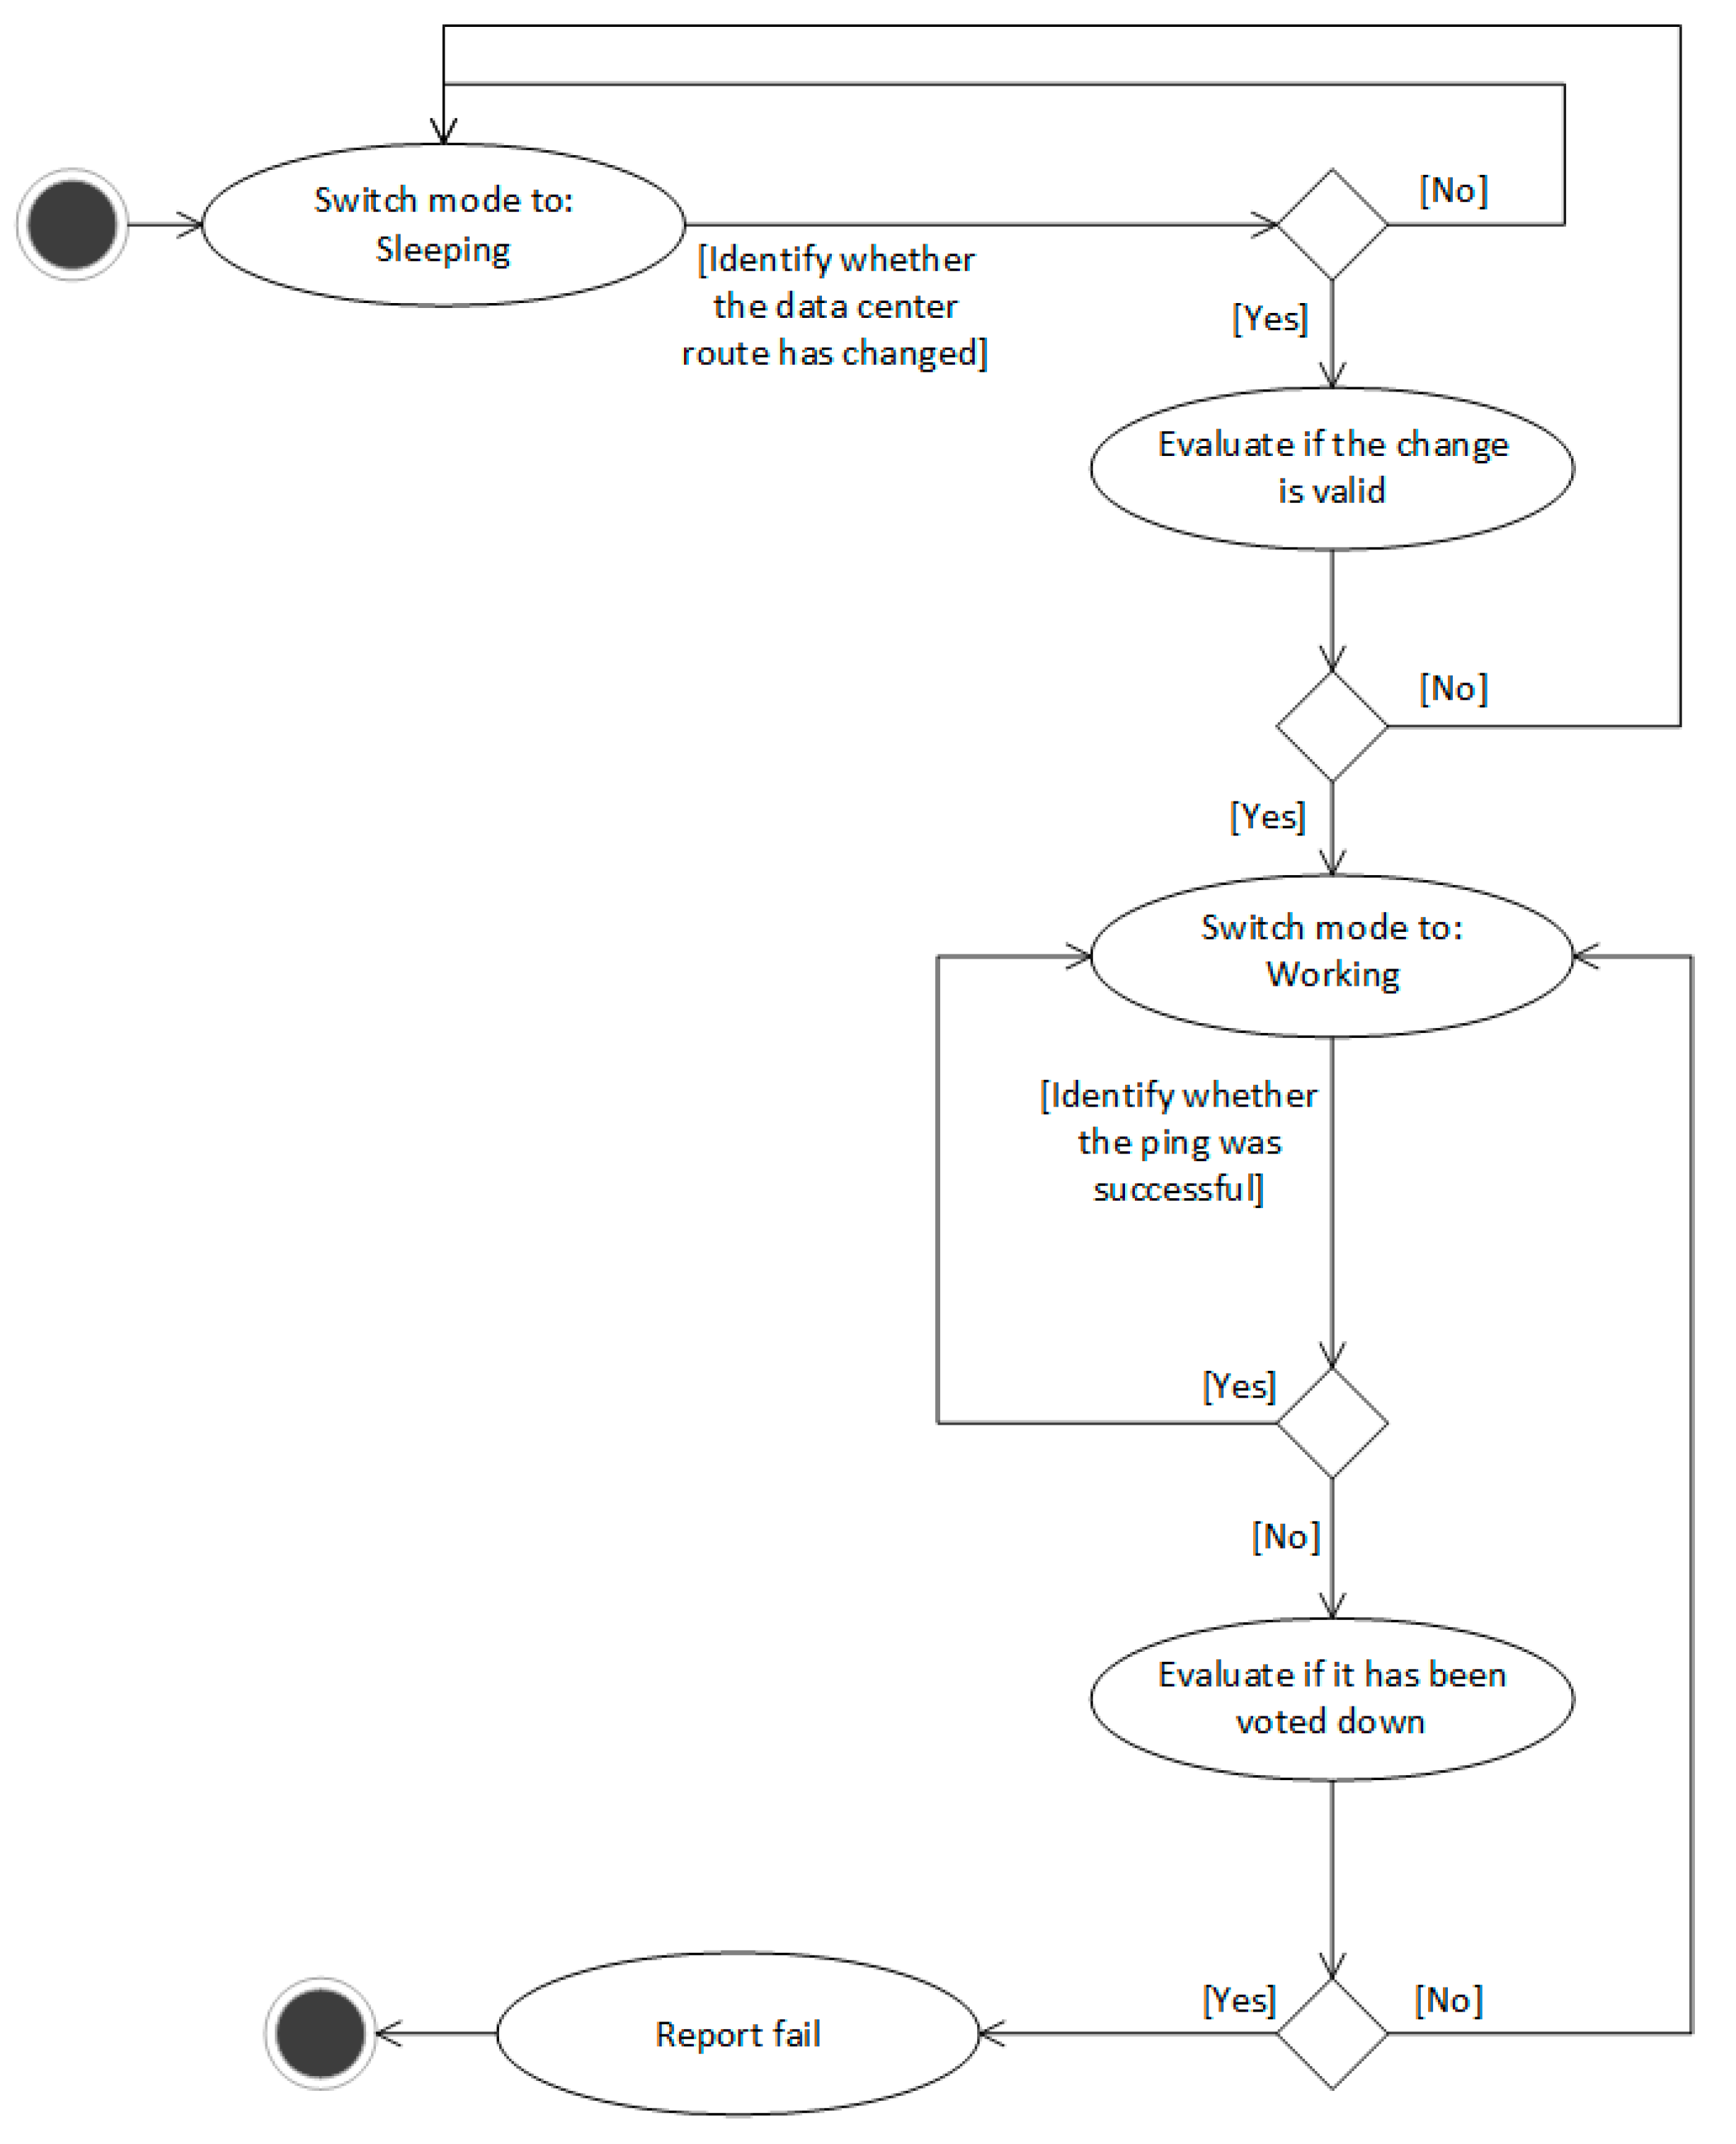
Figure 5.
Experimentation application.

Figure 6.
Latency of the failure detection framework with an average of 7.1 s, compared to Prometheus with an average of 3.6 s.
Figure 6.
Latency of the failure detection framework with an average of 7.1 s, compared to Prometheus with an average of 3.6 s.
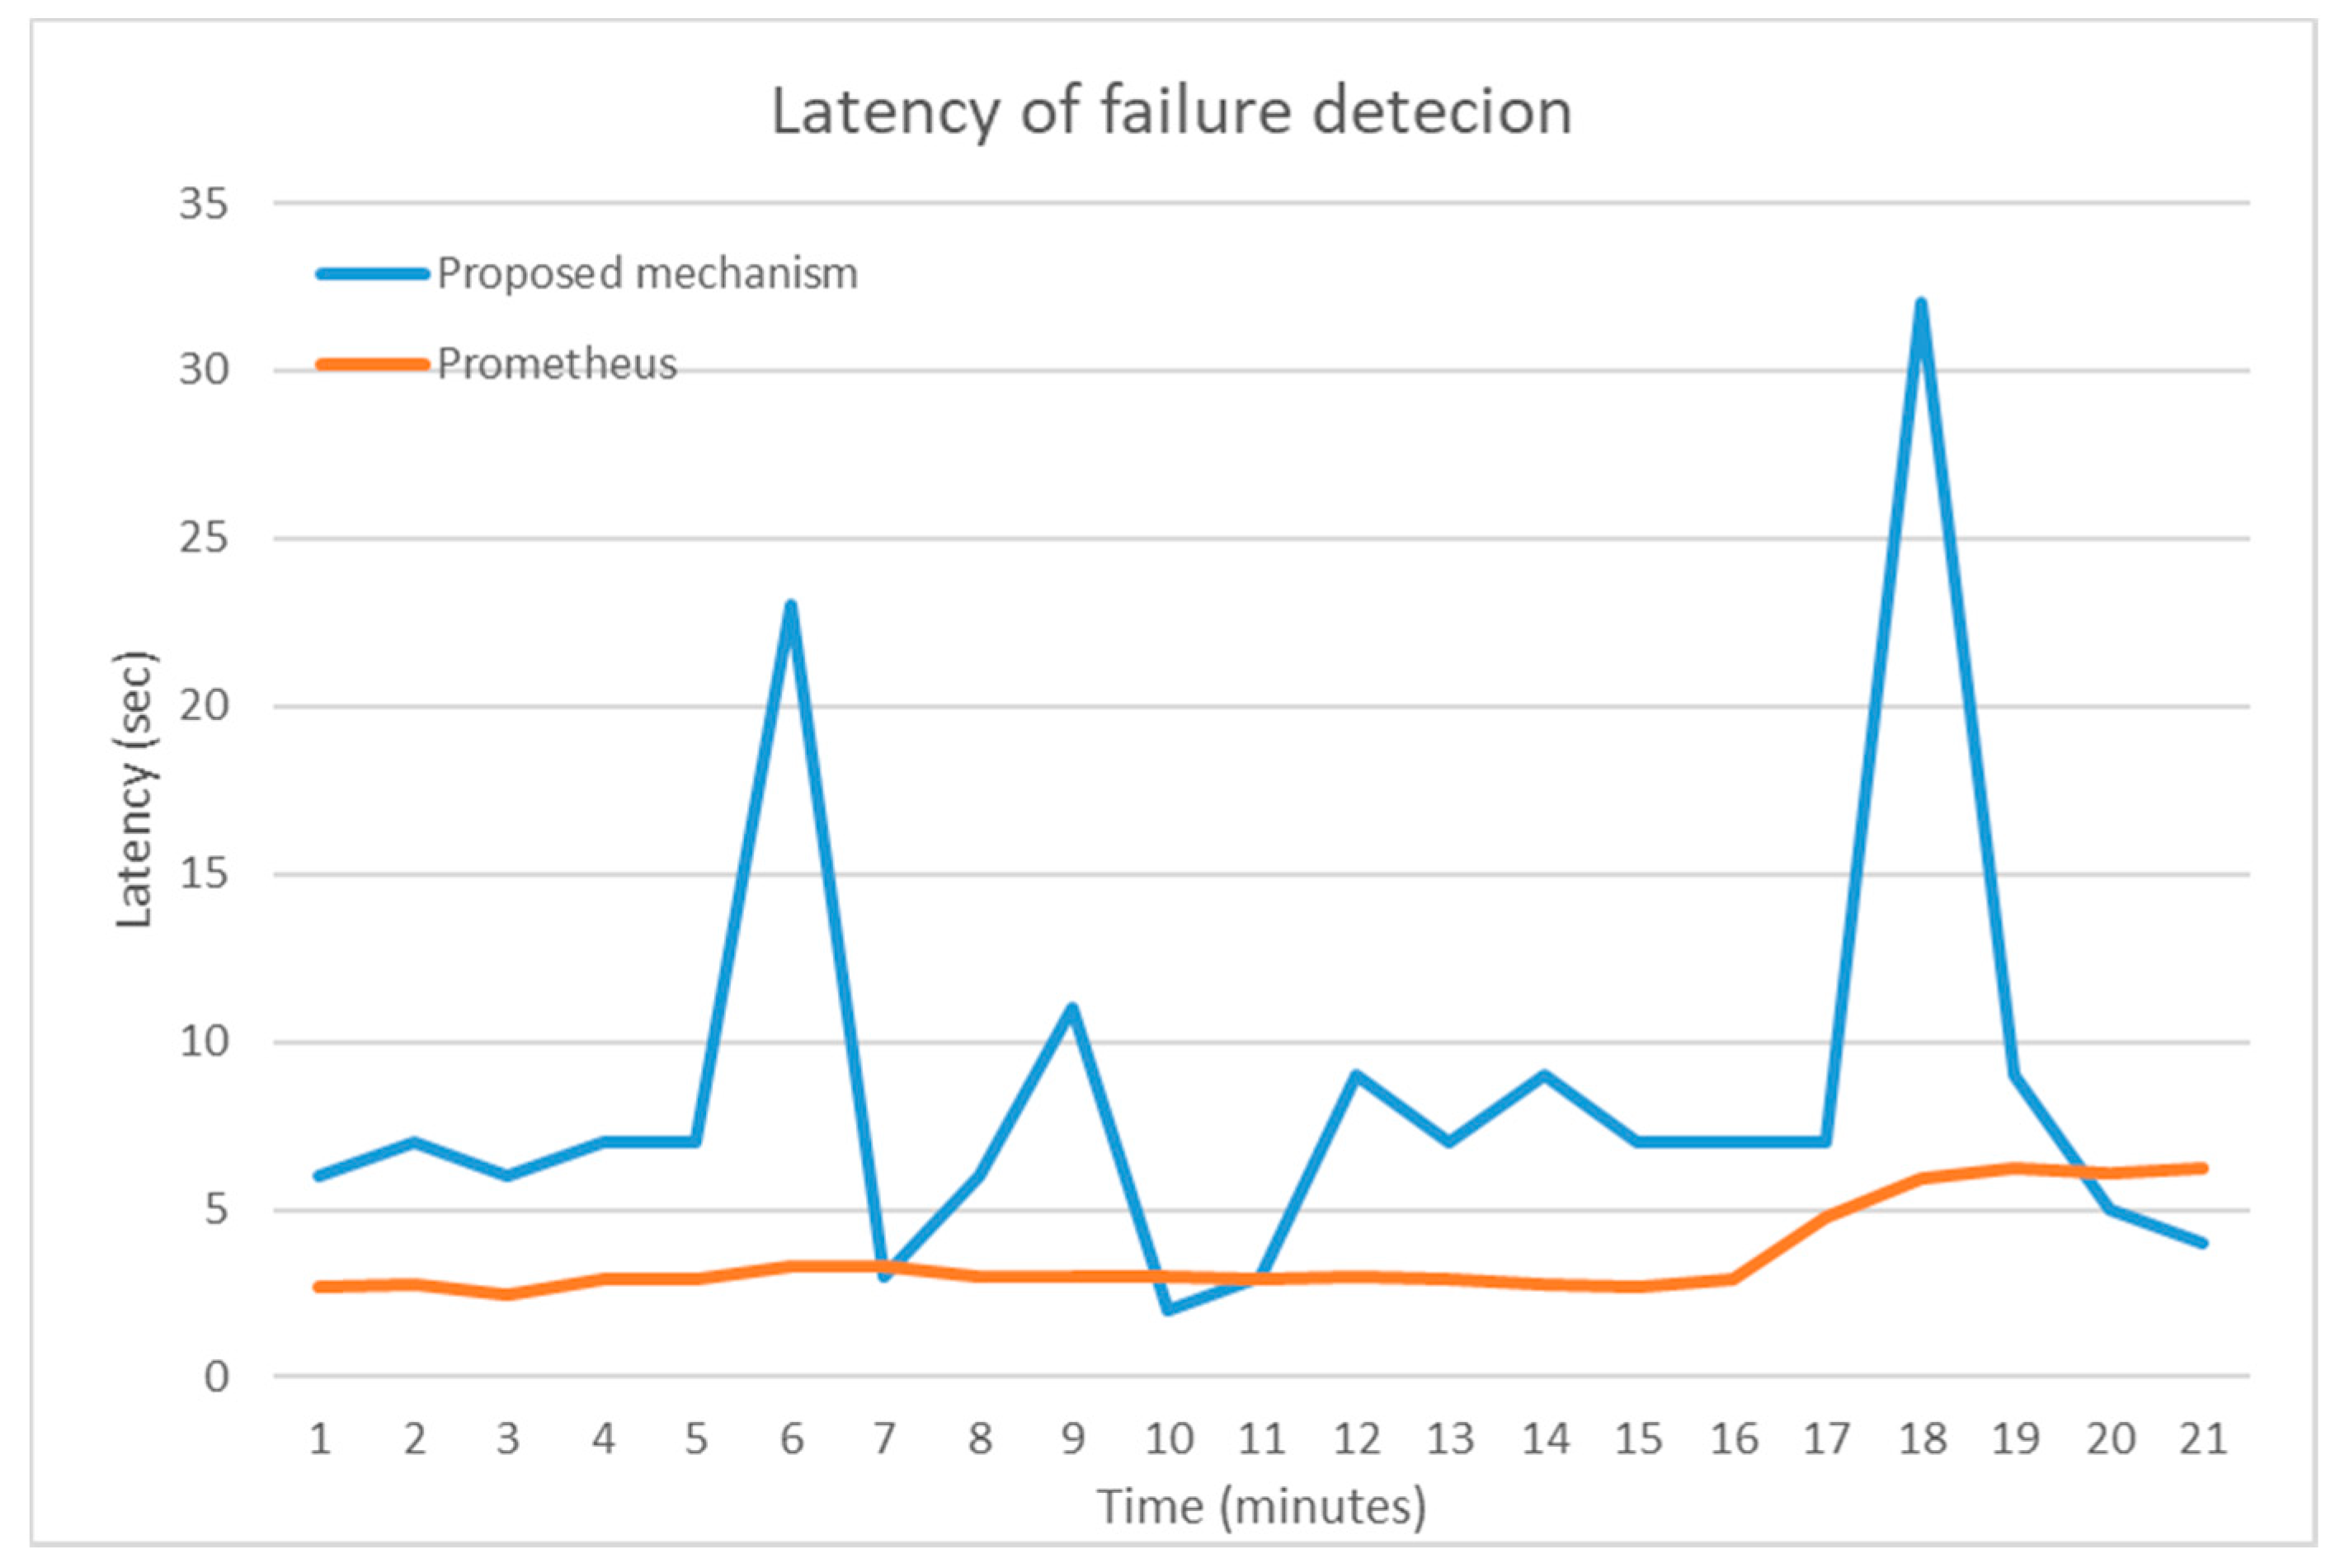
Figure 7.
Voting results associated with the number of monitoring agents and the respective positive/negative votes, and potential cases of inaccurate conclusions.
Figure 7.
Voting results associated with the number of monitoring agents and the respective positive/negative votes, and potential cases of inaccurate conclusions.
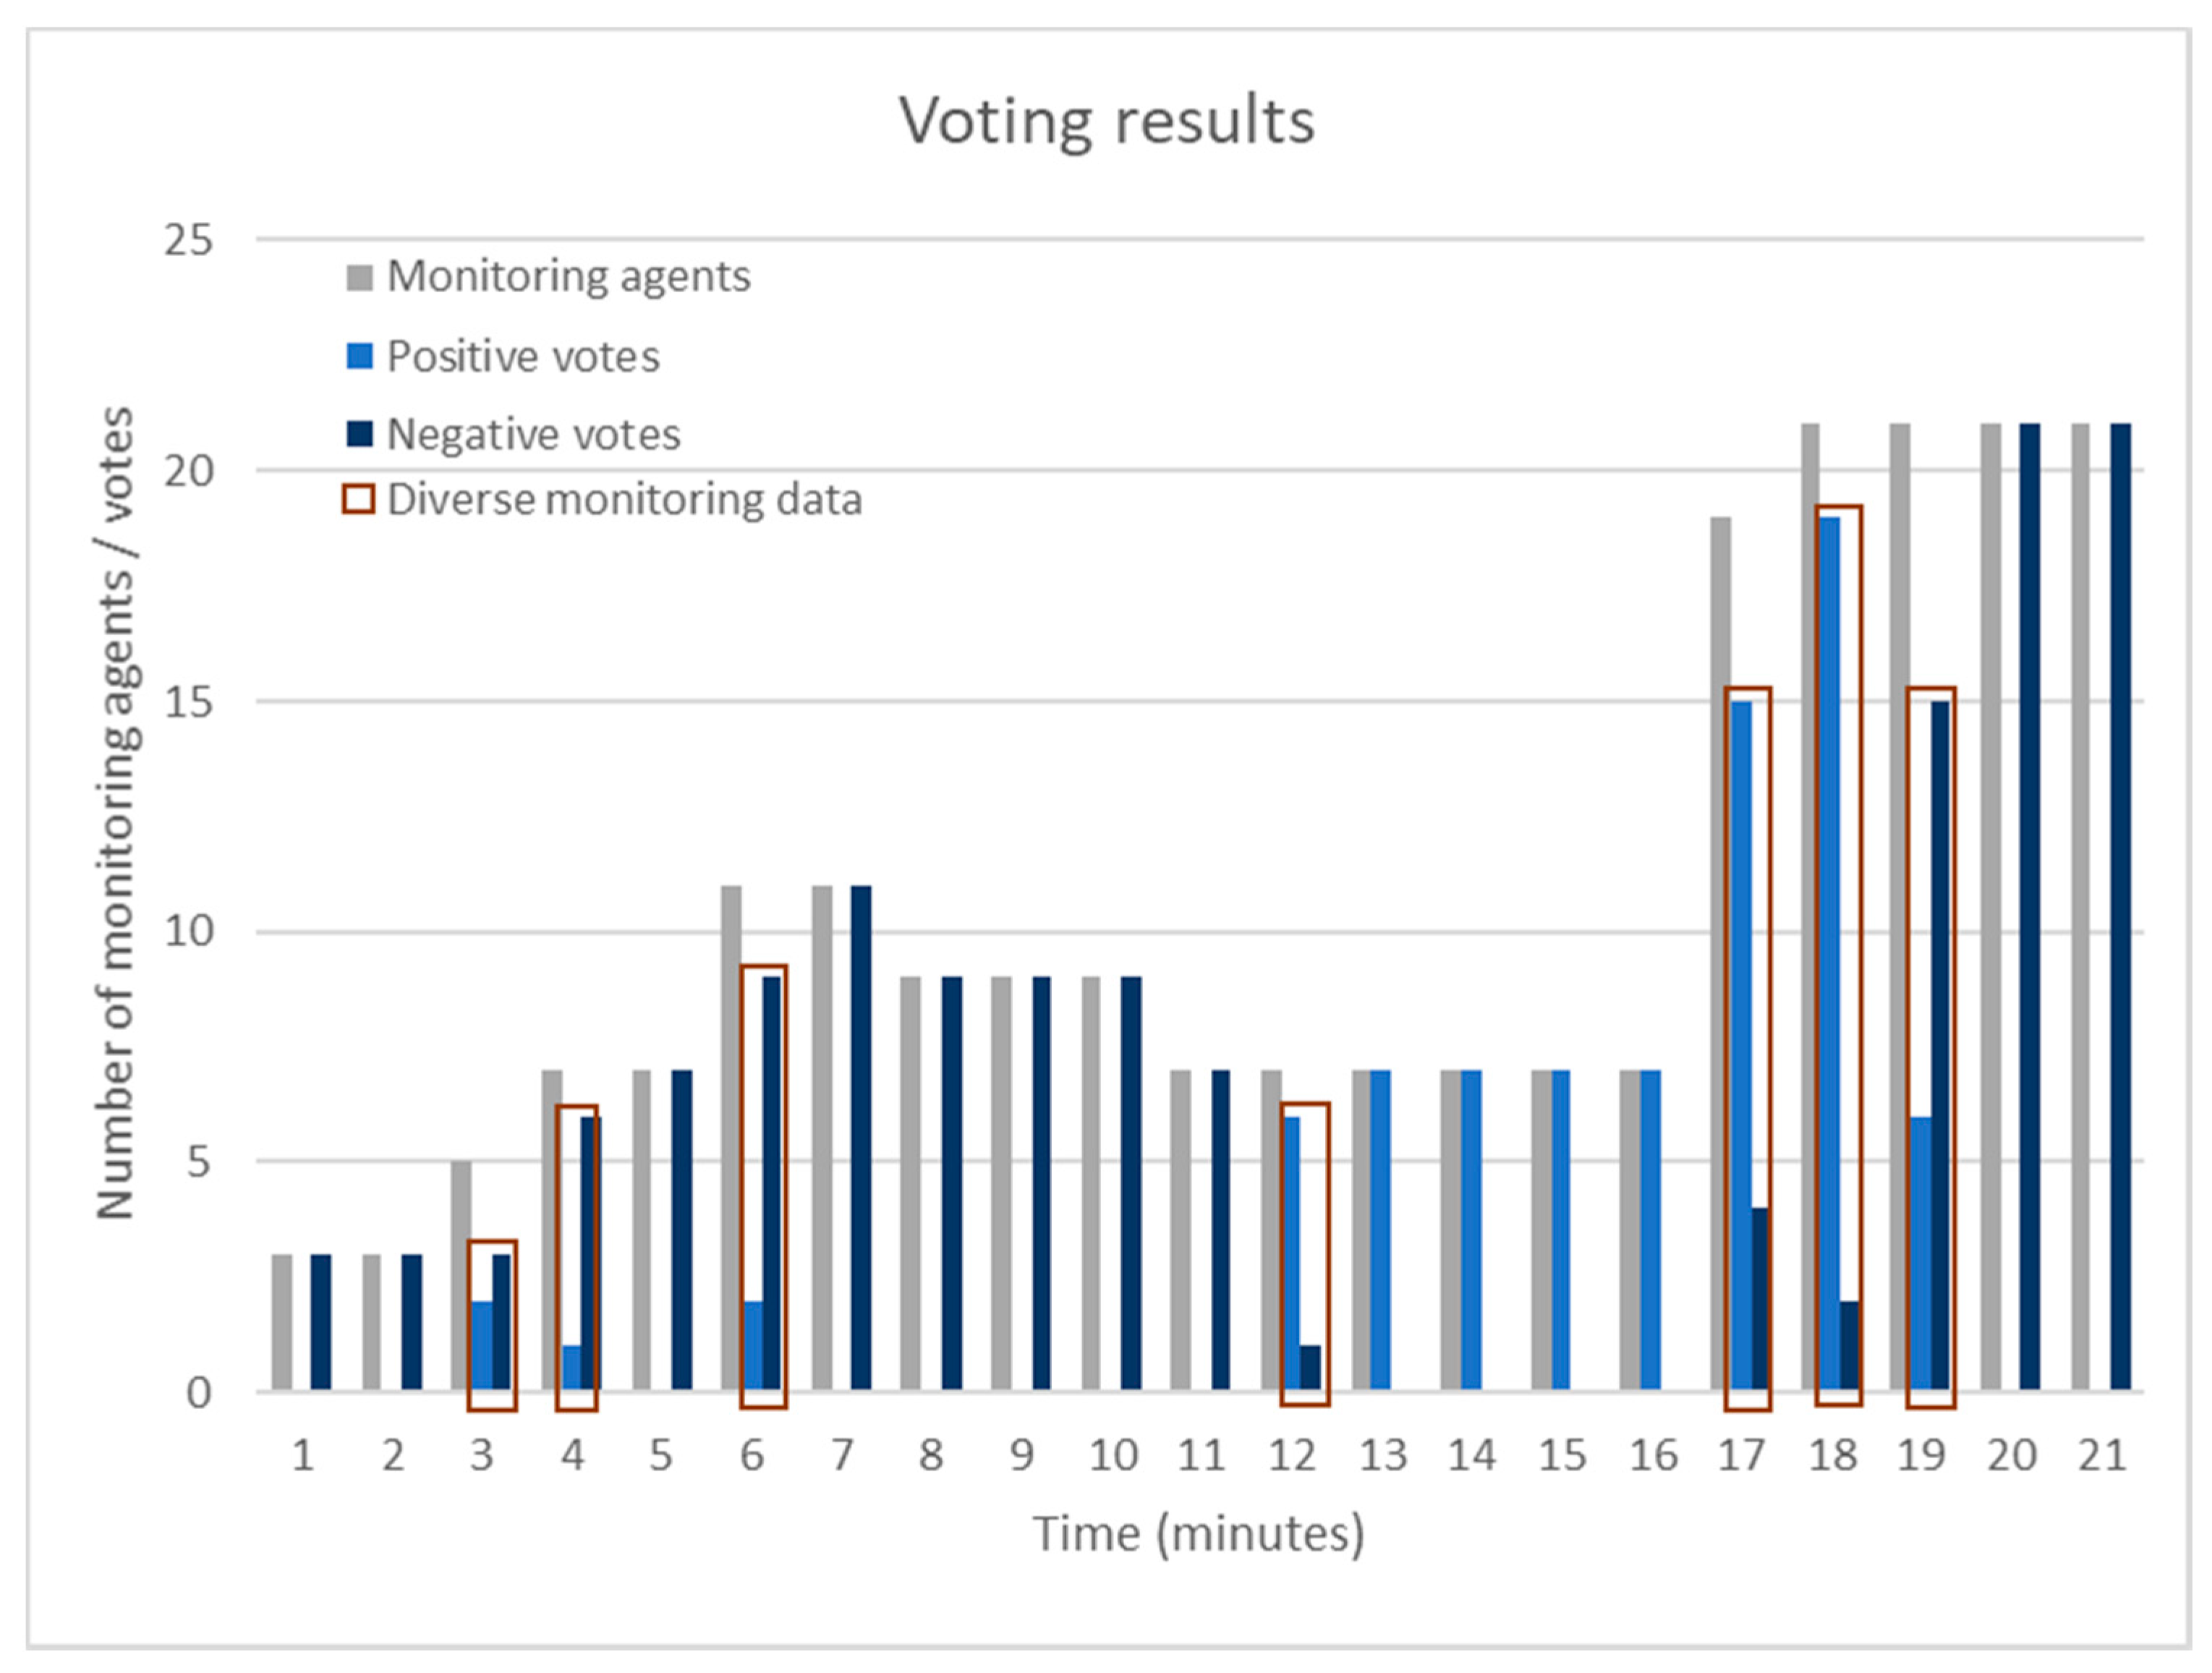
Figure 8.
Correlation between latency and number of voters.


Table 1.
Pseudocode of the failure detection algorithm.
| Pseudocode of the Failure Detection algorithm |
|---|
| Config: = Load_config(path) |
| If Config = nil Crash() |
| Check: = Initialize_DB_with_Config(Config) |
| If !Check then Crash() |
| var currentdbview DBView |
| var updateddbview DBView |
| Check = Update_view_from_DB(&updateddbview)//atomic op |
| If !Check then Crash() |
| currentdbview = updateddbview |
| Dcid: = State.Dcid |
| Go func() { |
| Forever{ |
| Updated: = Update_view_from_DB(&updateddbview) |
| If ! Updated then Crash() else Sleep(Config.Updateinterval) |
| } () |
| }//run concurrently |
| Sleeping:= false |
| Mu: = new Mutex |
| Forever { |
| If !Sleeping then { |
| Mu.lock() |
| currentdbview = updateddbview |
| Mu.unlock() |
| } else { |
| mustcontinue:= true |
| Mu.lock() |
| If currentdbview.Dcid != updateddbview.Dcid { |
| currentdbview = updateddbview |
| mustcontinue = false |
| Sleeping = false |
| } |
| Mu.unlock() |
| If mustcontinue then continue |
| } |
| down,pingattempts: = pinging(¤tdbview) |
| If !down then continue |
| Mu.lock() |
| If currentdbview.Dcid == updateddbview.Dcid { |
| currentdbview = updateddbview |
| } |
| Mu.unlock() |
| decision,votingattempts:=voting(¤tdbview) |
| if decision == 0 then continue//undecided |
| if decision == −1 { Signal_down();Sleeping=true;} } |
Table 2.
Front-end API.
| Method | API | Reply |
|---|---|---|
| GET | /dcstatus | {status: true/false, retries: integer} |
| GET | /sleeping | {sleeping: true/false} |
| GET | /measurements/pingretries | {num: float} |
| GET | /measurements/undecidedvotings | {num: integer} |
| GET | /measurements/falsepositives/internal | {num: integer} |
| GET | /measurements/falsepositives/external | {num: integer} |
| GET | /telemetry/pinglist | {num: integer} |
| GET | /telemetry/votinglist | {num: integer} |
Table 3.
Sample configuration of the failure detection mechanism.
| Sample Configuration of the Failure Detection Mechanism |
|---|
| { |
| “Votingthresh”: 0.5, |
| “Pinger”: {“retries”: 3,”timeout”: 250}, |
| “Voter”: {“retries”: 3,”timeout”: 250}, |
| “Updateinterval”: 1000, |
| “Mongourls”: “mongodb://db1.example.net,db2.example.net:2500/?replicaSet=dcrecovery” |
| “Dcid”: “myfirstdatacenter”, |
| “External_address”: “83.212.239.107”, |
| “Internal_address”: “192.168.1.101”, |
| “Port”: 8201 |
| } |
Table 4.
Configuration parameters.
| Configuration Parameter | Values |
|---|---|
| Update interval (in milliseconds) | Positive Integer, typically 250 |
| Voting threshold | Float, 0 ≤ value ≤ 1, typically 0 |
| Ping retries | Positive Integer, typically 3 |
| Voting retries | Positive Integer, typically 3 |
| Ping timeout (in milliseconds) | Positive Integer, typically 250 |
| Voting timeout (in milliseconds) | Positive Integer, typically 250 |
| Database URLs | string, URLSs of DB replicas (typically 3) |
| Datacenter Identifier | String |
| Internal IP | IPv4 address |
| External IP | IPv4 address |
| REST port | Positive Integer, typically 8201 |
Table 5.
Entries of “indicators” collection in the database.
| Entries of “Indicators” Collection in the Database |
|---|
| { |
| “Dcid”: “myfirstdatacenter”, |
| “External_address”: “83.212.239.107”, |
| “Internal_address”: “192.168.1.101”, |
| “Port”: 8201, |
| } |
Table 6.
Entries of “routing” collection in the database.
| Entries of “Routing” Collection in the Database |
|---|
| { |
| “Source”: 1, |
| “Target”: 2 |
| } |
© 2018 by the author. Licensee MDPI, Basel, Switzerland. This article is an open access article distributed under the terms and conditions of the Creative Commons Attribution (CC BY) license (http://creativecommons.org/licenses/by/4.0/).
Share and Cite
MDPI and ACS Style
Kyriazis, D. Protection of Service-Oriented Environments Serving Critical Infrastructures. Inventions 2018, 3, 62. https://doi.org/10.3390/inventions3030062
AMA Style
Kyriazis D. Protection of Service-Oriented Environments Serving Critical Infrastructures. Inventions. 2018; 3(3):62. https://doi.org/10.3390/inventions3030062
Chicago/Turabian StyleKyriazis, Dimosthenis. 2018. "Protection of Service-Oriented Environments Serving Critical Infrastructures" Inventions 3, no. 3: 62. https://doi.org/10.3390/inventions3030062