A Software Improvement Technique for Platinum Resistance Thermometers


1
Africa Research Center, National Chung Hsing University, Taichung 40227, Taiwan
2
Department of Materials Science and Engineering, University of California, San Diego, CA 92093, USA
3
Department of Bio-industrial Mechatronics Engineering, National ChungHsing University, Taichung 40227, Taiwan
*
Author to whom correspondence should be addressed.
Instruments 2020, 4(2), 15; https://doi.org/10.3390/instruments4020015
Submission received: 30 March 2020
/
Revised: 12 May 2020
/
Accepted: 25 May 2020
/
Published: 27 May 2020
(This article belongs to the Special Issue Smart Measurement Architectures and Autonomous Sensors: Emerging Techniques, Nonlinear Features, Future Trends)
Abstract
:Temperature measurement is essential in industries. The advantages of resistance temperature detectors (RTDs) are high sensitivity, repeatability, and long-term stability. The measurement performance of this thermometer is of concern. The connection between RTDs and a novel microprocessor system provides a new method to improve the performance of RTDs. In this study, the adequate piecewise sections and the order of polynomial calibration equations were evaluated. Systematic errors were found when the relationship between temperature and resistance for PT-1000 data was expressed using the inverse Callendar-Van Dusen equation. The accuracy of these calibration equations can be improved significantly with two piecewise equations in different temperature ranges. Two datasets of the resistance of PT-1000 sensors in the range from 0 °C to 50 °C were measured. The first dataset was used to establish adequate calibration equations with regression analysis. In the second dataset, the prediction temperatures were calculated by these previously established calibration equations. The difference between prediction temperatures and the standard temperature was used as a criterion to evaluate the prediction performance. The accuracy and precision of PT-1000 sensors could be improved significantly with adequate calibration equations. The accuracy and precision were 0.027 °C and 0.126 °C, respectively. The technique developed in this study could be used for other RTD sensors and/or different temperature ranges.
1. Introduction
Temperature measurement is essential in different industries. Temperature sensors that are widely used are thermocouples, thermistors, and resistance temperature detectors (RTDs) [1]. RTDs have a positive temperature coefficient for a metal’s resistance and good stability in various environments, so RTDs are most commonly used for temperature measurement [2,3]. Recently, the Platinum-1000 (PT-1000), with a resistance value of 1000 Ohm at 0 °C, was developed to enhance its sensitivity. The relationship between PT-1000 resistance and temperature has been published [4]. The Callendar-Van Dusen (CVD) equation is usually used to express the relationship between resistance and temperature [3]. In practical application, the major problem using this sensor is the linearization of the relationship between temperature and resistance.
To enhance the accuracy of the RTDs, three linearization methods are proposed: direct solving of the Callendar-Van Dusen equation, a single linear approximation method, and a piecewise linear approximation method [5]. The method of solving the Callendar-Van Dusen equation is widely used. However, it requires solving the high-order polynomial equation. A single linear approximation method is the least accurate and can only be used for a small temperature range. The piecewise linear approximation method involves look-up of a temperature table and solving of the approximation results by an interpolation method, with the longest execution time.
The use of hardware design to linearize the nonlinear signal has been proposed by researchers. Sanyal et al. [6] described an analog signal conditioning circuit by operating an amplifier based on a logarithmic circuit. Pradhan and Sen [7] reported a lead compensation technique for three-wire resistance temperature detectors, and the accuracy of this technique was within 0.1%. Sen [8] presented a new lead wire compensation technique for two-wire RTDs, and this technique could reduce the effect of the lead resistance. Chauhan and Neelakantan [9] introduced a novel current excited signal processing mechanism for the RTD PT-1000 sensor but the authors did not mention the performance. Trump [10] proposed a correlation of the excitation current technique to reduce the linearized error for PT-100, and the errors were approximately 2% for a 500 °C span.
Yang et al. [11] evaluated four interpolation equations for RTDs in the temperature range between 0 °C and 500 °C and found that the 3rd and 4th order polynomial equations had better accuracy as the calibration range was >240 °C. Sarkar [12] used a second-order polynomial equation as the calibration equation of an RTD sensor for temperature range −100 °C to 100 °C, and the absolute error of this calibration equation was >10 °C. Carvalhaes-Dias et al. [13] introduced a new technique to linearize resistance temperature detectors by a discrete Brokaw bandgap reference cell and reduced the nonlinearity errors from 1.07 °C to 0.14 °C in the 0–85 °C temperature range.
With the advancements in electronics, novel integrated circuit have become available with higher operating speed, less computing time, and lower cost. The execution time for solving the complex higher-order polynomial equation is decreased. Recently, many types of data loggers have a programmable function, which gives the opportunity to improve the accuracy of the temperature measurement with nonlinear calibration equations. Sarma and Boruah [14] reported a high-precision thermocouple with a 9th-order polynomial equation. Chen [15] compared several calibration equations for four types of thermistors. Chen and Chen [16] evaluated adequate piecewise polynomial equations for thermocouples of T and K types with the use of regression analysis. Mirza [17] compared the predicted accuracy for linear, 2nd, and 3rd polynomial calibration equations in the temperature range between 0 °C and 859 °C and found nonlinear errors still existed.
The Callendar-Van Dusen Equation is usually used with industrial platinum resistance thermometers (PRTs) [2,3]. As the temperature is above 0 °C, the form of this equation is:
where Rs is the measured resistance, R0 is the resistance at 0 °C, Ts is the standard temperature, A = 3.9083°C−1, and B = −5775°C−2
Rs = R0 (1 + ATs + BTs2)
When the resistance of RTD elements was measured, two solutions were given:
If higher order polynomial equations were used, the temperature calculation is more complex.
Childs et al. [3] reported the error was less than 0.4 °C for the linear calibration equation in the temperature range from 0 to 100 °C. Cushing [18] stated that the accuracy of RTDs could be improved by transmitter–sensor matching with the adjustment of measured errors in the transmitter. However, each combination of sensor and transmitter need to be adjusted individually. Preston-Thomas [19] mentioned that a 15th-order polynomial equation was necessary to obtain the requirement of the high precision.
In this study, we evaluated the fitting-agreement of the inverse Callendar-Van Dusen (CVD) equation for the relationship between the resistance of PT-1000 and temperature according to IEC751/ ITS-90 [4]. We measured the resistance of one kind of PT-1000 sensor at the standard temperature measured by a thermometer embedded in the calibrator and evaluated the adequate calibration equations with the use of regression analysis. An inverse calibration equation was adopted to express the relationship between the temperature and resistance of platinum. The software with these calibration equations was then embedded into a microprocessor of the data logger. The independent datasets of the measured resistance and standard temperature were used to evaluate the predication performance of this method. The validated temperatures were calculated by previous established calibration equations and compared with the standard temperatures maintained by a temperature calibrator. The improvement of the accuracy and precision with adequate calibration equation was evaluated. A measurement system of the software improvement technique for the platinum resistance thermometer was proposed and validated.
2. Materials and Methods
2.1. Calibration Equations
An inverse calibration equation was used to describe the relationship between the temperature (Ts) and resistance (Rs) of Platinum. The standard temperature is the dependent variable, and the measured resistance is the independent variable, that is, the RTD temperature is expressed as a function of its resistance.
where c0, c1, c2 to cK are constants.
Ts = c0 + c1 Rs + c2 Rs2 + + + cK Rsk
This technique was used by Looney [5] in the temperature range from −200 °C to 0 °C.
The inverse CVD equation is as follows:
where d0, d1, and d2 are constants.
Ts = d0 + d1 Rs + d2 Rs2
2.2. PRTs Sensor
The AK-HS PT-1000 sensor (Danfoss Co., Ltd., Nordberg, Denmark) was used to establish these calibration equations and evaluate the predictive performance of the equations. According to the manufacturer’s specification, the measured range was from −30 °C to 50 °C for the AK-HS PT-1000 sensor.
2.3. Standard Temperature
The temperature maintained by a temperature calibrator (TC-2000, Scan-Sense As, Norway) was used as the standard temperature for calibration. The specifications of this equipment were listed as follows: accuracy of ± 0.009% of the reading, resolution 0.01 °C, temperature range −40 °C to +150 °C, temperature gradient, < 0.06 °C at 95 °C, stability ± 0.005 °C, best achievable uncertainty < 0.03 °, and well depth and diameter 50 and 155 mm, respectively.
2.4. Experimental Procedure
The flowchart of the experiment is presented in Figure 1.
The platinum sensor was placed in the temperature chamber of the TC-2000 calibrator. The chamber was filled with oil to keep the temperature stable. The calibration temperature ranged from 0 °C to 50 °C. Each temperature had five replicates. The total number of calibration points was 204. The resistance of this sensor was recorded by a data logger (Data Taker DT85, Dundee, Scotland, UK). By rapidly sampling the function of the data logger, the interval of the sampling was set at 0.2 s, that is, five data points were sampled at 1 s, and the average value within 1 second sampling was used. Then, the relationship between standard temperatures (Ts) and the resistance value (Rs) was established with regression analysis.
To validate the predictive performance of the calibration equations, the independent dataset was used. The other dataset for validation included the measured resistance (Rtv) detected at standard temperature (Tsv). These calibration equations were written as the software embedded in the Data Taker data logger. The temperature (Tr) calculated by these calibration equations that were the function of the sensor resistance was indicated directly by the data logger. The difference between Tsv and Tr was used as the quantitative criterion to evaluate the predictive performance.
2.5. Data Analysis
Two datasets were evaluated: the relationship between the resistance of PT-1000 and temperature according to IEC751/ITS-90 [5] and the measured data between the resistance of the AK-HS PT-1000 sensor and standard temperature.
The software, SigmaPlot Ver. 12.2, was used to estimate the parameters of the different order polynomial equations. In these equations, Ts is the dependent variable and Rs is the independent variable. Residual plots were used as the qualitative criterion to assess the adequacy of the models. The estimated values of the standard error, s, were used as the quantitative criteria. The statistic method, t-test, based on t-values of the highest-order parameter, was used to justify the optimal order of polynomial equations.
The error for assessing the predictive ability was defined as follows:
where i represents the ith results of each measurement, ei is the predictive error of the calibration, Tsvi is the standard temperature, and Tri is the temperature calculated by calibration equations.
ei = Tsvi − Tri
The maximum ei, emax, and minimum ei values, emin were the criteria for extreme value of errors.
The ave value was used to evaluate the accuracy of calibration equations. The smaller ave, the better of the accuracy.
where is the absolute value of ei and n is the number of data points.
estd was used to evaluate the precision of the calibration equation.
3. Results
3.1. The Resistance of PT-1000 and Temperature According to IEC751/ ITS-90
The distribution of the temperature data for standard temperature versus resistance of the PT-1000 sensor is presented in Figure 2.
The estimated parameters and statistics of regression analysis are listed in Table 1.
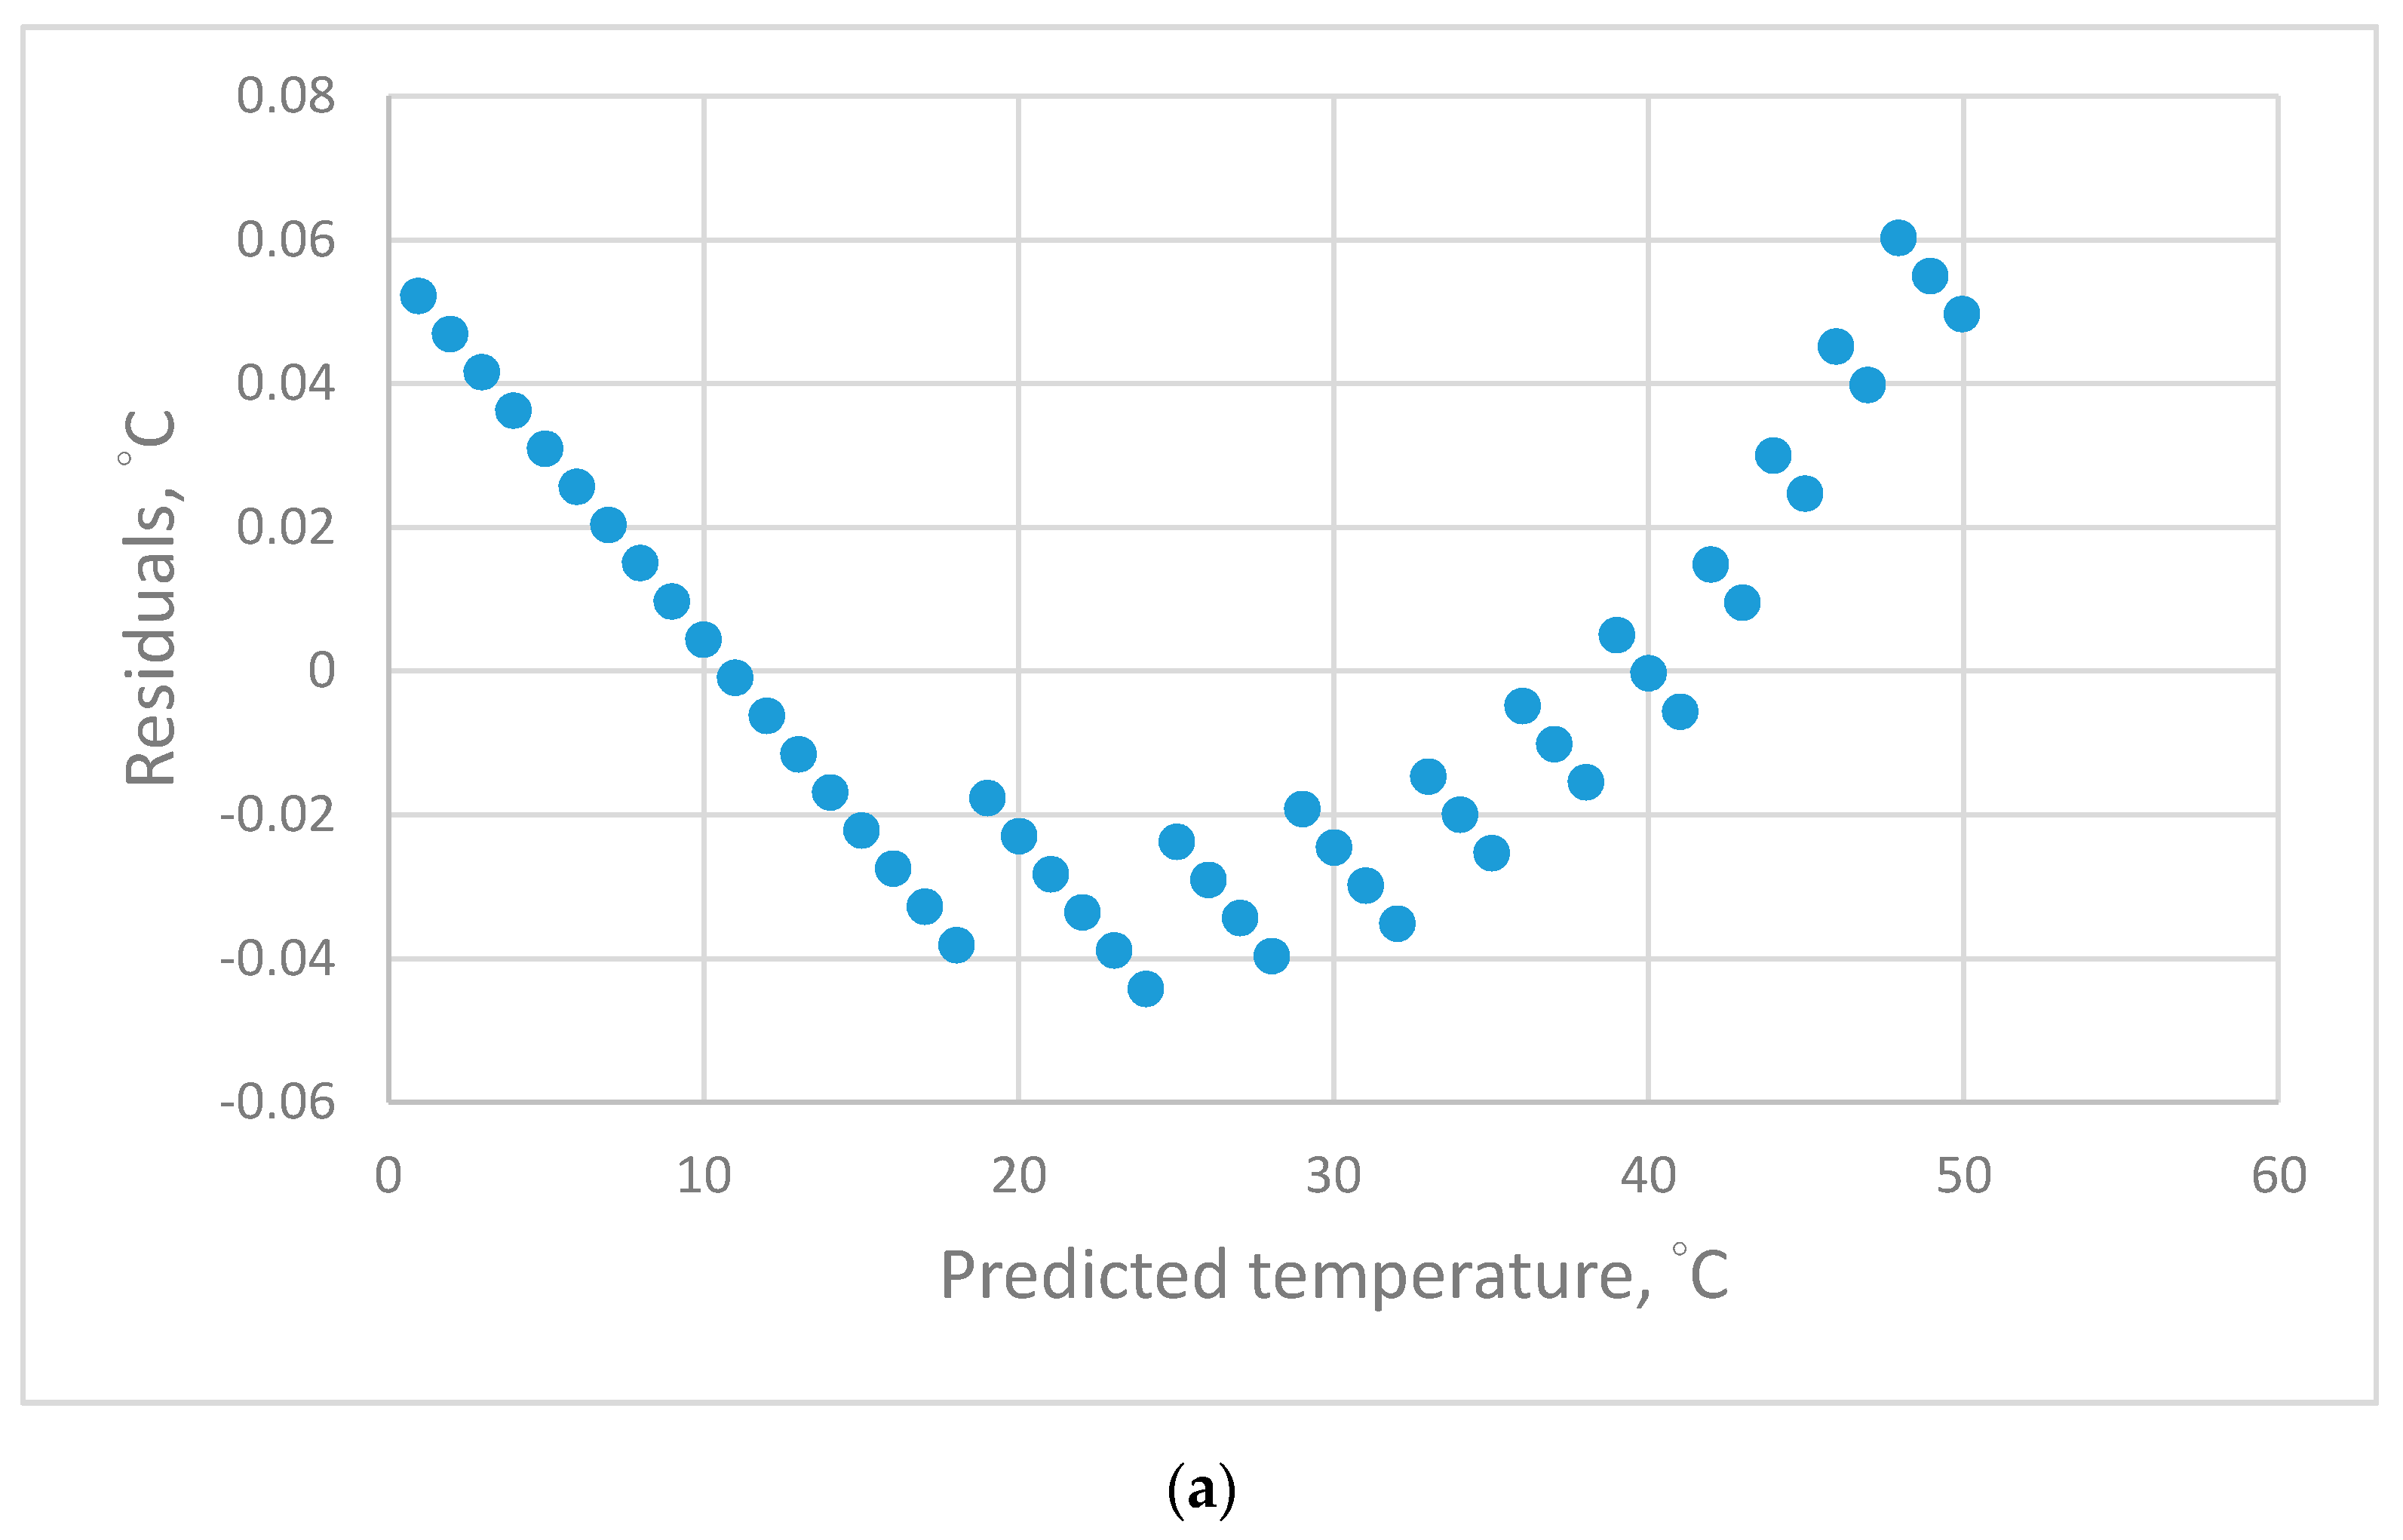
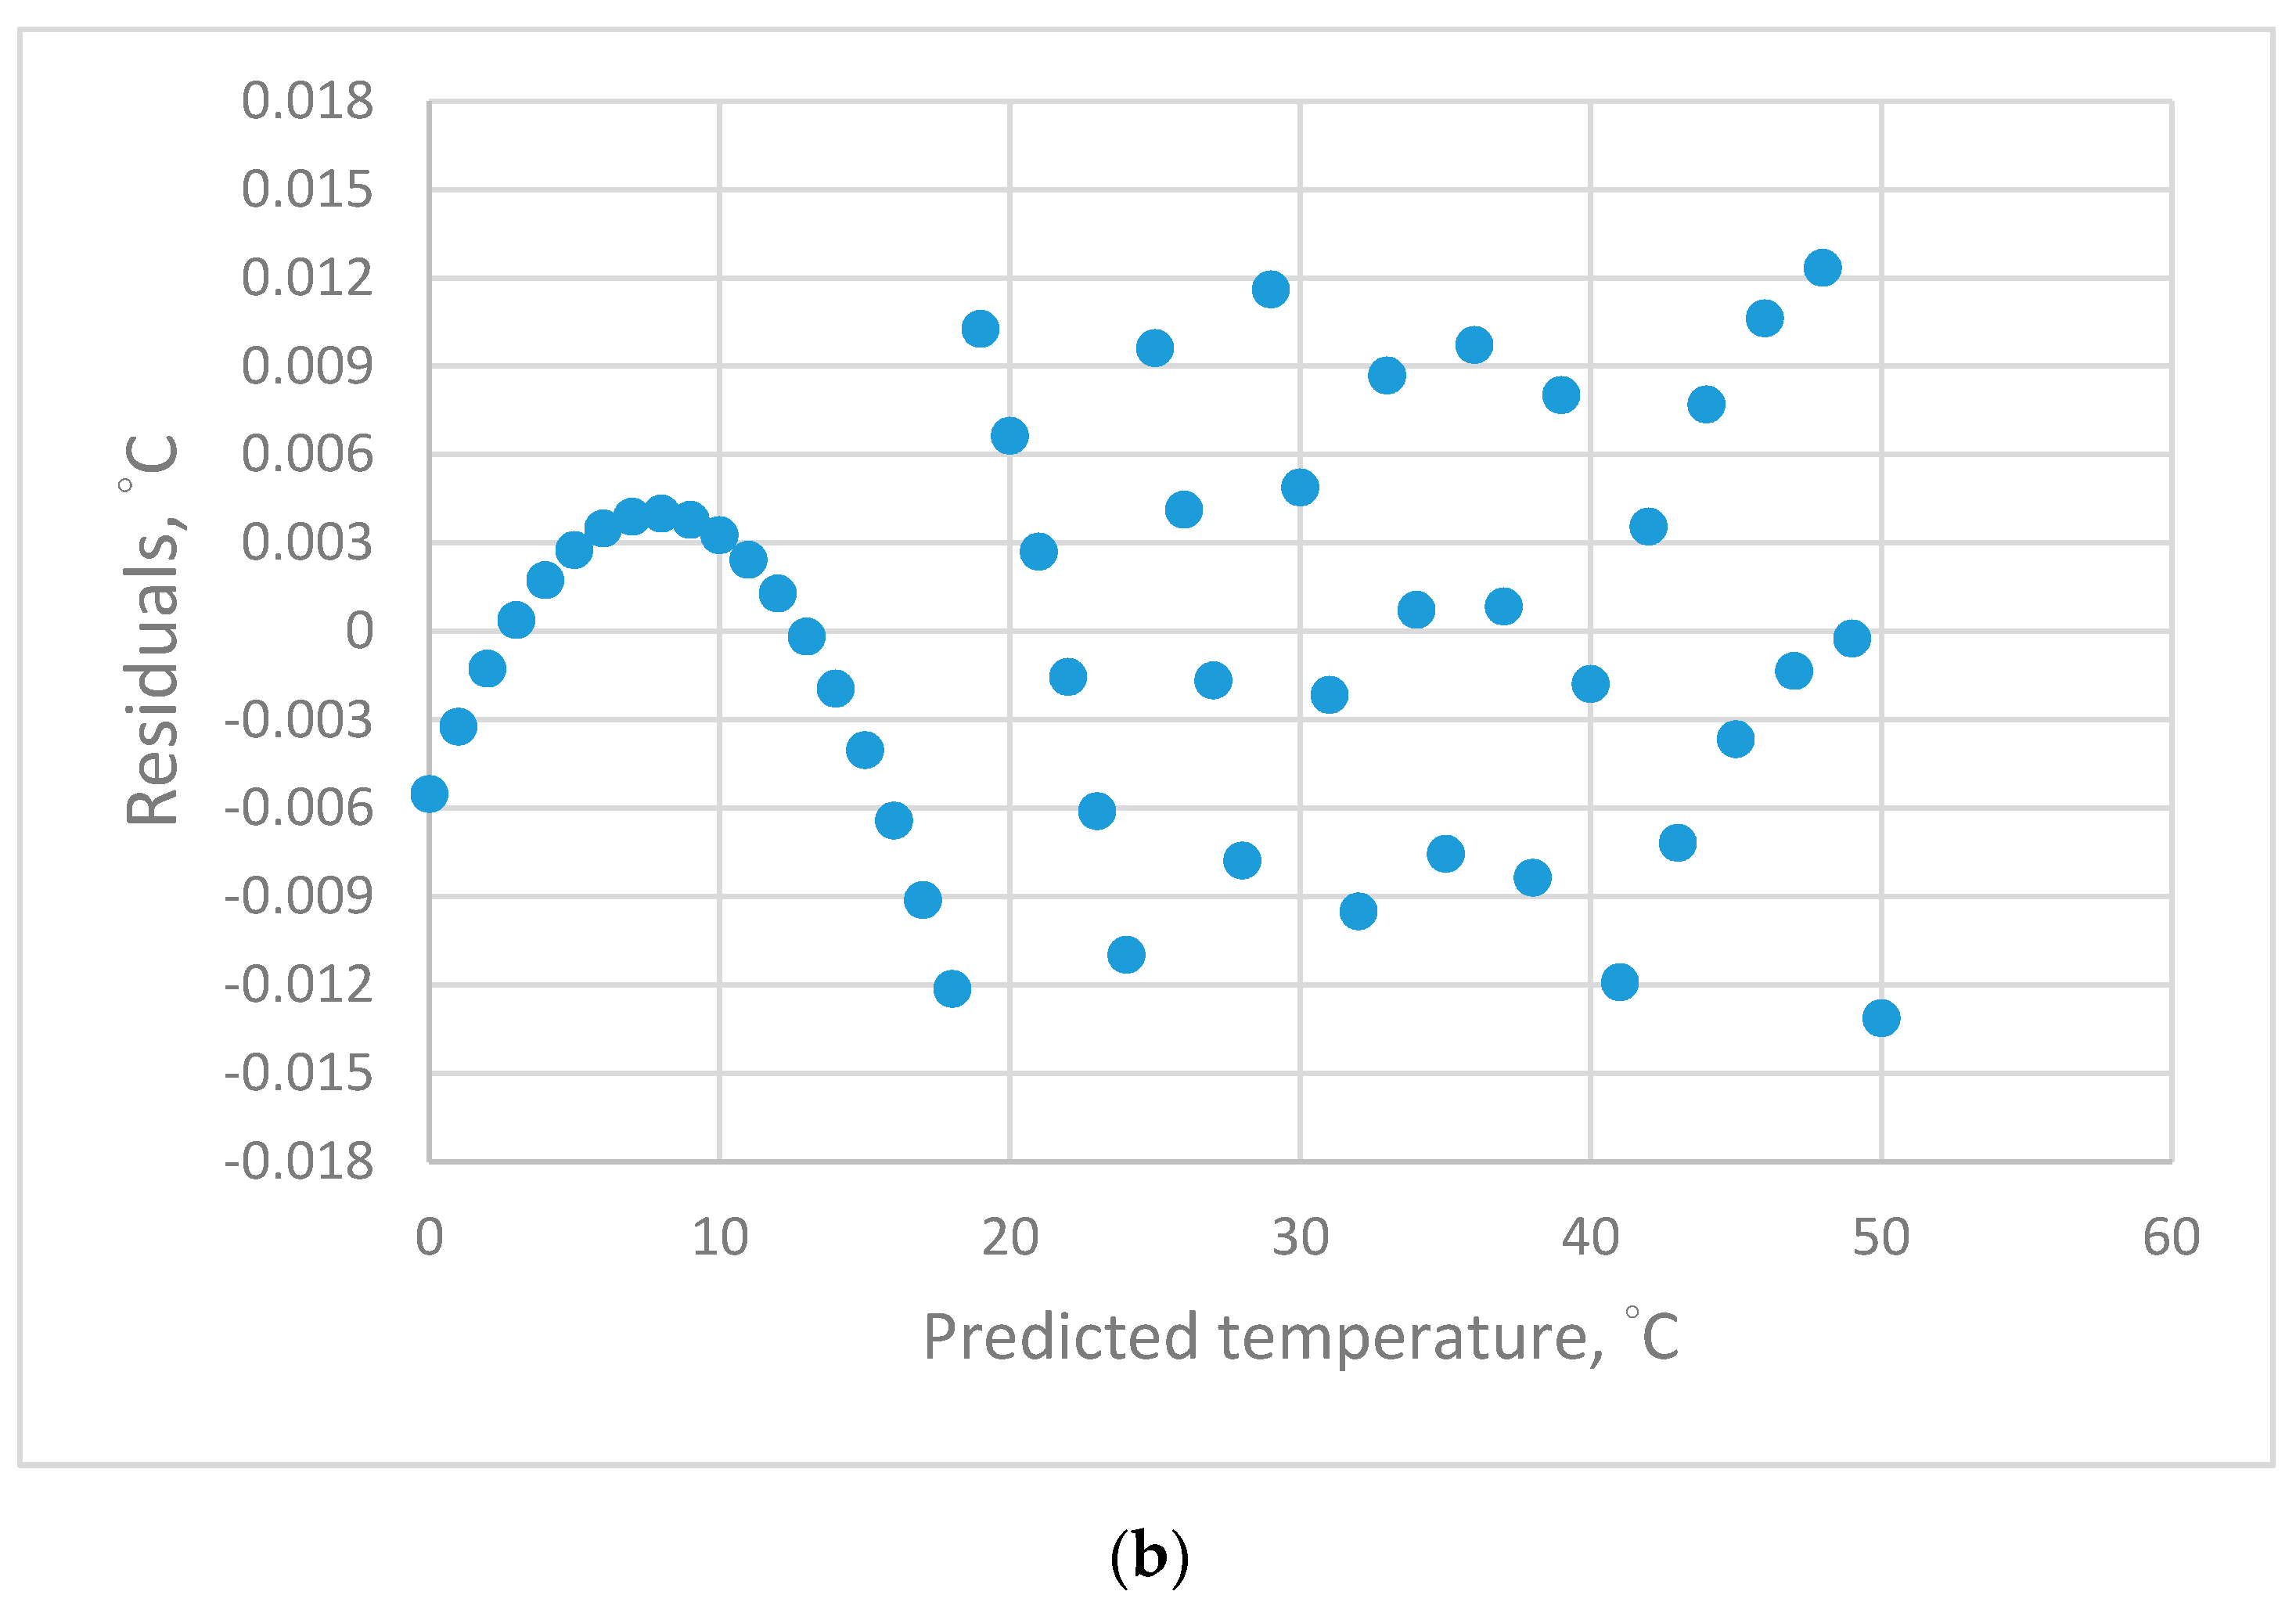
The residual plots of the calibration equations of different-order polynomial equations are in Figure 3. The linear Figure 3a equations produced a systematic distribution of residual plots. These equations were the least accurate in comparison with the high-order polynomial equations over the temperature ranges from 0 to 50 °C. The 2nd- Figure 3b and 3rd (not presented)-order polynomial equations present a systematic distribution of residual plots in the temperature range < 18 °C and random distribution of residual plots in the temperature range > 18 °C. The 2nd-order polynomial equation is the form of the inverse CVD equation. That is, higher-order polynomial equations could not solve the problem of the systematic distribution of residual plots in the temperature range < 18 °C.
The piecewise calibration method was used to solve this problem of fixed error patterns. Two calibration equations were used in different temperature ranges. The estimated parameters and statistics of regression analysis are listed in Table 2. The 2nd-order polynomial equation for two sections of temperature ranges presented the random distribution of residual plots (not presented in the text).
3.2. AK-HS PT-1000 Sensor
3.2.1. Establishment of Calibration Equations for the AK-HS PT-1000 Sensor
The estimated parameters and statistics of regression analysis are listed in Table 3. From the t-values for these estimated values of calibration equations, the 3rd-order polynomial equation was the adequate calibration equation.
The quantitative parameters used for evaluating the four calibration equations are presented in Table 4.
The 2nd-order polynomial equations (the inverse CVD equation) had the largest absolute emin, emax, ave, and estd values. The result indicated that the performance of this equation was not the adequate model for these equations. The 3rd-order polynomial equations of the two temperature ranges had smaller absolute emin and emax values than those for all temperature ranges. The ave values represent the accuracy of the equation. The ave values for the 3rd-order polynomial equations in the temperature ranges 0–18 °C and 18–50 °C were 0.030 and 0.024, respectively. The estd values represent the precision of the equation. The estd values for the 3rd-order polynomial equations in the temperature ranges 0–18 °C and 19–50 °C were 0.024 and 0.017, respectively. The calibration equations of the two sections presented the smallest ave and estd values. The result indicated that both equations had better accuracy than that of other equations. The piecewise polynomial equations have been used successfully for two types of thermocouples [16]. In this study, the piecewise 3rd-order polynomial equations in different temperature ranges could improve the measurement performance of the RTD significantly.
3.2.2. Validation of the Prediction Performance of the AK-HS PT-1000 Sensor
Independent measurement was performed to validate the predictive performance of these calibration equations. The results of the validation of the four calibration equations are listed in Table 5. The distribution of predictive errors versus standard temperatures for calibration equations was used to evaluate the predictive ability.
The inverse CVD equation had the worst predictive performance. The 2nd-order polynomial equation (the inverse CVD equation) in the temperature range 0–50 °C had the largest emin, emax, ave, and estd values. The ave values for the 3rd-order polynomial equation in the temperature ranges 0–18 °C and 19–50 °C were 0.027 and 0.024, respectively. The calibration equations of the two piecewise temperature ranges had better accuracy.
The estd values for the 3rd-order polynomial equation in the temperature ranges 0–18 °C and 19–50 °C were 0.019 and 0.015, respectively. Herein, the calibration equations of the two piecewise temperature ranges had better precision performance.
4. Discussion
The results of this study indicated that the 2nd-order polynomial equation had a fixed pattern of residual distribution in the temperature range from 0 to 18 °C. The accuracy and precision of the PT-1000 could be improved significantly with two adequate calibration equations in different temperature ranges. Comparing Table 4 and Table 5, the ave and estd values of the two piecewise polynomial equations were lower than those of the calibration equation in the full temperature range. The results indicated that the piecewise polynomial equation technique could improve the PT-1000 sensor measurement significantly. The respective accuracy and precision were 0.027 °C and 0.019 °C for the PT-1000 sensor. The performance of the PT-1000 sensor that was improved by the 3rd-order polynomial equation is listed in Table 6.
From the literature, the accuracy of the RTDs presented by Childs et al. [3] and Carvalhaes-Dias et al. [13] was 0.4 °C and 0.14°C, respectively. The results of this study listed in Table 6 showed a significant improvement.
The accuracy of the calibration equations improved if the measured range decreased. The more piecewise sections, the better the accuracy of the calibration equations. However, the software will be more complex if the piecewise sections of calibration curves are increased. In this study, two sections of calibration equations were evaluated with the residual plots of regression analysis. The adequate order of polynomial equations was established based on t-values of the highest-order parameter.
In the traditional method, the resistance of RTD elements was measured with Wheatstone bridge and then converted into voltage values [5]. These voltage values were transformed into digital values for further calculation, and linearization was the main problem for enhancing accuracy [9,10]. In this study, the resistance of PT-1000 was measured by using a data logger, and the measurement temperature could be calculated by the inverse calibration equation previously established by regression analysis. This calibration equation was software embedded in the data logger. This method provided a simple way to enhance the performance of RTD elements for temperature measurement.
For the RTD linearization technique, the method of solving the CVD equation is usually used. The limitation of this technique is that it is extremely processor intensive and time consuming [5]. In the inverse calibration equation, the temperature is the function of the measured resistance of the RTD sensor. With the development of microprocessor systems, the software for these higher-order polynomial calibration equations is easy to embed in the ROM of the microcomputer. The measured temperature could be calculated directly with an adequate calibration equation. The technique could be applied with hard modules to serve as a smart sensor.
The piecewise polynomial equation was an effective way to improve the measurement performance of the PT-1000 sensor. The piecewise linear interpolation of thermistors was executed by the software of the PwLi algorithm [20]. In the tutorial of the temperature measurement with RTDs [21], the RTDs were connected with specific modules and three types of software, LabVIEW, LabWindows and NI-DAQ, were used to monitor the voltages and calculate the temperature by the Callender-Var Dusen equation. However, this is a complex process.
Comparing with the past, IC has higher operating speed and is cheaper. The calculation time of the complex higher-order polynomial equations is decreased. A cheap microcomputer, such as raspberry pi, has been commercialized. This provides the opportunity to improve the accuracy of the temperature measurement with higher-order polynomial equations. The programmable data logger provides a way to measure the temperature with RTDs simply and accurately.
The method used in this study could be applied to evaluate adequate calibration equations for other RTDs with different temperature ranges. With programmable data loggers, accurate temperature measurement with RTDs is easy to perform.
5. Conclusions
The temperature–resistance data of the platinum sensors in the range from 0 °C to 50 °C were measured to evaluate and validate the establishment of adequate calibration equations. The estimated values of the calibration equation parameters and statistics were established with regression analysis. The qualitative criterion was the residual plots. The qualitative criteria included the average of the absolute errors for accuracy and the standard deviation of the errors for precision.
In this study, the resistance of the PT-1000 sensor under a standard temperature environment in the range from 0 °C to 50 °C was detected. The first dataset was used to establish adequate calibration equations which were evaluated with use of regression analysis. The 3rd-order polynomial equation was the adequate equation for PT-1000 sensors in different temperature ranges. The second dataset included the measured resistance and standard temperature used to evaluate the predication performance of data loggers. The accuracy and precision of the platinum resistance temperature sensor could be improved significantly with two piecewise calibration equations. The respective accuracy and precision were 0.027 °C and 0.019 °C for the PT-1000 sensor.
With programmable data loggers, adequate calibration equations were provided by the software embedded in the measure device. The technique developed in this study showed the use of a software improvement technique for PRTs. This technique could be used for other RTD sensors with different temperature ranges. Accurate temperature measurement with RTDs is easy to perform.
Author Contributions
A.C.; drafted the proposal, executed the statistical analysis, interpreted the results, and revised the manuscript. H.-Y.C.; performed experiments and interpreted some results. C.C.; reviewed the proposal, performed some experiments, interpreted some results, and criticized the manuscript and participated in its revision. All authors have read and approved the final manuscript.
Funding
This research received no external funding.
Acknowledgments
The authors would like to thank the Ministry of Science and Technology of the Republic of China for financially supporting this research under Contract No. MOST -107-2313-B-005-012.
Conflicts of Interest
The authors declare no conflict of interest.
References
- Pallas-Areny, R.; Webster, J.G. Sensors and Signal Conditioning; John Wiley & Sons, Inc.: New York, NY, USA, 1997. [Google Scholar]
- Nicholas, J.V.; White, D.R. Traceable Temperatures; John Wiley & Sons, Inc.: New York, NY, USA, 1994. [Google Scholar]
- Childs, P.R.N.; Greenwood, J.R.; Long, C.A. Review of temperature measurement. Rev. Sci. Instrum. 2000, 71, 2959–2978. [Google Scholar] [CrossRef] [Green Version]
- Kongsberg, M. As International Electrotechnical Commission standard IEC 60751: Industrial Platinum Resistance Thermometers and Platinum Temperature Sensors. 2008. Available online: https://www.km.kongsberg.com/ks/web/nokbg0397.nsf/AllWeb/A707D00EE0F558D6C12574E1002C2D1C/$file/tsiec751_ce.pdf (accessed on 31 January 2020).
- Looney, M. RTD Interfacing and Linearization Using an ADuC706x Microcontroller, Analog Devices Application Note AN-0970 1-16. Available online: http://www.analog.com/media/en/technical-documentation/application-notes/AN-0970.pdf (accessed on 31 December 2019).
- Sanyal, N.; Bhattacharyya, B.; Munshi, S. An analog non-linear signal conditioning circuit for constant temperature anemometer. Measurement 2006, 39, 308–311. [Google Scholar] [CrossRef]
- Pradhan, S.; Sen, S. An improved lead compensation technique for three-wire resistance temperature detectors. IEEE Trans. Instrum. Meas. 1999, 48, 903–906. [Google Scholar] [CrossRef]
- Sen, S.K. An improved lead wire compensation technique for conventional two wire resistance temperature detectors (RTDs). Measurement 2006, 39, 477–480. [Google Scholar] [CrossRef]
- Chauhan, J.; Neelakantan, U. An experimental approach for precise temperature measurement using platinum RTD PT1000. In Proceedings of the International Conference on Electrical, Electronics and Optimization Techniques (ICEEOT), Chennai, India, 3–5 March 2016. [Google Scholar]
- Trump, B. Analog linearization of resistance temperature detectors. Analog Appli. J. 2011, 4, 21–24. [Google Scholar]
- Yang, I.; Gam, K.S.; Kim, Y. Interpolating equation of industrial platinum resistance thermometers in the temperature range between 0 °C and 500 °C. Meas. Sci. Technol. 2015, 26, 035104. [Google Scholar] [CrossRef]
- Sarkar, S. Platinum RTD sensor based multi-channel high precision temperature measurement system for temperature range −100 °C to +100 °C using single quartic function. Cogent Engin. 2018, 5, 1558687. [Google Scholar] [CrossRef]
- Carvalhaes-Dias, P.; Ferreira, I.P.; Duarte, L.F.C.; Morais, F.J.O.; Siqueira Dias, J.A. Using the non-linear behavior of the Brokaw bandgap voltage reference cell to linearize resistance temperature detectors (RTD). Sens. Transducers 2019, 229, 61–67. [Google Scholar]
- Sarma, U.; Boruah, P.K. Design and development of a high precision thermocouple based smart industrial thermometer with on line linearisation and data logging feature. Measurement 2010, 43, 1589–1594. [Google Scholar] [CrossRef]
- Chen, C. Evaluation of resistance-temperature calibration equations for NTC thermistors. Measurement 2009, 42, 1103–1111. [Google Scholar] [CrossRef]
- Chen, A.; Chen, C. Evaluation of piecewise polynomial equations for two types of thermocouples. Sensors 2013, 13, 17084–17097. [Google Scholar] [CrossRef] [PubMed] [Green Version]
- Mirza, S. High-Accuracy Temperature Measurements Call for Platinum Resistance Temperature Detectors (PRTDs) and Precision Delta-Sigma ADCs. Maxim Integrated Products Application Note 4875. Available online: http://www.maxim-ic.com/an4875 (accessed on 31 December 2019).
- Bentley, J.P. Principles of Measurement Systems, 4th ed.; Pearson Education: Essex, UK, 2005. [Google Scholar]
- Cushing, M. Advances in Process Temperature Measurement: Trends and Technologies. Chem. Eng. N. Y. 2015, 122, 42–45. [Google Scholar]
- Preston-Thomas, H. The International Temperature Scale of 1990 (ITS-90). Metrologia 1990, 27, 3–10, 107. [Google Scholar] [CrossRef]
- Day, J.; Bible, S. Piecewise Linear Interpolation on PIC12/14/16 Series Microcontrollers. Microchip AN942. Available online: http://ww1.microchip.com/downloads/en/AppNotes/00942A.pdf (accessed on 31 December 2019).
Figure 1.
Flowchart of the experiment. Ts is the standard temperatures, Rs is the resistance, Rtv is the measured resistance for validation, Tsv is the standard temperature for validation, Tr is the temperature calculated by these calibration equations.
Figure 1.
Flowchart of the experiment. Ts is the standard temperatures, Rs is the resistance, Rtv is the measured resistance for validation, Tsv is the standard temperature for validation, Tr is the temperature calculated by these calibration equations.
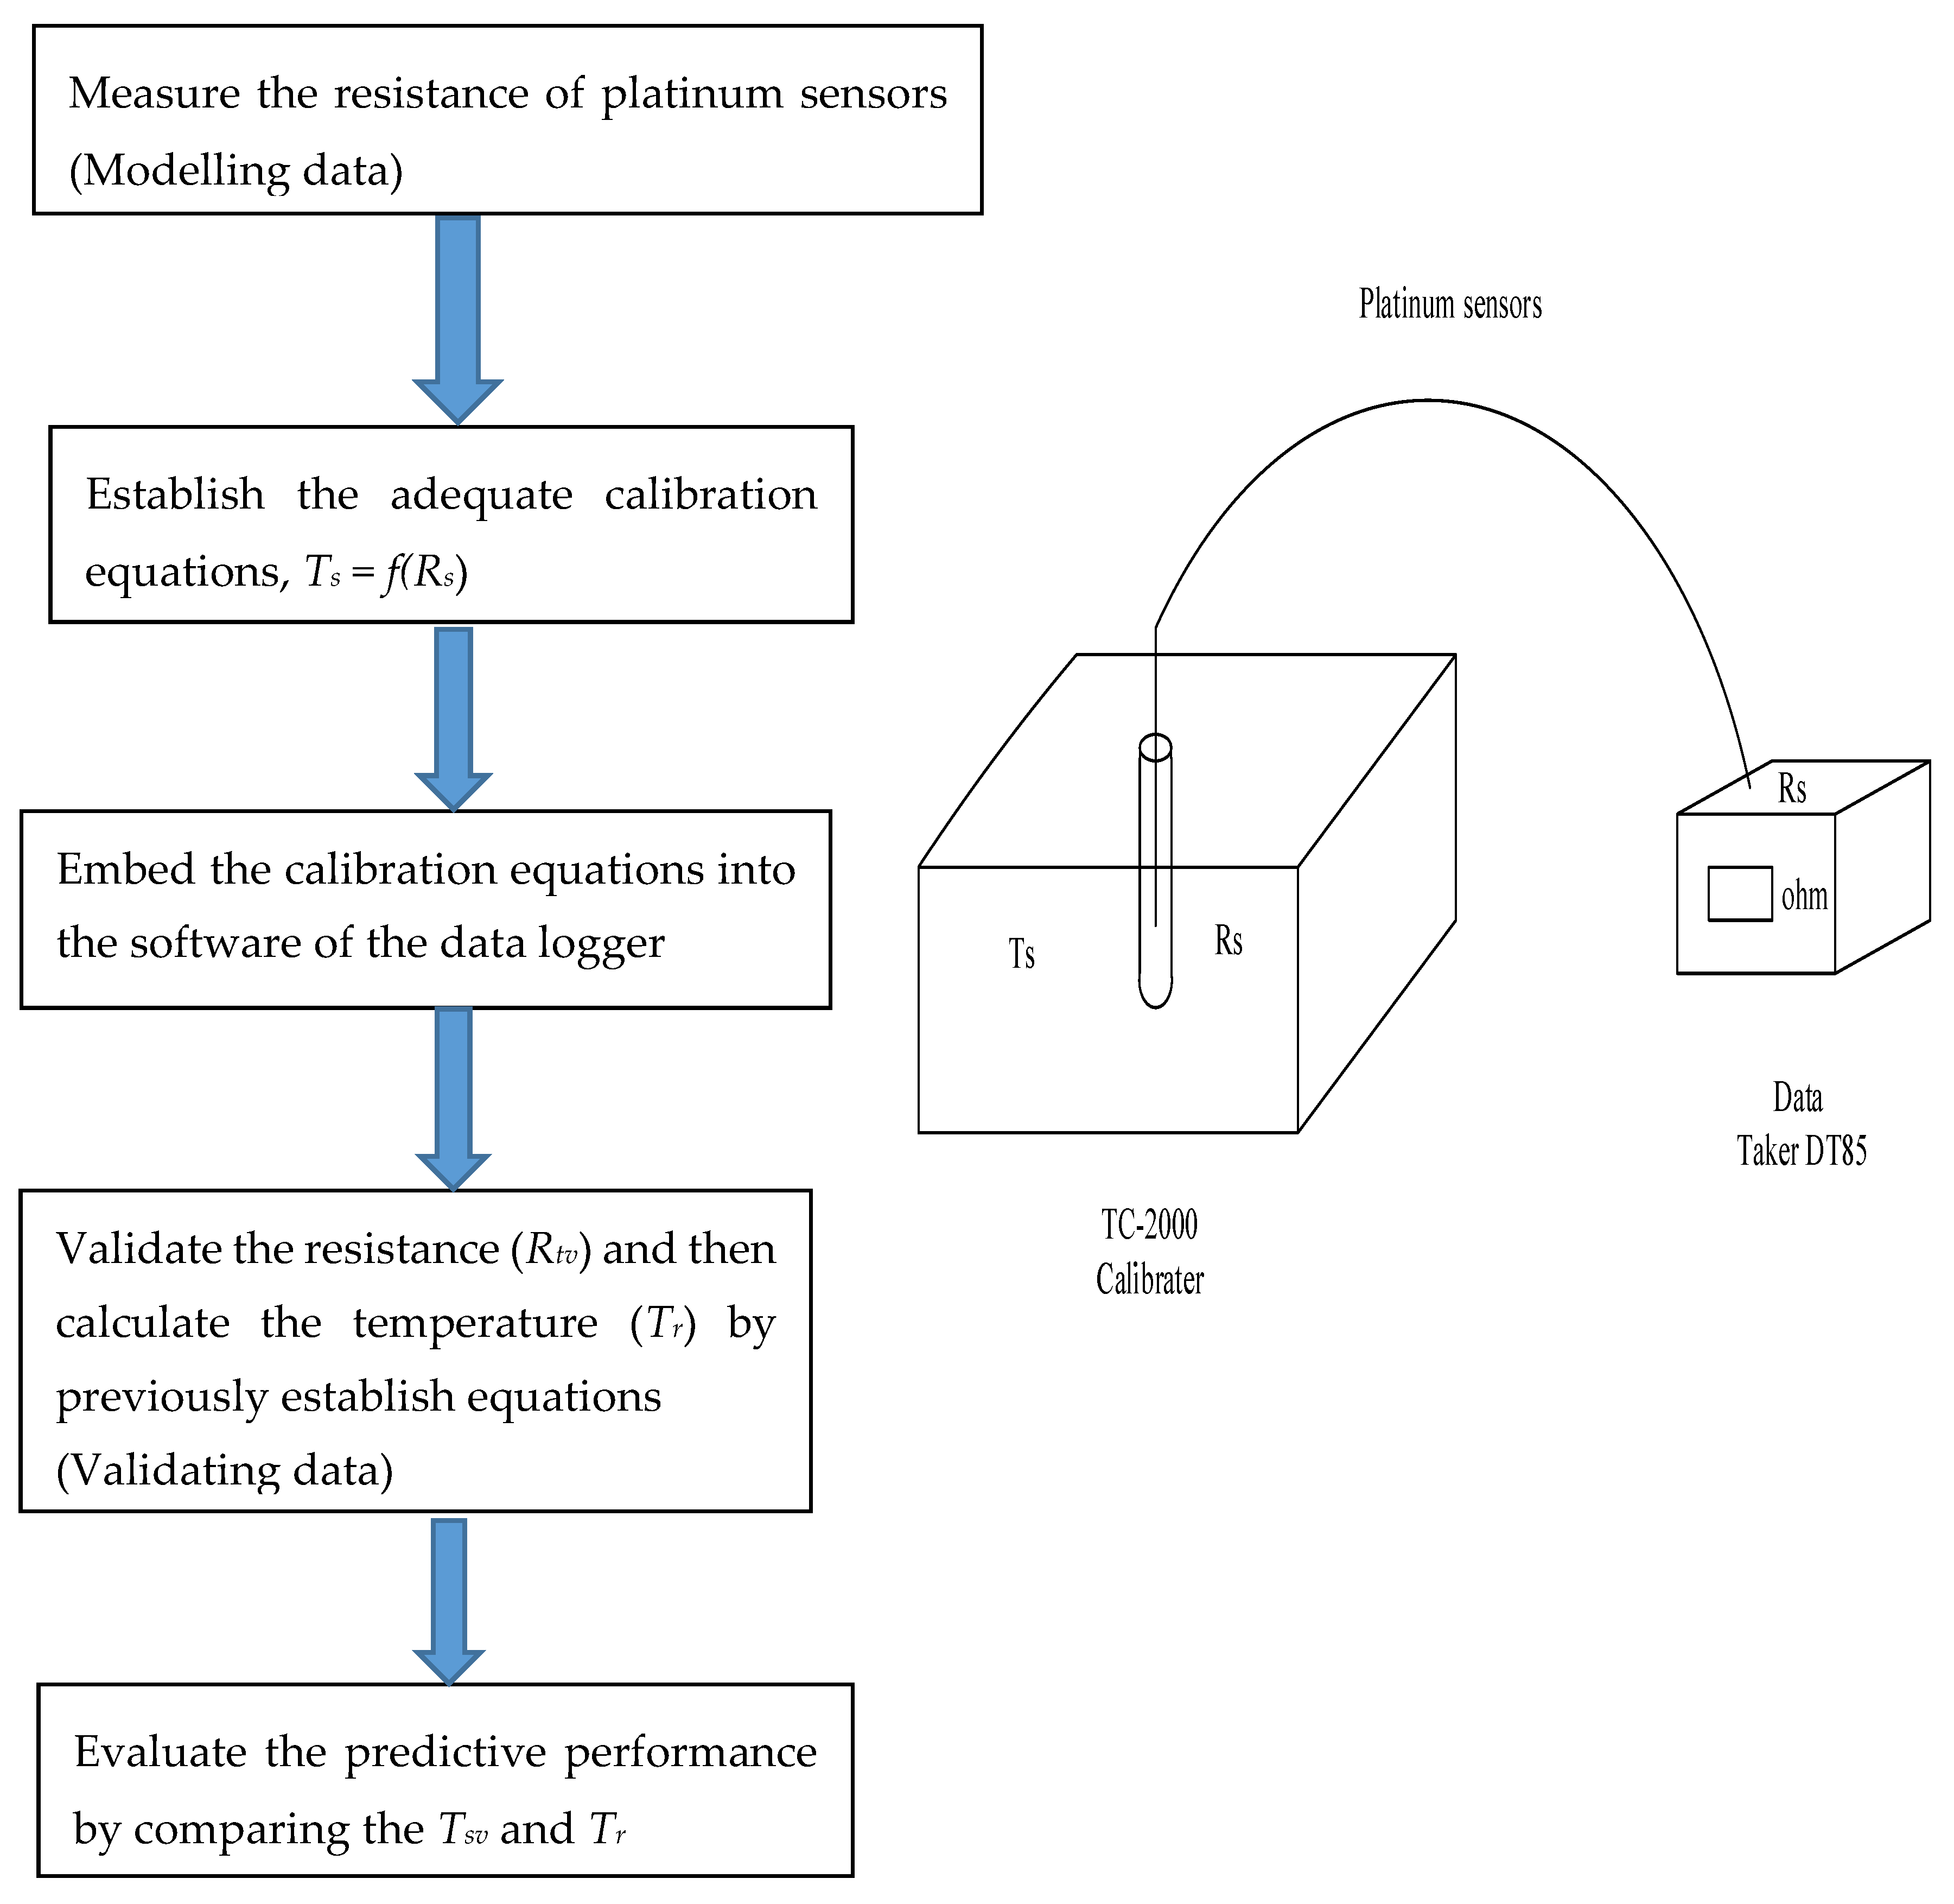
Figure 2.
Relationship between standard temperature and resistance value of the PT-1000 sensor according to IEC751/ ITS-90. IEC is the International Electro Technical Commission and ITS is the International Temperature Scale.
Figure 2.
Relationship between standard temperature and resistance value of the PT-1000 sensor according to IEC751/ ITS-90. IEC is the International Electro Technical Commission and ITS is the International Temperature Scale.
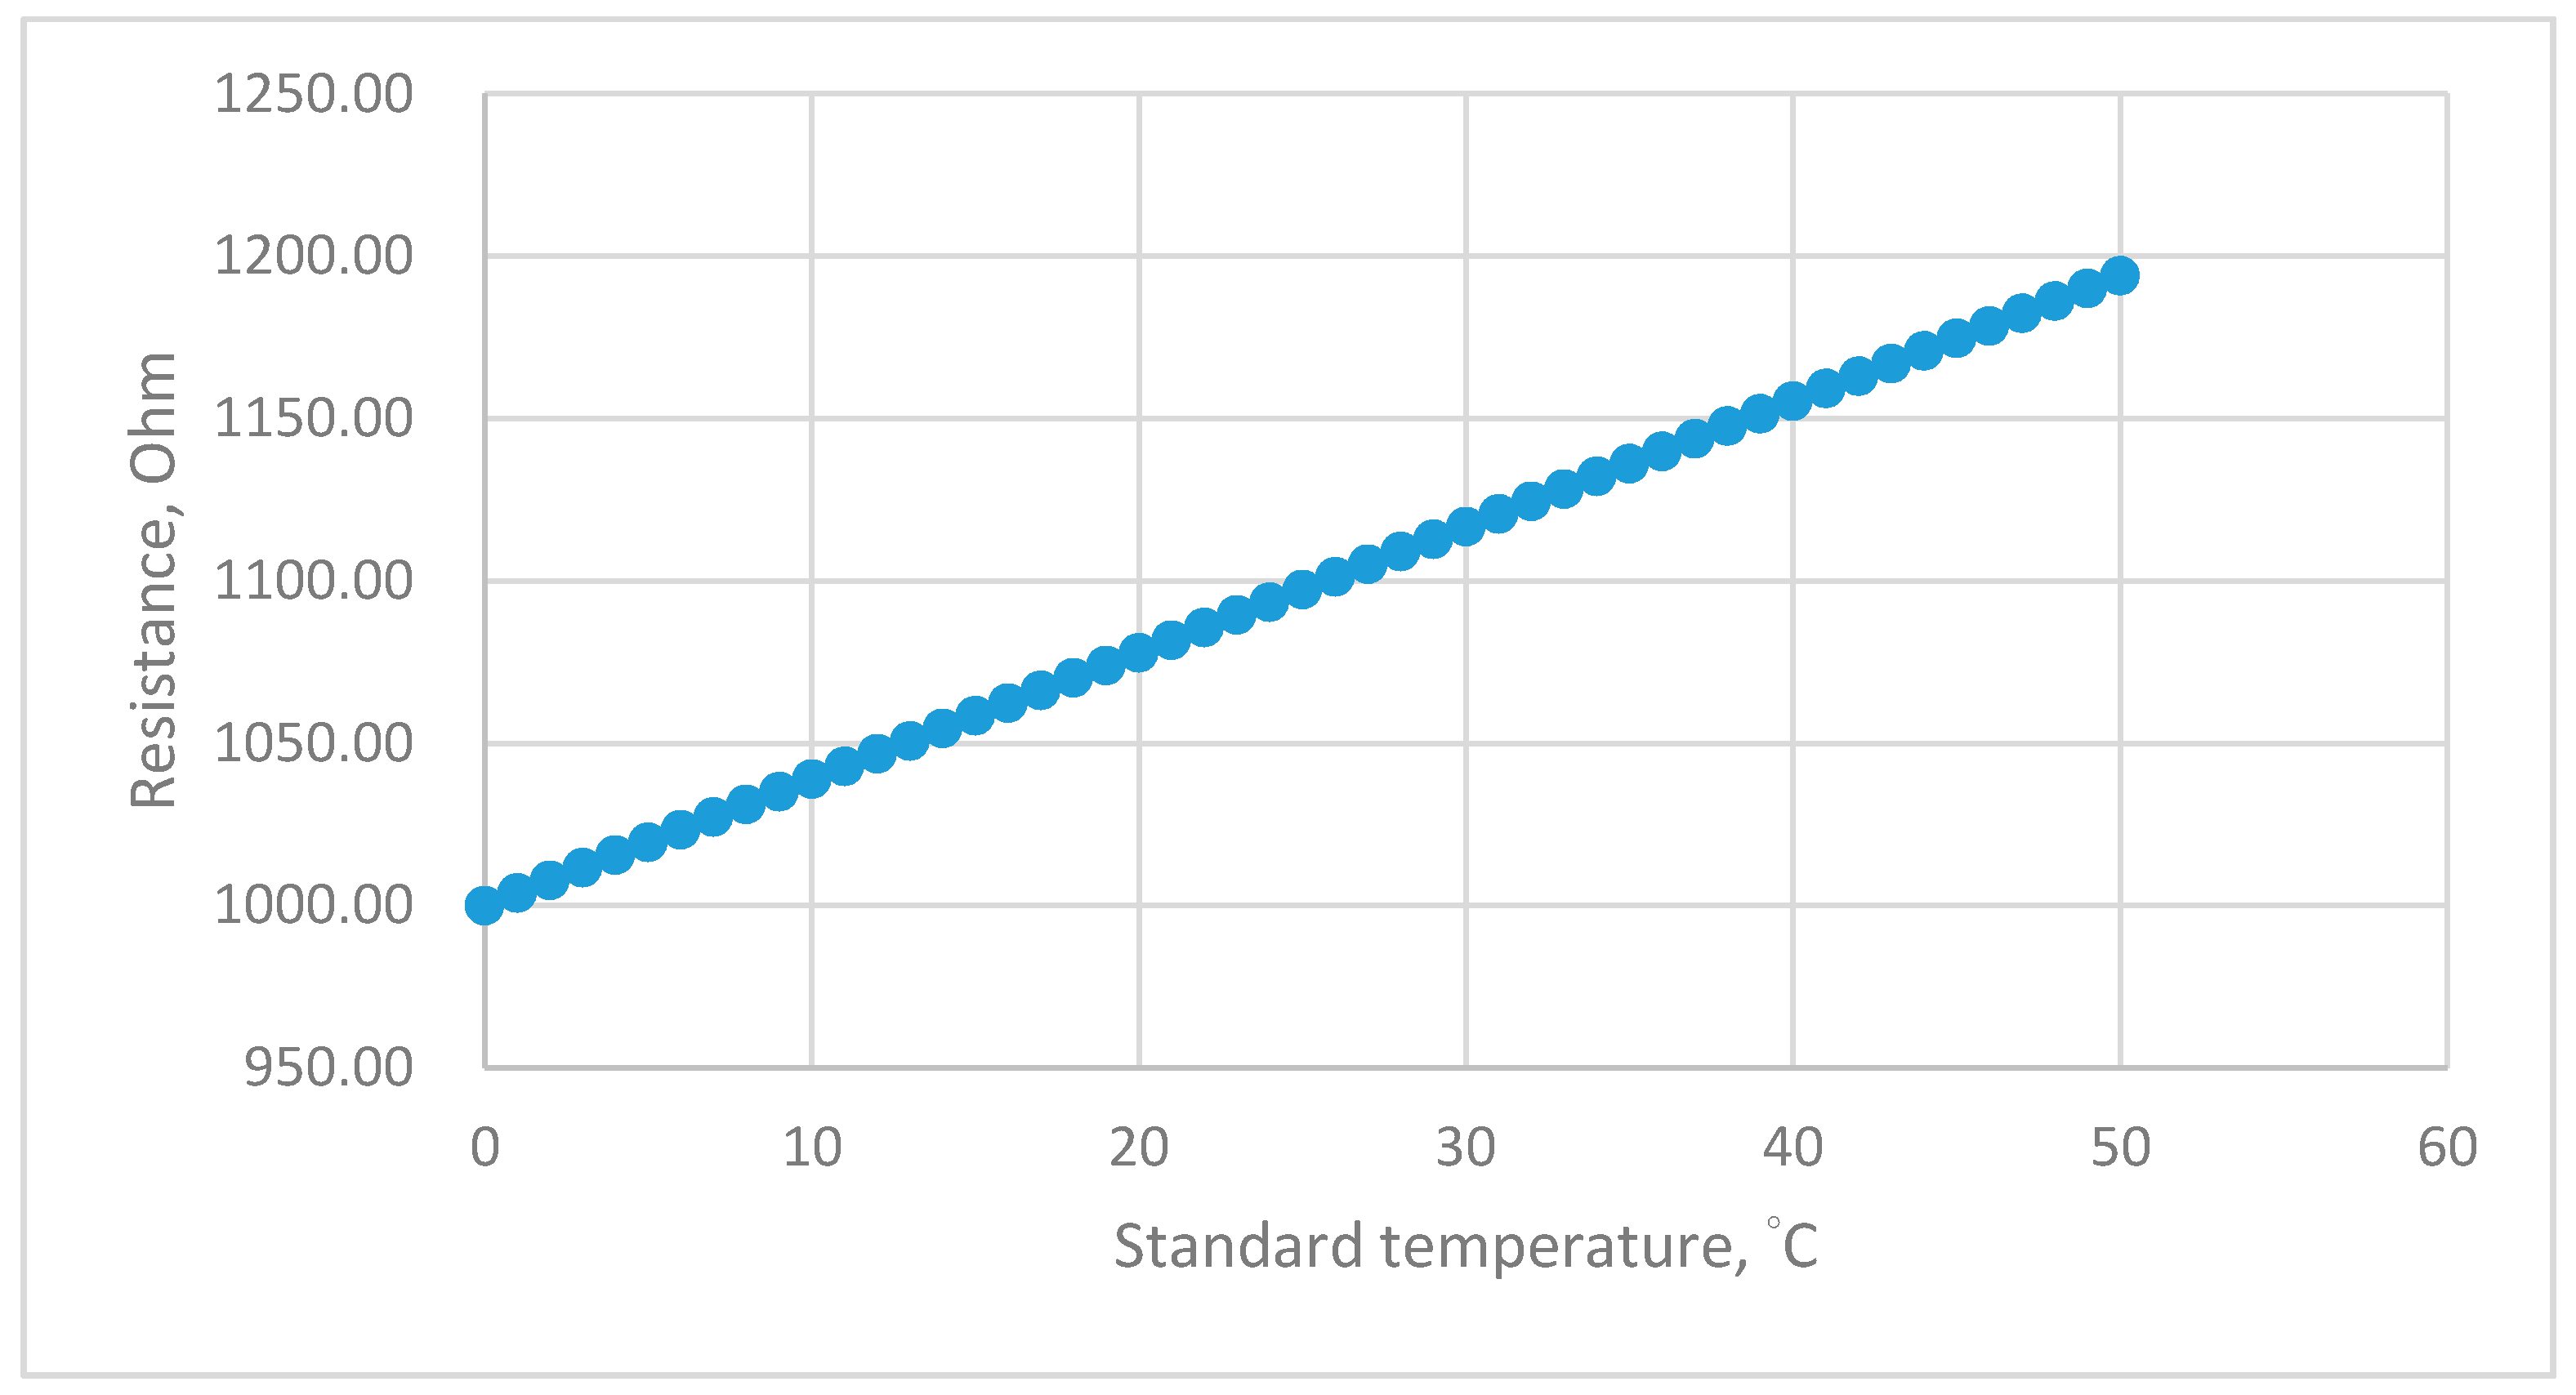
Figure 3.
(a) Residual plots of the original data for the linear equation of the PT-1000 sensor; (b) Residual plots of the original data for the 2nd-order equation of the PT-1000 sensor.
Figure 3.
(a) Residual plots of the original data for the linear equation of the PT-1000 sensor; (b) Residual plots of the original data for the 2nd-order equation of the PT-1000 sensor.

Table 1.
Three polynomial equations derived from the IEC751/ ITS-90 dataset for the PT-1000 sensor.
| Tstd = − 257.82983 + 0.257701233 Rs |
| s = 0.0311719 |
| Tstd = − 254.5488187 + 0.235322416 Rs – 1.02319 × Rs2 |
| s = 0.0068437 |
| Tstd = − 245.6622833 + 0.235633718Rs + 9.94769 × Rs2 + 8.63646 × Rs3 |
| s = 0.00691618 |
Table 2.
Two polynomial equations derived from the IEC751/ ITS-90 dataset for the PT-1000 sensor.
| T < 18 °C |
| Tstd = −256.4102564 + 0.256410256Rs – 2.61707 × Rs2 |
| s = 1.439 × |
| T > 18 °C |
| Tstd = −244.8299858 + 0.23407548Rs + 1.07724 × Rs2 |
| s = 0.00785 |
Table 3.
Calibration equations for measurement data of the AK-HS PT-1000 sensor.
|
| Inverse CVD equation |
| Tstd = −265.4893924 + 0.2725285 Rs – 7.02128 × Rs2 |
| s = 0.046527 |
|
|
| Tstd = −397.8397184 + 0.635660816 Rs – 0.000338589Rs2 + 1.00751 × Rs3 |
| s = 0.044196 |
|
| Tstd = 901.9206119 – 3.072070317 Rs + 0.00318522 Rs2 − 1.01503 × Rs3 |
| s = 0.040818 |
|
| Tstd = −1598.587633 + 3.820069693 Rs – 0.003151828 Rs2 + 9.28667 Rs3 |
| s = 0.028756 |
Table 4.
Quantitative parameters used for the evaluation of the four calibration equations for the measurement data of the AK-HS PT-1000 sensor.
Table 4.
Quantitative parameters used for the evaluation of the four calibration equations for the measurement data of the AK-HS PT-1000 sensor.
| Equation | emin | emax | estd | |
|---|---|---|---|---|
| 2nd-order Inverse CVD 3rd order | −0.106 | 0.126 | 0.040 | 0.028 |
| Range 0–18 °C | −0.080 | 0.078 | 0.030 | 0.021 |
| Range 19–50 °C | −0.069 | 0.067 | 0.024 | 0.017 |
Table 5.
Quantitative parameters used for the evaluation of three calibration equations for the validation data of the AK-HS PT-1000 sensor.
Table 5.
Quantitative parameters used for the evaluation of three calibration equations for the validation data of the AK-HS PT-1000 sensor.
| Equation | emin | emax | estd | |
|---|---|---|---|---|
| 2nd-order Ierse CVD 3rd-order | −0.115 | 0.158 | 0.037 | 0.035 |
| Range 0–18 °C | −0.081 | 0.066 | 0.029 | 0.019 |
| Range 19–50 °C | −0.089 | 0.058 | 0.024 | 0.015 |
Table 6.
The performance of the AK-HS PT-1000 sensor improved by the 3rd-order polynomial equation.
| Accuracy | Precision estd | |
|---|---|---|
| Model establishment Range 0–18 °C Range 19–50 °C Model evaluation | 0.030 0.024 | 0.021 0.017 |
| Range 0–18°C | 0.027 | 0.019 |
| Range 19–50°C | 0.024 | 0.015 |
© 2020 by the authors. Licensee MDPI, Basel, Switzerland. This article is an open access article distributed under the terms and conditions of the Creative Commons Attribution (CC BY) license (http://creativecommons.org/licenses/by/4.0/).
Share and Cite
MDPI and ACS Style
Chen, A.; Chen, H.-Y.; Chen, C. A Software Improvement Technique for Platinum Resistance Thermometers. Instruments 2020, 4, 15. https://doi.org/10.3390/instruments4020015
AMA Style
Chen A, Chen H-Y, Chen C. A Software Improvement Technique for Platinum Resistance Thermometers. Instruments. 2020; 4(2):15. https://doi.org/10.3390/instruments4020015
Chicago/Turabian StyleChen, Andrew, Hsuan-Yu Chen, and Chiachung Chen. 2020. "A Software Improvement Technique for Platinum Resistance Thermometers" Instruments 4, no. 2: 15. https://doi.org/10.3390/instruments4020015