
Test−Retest Reliability of Isokinetic Ankle, Knee and Hip Strength in Physically Active Adults Using Biodex System 4 Pro
 , , and
Abstract
:1. Introduction
2. Materials and Methods
2.1. Participants
2.2. Procedures
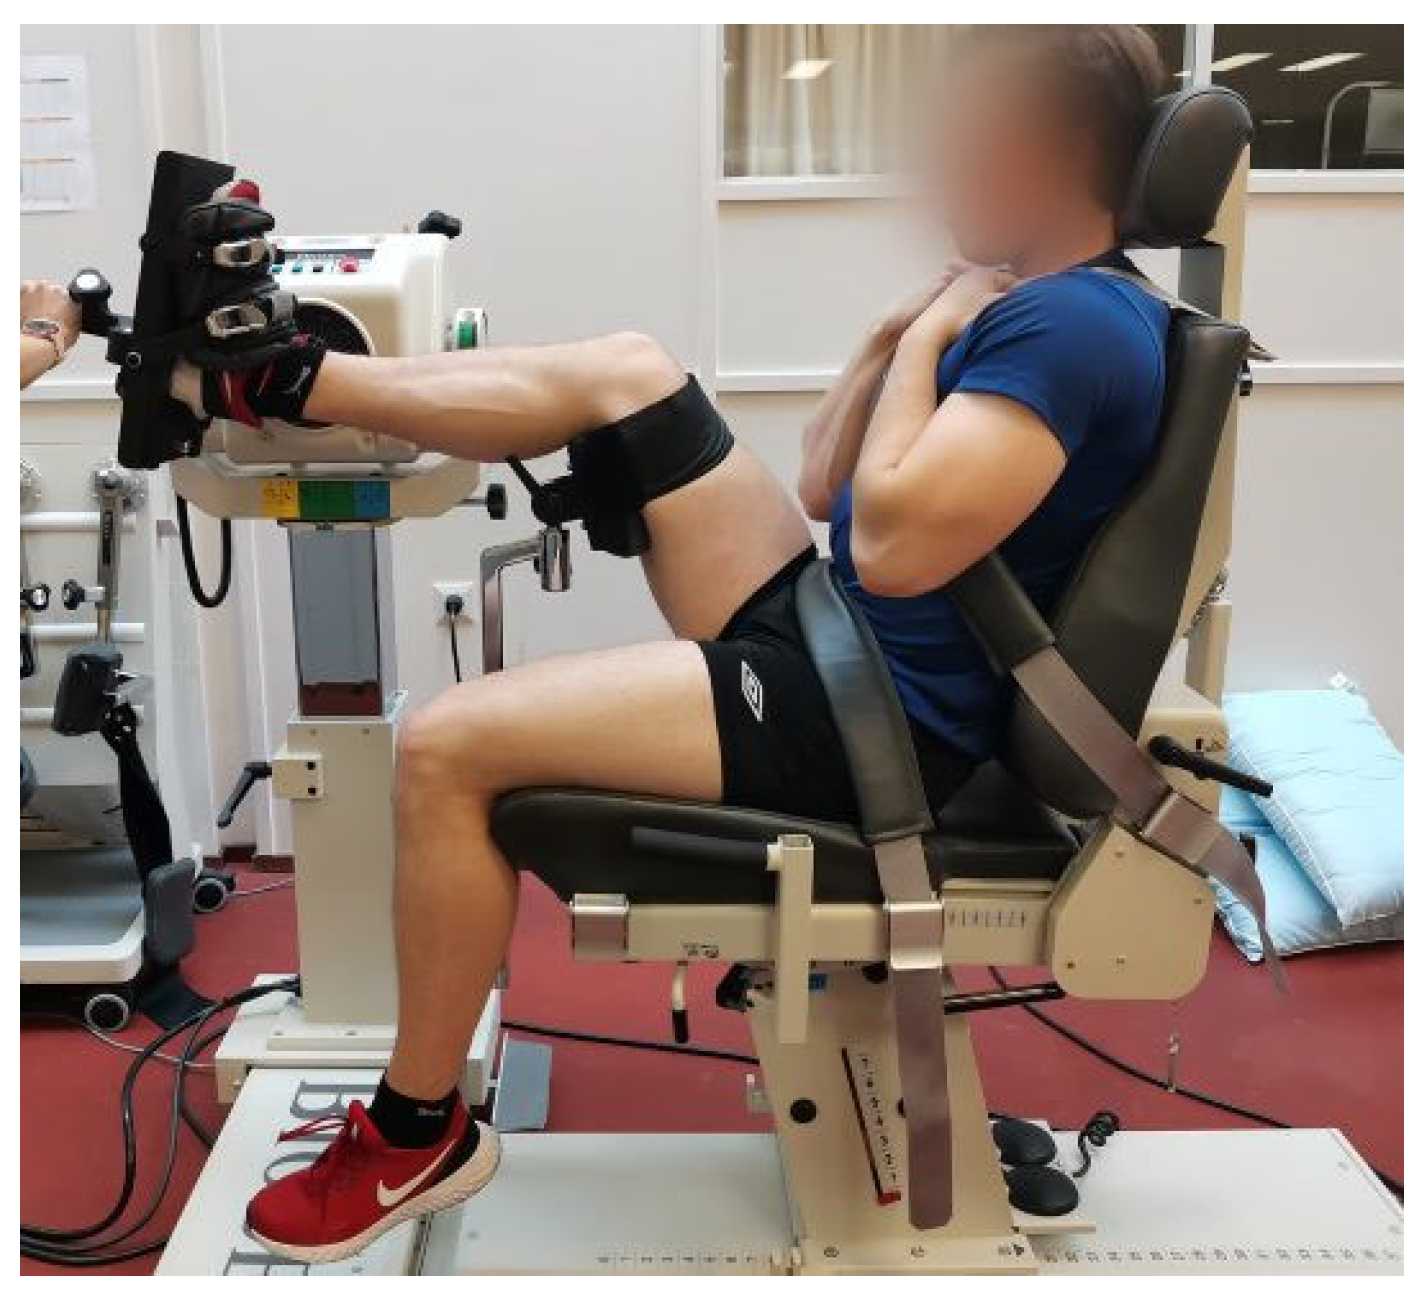
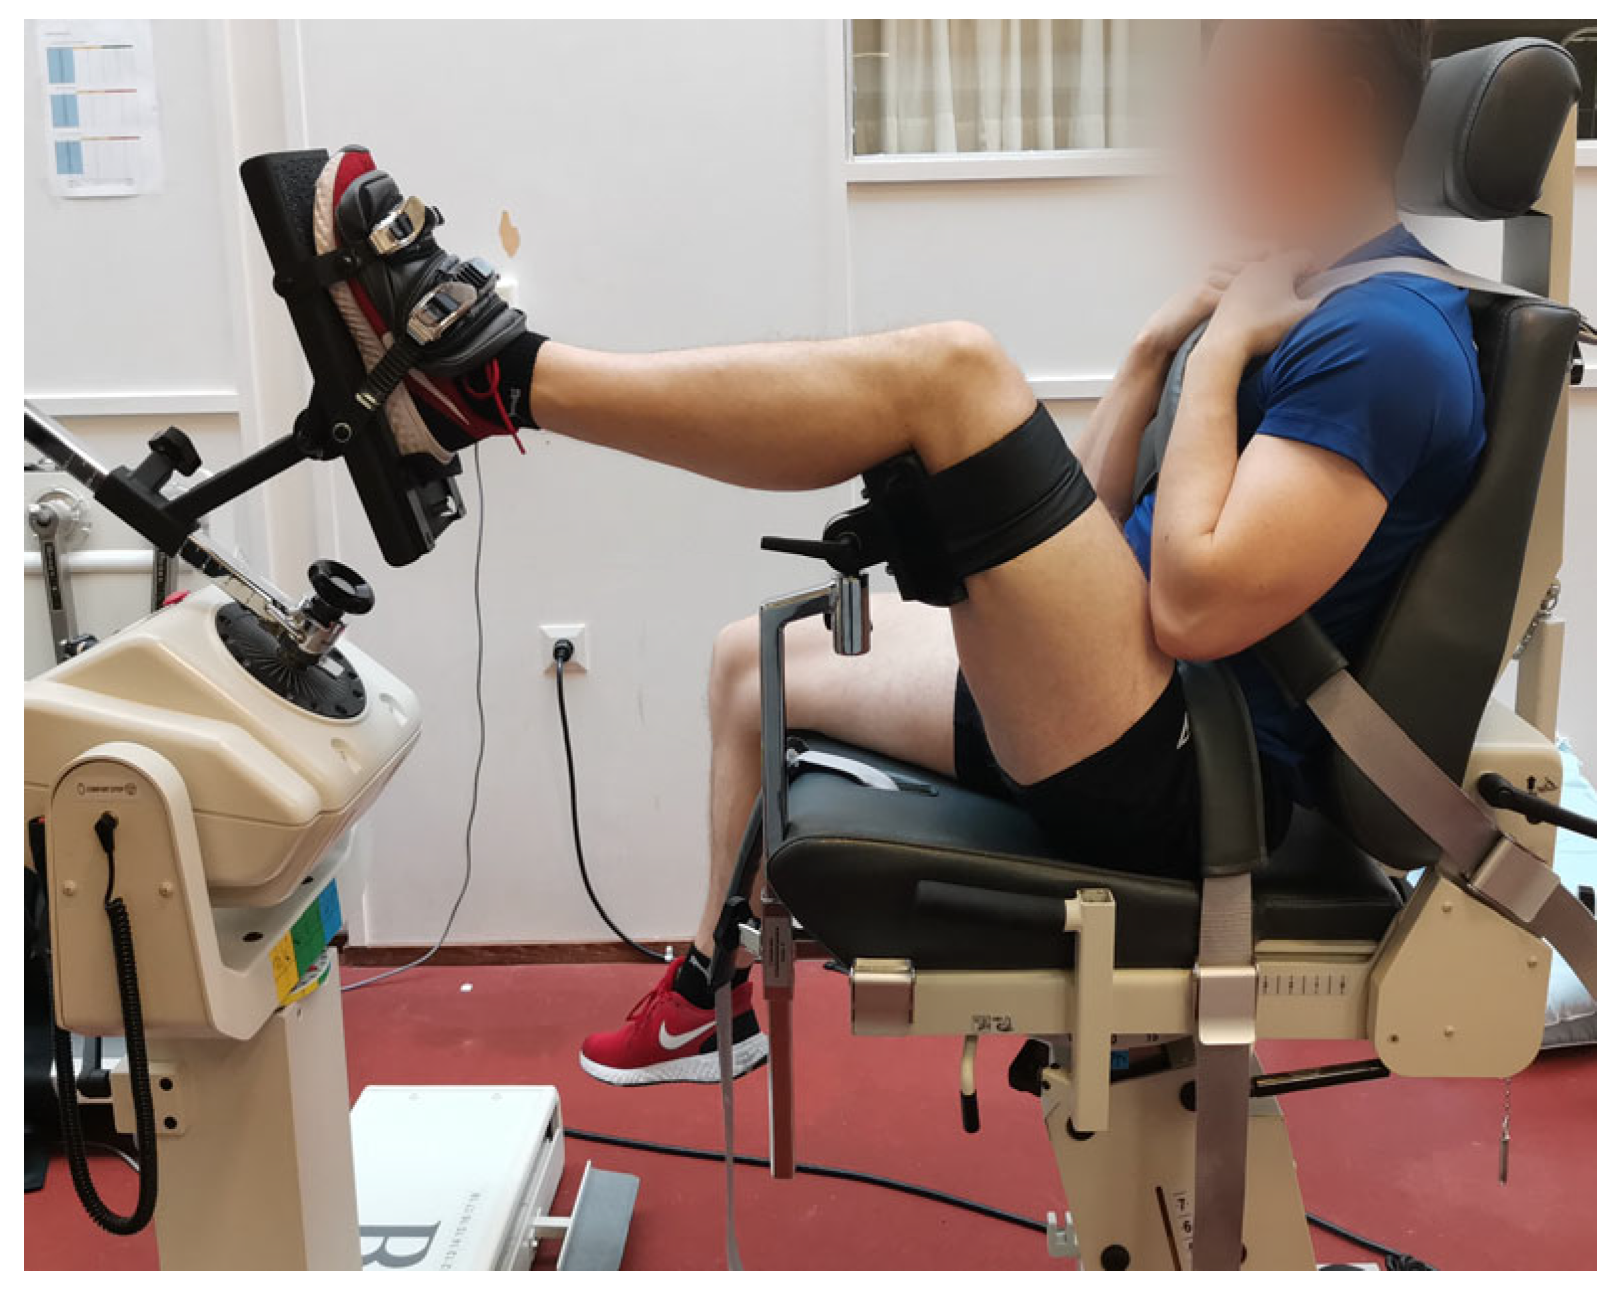
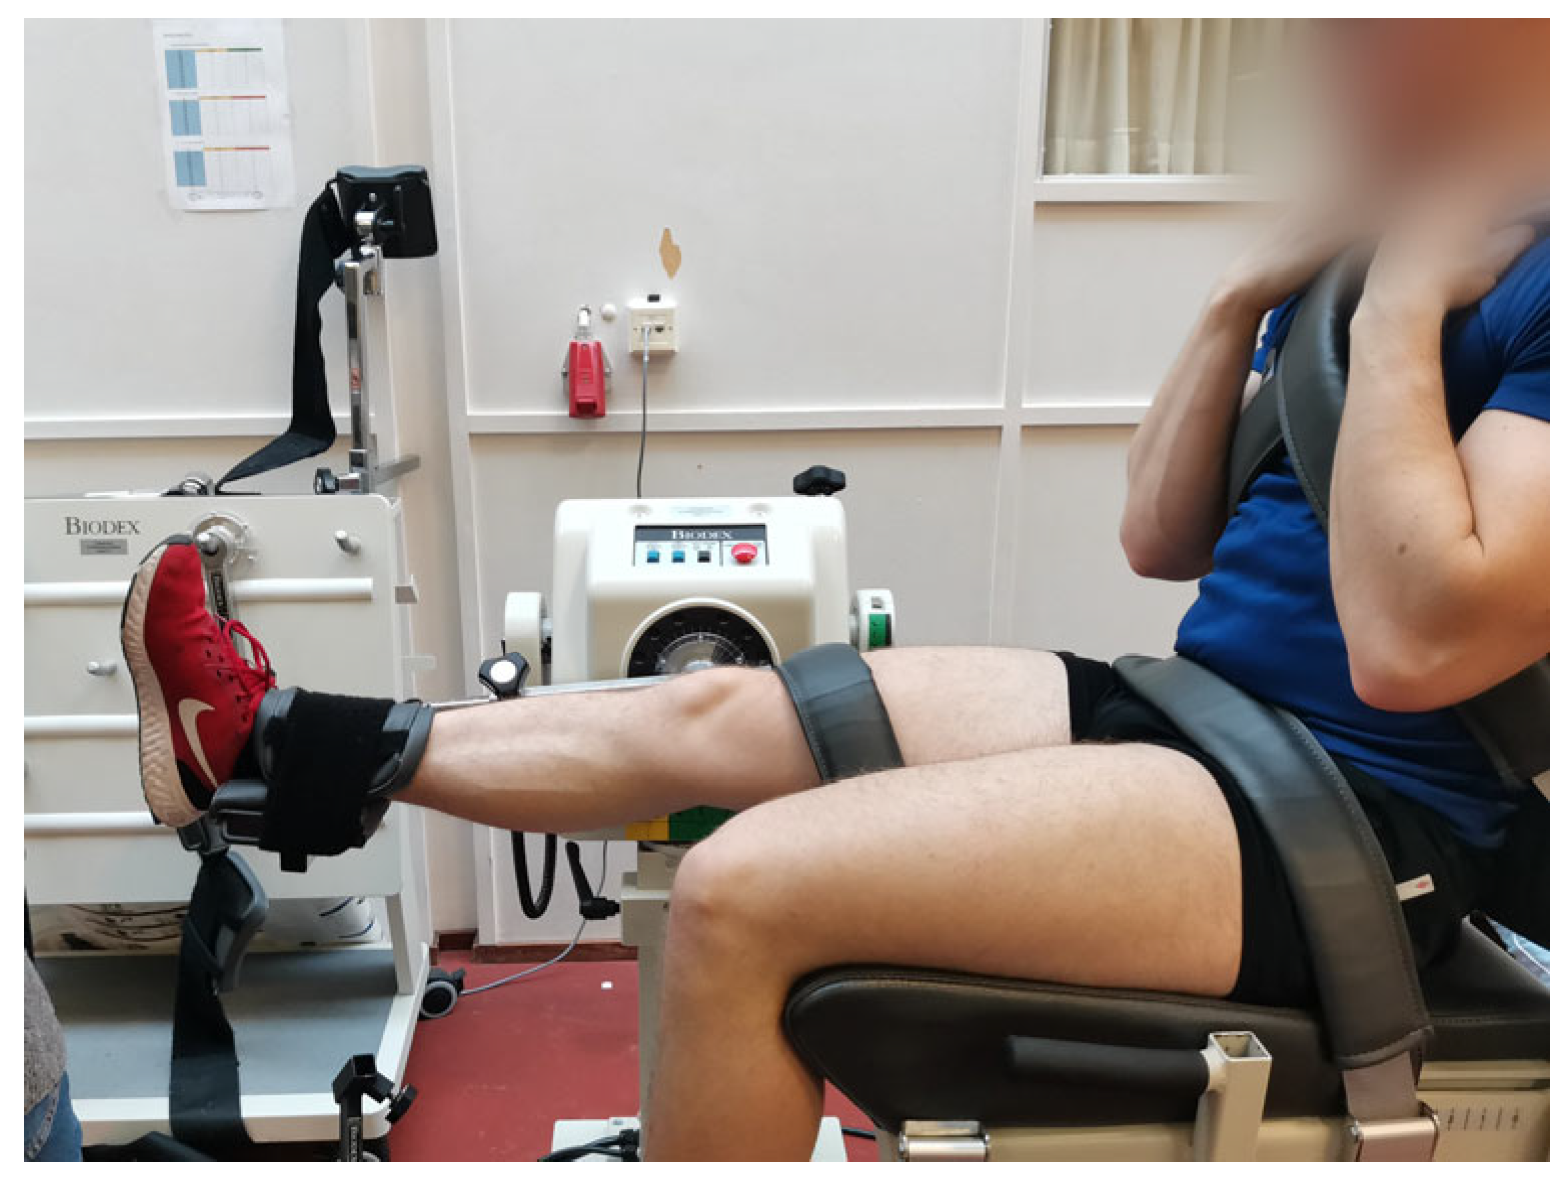
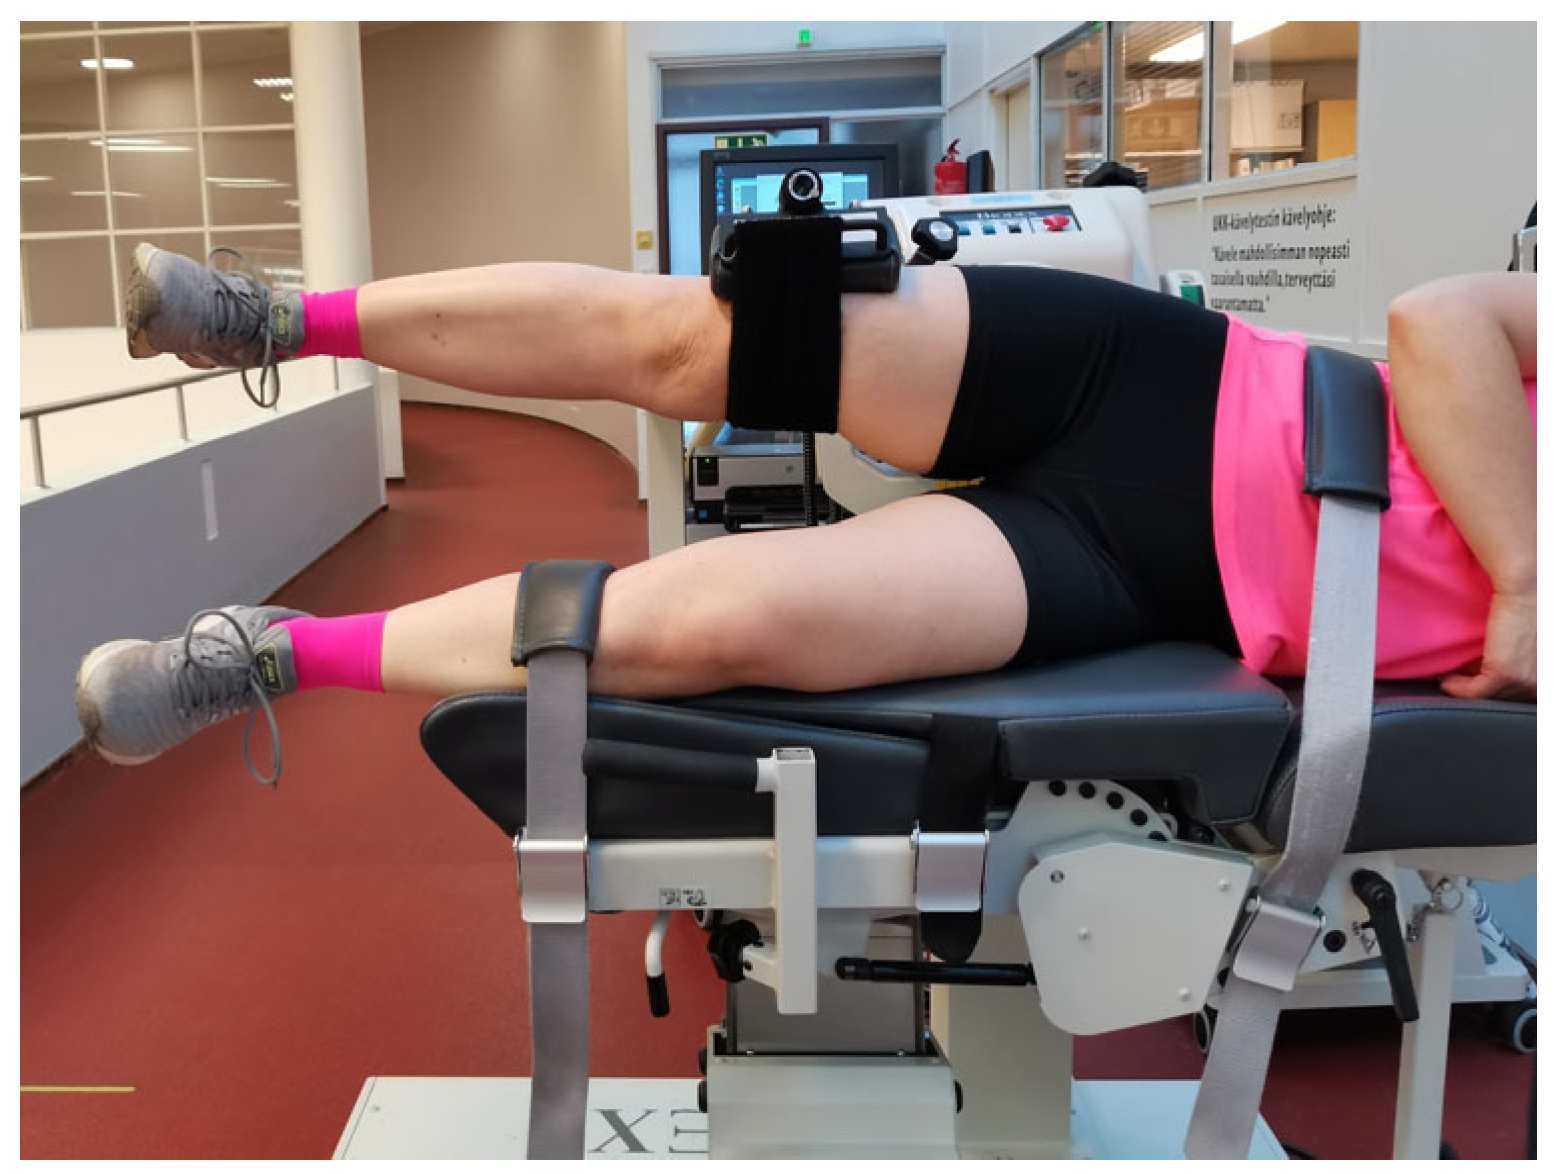
2.3. Test Positions
2.4. Statistical Analysis
3. Results
4. Discussion
Author Contributions
Funding
Institutional Review Board Statement
Informed Consent Statement
Data Availability Statement
Acknowledgments
Conflicts of Interest
References
- Biodex Medical Systems, Inc 2022. System 4 ProTM. Available online: https://www.biodex.com/physical-medicine/products/dynamometers/system-4-pro (accessed on 1 February 2021).
- Seven, B.; Cobanoglu, G.; Oskay, D.; Atalay-Guzel, N. Test–Retest Reliability of Isokinetic Wrist Strength and Proprioception Measurements. J. Sport Rehabil. 2019, 28, jsr-2018. [Google Scholar] [CrossRef] [Green Version]
- Hartmann, A.; Knols, R.; Murer, K.; de Bruin, E.D. Reproducibility of an Isokinetic Strength-Testing Protocol of the Knee and Ankle in Older Adults. Gerontology 2009, 55, 259–268. [Google Scholar] [CrossRef] [PubMed]
- Kaminski, T.W.; Dover, G.C. Reliability of Inversion and Eversion Peak- and Average-Torque Measurements from the Biodex System 3 Dynamometer. J. Sport Rehabil. 2001, 10, 205–220. [Google Scholar] [CrossRef]
- Webber, S.; Porter, M.M. Reliability of Ankle Isometric, Isotonic, and Isokinetic Strength and Power Testing in Older Women. Phys. Ther. 2010, 90, 1165–1175. [Google Scholar] [CrossRef] [PubMed] [Green Version]
- Maupas, E.; Frize, N.; Souléry, C. Reliability of isokinetic measurements of the hip muscles strength. Ann. Phys. Rehabil. Med. 2014, 57, e276. [Google Scholar] [CrossRef] [Green Version]
- Meyer, C.; Corten, K.; Wesseling, M.; Peers, K.; Simon, J.-P.; Jonkers, I.; Desloovere, K. Test-Retest Reliability of Innovated Strength Tests for Hip Muscles. PLoS ONE 2013, 8, e81149. [Google Scholar] [CrossRef] [Green Version]
- Adsuar, J.C.; Olivares, P.R.; del Pozo-Cruz, B.; Parraca, J.A.; Gusi, N. Test-Retest Reliability of Isometric and Isokinetic Knee Extension and Flexion in Patients with Fibromyalgia: Evaluation of the Smallest Real Difference. Arch. Phys. Med. Rehabil. 2011, 92, 1646–1651. [Google Scholar] [CrossRef]
- Almosnino, S.; Stevenson, J.M.; Bardana, D.; Diaconescu, E.D.; Dvir, Z. Reproducibility of isokinetic knee eccentric and concentric strength indices in asymptomatic young adults. Phys. Ther. Sport 2011, 13, 156–162. [Google Scholar] [CrossRef]
- Carvalho, H.M.; Silva, M.J.C.E.; Ronque, E.R.V.; Gonçalves, R.S.; Philippaerts, R.M.; Malina, R.M. Assessment of Reliability in Isokinetic Testing Among Adolescent Basketball Players. Medicina 2011, 47, 446–452. [Google Scholar] [CrossRef]
- Collado-Mateo, D.; Dominguez-Muñoz, F.J.; Charrua, Z.; Adsuar, J.C.; Batalha, N.; Merellano-Navarro, E.; Raimundo, A.M. Isokinetic Strength in Peritoneal Dialysis Patients: A Reliability Study. Appl. Sci. 2019, 9, 3542. [Google Scholar] [CrossRef] [Green Version]
- Collado-Mateo, D.; Domínguez-Muñoz, F.; Adsuar, J.; Parraca, J.; Tomas-Carus, P.; Garcia-Gordillo, M.; Raimundo, A. Test-Retest Intra-Session Reliability of Isokinetic Knee Strength Measurements in Obese Children. Appl. Sci. 2020, 10, 5923. [Google Scholar] [CrossRef]
- Fagher, K.; Fritzson, A.; Drake, A.M. Test-Retest Reliability of Isokinetic Knee Strength Measurements in Children Aged 8 to 10 Years. Sports Health 2016, 8, 255–259. [Google Scholar] [CrossRef] [Green Version]
- Lienhard, K.; Lauermann, S.; Schneider, D.; Item-Glatthorn, J.; Casartelli, N.; Maffiuletti, N. Validity and reliability of isometric, isokinetic and isoinertial modalities for the assessment of quadriceps muscle strength in patients with total knee arthroplasty. J. Electromyogr. Kinesiol. 2013, 23, 1283–1288. [Google Scholar] [CrossRef]
- Tsiros, M.D.; Grimshaw, P.; Shield, A.; Buckley, J.D. Test-retest reliability of the Biodex System 4 Isokinetic Dynamometer for knee strength assessment in paediatric populations. J. Allied Health 2011, 40, 115. [Google Scholar] [PubMed]
- Symons, T.B.; Vandervoort, A.A.; Rice, C.L.; Overend, T.J.; Marsh, G.D. Reliability of a Single-Session Isokinetic and Isometric Strength Measurement Protocol in Older Men. J. Gerontol. Ser. A Biol. Sci. Med. Sci. 2005, 60, 114–119. [Google Scholar] [CrossRef] [PubMed] [Green Version]
- Lund, H.; Sondergaard, K.; Zachariassen, T.; Christensen, R.; Bulow, P.; Henriksen, M.; Bartels, E.M.; Danneskiold-Samsoe, B.; Bliddal, H. Learning effect of isokinetic measurements in healthy subjects, and reliability and comparability of Biodex and Lido dynamometers. Clin. Physiol. Funct. Imaging 2005, 25, 75–82. [Google Scholar] [CrossRef] [PubMed]
- Tiffreau, V.; Ledoux, I.; Eymard, B.; Thévenon, A.; Hogrel, J.-Y. Isokinetic muscle testing for weak patients suffering from neuromuscular disorders: A reliability study. Neuromuscul. Disord. 2007, 17, 524–531. [Google Scholar] [CrossRef] [PubMed]
- Holmbäck, A.M.; Porter, M.M.; Downham, D.; Lexell, J. Reliability of isokinetic ankle dorsiflexor strength measurements in healthy young men and women. Scand. J. Rehabil. Med. 1999, 31, 229–239. [Google Scholar]
- Hietamo, J.; Parkkari, J.; Leppänen, M.; Steffen, K.; Kannus, P.; Vasankari, T.; Heinonen, A.; Mattila, V.M.; Pasanen, K. Association between lower extremity muscular strength and acute knee injuries in young team-sport athletes. Transl. Sports Med. 2020, 3, 626–637. [Google Scholar] [CrossRef]
- Baltich, J.; Emery, C.A.; Stefanyshyn, D.; Nigg, B.M. The effects of isolated ankle strengthening and functional balance training on strength, running mechanics, postural control and injury prevention in novice runners: Design of a randomized controlled trial. BMC Musculoskelet. Disord. 2014, 15, 407. [Google Scholar] [CrossRef] [Green Version]
- Hietamo, J.; Pasanen, K.; Leppänen, M.; Steffen, K.; Kannus, P.; Heinonen, A.; Mattila, V.M.; Parkkari, J. Association between lower extremity muscle strength and acute ankle injury in young team-sports athletes. Phys. Ther. Sport 2021, 48, 188–195. [Google Scholar]
- Koo, T.K.; Li, M.Y. A Guideline of Selecting and Reporting Intraclass Correlation Coefficients for Reliability Research. J. Chiropr. Med. 2016, 15, 155–163. [Google Scholar] [CrossRef] [PubMed] [Green Version]
- Atkinson, G.; Nevill, A.M. Statistical Methods for Assessing Measurement Error (Reliability) in Variables Relevant to Sports Medicine. Sports Med. 1998, 26, 217–238. [Google Scholar] [CrossRef]
- Hopkins, W.G. Measures of Reliability in Sports Medicine and Science. Sports Med. 2000, 30, 1–15. [Google Scholar] [CrossRef] [PubMed] [Green Version]
- Hopkins, W.G. Summarizing Data: PRECISION OF MEASUREMENT. Available online: https://www.sportsci.org/resource/stats/precision.html (accessed on 1 February 2021).
- McGrath, T.M.; Waddington, G.; Scarvell, J.M.; Ball, N.B.; Creer, R.; Woods, K.; Smith, D. The effect of limb dominance on lower limb functional performance—A systematic review. J. Sports Sci. 2016, 34, 289–302. [Google Scholar] [CrossRef]


| n | Mean1 ± SD | Mean2 ± SD | DIFF | DIFF% | CVTE (%) | ICC (CI 95%) | ||
|---|---|---|---|---|---|---|---|---|
| Ankle Plantar Flexion Dominant | Peak Torque | 18 | 98.7 ± 30.7 | 98.8 ± 27.5 | 0.1 | 0.1 | 12.7 | 0.91 (0.75–0.97) |
| Average Peak Torque | 18 | 91.0 ± 30.6 | 93.3 ± 27.8 | 2.3 | 2.5 | 13.8 | 0.90 (0.73–0.96) | |
| Ankle Plantar Flexion Nondominant | Peak Torque | 18 | 97.5 ± 38.9 | 97.0 ± 30.1 | −0.5 | −0.5 | 12.3 | 0.94 (0.84–0.98) |
| Average Peak Torque | 18 | 90.6 ± 38.2 | 91.4 ± 29.8 | 0.8 | 0.9 | 12.8 | 0.94 (0.84–0.98) | |
| Ankle Dorsi Flexion Dominant | Peak Torque | 18 | 27.8 ± 8.3 | 30.2 ± 7.1 | 2.4 | 8.6 | 8.4 | 0.93 (0.70–0.98) |
| Average Peak Torque | 18 | 26.0 ± 8.2 | 28.5 ± 7.1 | 2.5 | 9.6 | 8.7 | 0.93 (0.70–0.98) | |
| Ankle Dorsi Flexion Nondominant | Peak Torque | 18 | 28.4 ± 7.4 | 29.5 ± 7.9 | 1.1 | 3.9 | 19.5 | 0.64 (0.02–0.87) |
| Average peak torque | 18 | 26.1 ± 7.3 | 27.3 ± 7.1 | 1.2 | 4.6 | 17.7 | 0.73 (0.28–0.90) |
| n | Mean1 ± SD | Mean2 ± SD | DIFF | DIFF% | CVTE (%) | ICC (CI 95%) | ||
|---|---|---|---|---|---|---|---|---|
| Ankle Inversion Dominant | Peak Torque | 19 | 31.9 ± 8.4 | 32.3 ± 7.5 | 0.4 | 1.3 | 9.9 | 0.95 (0.87–0.98) |
| Average Peak Torque | 19 | 29.9 ± 7.8 | 30.9 ± 7.8 | 1.0 | 3.3 | 9.3 | 0.93 (0.82–0.97) | |
| Ankle Inversion Nondominant | Peak Torque | 18 | 31.9 ± 9.2 | 31.3 ± 6.7 | −0.6 | −1.9 | 7.7 | 0.83 (0.55–0.94) |
| Average Peak Torque | 18 | 29.8 ± 8.5 | 29.3 ± 6.2 | −0.5 | −1.7 | 13.4 | 0.84 (0.57–0.94) | |
| Ankle Eversion Dominant | Peak Torque | 19 | 23.6 ± 6.8 | 23.4 ± 7.8 | −0.2 | −0.8 | 13.8 | 0.95 (0.87–0.98) |
| Average Peak Torque | 19 | 22.2 ± 6.6 | 22.0 ± 7.6 | −0.2 | −0.9 | 10.6 | 0.94 (0.86–0.98) | |
| Ankle Eversion Nondominant | Peak Torque | 18 | 23.1 ± 6.1 | 23.9 ± 8.0 | 0.8 | 3.5 | 9.9 | 0.91 (0.75–0.97) |
| Average Peak Torque | 17 | 21.3 ± 5.7 | 22.0 ± 8.3 | 0.7 | 3.3 | 13.7 | 0.91 (0.75–0.97) |
| n | Mean1 ± SD | Mean2 ± SD | DIFF | DIFF% | CVTE (%) | ICC (CI 95%) | ||
|---|---|---|---|---|---|---|---|---|
| Knee Extension Dominant | Peak Torque | 18 | 185.4 ± 63.7 | 187.2 ± 72.3 | 1.8 | 1.0 | 7.0 | 0.98 (0.95–0.99) |
| Average Peak Torque | 18 | 175.2 ± 61.5 | 180.1 ± 69.8 | 4.9 | 2.8 | 7.6 | 0.98 (0.94–0.99) | |
| Knee Extension Nondominant | Peak Torque | 18 | 187.2 ± 58.9 | 190.3 ± 70.5 | 3.1 | 1.7 | 6.9 | 0.98 (0.95–0.99) |
| Average Peak Torque | 18 | 177.9 ± 57.7 | 181.6 ± 70.1 | 3.7 | 2.1 | 8.5 | 0.97 (0.93–0.99) | |
| Knee Flexion Dominant | Peak Torque | 18 | 93.7 ± 28.4 | 98.8 ± 34.2 | 5.1 | 5.4 | 6.6 | 0.97 (0.91–0.99) |
| Average Peak Torque | 18 | 89.2 ± 27.1 | 93.1 ± 31.7 | 3.9 | 4.4 | 6.8 | 0.97 (0.93–0.99) | |
| Knee Flexion Nondominant | Peak Torque | 18 | 94.3 ± 30.2 | 98.1 ± 33.1 | 3.8 | 4.0 | 10.1 | 0.95 (0.87–0.98) |
| Average Peak Torque | 18 | 89.7 ± 29.4 | 93.0 ± 31.1 | 3.3 | 3.7 | 10.8 | 0.94 (0.85–0.98) |
| n | Mean1 ± SD | Mean2 ± SD | DIFF | DIFF% | CVTE (%) | ICC (CI 95%) | ||
|---|---|---|---|---|---|---|---|---|
| Hip Abduction Dominant | Peak Torque | 18 | 144.4 ± 46.6 | 143.7 ± 51.0 | −0.7 | −0.5 | 10.9 | 0.95 (0.86–0.98) |
| Average Peak Torque | 18 | 131.2 ± 42.6 | 129.4 ± 40.5 | −1.8 | −1.4 | 10.8 | 0.94 (0.84–0.98) | |
| Hip Abduction Nondominant | Peak Torque | 17 | 149.8 ± 57.8 | 145.2 ± 49.4 | −4.6 | −3.1 | 10.3 | 0.96 (0.89–0.99) |
| Average Peak Torque | 17 | 137.3 ± 52.6 | 135.2 ± 48.3 | −2.1 | −1.5 | 7.6 | 0.98 (0.94–0.99) | |
| Hip Adduction Dominant | Peak Torque | 18 | 127.3 ± 54.9 | 133.1 ± 47.9 | 5.8 | 4.6 | 10.5 | 0.96 (0.90–0.99) |
| Average Peak Torque | 18 | 114.5 ± 52.6 | 123.3 ± 47.2 | 8.8 | 7.7 | 11.1 | 0.96 (0.88–0.99) | |
| Hip Adduction Nondominant | Peak Torque | 17 | 131.1 ± 50.1 | 132.8 ± 47.4 | 1.7 | 1.3 | 12.8 | 0.94 (0.83–0.98) |
| Average Peak Torque | 17 | 121.0 ± 49.8 | 124.1 ± 45.7 | 3.1 | 2.6 | 14.9 | 0.93 (0.79–0.97) |
Disclaimer/Publisher’s Note: The statements, opinions and data contained in all publications are solely those of the individual author(s) and contributor(s) and not of MDPI and/or the editor(s). MDPI and/or the editor(s) disclaim responsibility for any injury to people or property resulting from any ideas, methods, instructions or products referred to in the content. |
© 2023 by the authors. Licensee MDPI, Basel, Switzerland. This article is an open access article distributed under the terms and conditions of the Creative Commons Attribution (CC BY) license (https://creativecommons.org/licenses/by/4.0/).
Share and Cite
Tuominen, J.; Leppänen, M.; Jarske, H.; Pasanen, K.; Vasankari, T.; Parkkari, J. Test−Retest Reliability of Isokinetic Ankle, Knee and Hip Strength in Physically Active Adults Using Biodex System 4 Pro. Methods Protoc. 2023, 6, 26. https://doi.org/10.3390/mps6020026
Tuominen J, Leppänen M, Jarske H, Pasanen K, Vasankari T, Parkkari J. Test−Retest Reliability of Isokinetic Ankle, Knee and Hip Strength in Physically Active Adults Using Biodex System 4 Pro. Methods and Protocols. 2023; 6(2):26. https://doi.org/10.3390/mps6020026
Chicago/Turabian StyleTuominen, Juho, Mari Leppänen, Heidi Jarske, Kati Pasanen, Tommi Vasankari, and Jari Parkkari. 2023. "Test−Retest Reliability of Isokinetic Ankle, Knee and Hip Strength in Physically Active Adults Using Biodex System 4 Pro" Methods and Protocols 6, no. 2: 26. https://doi.org/10.3390/mps6020026