
Discriminant Analysis PCA-LDA Assisted Surface-Enhanced Raman Spectroscopy for Direct Identification of Malaria-Infected Red Blood Cells


 ,
,
Abstract
:1. Introduction
2. Material
2.1. Blood
2.2. Surface-Enhanced Raman Substrate
2.3. Raman Spectrometer
2.4. Software
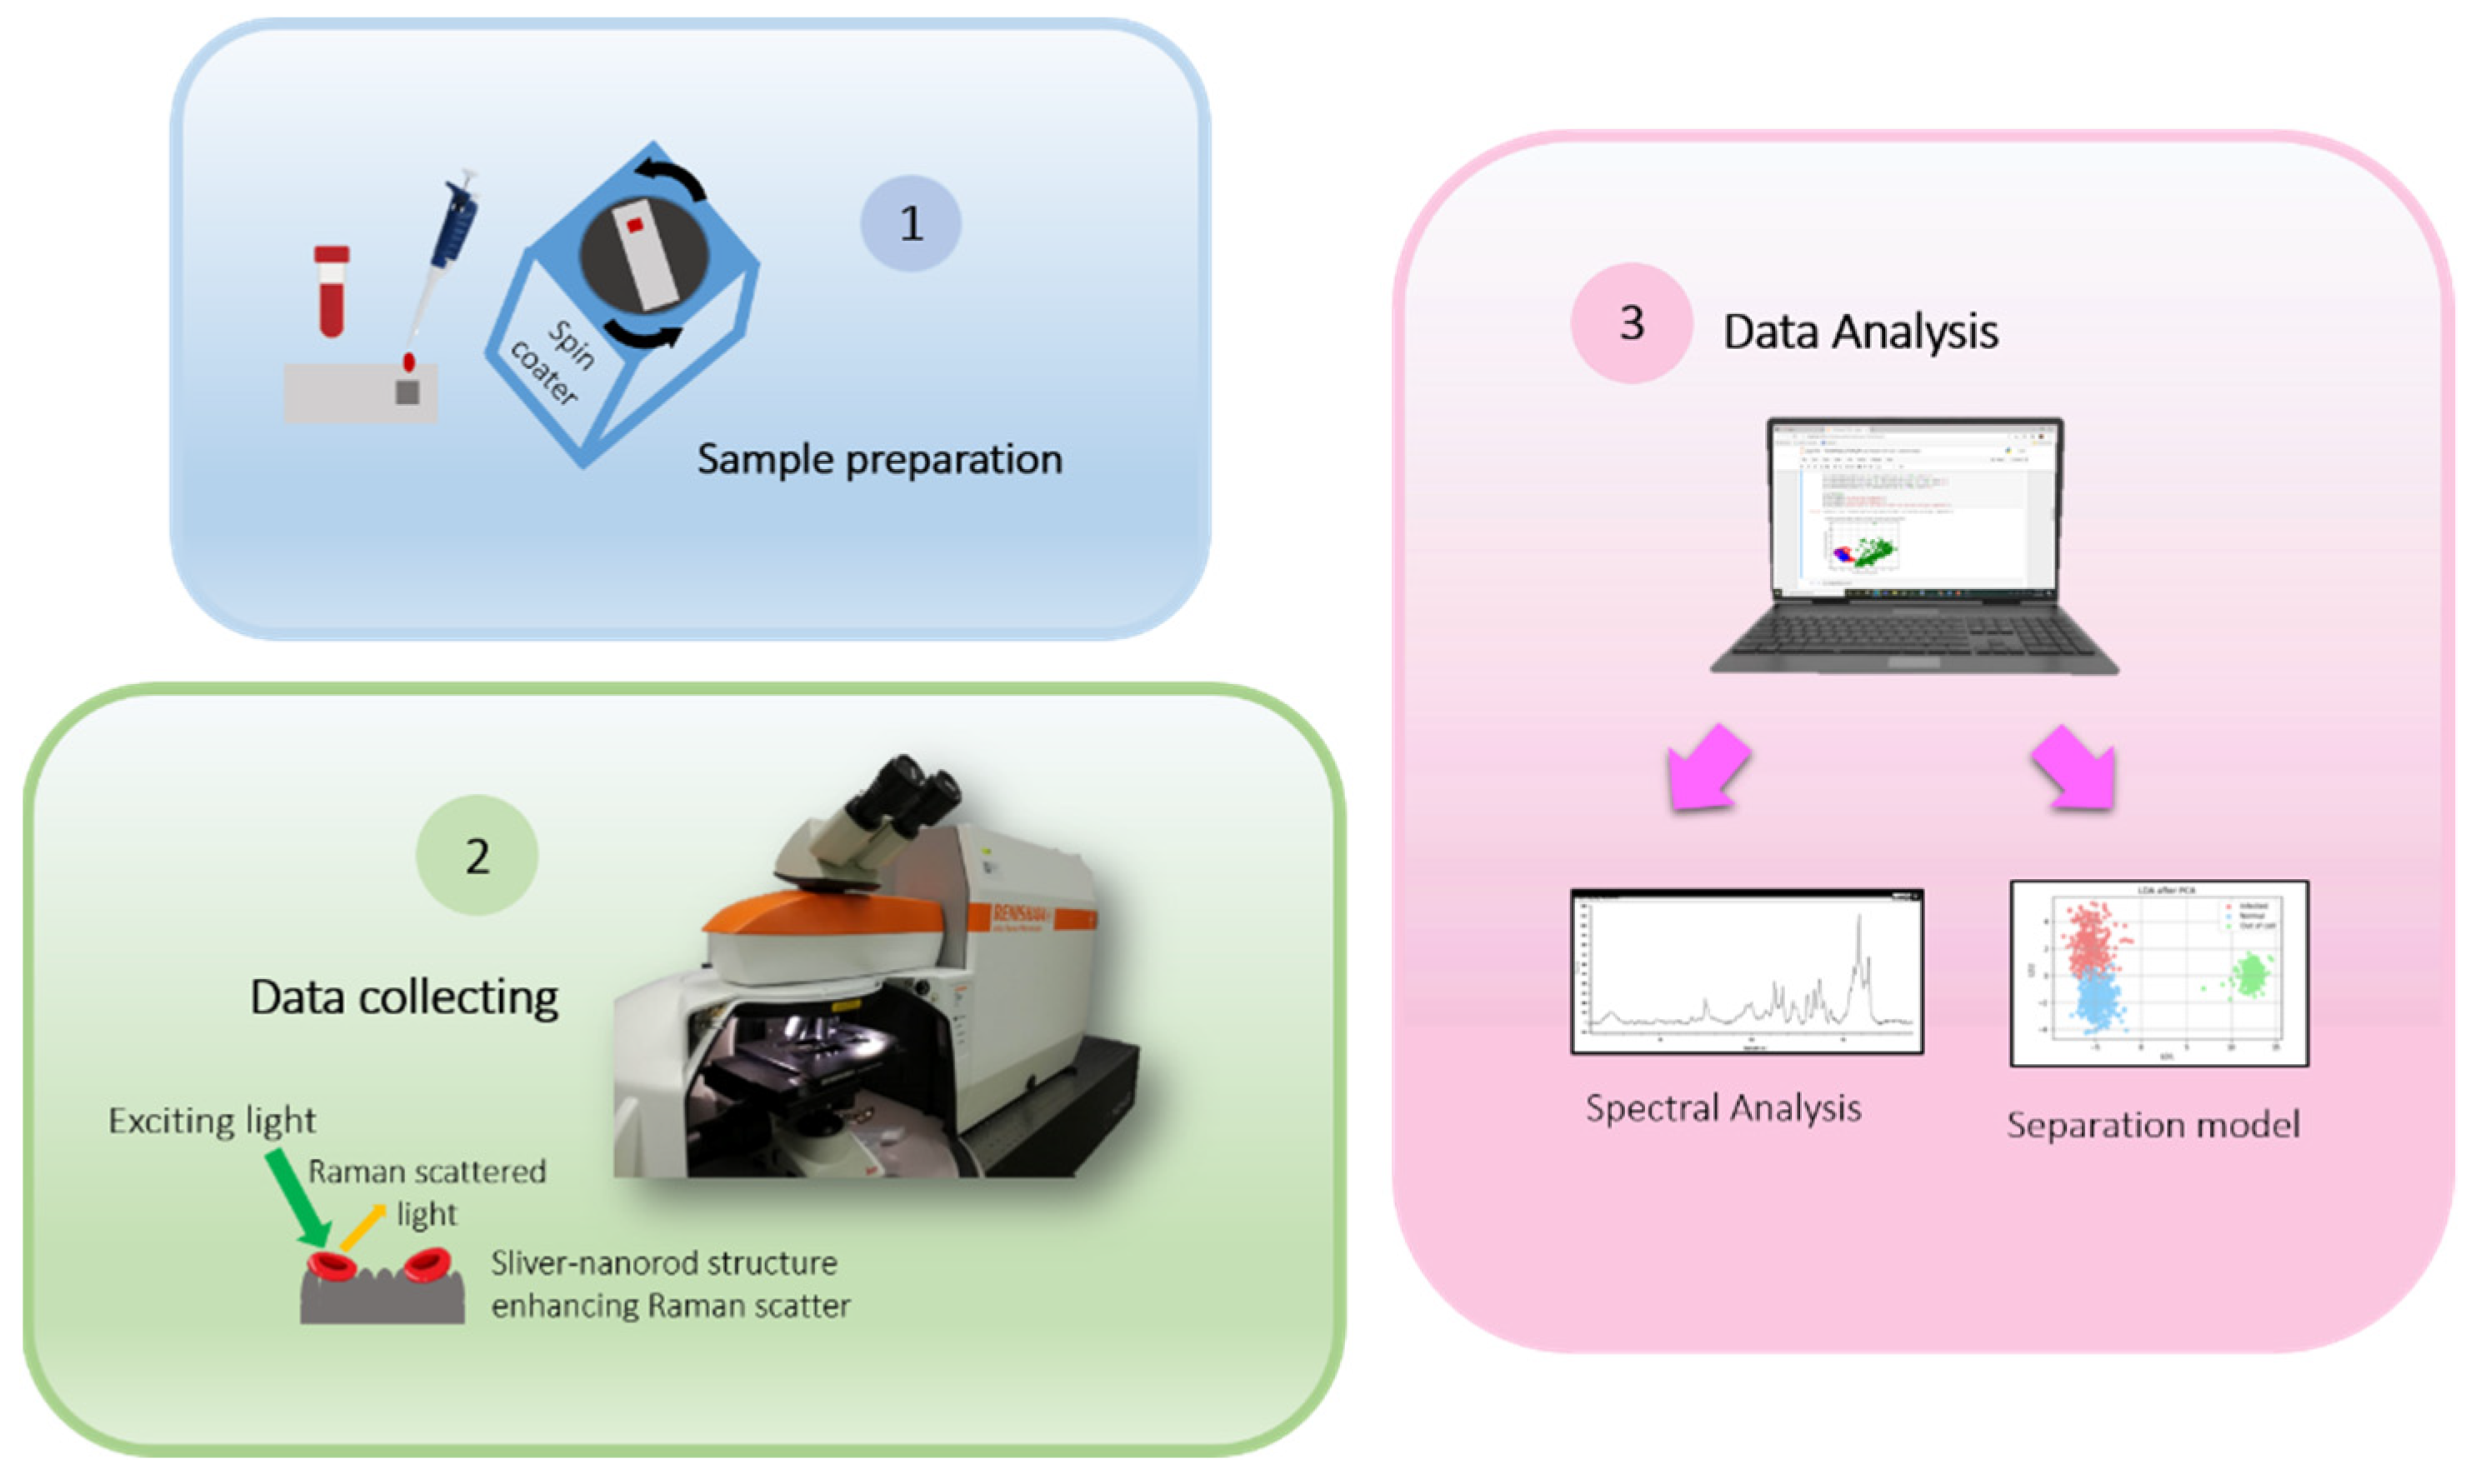
3. Methodology
3.1. Sample Preparation
3.1.1. Malaria-Infected Cell Sample
3.1.2. Normal Red Blood Cell Sample
3.2. Spectral Collection
3.2.1. Measurement Conditions
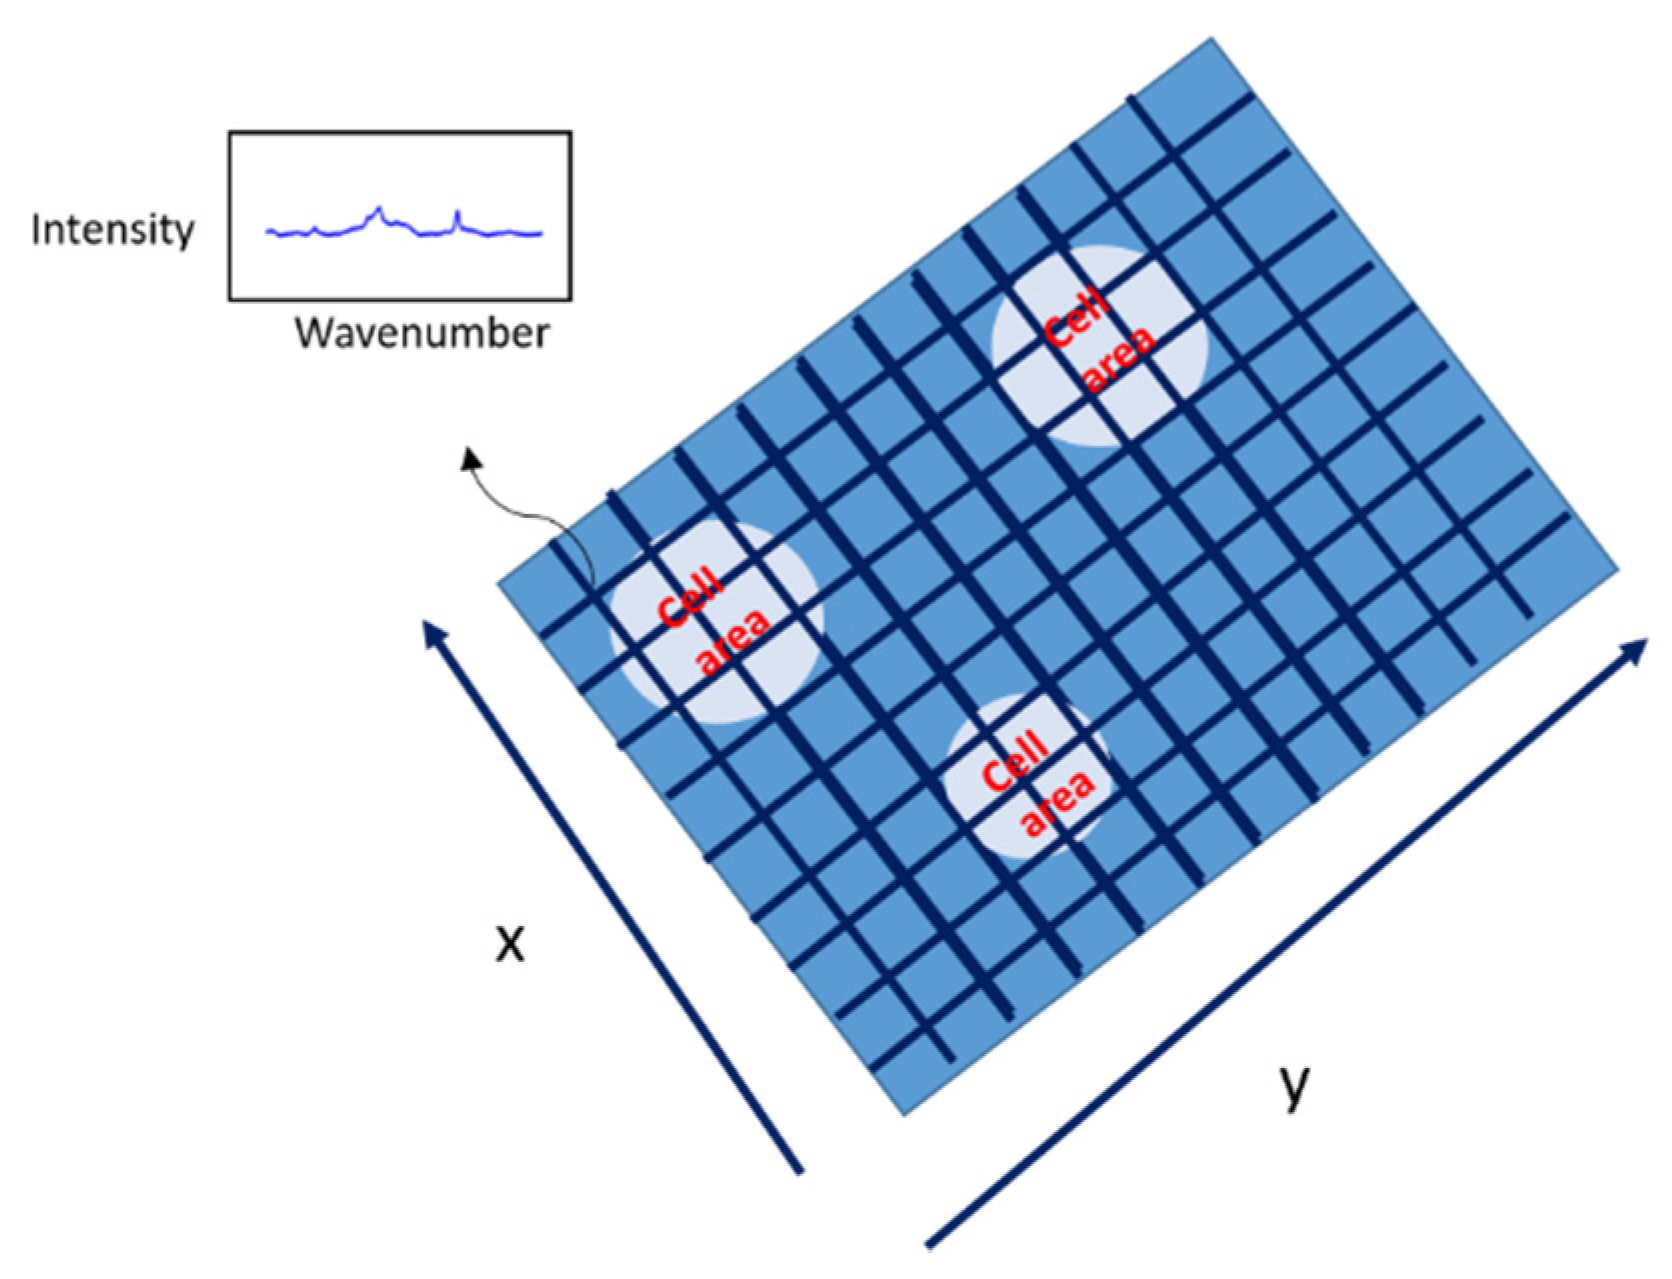
3.2.2. Pointing Spectral Collection
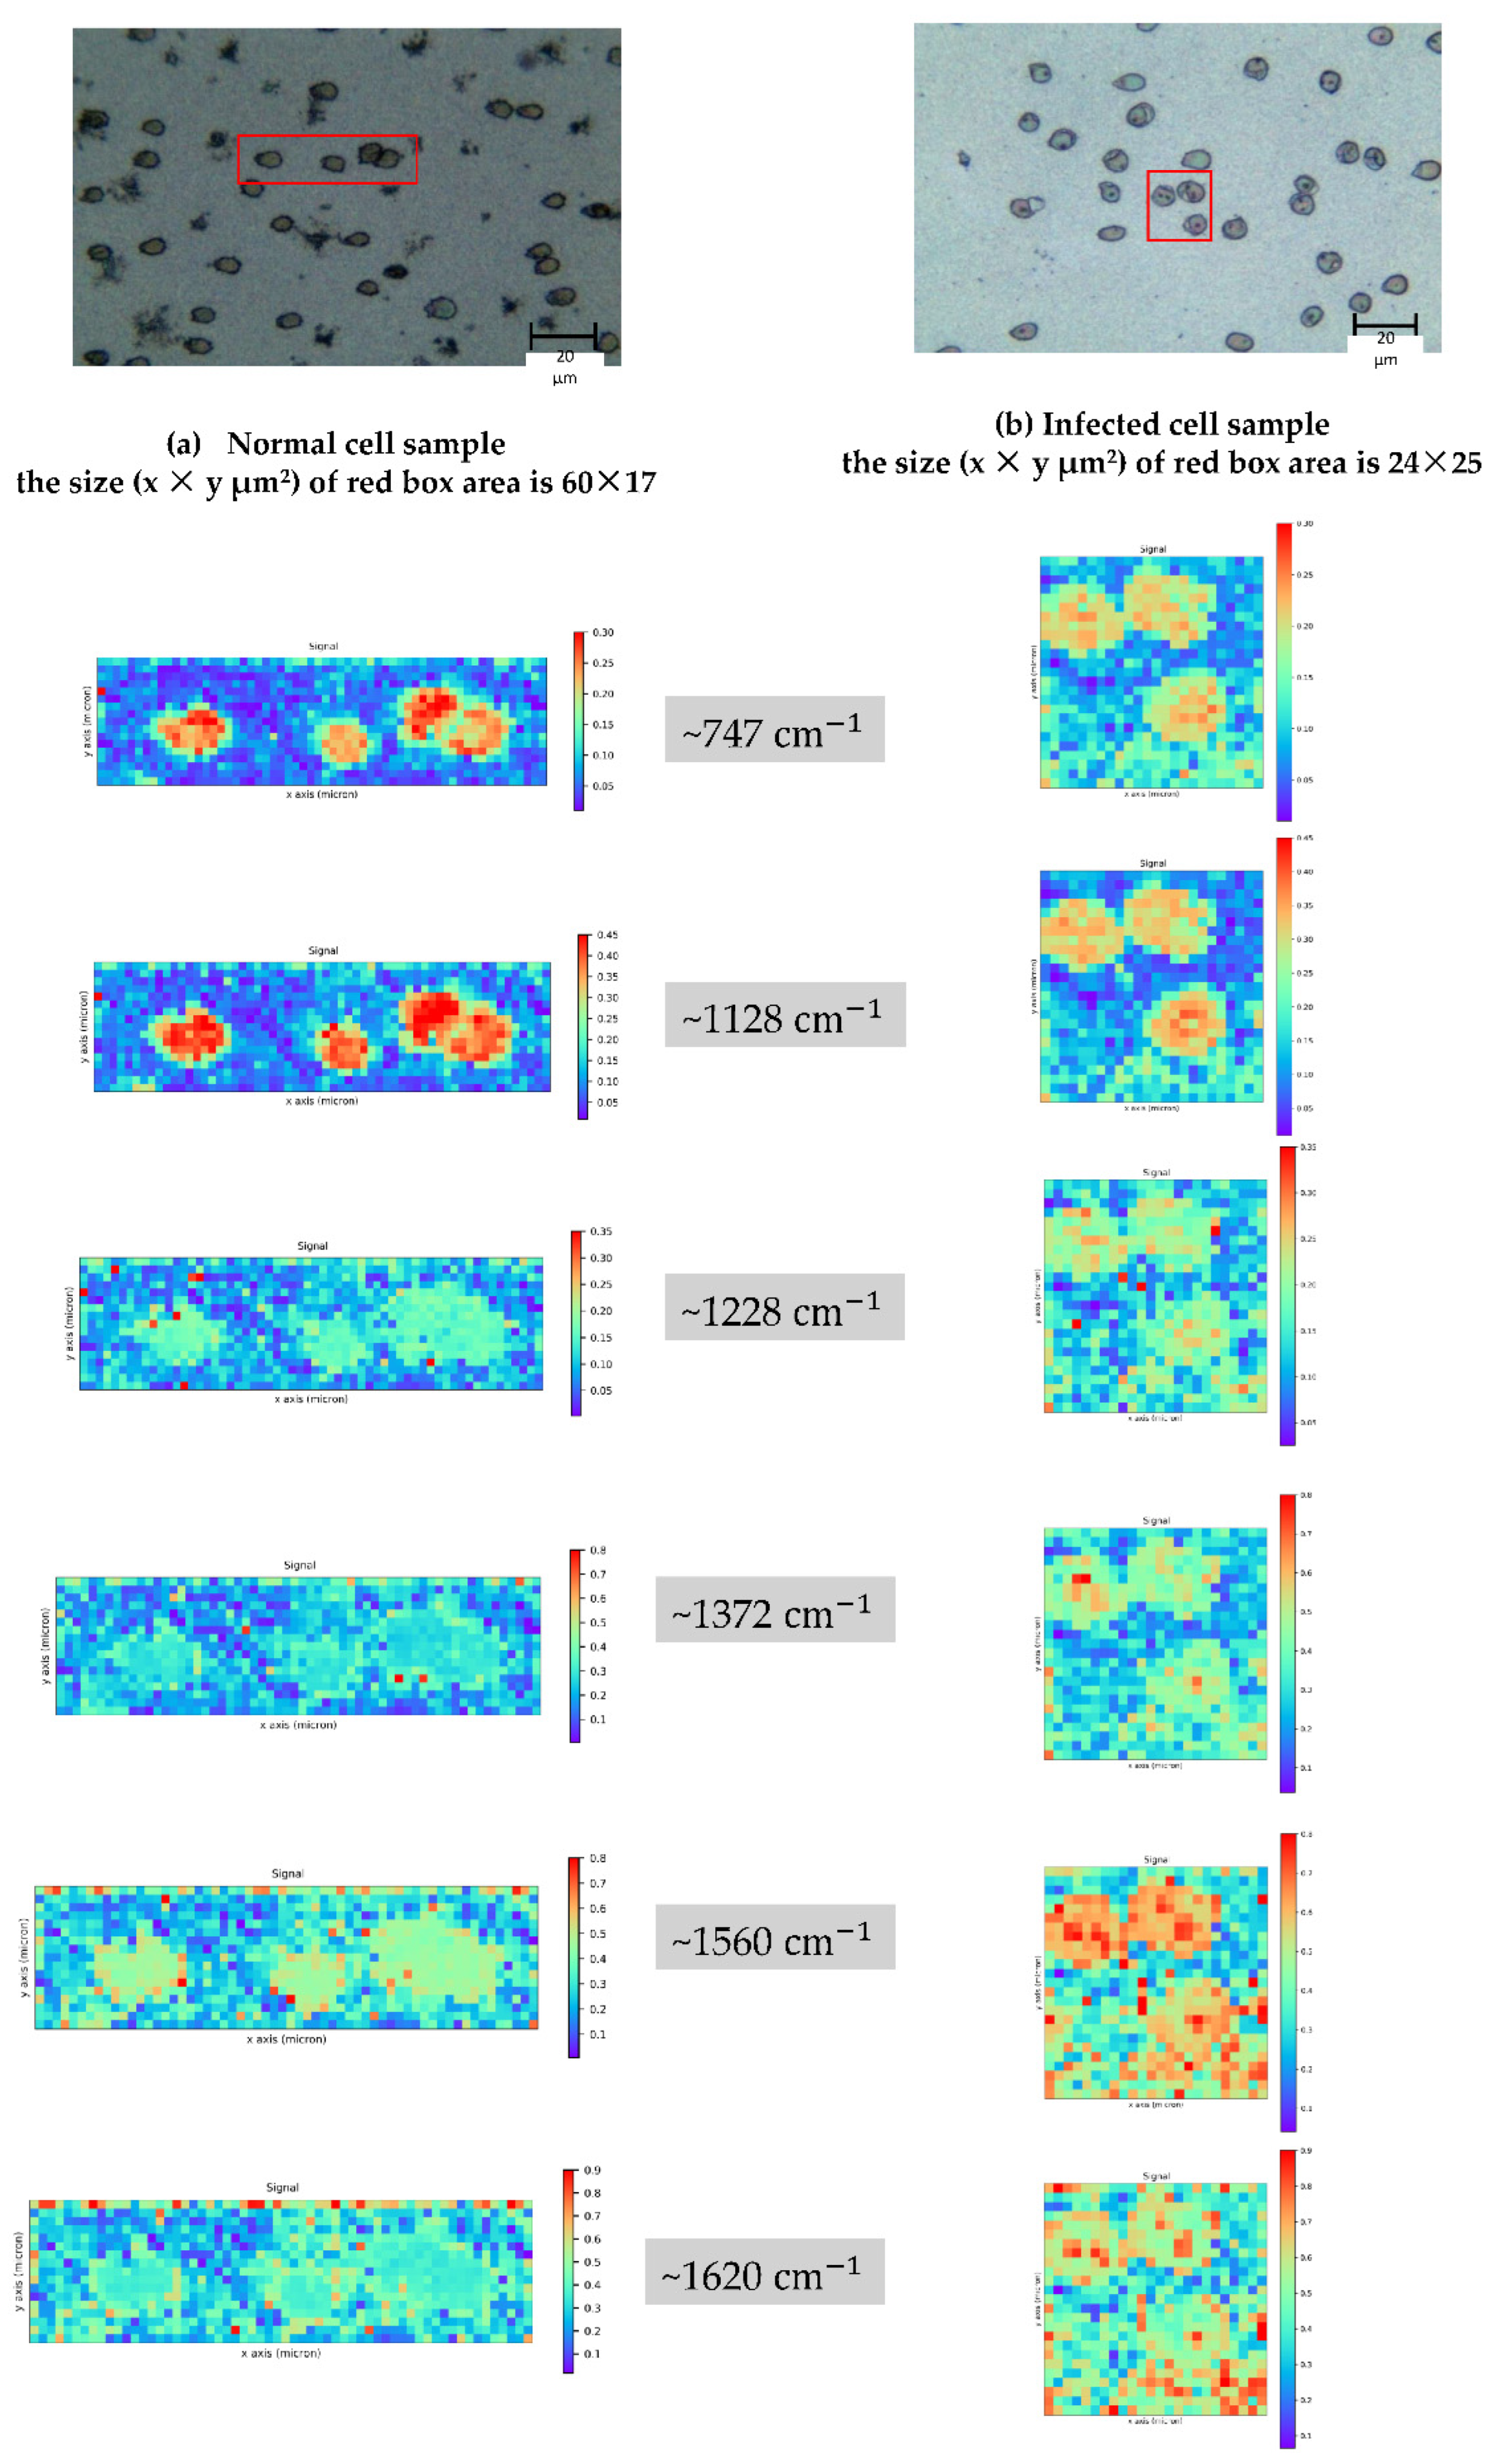
3.2.3. Area Spectral Collection
3.3. Data Analysis
3.3.1. Spectral Processing
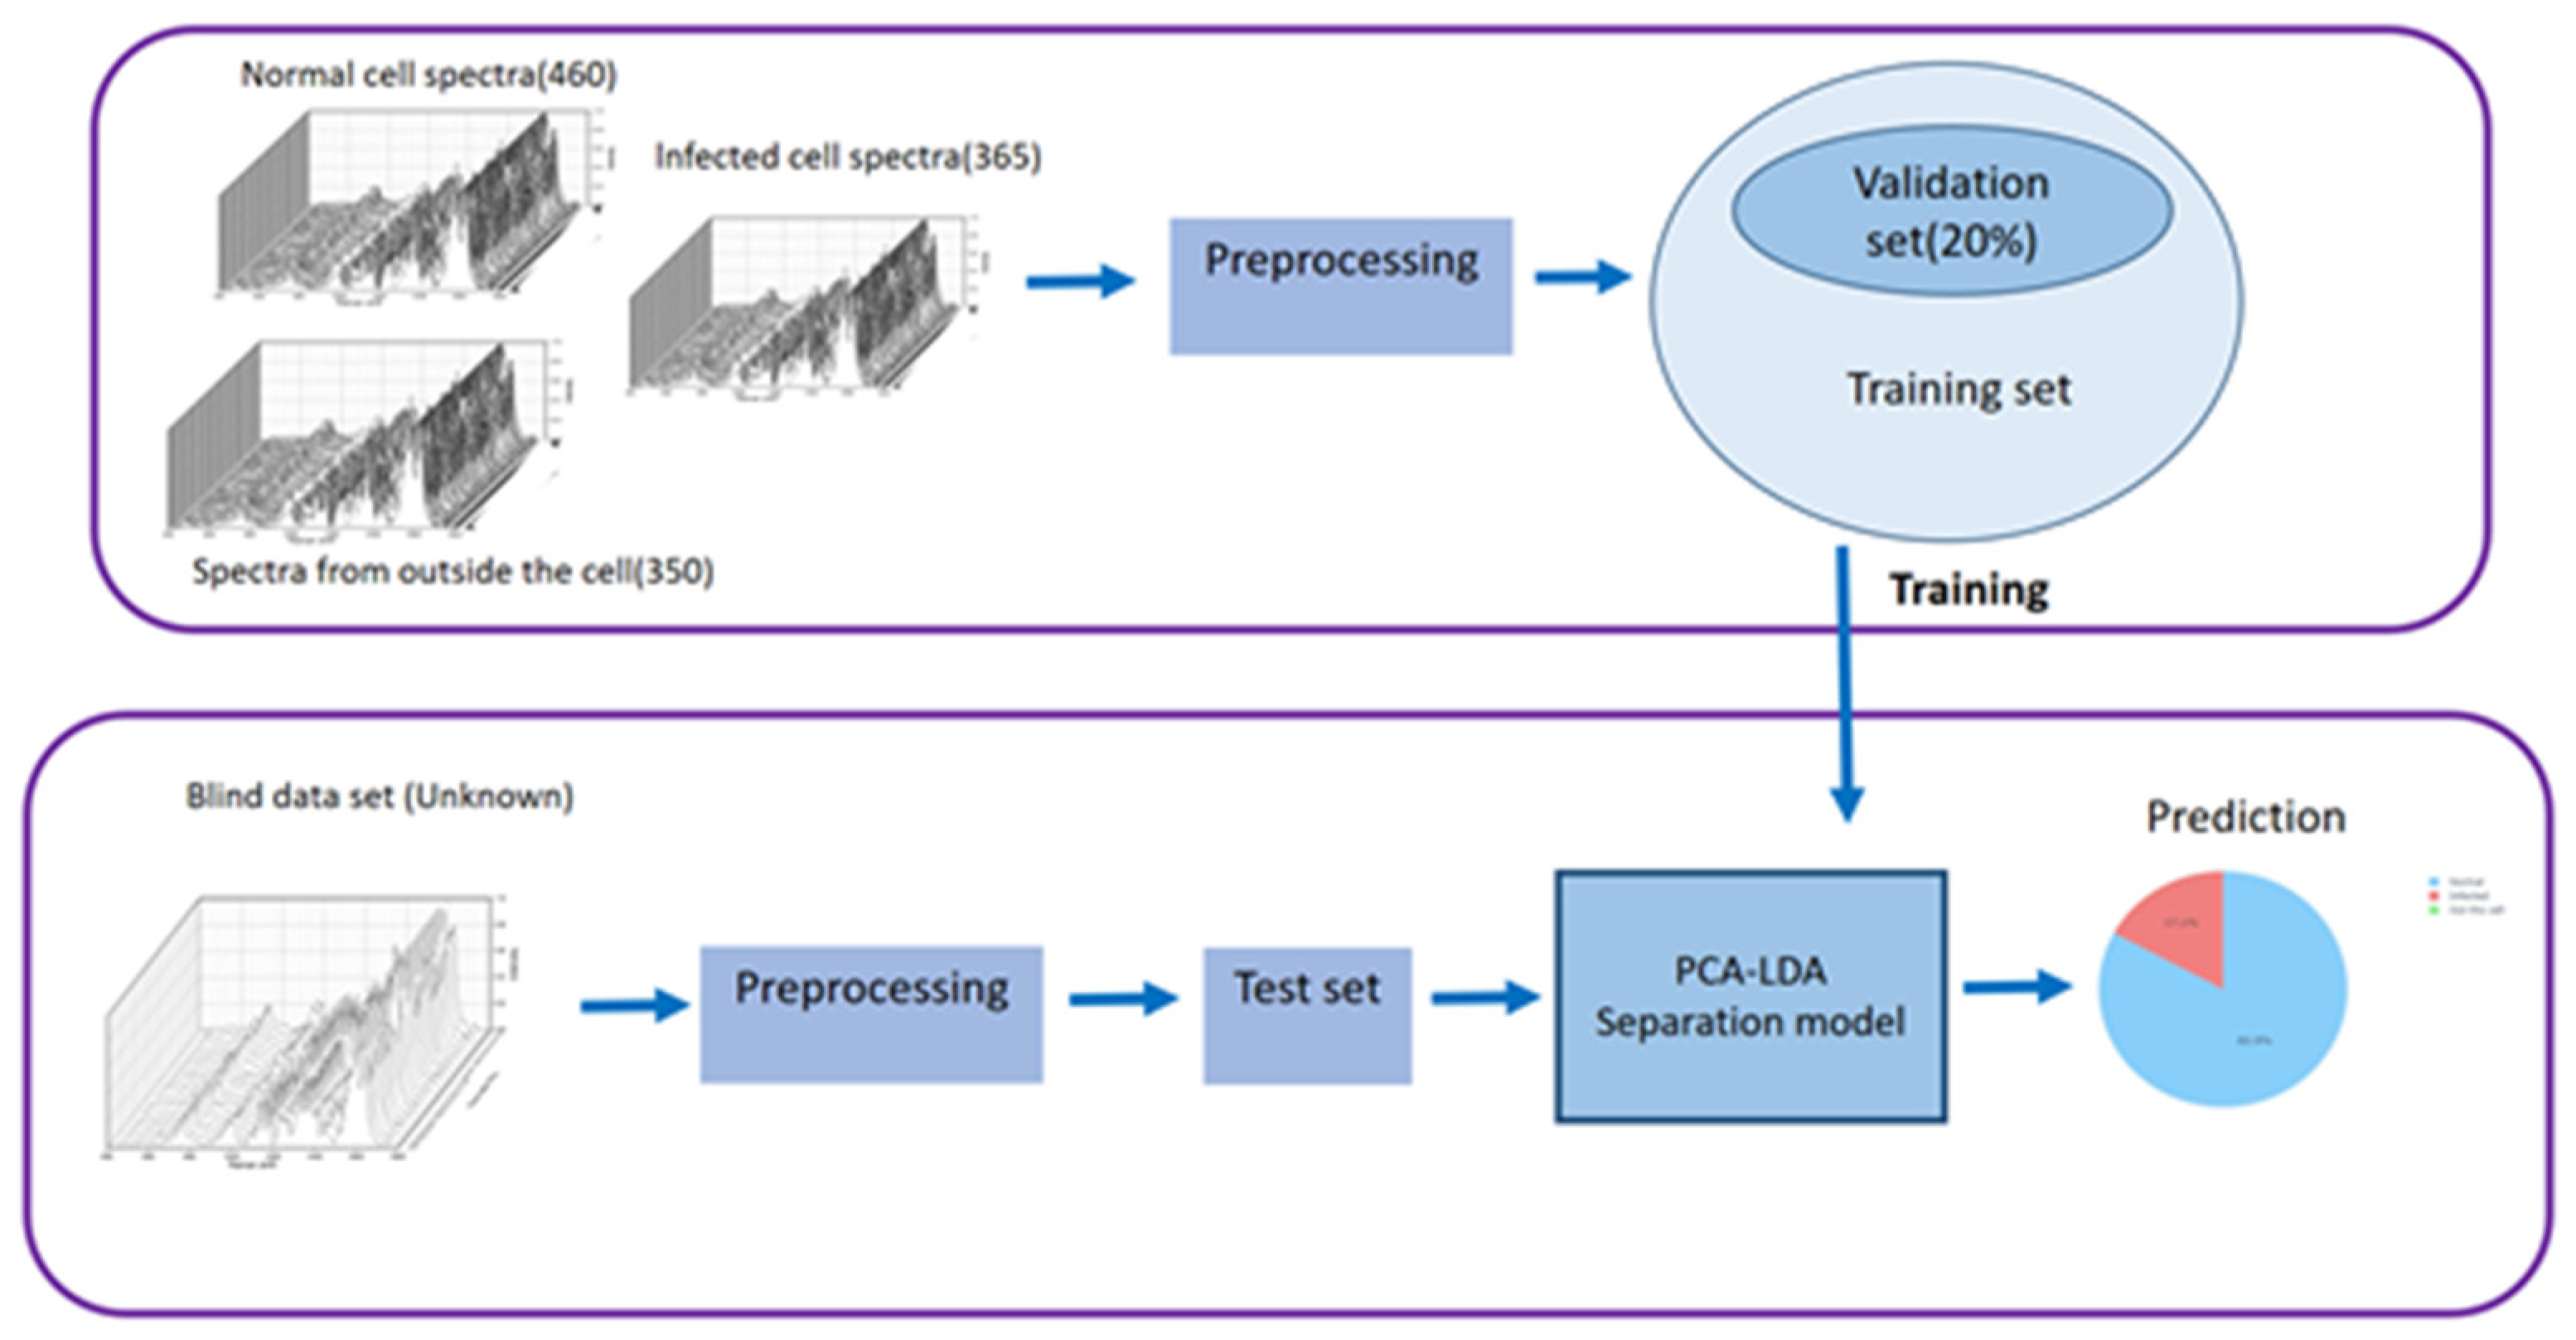
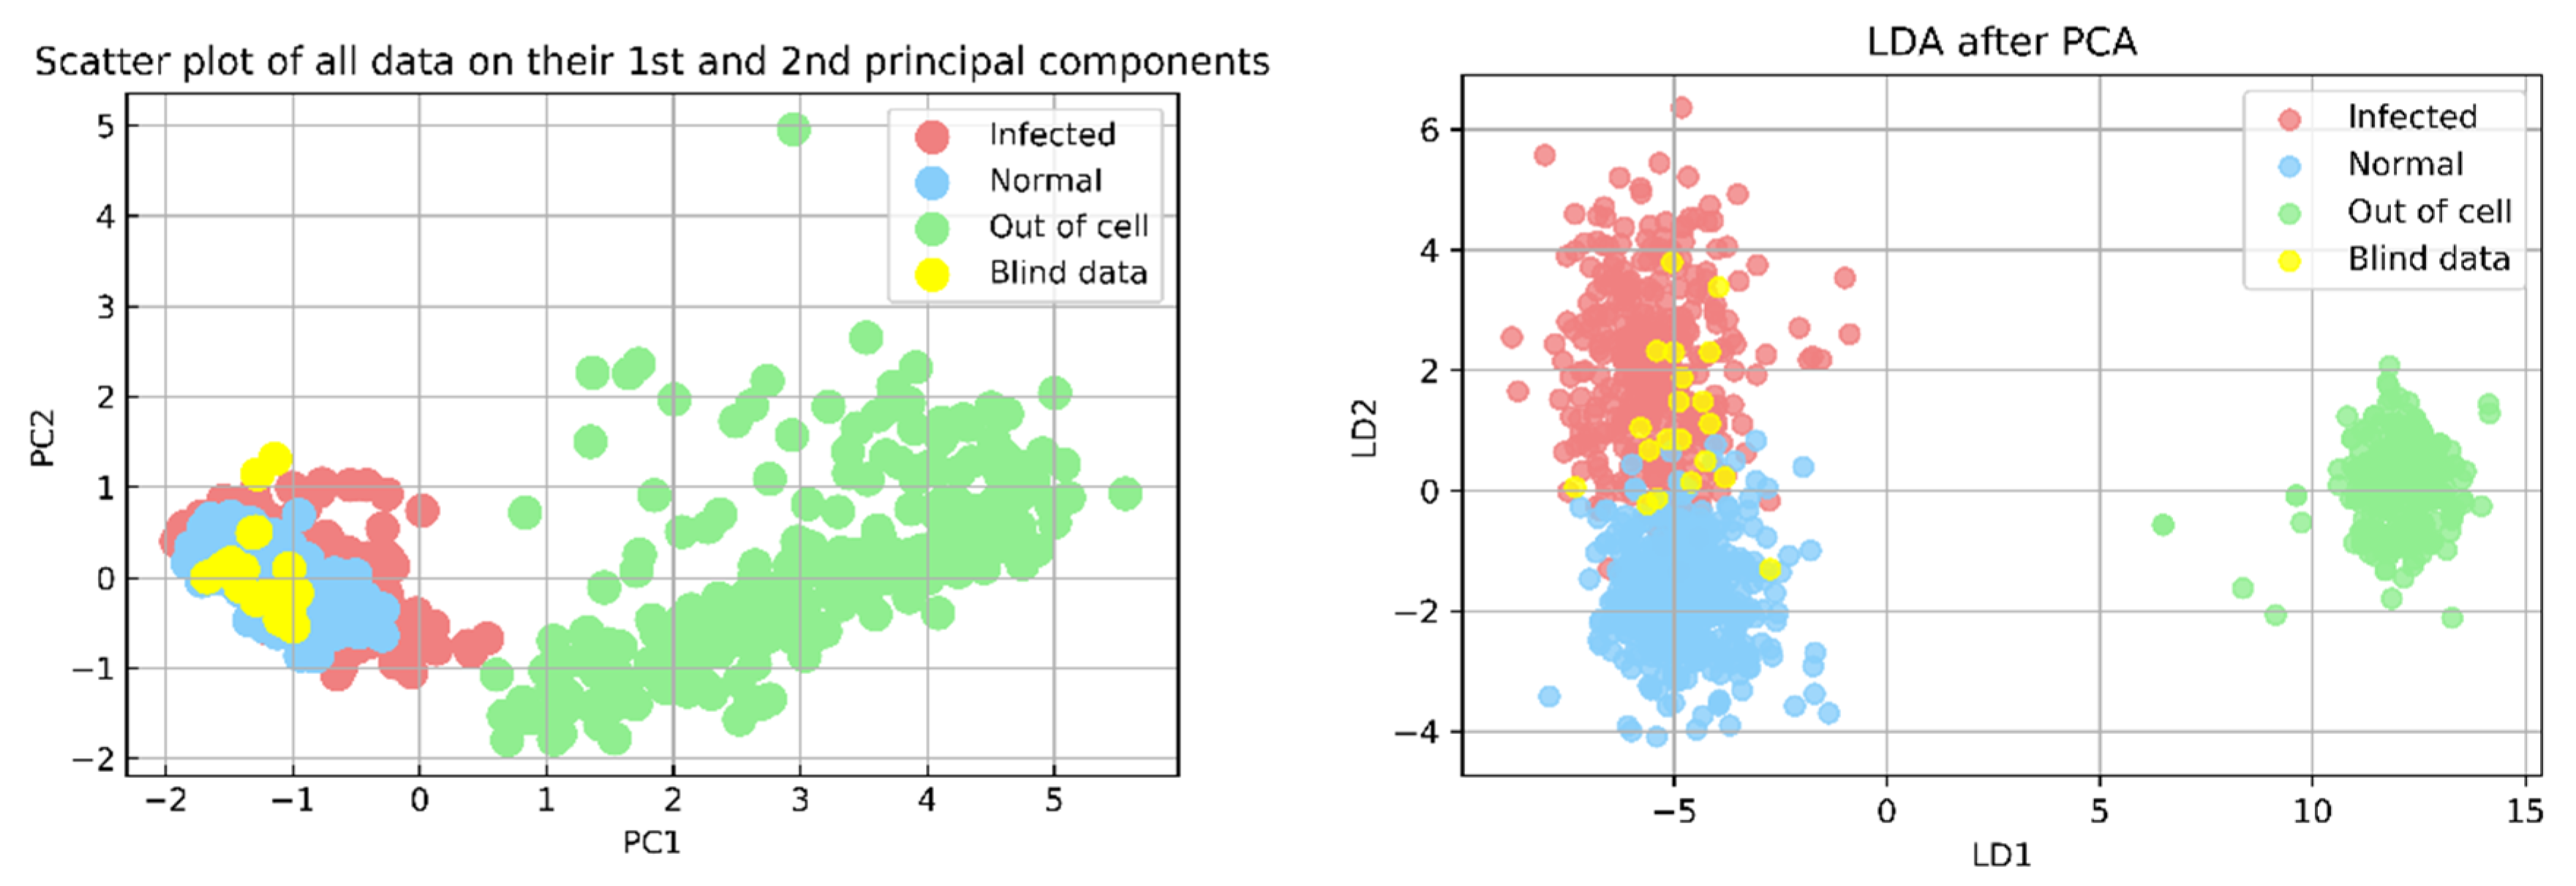
3.3.2. PCA-LDA Separation Model
- PCA-LDA Discrimination Analysis
- Blind Test
4. Results and Discussion
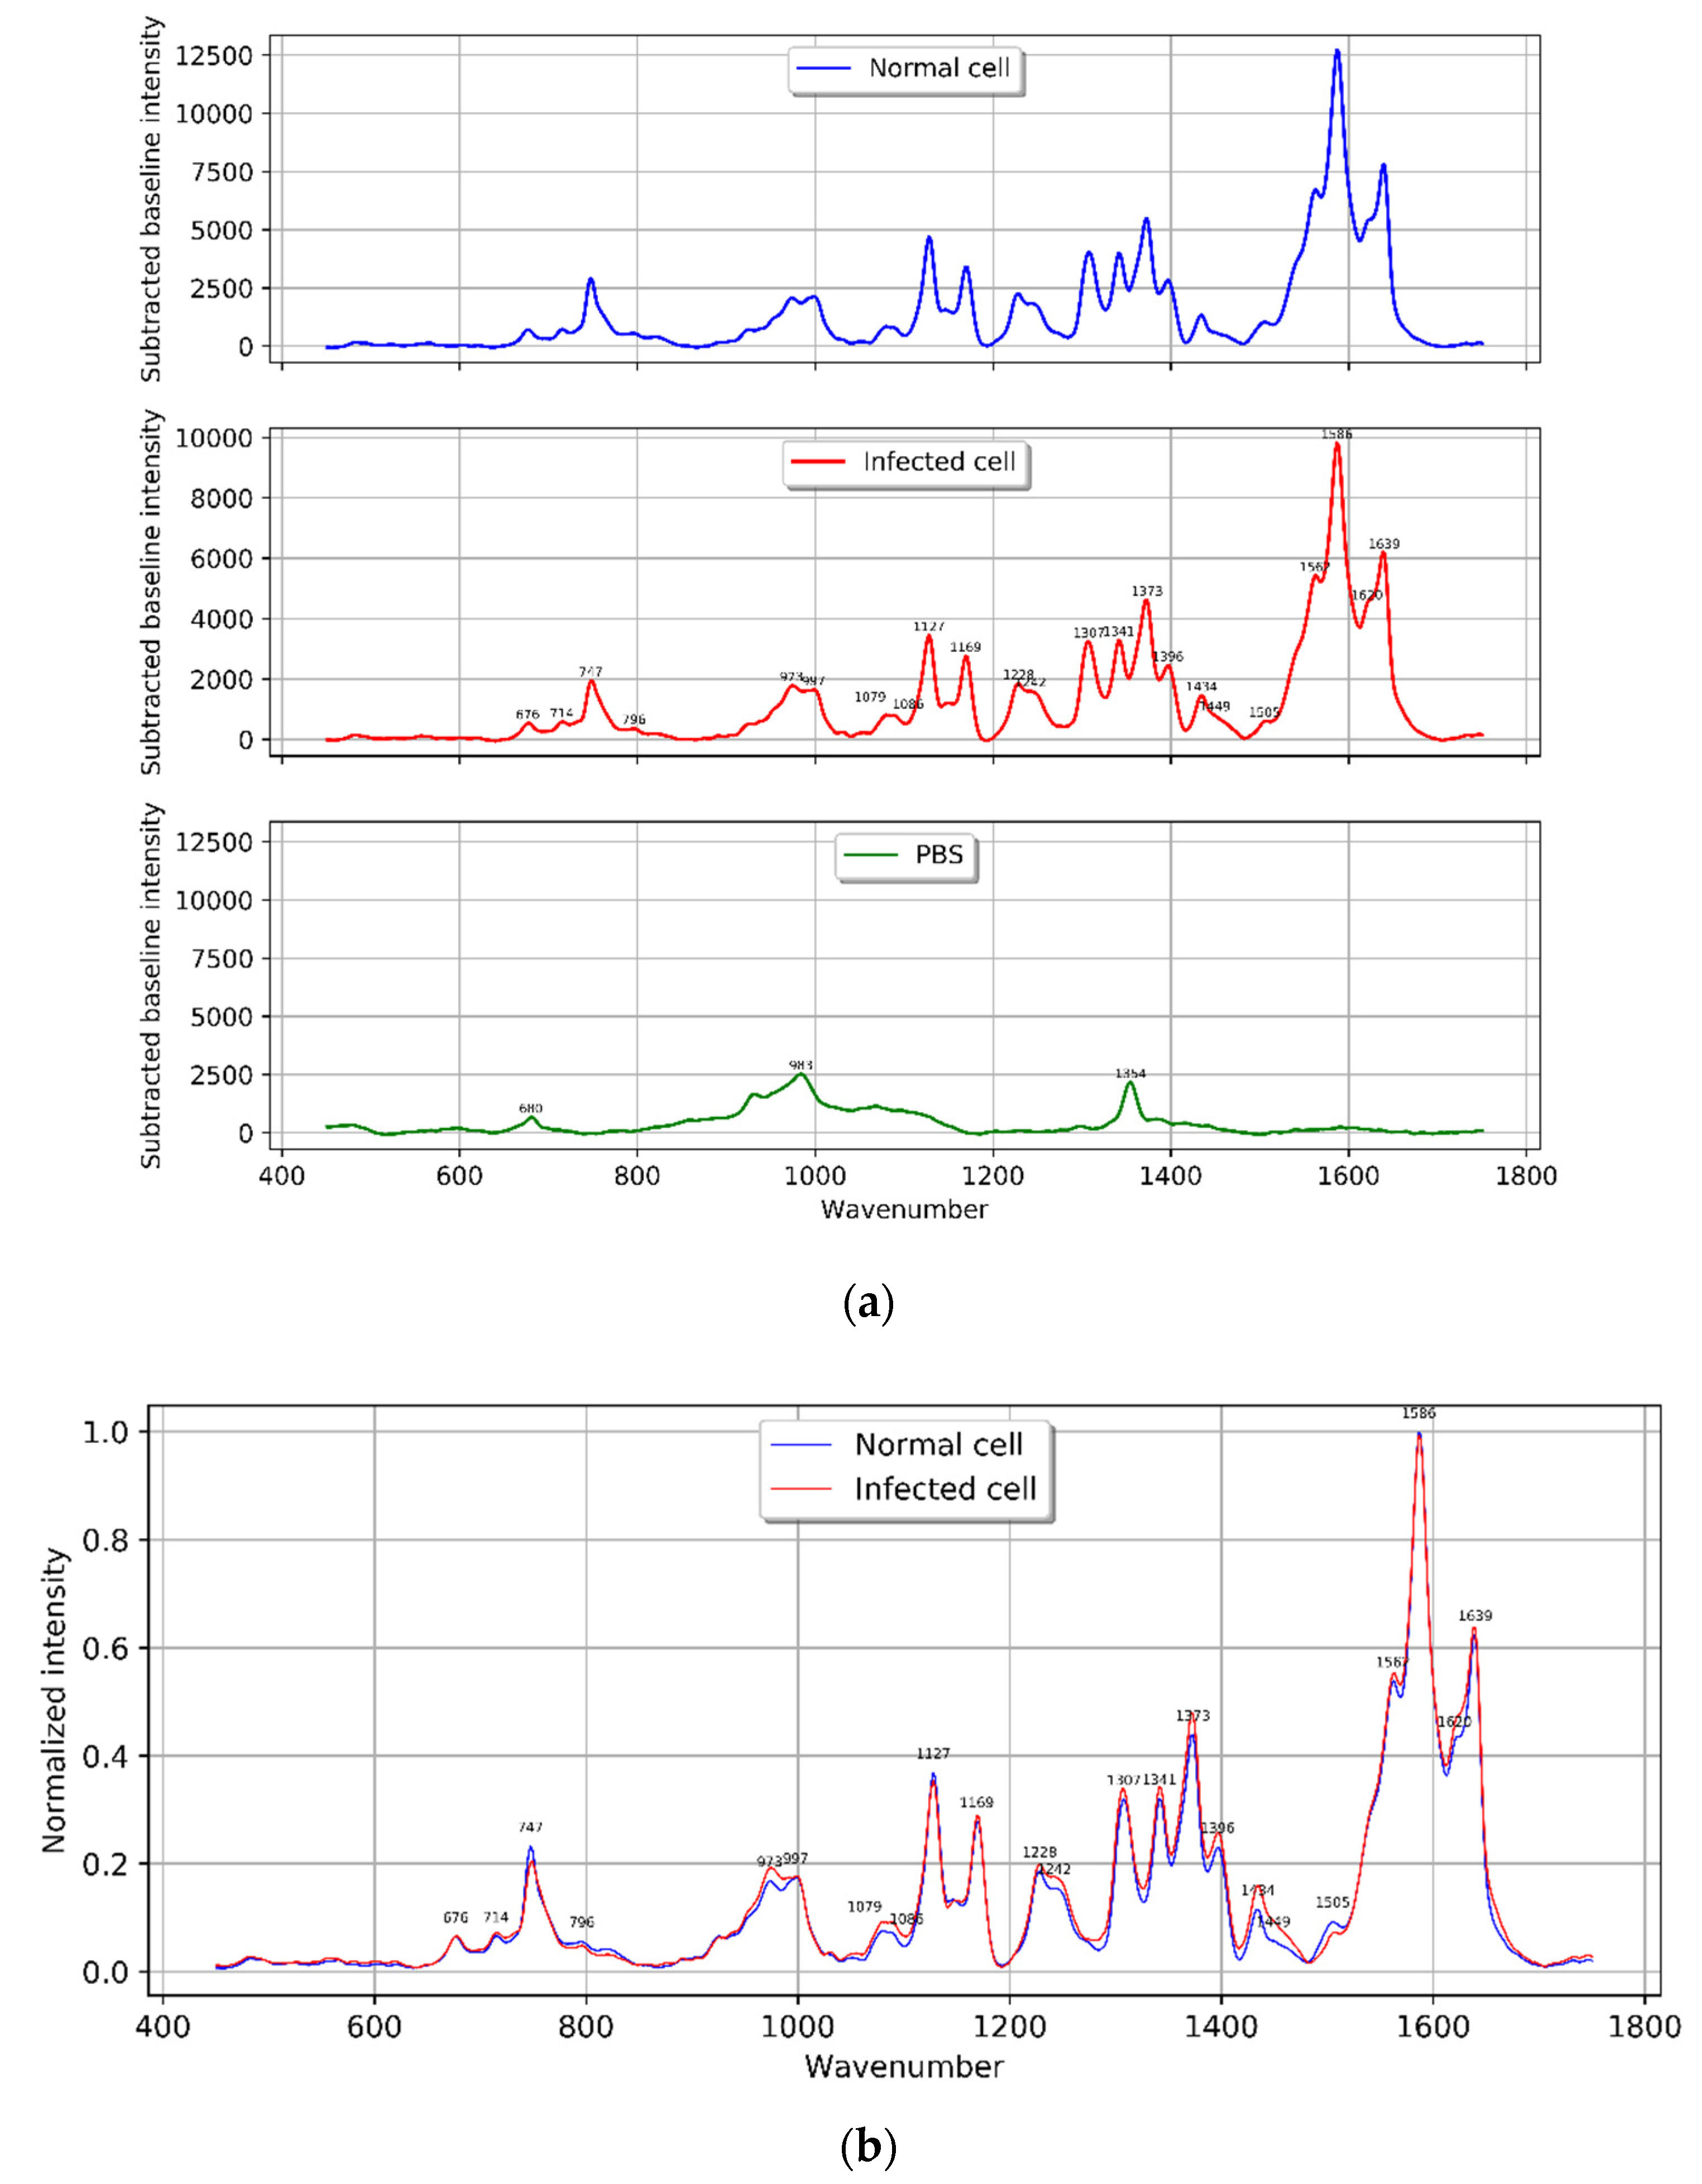
4.1. Characterization of Normal and Infected Red Blood Cell Raman Spectra
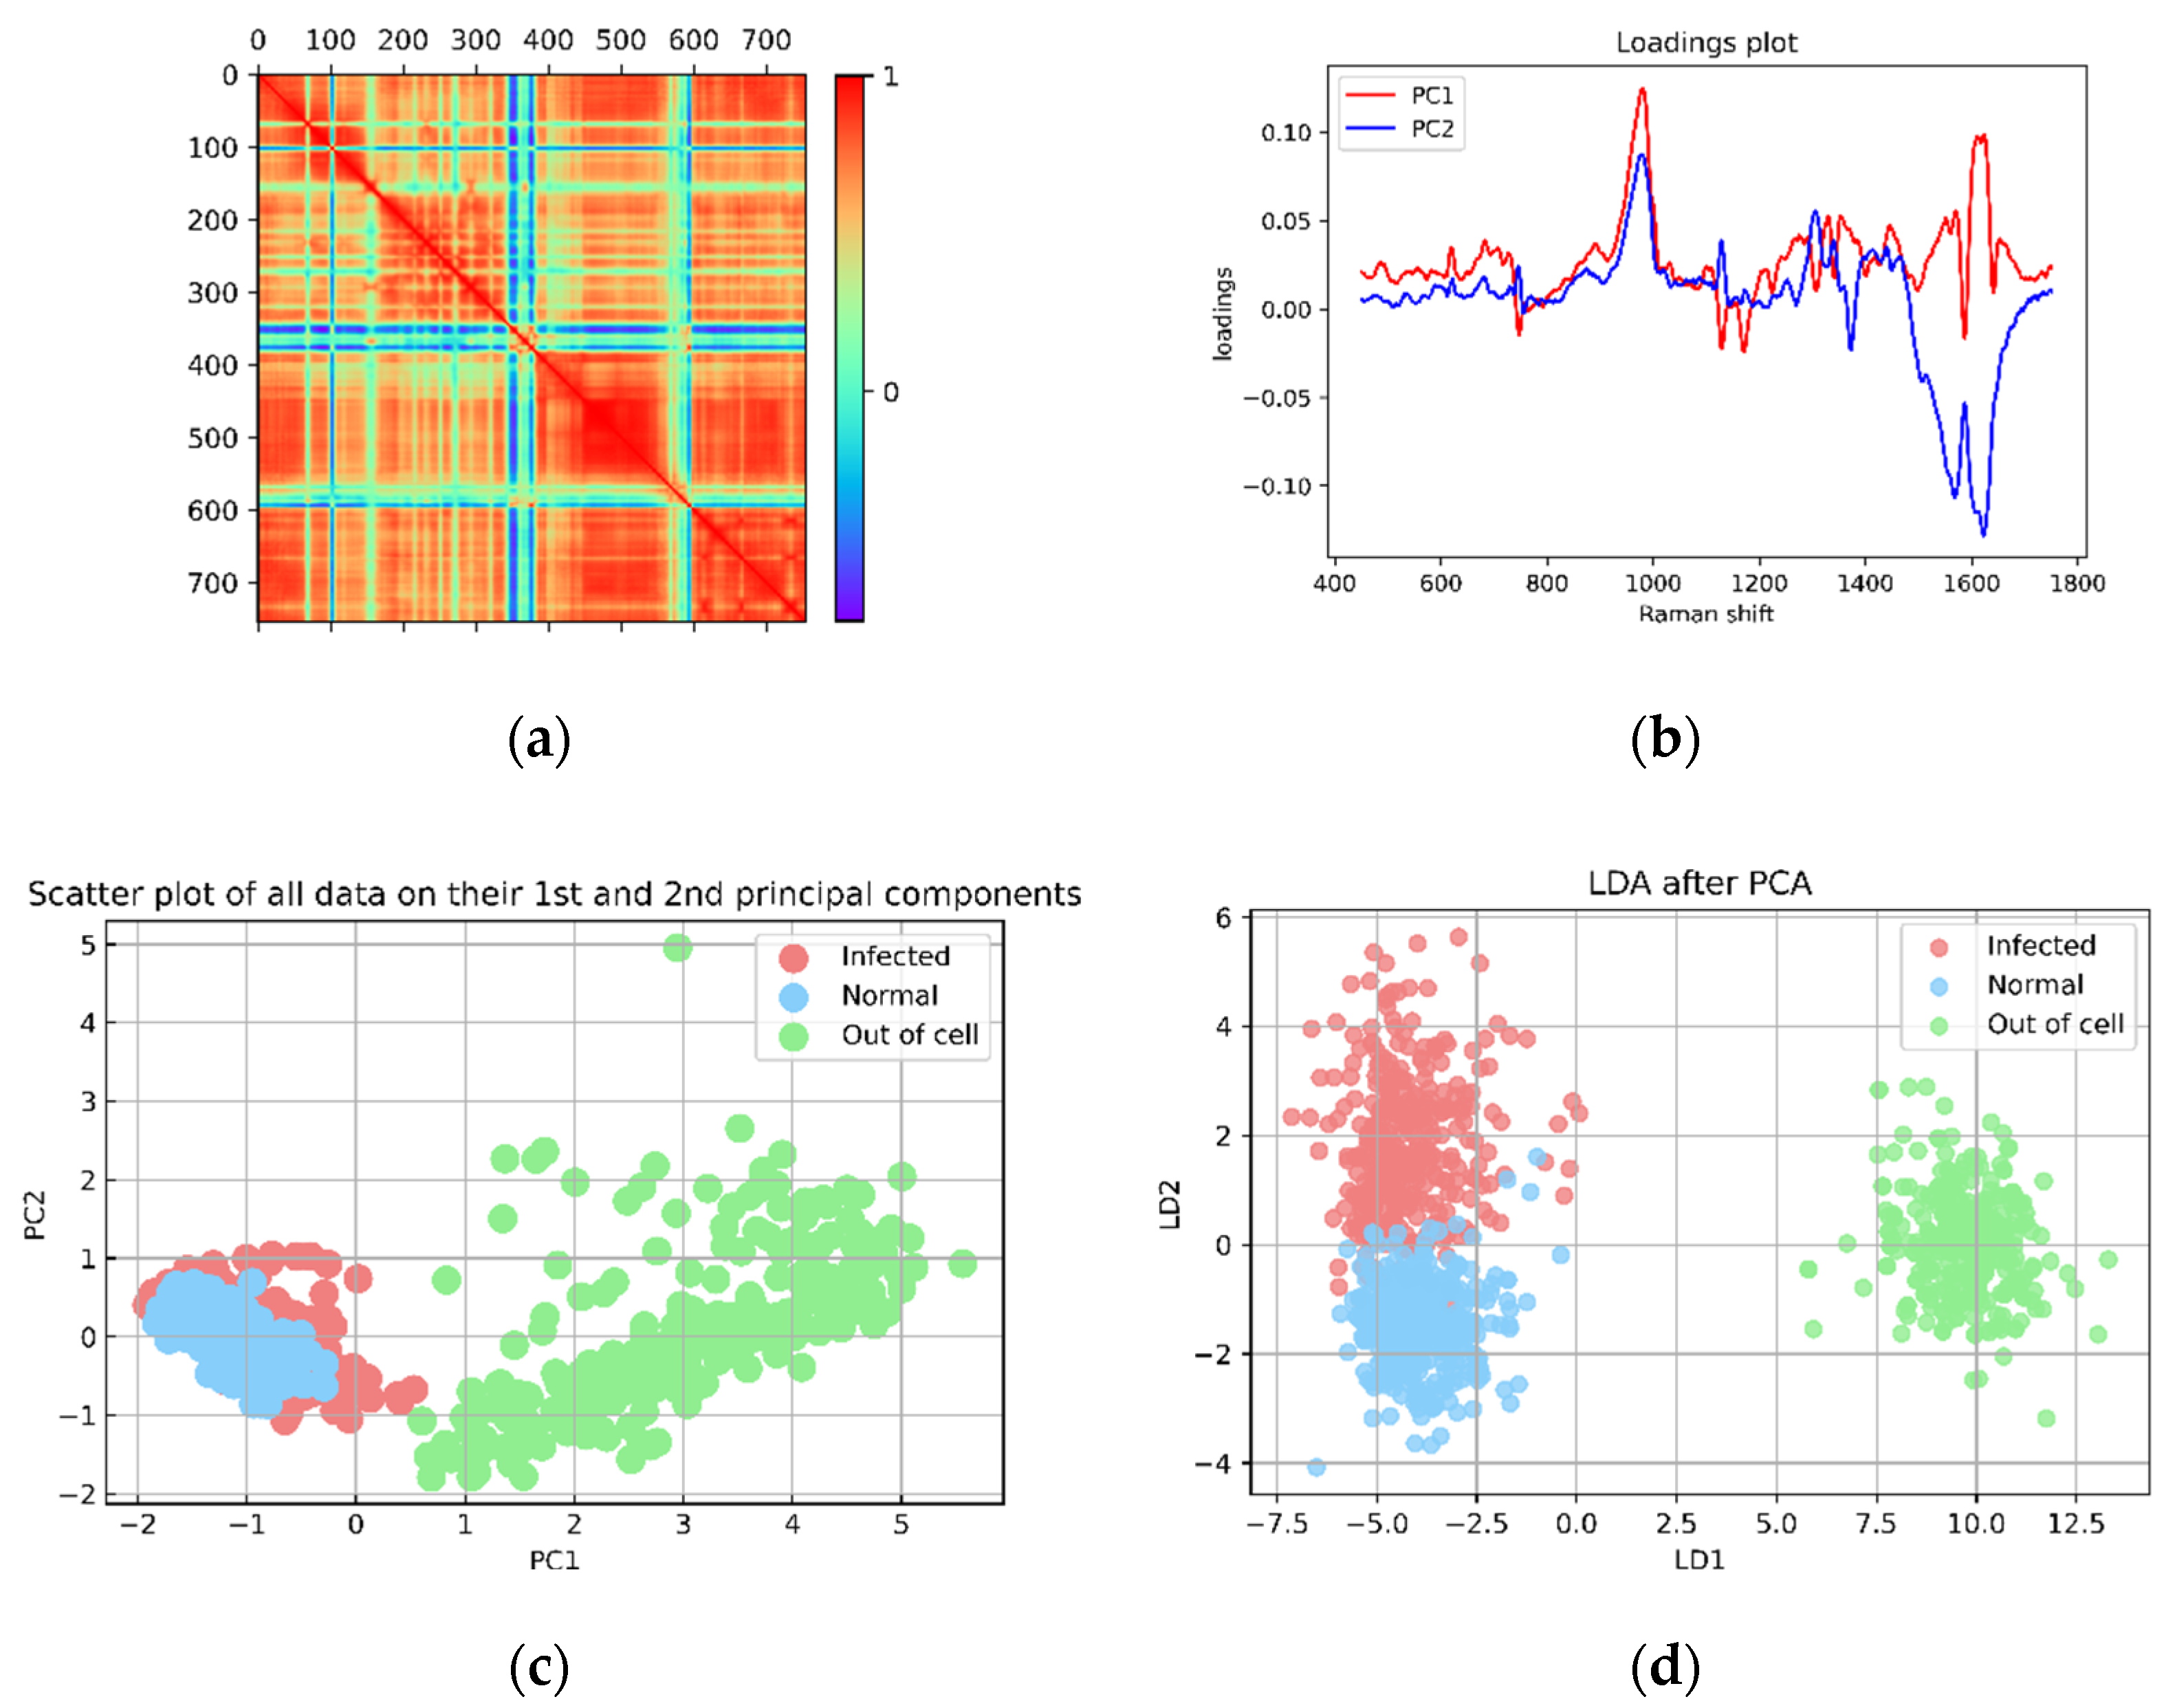
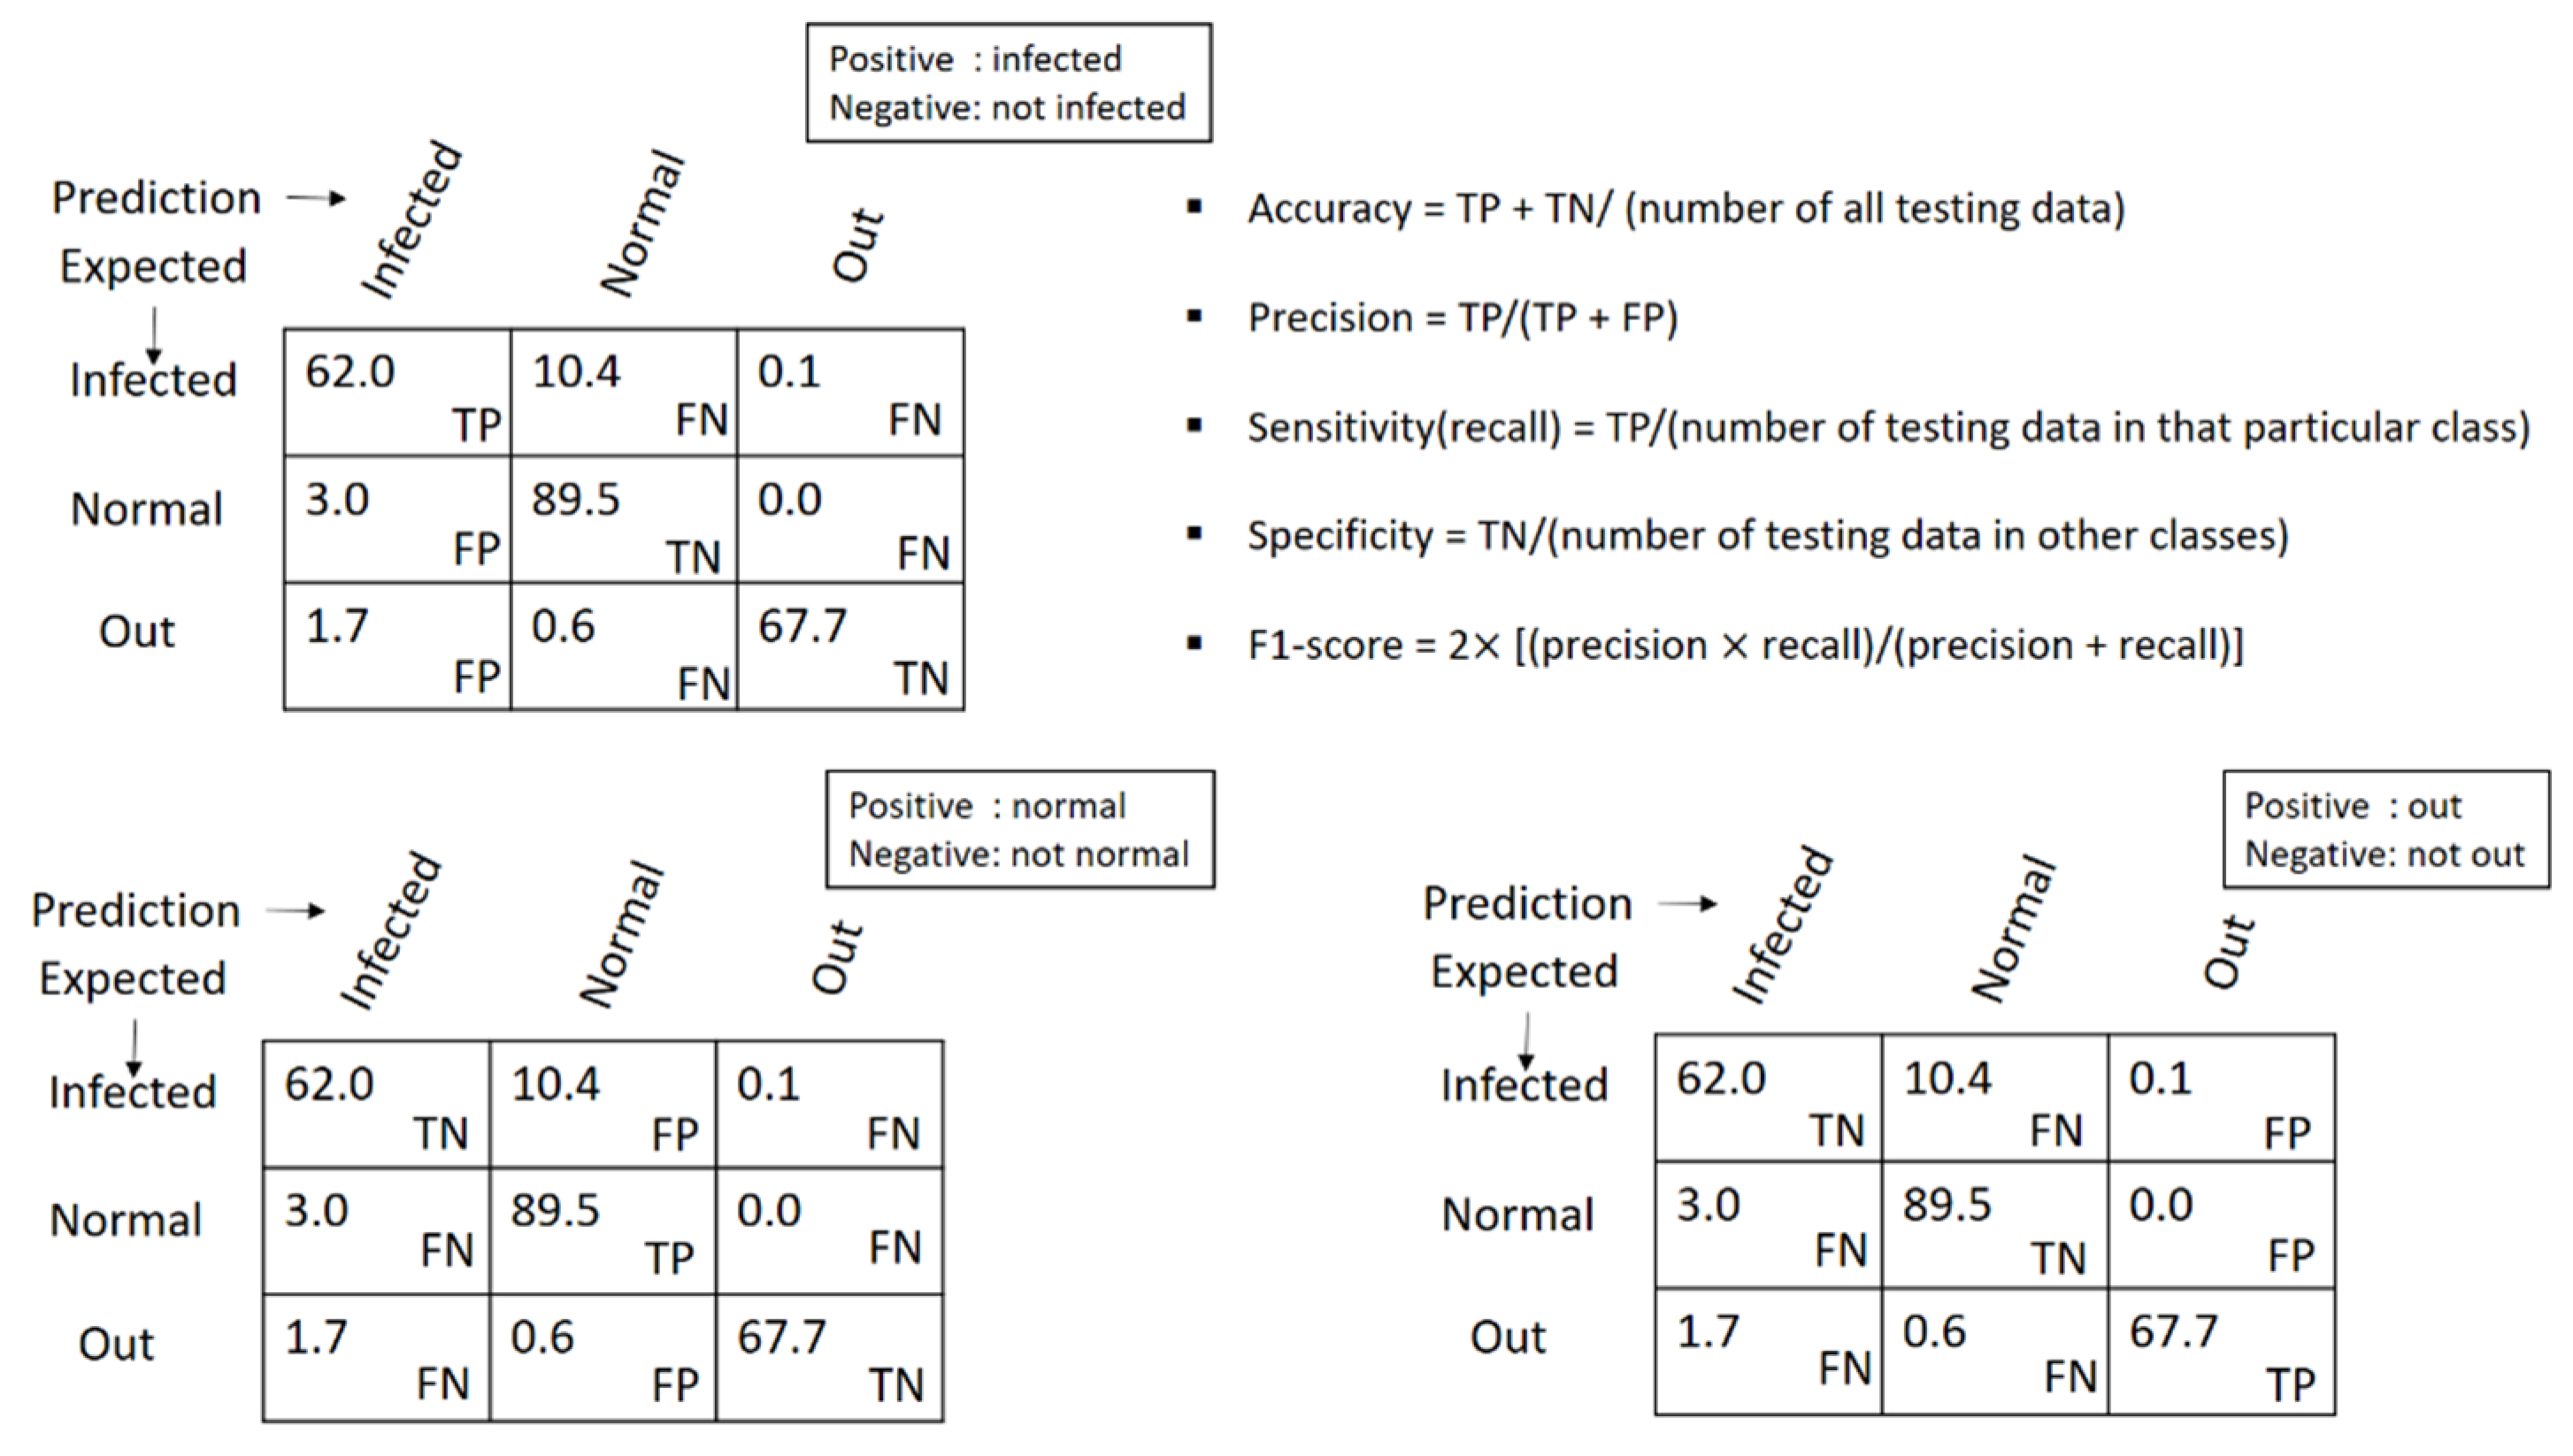
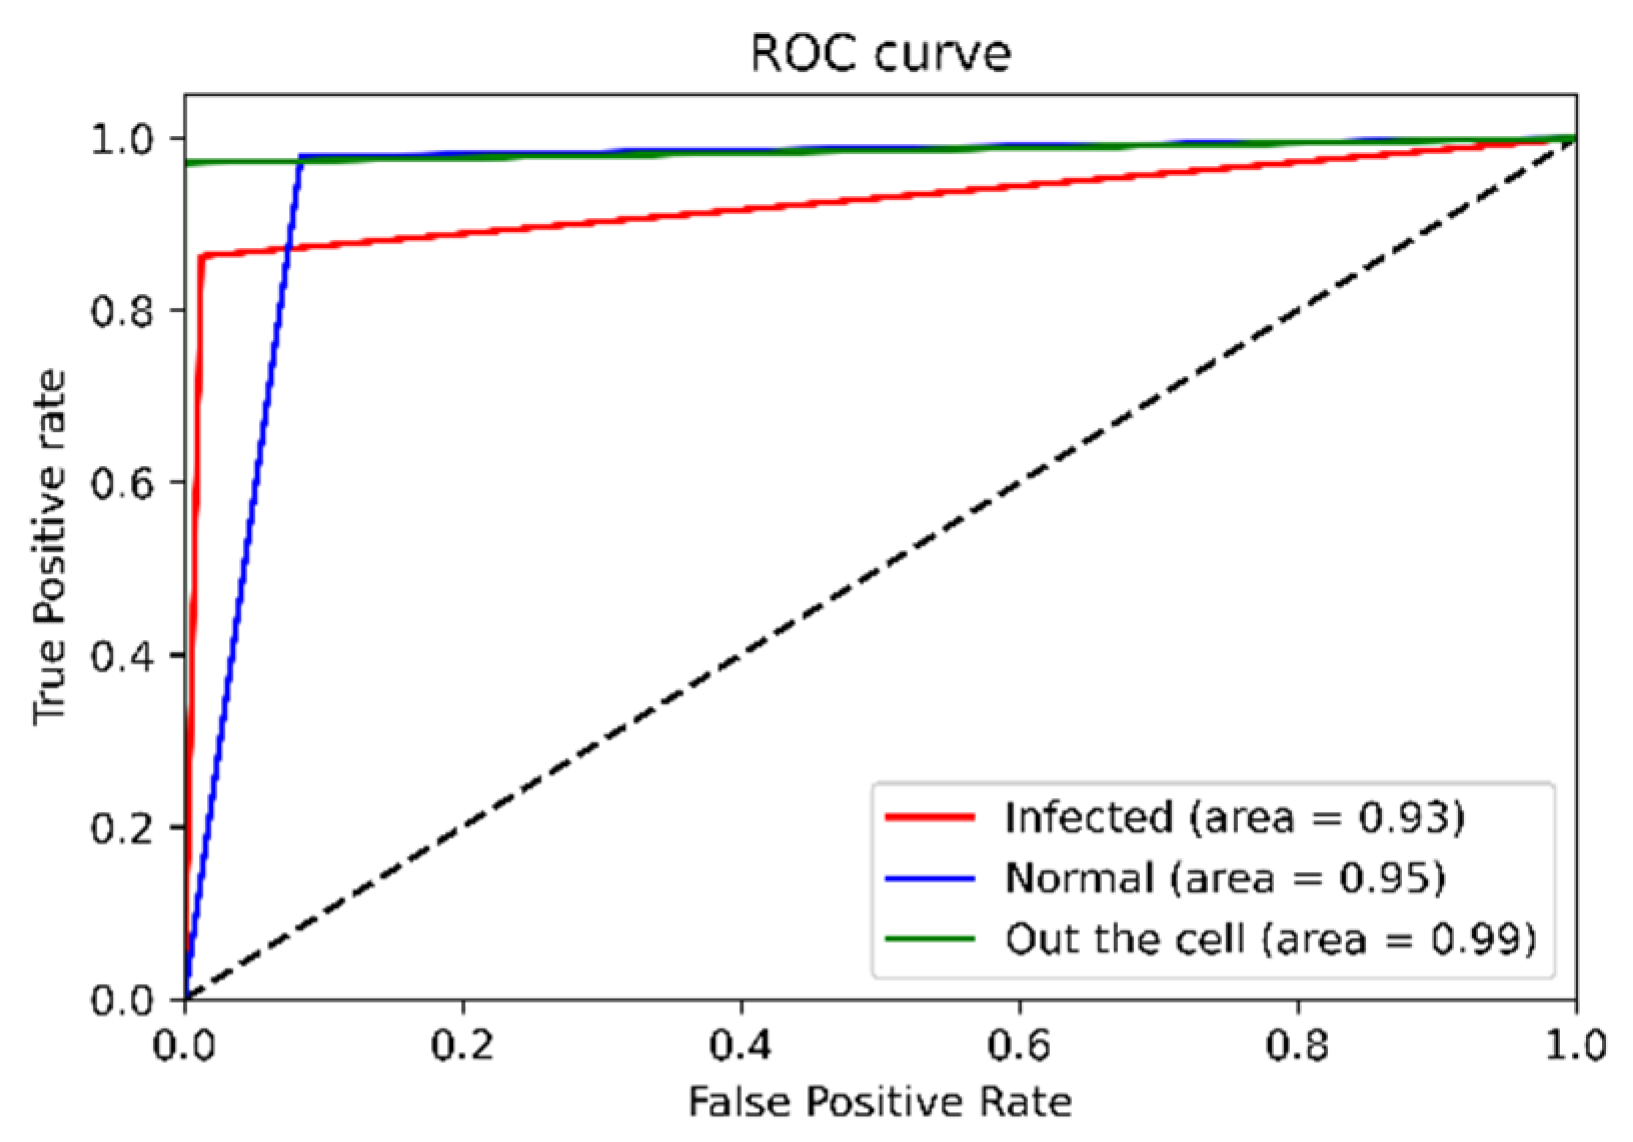
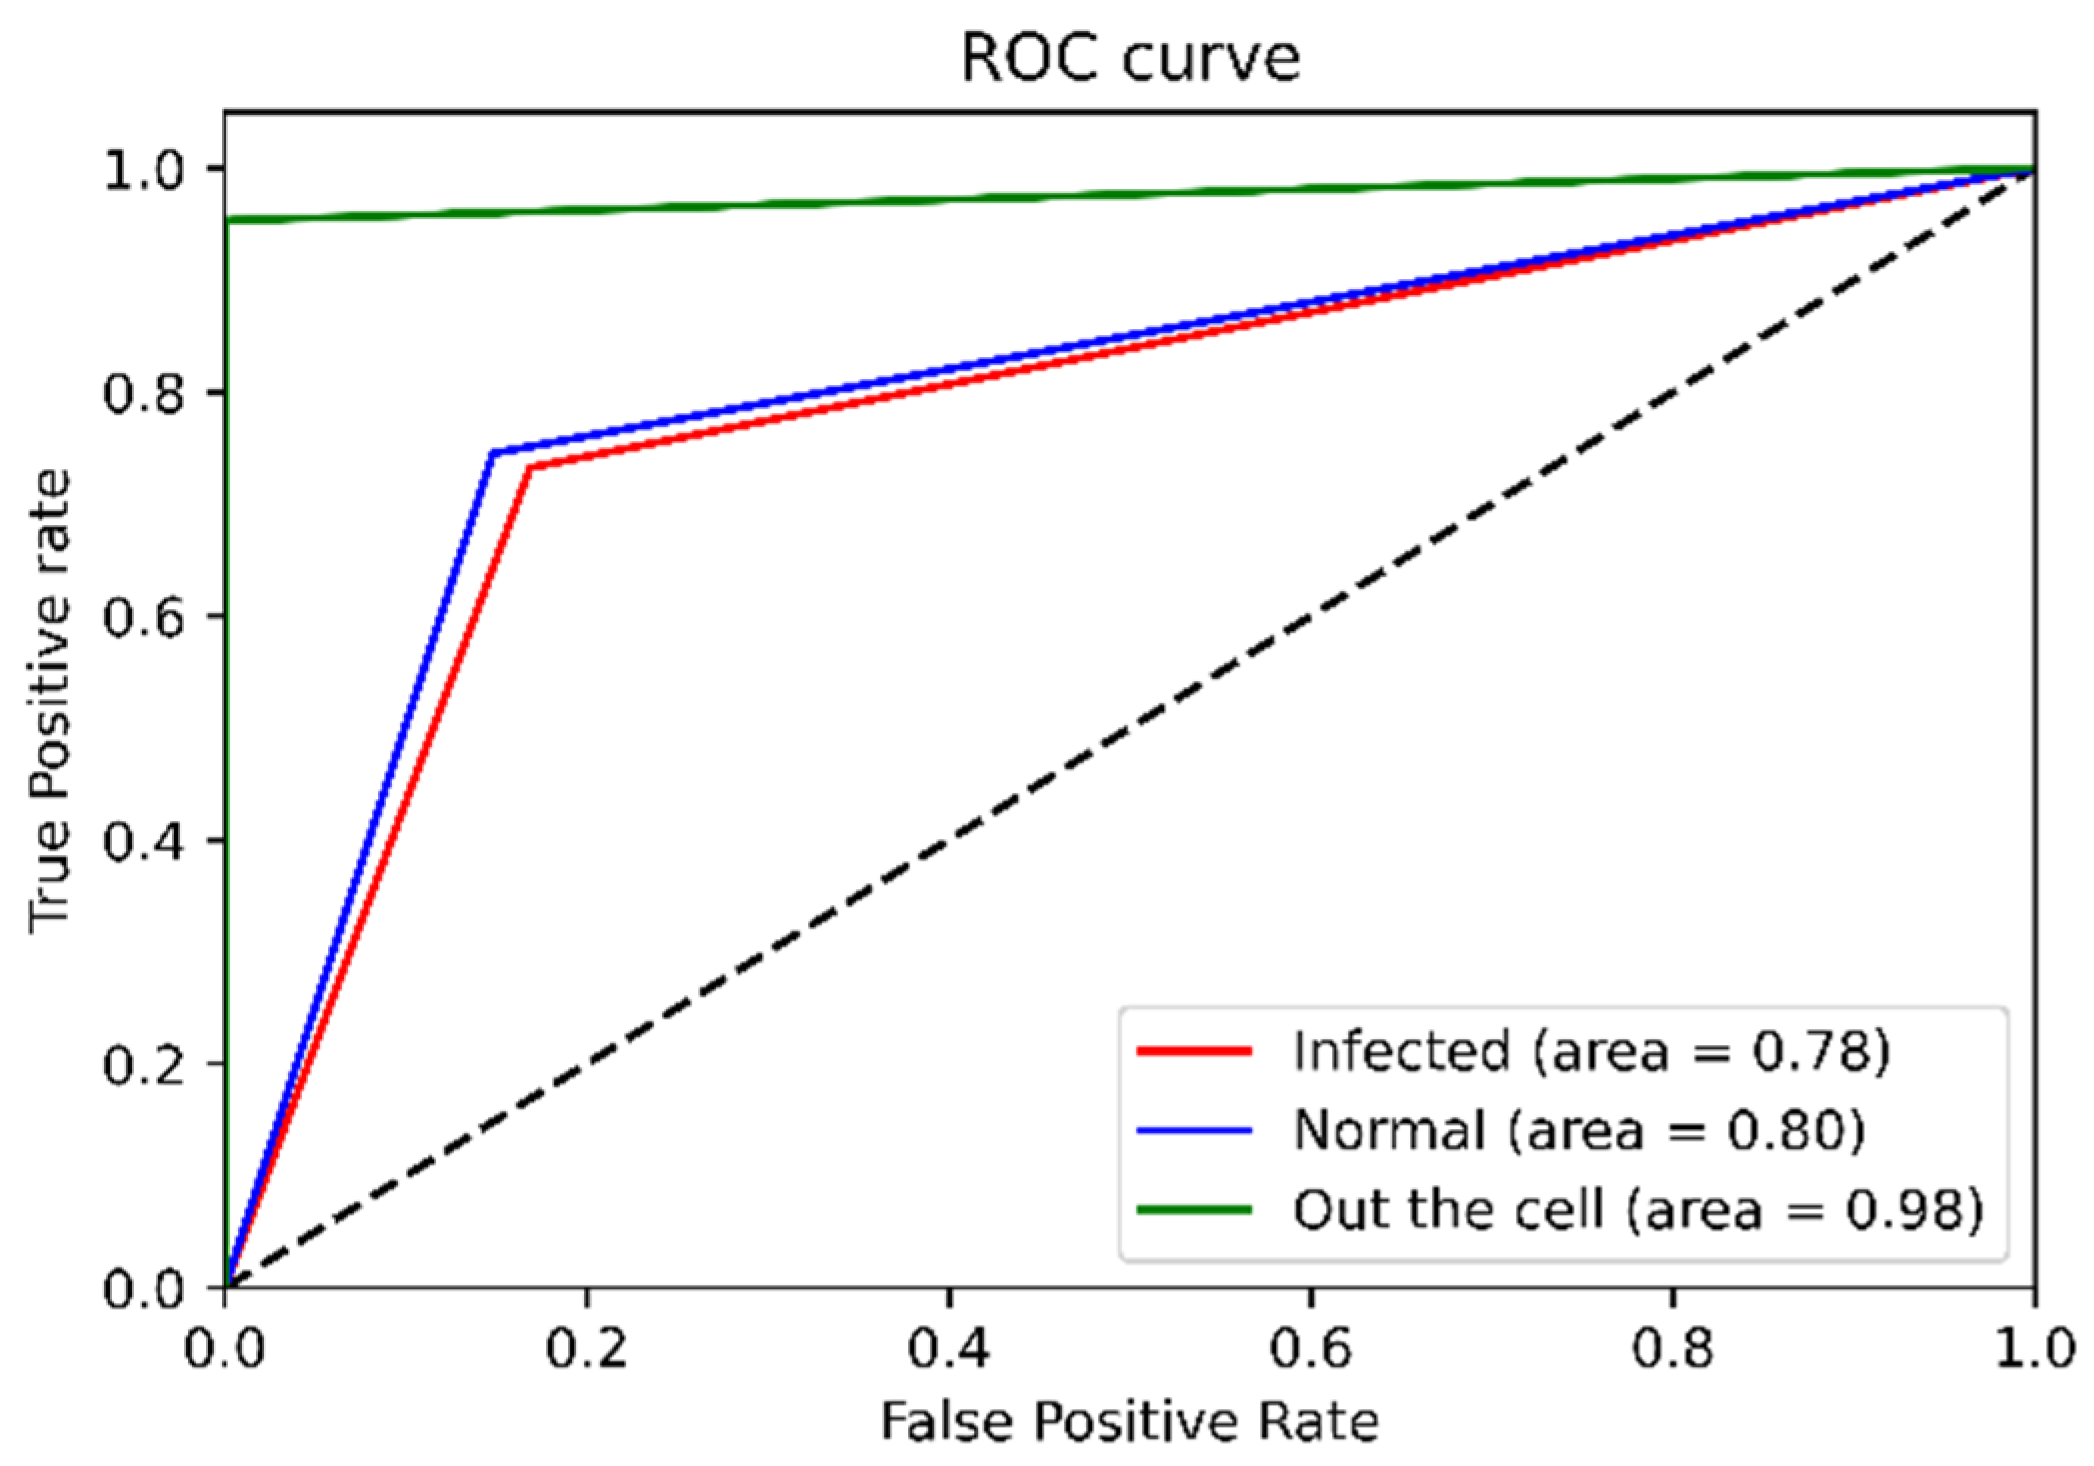
4.2. Discrimination Analysis
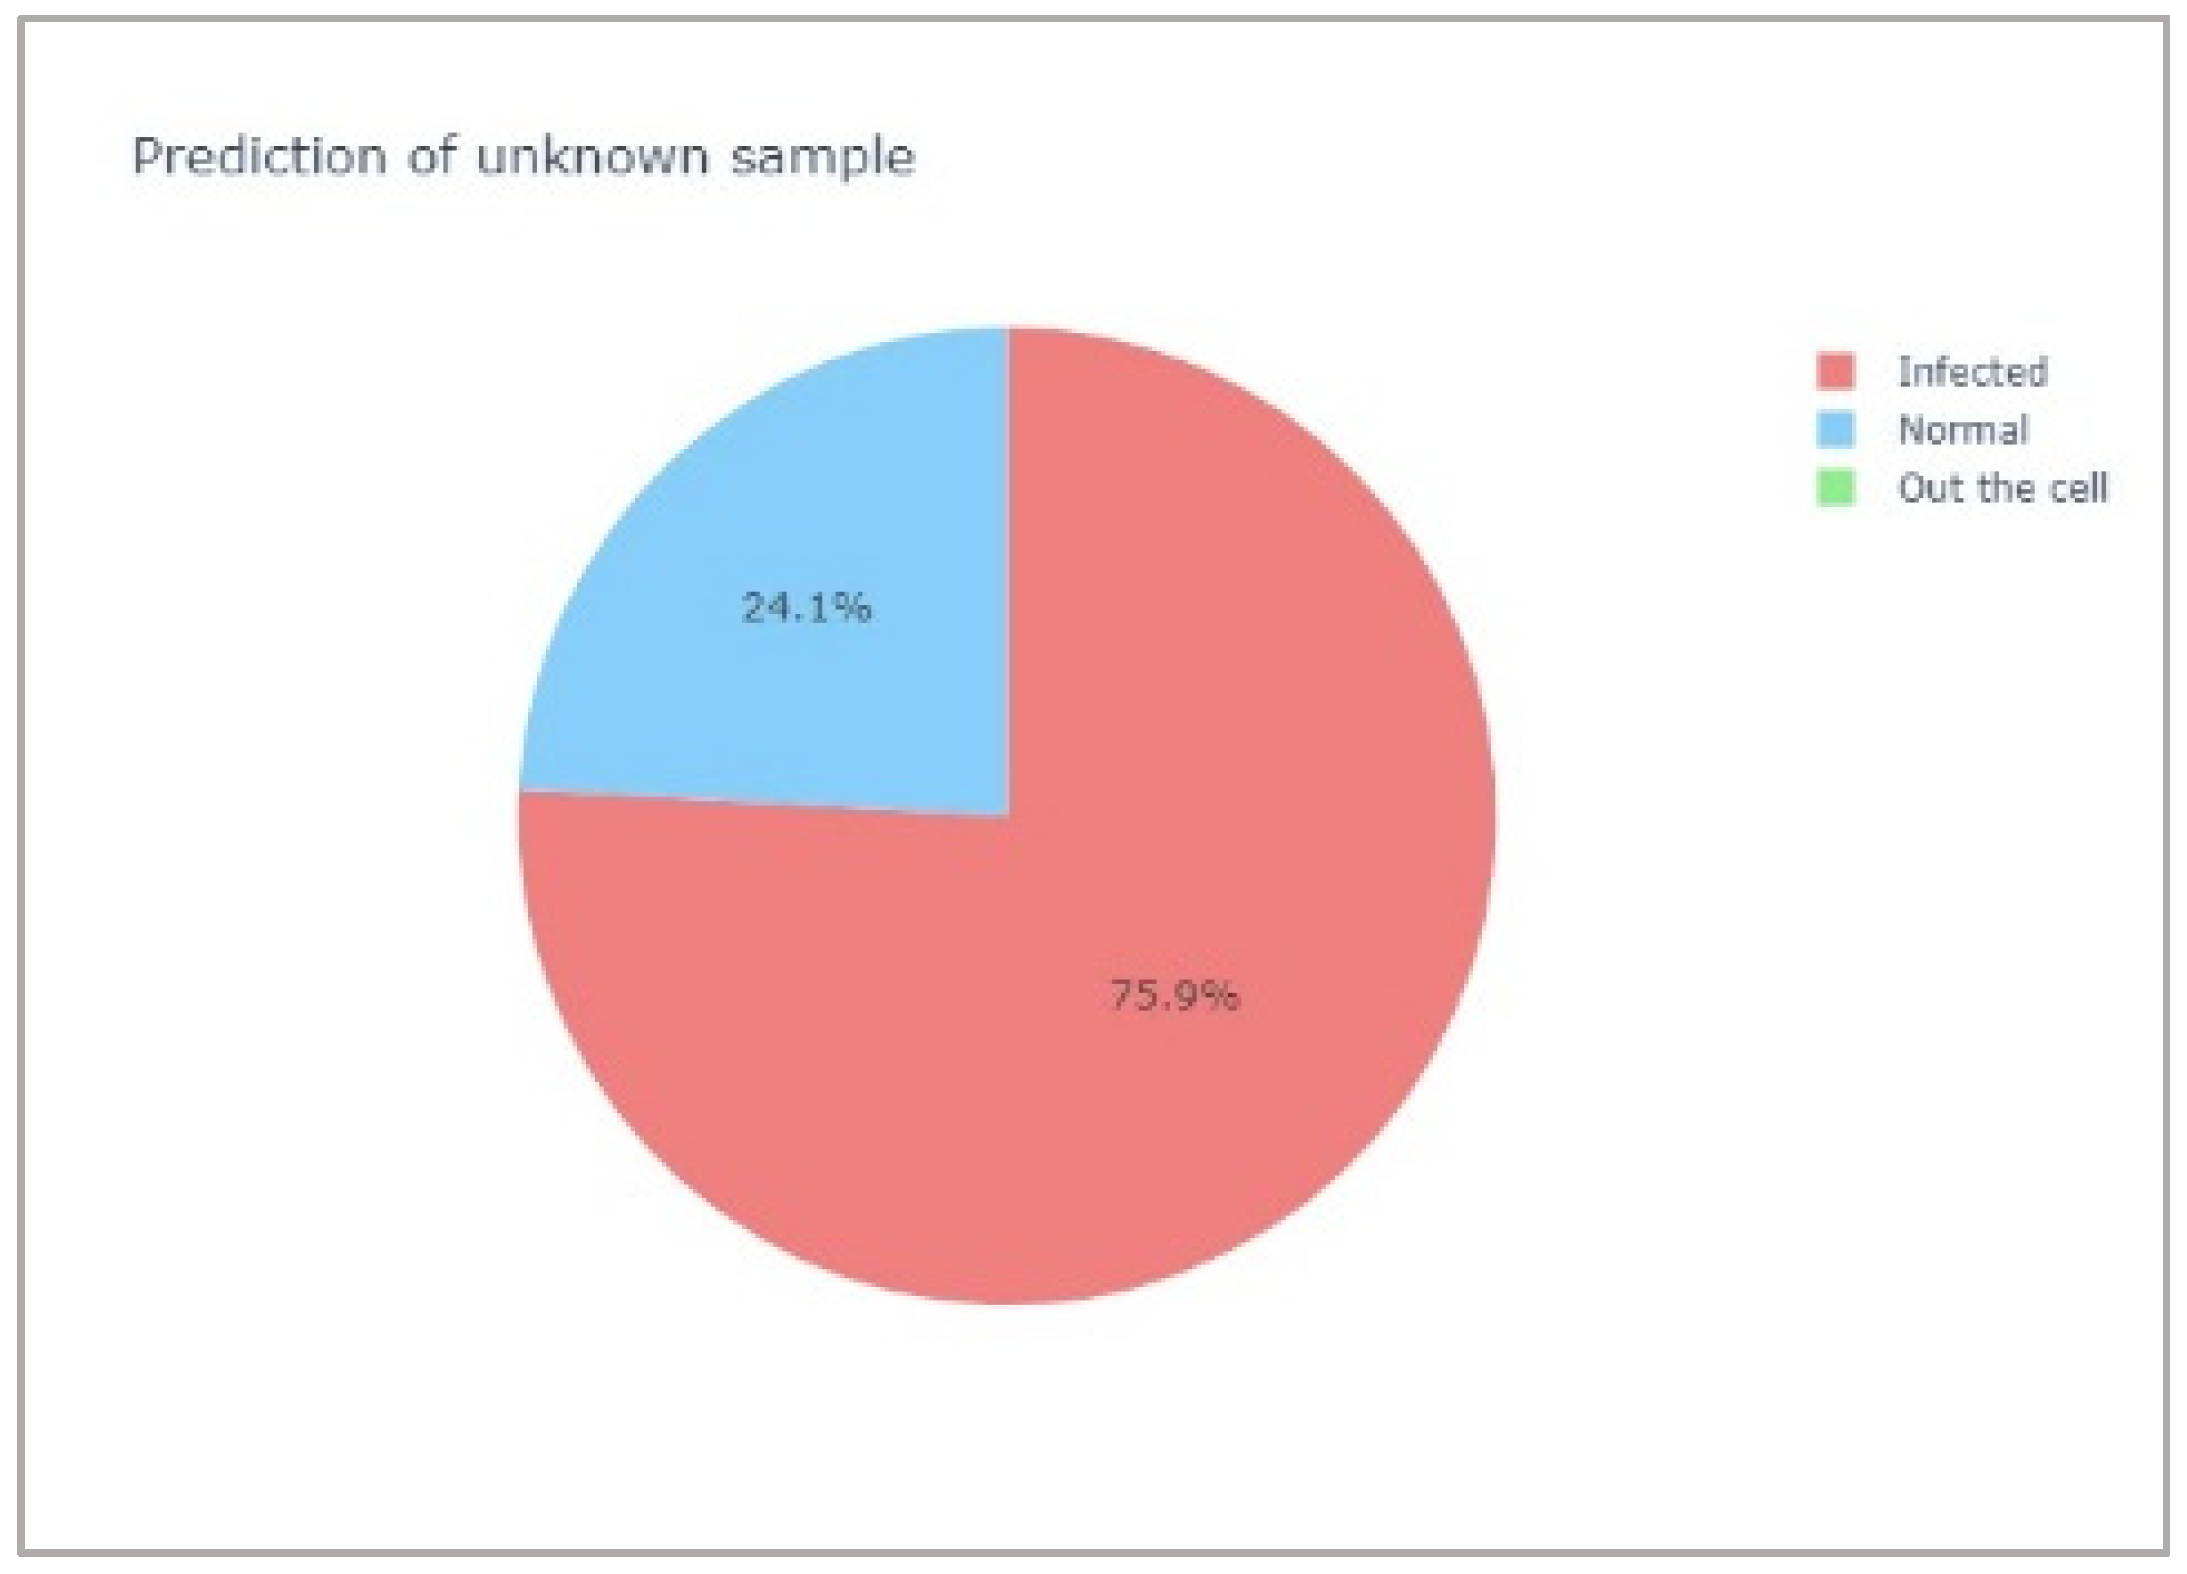
4.3. Blind Test
5. Conclusions
Supplementary Materials
Author Contributions
Funding
Institutional Review Board Statement
Informed Consent Statement
Data Availability Statement
Acknowledgments
Conflicts of Interest
References
- NHS. Malaria-Causes-NHS. Available online: https://www.nhs.uk/conditions/malaria/causes/ (accessed on 11 November 2019).
- WHO. World Malaria Report. 2021. Available online: https://www.mmv.org/newsroom/publications/world-malaria-report-2021?gclid=EAIaIQobChMI4-fHgPGf-AIVy24qCh0_7gAREAAYASAAEgJqNfD_BwE (accessed on 3 February 2022).
- Wongsrichanalai, C.; Barcus, M.J.; Muth, S.; Sutamihardja, A.; Wernsdorfer, W.H. A review of malaria diagnostic tools: Microscopy and rapid diagnostic test (RDT). Am. J. Trop. Med. Hyg. 2007, 77 (Suppl. S6), 119–127. [Google Scholar] [CrossRef] [PubMed] [Green Version]
- Bisoffi, Z.; Gobbi, F.; Ende, J.V.D. Rapid diagnostic tests for malaria. BMJ 2014, 348, g3846. [Google Scholar] [CrossRef] [PubMed]
- Hermsen, C.C.; Telgt, D.S.; Linders, E.H.; van de Locht, L.A.; Eling, W.M.; Mensink, E.J.; Sauerwein, R.W. Detection of Plasmodium falciparum malaria parasites in vivo by real-time quantitative PCR. Mol. Biochem. Parasitol. 2001, 118, 247–251. [Google Scholar] [CrossRef]
- Snounou, G.; Viriyakosol, S.; Zhu, X.P.; Jarra, W.; Pinheiro, L.; Rosario, V.E.D.; Thaithong, S.; Brown, K. High sensitivity of detection of human malaria parasites by the use of nested polymerase chain reaction. Mol. Biochem. Parasitol. 1993, 61, 315–320. [Google Scholar] [CrossRef]
- Baptista, V.; Costa, M.S.; Calçada, C.; Silva, M.; Gil, J.P.; Veiga, M.I.; Catarino, S.O. The Future in Sensing Technologies for Malaria Surveillance: A Review of Hemozoin-Based Diagnosis. ACS Sens. 2021, 6, 3898–3911. [Google Scholar] [CrossRef]
- Wood, B.R.; Langford, S.J.; Cooke, B.M.; Glenister, F.K.; Lim, J.; McNaughton, D. Raman imaging of hemozoin within the food vacuole of Plasmodium falciparum trophozoites. FEBS Lett. 2003, 554, 247–252. [Google Scholar] [CrossRef] [Green Version]
- Wood, B.R.; McNaughton, D. Resonance Raman Spectroscopy of erythrocytes. Appl. Life Pharm. Neutral Sci. Med. Diagn. 2008. [Google Scholar] [CrossRef]
- Chen, K.; Yuen, C.; Aniweh, Y.; Preiser, P.; Liu, Q. Towards ultrasensitive malaria diagnosis using surface enhanced Raman spectroscopy. Sci. Rep. 2016, 6, 20177. [Google Scholar] [CrossRef]
- Wood, B.R.; McNaughton, D. Resonance Raman spectroscopy in malaria research. Expert Rev. Proteom. 2006, 3, 525–544. [Google Scholar] [CrossRef]
- Frosch, T.; Koncarevic, S.; Becker, K.; Popp, J. Morphology-sensitive Raman modes of the malaria pigment hemozoin. Analyst 2009, 134, 1126–1132. [Google Scholar] [CrossRef]
- Yuen, C. Magnetic field enriched surface enhanced resonance Raman spectroscopy for early malaria diagnosis. J. Biomed. Opt. 2012, 17, 017005. [Google Scholar] [CrossRef] [PubMed]
- Wood, B.R.; Bailo, E.; Khiavi, M.A.; Tilley, L.; Deed, S.; Deckert-Gaudig, T.; McNaughton, D.; Deckert, V. Tip-Enhanced Raman Scattering (TERS) from Hemozoin Crystals within a Sectioned Erythrocyte. Nano Lett. 2011, 11, 1868–1873. [Google Scholar] [CrossRef] [PubMed]
- Grüring, C.; Heiber, A.; Kruse, F.; Ungefehr, J.; Gilberger, T.-W.; Spielmann, T. Development and host cell modifications of Plasmodium falciparum blood stages in four dimensions. Nat. Commun. 2011, 2, 165. [Google Scholar] [CrossRef] [PubMed] [Green Version]
- Pilot, R.; Signorini, R.; Durante, C.; Orian, L.; Bhamidipati, M.; Fabris, L. A Review on Surface-Enhanced Raman Scattering. Biosensors 2019, 9, 57. [Google Scholar] [CrossRef] [Green Version]
- Ding, S.-Y.; Yi, J.; Li, J.-F.; Ren, B.; Wu, D.-Y.; Panneerselvam, R.; Tian, Z.-Q. Nanostructure-based plasmon-enhanced Raman spectroscopy for surface analysis of materials. Nat. Rev. Mater. 2016, 1, 16021. [Google Scholar] [CrossRef]
- Garrett, N.L.; Sekine, R.; Dixon, M.W.A.; Tilley, L.; Bambery, K.R.; Wood, B.R. Bio-sensing with butterfly wings: Naturally occurring nano-structures for SERS-based malaria parasite detection. Phys. Chem. Chem. Phys. 2014, 17, 21164–21168. [Google Scholar] [CrossRef] [Green Version]
- Chen, F.; Flaherty, B.R.; Cohen, C.E.; Peterson, D.S.; Zhao, Y. Direct detection of malaria infected red blood cells by surface enhanced Raman spectroscopy. Nanomed. Nanotechnol. Biol. Med. 2016, 12, 1445–1451. [Google Scholar] [CrossRef] [Green Version]
- Wang, W.; Dong, R.-L.; Gu, D.; He, J.-A.; Yi, P.; Kong, S.-K.; Ho, H.-P.; Loo, J.F.-C.; Wang, W.; Wang, Q. Antibody-free rapid diagnosis of malaria in whole blood with surface-enhanced Raman Spectroscopy using Nanostructured Gold Substrate. Adv. Med Sci. 2020, 65, 86–92. [Google Scholar] [CrossRef]
- Goh, B.; Ching, K.; Magalhães, R.J.S.; Ciocchetta, S.; Edstein, M.D.; Maciel-De-Freitas, R.; Sikulu-Lord, M.T. The application of spectroscopy techniques for diagnosis of malaria parasites and arboviruses and surveillance of mosquito vectors: A systematic review and critical appraisal of evidence. PLoS Neglected Trop. Dis. 2021, 15, e0009218. [Google Scholar] [CrossRef]
- Ramoji, A.; Ryabchykov, O.; Galler, K.; Tannert, A.; Markwart, R.; Requardt, R.P.; Rubio, I.; Bauer, M.; Bocklitz, T.; Popp, J.; et al. Raman Spectroscopy Follows Time-Dependent Changes in T Lymphocytes Isolated from Spleen of Endotoxemic Mice. ImmunoHorizons 2019, 3, 45–60. [Google Scholar] [CrossRef] [Green Version]
- Kolašinac, S.; Pećinar, I.; Danojević, D.; Stevanović, Z.D. Raman spectroscopy coupled with chemometric modeling approaches for authentication of different paprika varieties at physiological maturity. LWT 2022, 162, 113402. [Google Scholar] [CrossRef]
- Liu, W.; Sun, Z.; Chen, J.; Jing, C. Raman Spectroscopy in Colorectal Cancer Diagnostics: Comparison of PCA-LDA and PLS-DA Models. J. Spectrosc. 2016, 2016, 1–6. [Google Scholar] [CrossRef]
- Song, D.; Yu, F.; Chen, S.; Chen, Y.; He, Q.; Zhang, Z.; Zhang, J.; Wang, S. Raman spectroscopy combined with multivariate analysis to study the biochemical mechanism of lung cancer microwave ablation. Biomed. Opt. Express 2020, 11, 1061. [Google Scholar] [CrossRef] [PubMed]
- Zong, M.; Zhou, L.; Guan, Q.; Lin, D.; Zhao, J.; Qi, H.; Harriman, D.; Fan, L.; Zeng, H.; Du, C. Comparison of Surface-Enhanced Raman Scattering Properties of Serum and Urine for the Detection of Chronic Kidney Disease in Patients. Appl. Spectrosc. 2021, 75, 412–421. [Google Scholar] [CrossRef] [PubMed]
- Zepeda-Zepeda, M.A.; Picquart, M.; Irigoyen-Camacho, M.E.; Mejía-Gózalez, A.M. Diagnosis of Dental Fluorosis Using Micro-Raman Spectroscopy Applying a Principal Component-Linear Discriminant Analysis. Int. J. Environ. Res. Public Heal. 2021, 18, 10572. [Google Scholar] [CrossRef]
- Frame, L.; Brewer, J.; Lee, R.; Faulds, K.; Graham, D. Development of a label-free Raman imaging technique for differentiation of malaria parasite infected from non-infected tissue. Analyst 2018, 143, 157–163. [Google Scholar] [CrossRef] [Green Version]
- Patel, S.K.; Rajora, N.; Kumar, S.; Sahu, A.; Kochar, S.K.; Krishna, C.M.; Srivastava, S. Rapid Discrimination of Malaria- and Dengue-Infected Patients Sera Using Raman Spectroscopy. Anal. Chem. 2019, 91, 7054–7062. [Google Scholar] [CrossRef]
- Nuntawong, N.; Eiamchai, P.; Limwichean, S.; Wong-Ek, B.; Horprathum, M.; Patthanasettakul, V.; Leelapojanaporn, A.; Nakngoenthong, S.; Chindaudom, P. Trace detection of perchlorate in industrial-grade emulsion explosive with portable surface-enhanced Raman spectroscopy. Forensic Sci. Int. 2013, 233, 174–178. [Google Scholar] [CrossRef]
- Nuntawong, N.; Eiamchai, P.; Somrang, W.; Denchitcharoen, S.; Limwichean, S.; Horprathum, M.; Patthanasettakul, V.; Chaiya, S.; Leelapojanaporn, A.; Saiseng, S.; et al. Detection of methamphetamine/amphetamine in human urine based on surface - enhanced Raman spectroscopy and acidulation treatments. Sens. Actuators B Chem. 2017, 239, 139–146. [Google Scholar] [CrossRef]
- Trager, W.; Jensen, J.B. Human Malaria Parasites in Continuous Culture. Science 1976, 193, 673–675. [Google Scholar] [CrossRef]
- Wise, D. Savitzky-Golay Filters. 5 January 2019. Available online: https://dkwise.wordpress.com/2019/01/05/savitzky-golay-filters/ (accessed on 31 January 2022).
- James, T.M.; Schlösser, M.; Lewis, R.J.; Fischer, S.; Bornschein, B.; Telle, H.H. Automated quantitative spectroscopic analysis combining background subtraction, cosmic ray removal, and peak fitting. Appl. Spectrosc. 2013, 67, 949–959. [Google Scholar] [CrossRef] [PubMed]
- Afseth, N.K.; Segtnan, V.H.; Wold, J.P. Raman Spectra of Biological Samples: A Study of Preprocessing Methods. Appl. Spectrosc. 2006, 60, 1358–1367. [Google Scholar] [CrossRef] [PubMed]
- Gautam, R.; Vanga, S.; Ariese, F.; Umapathy, S. Review of multidimensional data processing approaches for Raman and infrared spectroscopy. EPJ Tech. Instrum. 2015, 2, 8. [Google Scholar] [CrossRef] [Green Version]
- Raschka, S. Linear Discriminant Analysis. 3 August 2014. Available online: https://sebastianraschka.com/Articles/2014_python_lda.html (accessed on 31 January 2021).
- Perez-Guaita, D.; Marzec, K.M.; Hudson, A.; Evans, C.; Chernenko, T.; Matthäus, C.; Miljkovic, M.; Diem, M.; Heraud, P.; Richards, J.S.; et al. Parasites under the Spotlight: Applications of Vibrational Spectroscopy to Malaria Research. Chem. Rev. 2018, 118, 5330–5358. [Google Scholar] [CrossRef] [PubMed]
- Carter, W. Raman Spectroscopy Study of Single Red Blood Cells Infected by the Malaria Parasite Plasmodium Falciparum and the Novel Use of Micro-Capillaries. Master’s Thesis, University of Central Florida, Orlando, FL, USA, 2007. [Google Scholar]
- Sigala, P.A.; Crowley, J.R.; Hsieh, S.; Henderson, J.P.; Goldberg, D.E. Direct Tests of Enzymatic Heme Degradation by the Malaria Parasite Plasmodium falciparum. J. Biol. Chem. 2012, 287, 37793–37807. [Google Scholar] [CrossRef] [PubMed] [Green Version]
- Wood, B.R.; McNaughton, D. Raman excitation wavelength investigation of single red blood cellsin vivo. J. Raman Spectrosc. 2002, 33, 517–523. [Google Scholar] [CrossRef]
- Atkins, C.; Buckley, K.; Blades, M.W.; Turner, R.F. Raman Spectroscopy of Blood and Blood Components. Appl. Spectrosc. 2017, 71, 767–793. [Google Scholar] [CrossRef]
- Barkur, S.; Chidangil, S. Surface-enhanced Raman spectroscopy study of red blood cells and platelets. J. Biomol. Struct. Dyn. 2019, 37, 1090–1098. [Google Scholar] [CrossRef]
- Barkur, S. Raman and Surface Enhanced Raman Spectroscopy Study of Blood Components. Manipal. 2018. Available online: https://shodhganga.inflibnet.ac.in/handle/10603/209011 (accessed on 12 December 2019).
- Goheen, S.C.; Lis, L.J.; Kucuk, O.; Westerman, M.P.; Kauffman, J.W. Compositional dependence of spectral features in the Raman spectra of erythrocyte membranes. J. Raman Spectrosc. 1993, 24, 275–279. [Google Scholar] [CrossRef]
- Drescher, D.; Büchner, T.; McNaughton, D.; Kneipp, J. SERS reveals the specific interaction of silver and gold nanoparticles with hemoglobin and red blood cell components. Phys. Chem. Chem. Phys. 2013, 15, 5364–5373. [Google Scholar] [CrossRef]
- Brazhe, N.A.; Abdali, S.; Brazhe, A.R.; Luneva, O.G.; Bryzgalova, N.Y.; Parshina, E.Y.; Sosnovtseva, O.V.; Maksimov, G.V. New Insight into Erythrocyte through In Vivo Surface-Enhanced Raman Spectroscopy. Biophys. J. 2009, 97, 3206–3214. [Google Scholar] [CrossRef] [PubMed] [Green Version]
- Wood, B.R.; Langford, S.J.; Cooke, B.M.; Lim, J.; Glenister, F.K.; Duriska, M.; Unthank, J.K.; McNaughton, D. Resonance Raman Spectroscopy Reveals New Insight into the Electronic Structure of β-Hematin and Malaria Pigment. J. Am. Chem. Soc. 2004, 126, 9233–9239. [Google Scholar] [CrossRef] [PubMed]
- Nikelshparg, E.I.; Baizhumanov, A.A.; Bochkova, Z.V.; Novikov, S.M.; Yakubovsky, D.I.; Arsenin, A.V.; Volkov, V.S.; Goodilin, E.A.; Semenova, A.A.; Sosnovtseva, O.; et al. Detection of Hypertension-Induced Changes in Erythrocytes by SERS Nanosensors. Biosensors 2022, 12, 32. [Google Scholar] [CrossRef] [PubMed]
- Tharwat, A.; Gaber, T.; Ibrahim, A.; Hassanien, A.E. Linear discriminant analysis: A detailed tutorial. AI Commun. 2017, 30, 169–190. [Google Scholar] [CrossRef] [Green Version]
- Smith, L.I. A tutorial on Principal Components Analysis (Computer Science Technical Report No. OUCS-2002-12). 2002. Available online: http://www.cs.otago.ac.nz/cosc453/student_tutorials/principal_components.pdf (accessed on 3 February 2022).
- Jolliffe, I.T.; Cadima, J.; Cadima, J. Principal component analysis: A review and recent developments Subject Areas. Philos. Trans. R. Soc. A 2016, 374, 1–16. [Google Scholar] [CrossRef] [PubMed]


| Observed Wavenumber (cm−1) | Assignment |
|---|---|
| 676 | υ7, (pyr deform) sym of hemoglobin |
| 747 | υ15 Hb [υ(pyr breathing), Trp, O-P-O sym Str. (lipid) |
| 796 | |
| 826 | Porphyrin: , Tyr |
| 923 | Amino acids: C–COO− stretch |
| 950 | C-C Str |
| 973 | υ46, (pyr deform) asym |
| 997 | υ47, υ, Protein (Phe) |
| 1078, 1079 | , C-O Str. |
| 1127, 1128 | υ5 |
| 1171, 1172 | υ30 υ(Pyr half-ring)asym |
| 1225 | |
| 1228 | (Oxy) |
| 1244, 1242 | Amide III |
| 1247 | Amide III (collagen assignment) |
| 1307 | |
| 1340 | (Pyr half-ring)sym |
| 1366, 1372 | (Pyr half-ring)sym |
| 1396 | |
| 1432, 1434 | |
| 1440 | C-H2 and C-H3 bend (protein, lipid) |
| 1463 | , C-H2 and C-H3 bend |
| 1540 | |
| 1560, 1562 | ,Trp |
| 1586 | |
| 1620 | |
| 1639, 1640 |
| Precision | Sensitivity (Recall) | F1-Score | Specificity | Support | |
|---|---|---|---|---|---|
| Infected | 0.97 | 0.86 | 0.91 | 0.98 | 73 |
| Normal | 0.88 | 0.98 | 0.93 | 0.92 | 92 |
| Out the cell | 1.00 | 0.97 | 0.99 | 0.93 | 70 |
| Accuracy | 0.94 | 235 | |||
| Macro avg | 0.95 | 0.94 | 0.94 | 235 | |
| Weight avg | 0.94 | 0.94 | 0.94 | 235 | |
| Sample No. | Expected | Probability of Sample Class | Prediction | ||
|---|---|---|---|---|---|
| Normal (%) | Infected (%) | Out (%) | |||
| 1 | Infected | 24.1 | 75.9 | 0.0 | Infected |
| 2 | Normal | 60.6 | 39.4 | 0.0 | Normal |
| 3 | Infected | 31.8 | 68.2 | 0.0 | Infected |
| 4 | Infected | 25.0 | 75.0 | 0.0 | Infected |
| 5 | Normal | 82.9 | 17.1 | 0.0 | Normal |
| 6 | Normal | 78.6 | 21.4 | 0.0 | Normal |
| 7 | Out | 0.0 | 6.2 | 93.8 | Out |
| 8 | Out | 3.1 | 0.0 | 96.9 | Out |
| Precision | Sensitivity (Recall) | F1-Score | Specificity | Support | |
|---|---|---|---|---|---|
| Infected | 0.65 | 0.73 | 0.69 | 0.83 | 71 |
| Normal | 0.79 | 0.75 | 0.77 | 0.84 | 102 |
| Out the cell | 1.00 | 0.95 | 0.98 | 0.74 | 64 |
| Accuracy | 0.80 | 237 | |||
| Macro avg | 0.81 | 0.81 | 0.81 | 237 | |
| Weight avg | 0.81 | 0.80 | 0.80 | 237 | |
Publisher’s Note: MDPI stays neutral with regard to jurisdictional claims in published maps and institutional affiliations. |
© 2022 by the authors. Licensee MDPI, Basel, Switzerland. This article is an open access article distributed under the terms and conditions of the Creative Commons Attribution (CC BY) license (https://creativecommons.org/licenses/by/4.0/).
Share and Cite
Kongklad, G.; Chitaree, R.; Taechalertpaisarn, T.; Panvisavas, N.; Nuntawong, N. Discriminant Analysis PCA-LDA Assisted Surface-Enhanced Raman Spectroscopy for Direct Identification of Malaria-Infected Red Blood Cells. Methods Protoc. 2022, 5, 49. https://doi.org/10.3390/mps5030049
Kongklad G, Chitaree R, Taechalertpaisarn T, Panvisavas N, Nuntawong N. Discriminant Analysis PCA-LDA Assisted Surface-Enhanced Raman Spectroscopy for Direct Identification of Malaria-Infected Red Blood Cells. Methods and Protocols. 2022; 5(3):49. https://doi.org/10.3390/mps5030049
Chicago/Turabian StyleKongklad, Gunganist, Ratchapak Chitaree, Tana Taechalertpaisarn, Nathinee Panvisavas, and Noppadon Nuntawong. 2022. "Discriminant Analysis PCA-LDA Assisted Surface-Enhanced Raman Spectroscopy for Direct Identification of Malaria-Infected Red Blood Cells" Methods and Protocols 5, no. 3: 49. https://doi.org/10.3390/mps5030049