Quantifying Fluorescently Labeled Ceramide Levels in Human Sarcoma Cell Lines in Response to a Sphingomyelin Synthase Inhibitor


Abstract
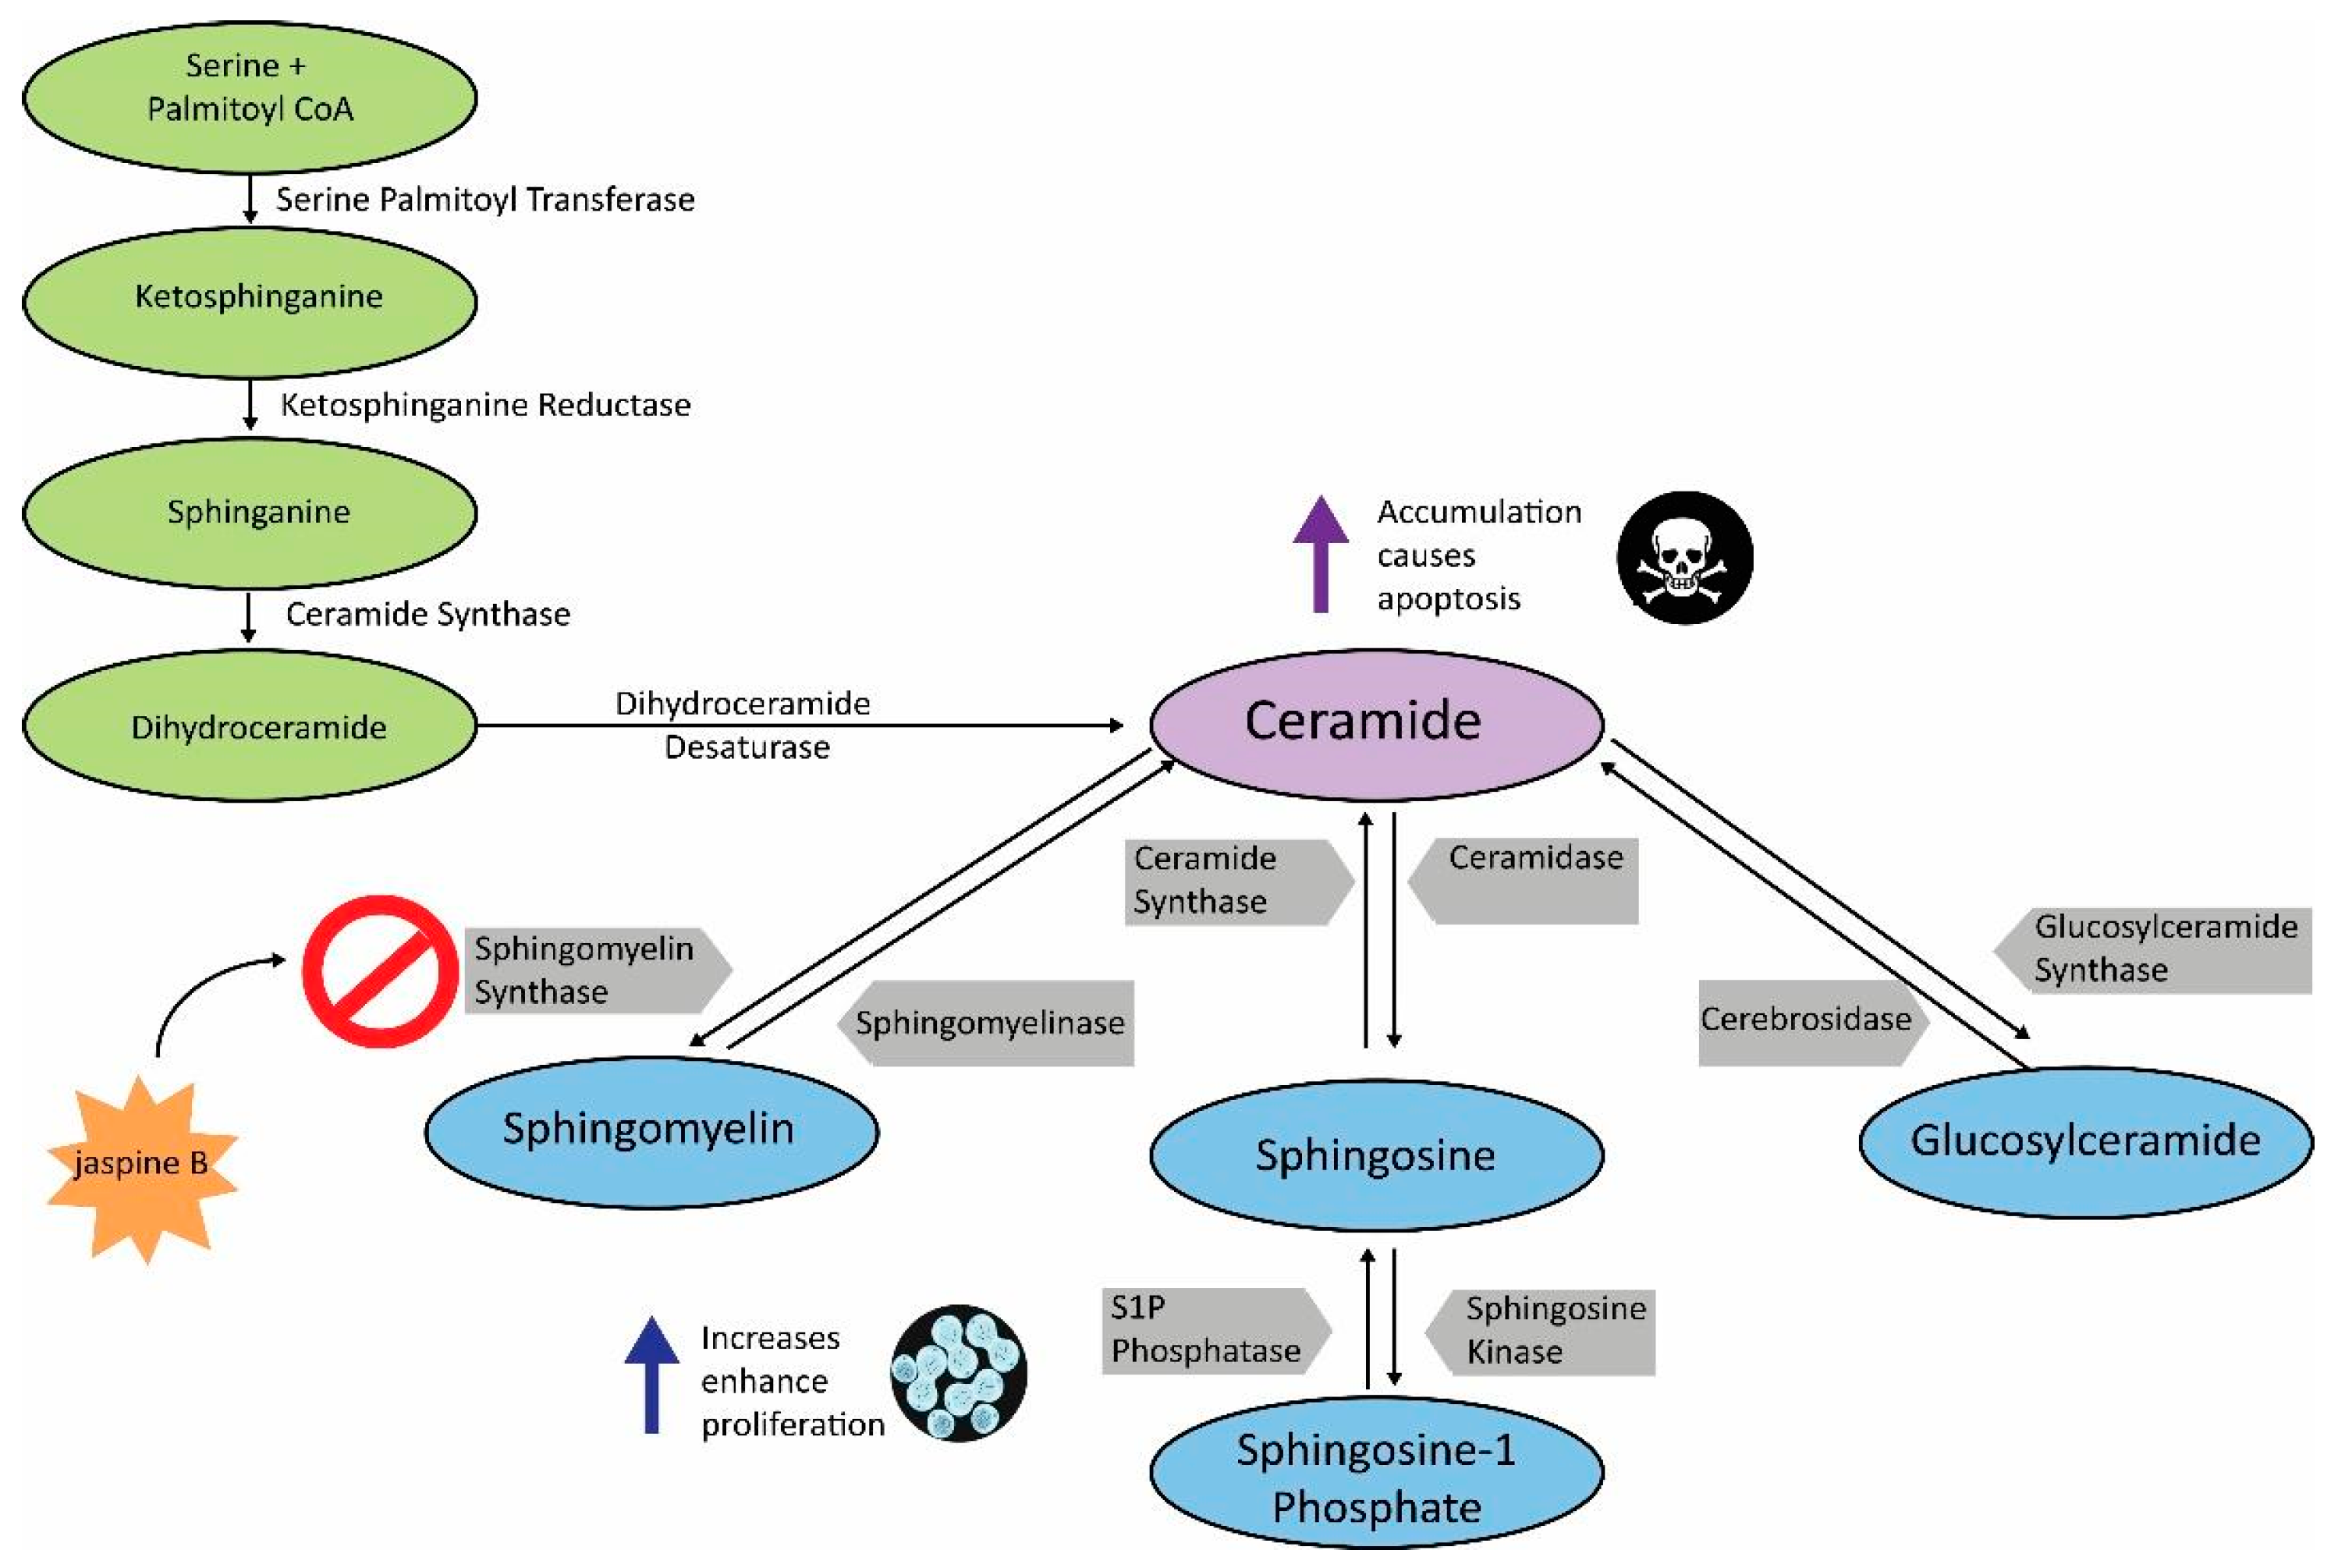
1. Introduction
2. Experimental Design
2.1. Materials
- C-6 NBD Ceramide (Toronto Research Chemicals, North York, ON, Canada; Cat. no.: N381205)
- Jaspine B (Pashikanti lab, Pocatello, ID, USA)
- SJSA-1 (ATCC, Manassas, VA, USA; Cat. no.: CRL-2098)
- U2-OS (ATCC, Manassas, VA, USA; Cat. no.: HTB-96)
- RPMI 1640 Medium (Caisson Labs, Smithfield, UT, USA; Cat. no.: RPL04-6)
- Fetal Bovine Serum (Atlanta Biologicals, Flowery Branch, GA, USA; Cat. no.: S11150)
- Penicillin/Streptomycin (Atlanta Biologicals, Flowery Branch, GA, USA; Cat. no.: B21110)
- Trypsin 0.25% EDTA (Atlanta Biologicals, Flowery Branch, GA, USA; Cat. no.: B81310)
- NaCl (Sigma Chemical Company, St. Louis, MO, USA; Cat. no.: S-9625)
- NP-40 (Fluka Analytical, Mexico City, Mexico; Cat. no.: 74385)
- Phosphate Buffered Saline (Genesee Scientific, El Cajon, CA, USA; Cat. no.: 25-508)
- Pyridine (Alfa Aesar, Haverhill, MA, USA; Cat. no.: A12005-AP)
- Silica gel plates TLC-G (Silicycle, Quebec, QC, Canada; Cat. no.: TLG-R10014BK-323)
- Toluene (ThermoFisher Scientific, Waltham, MA, USA; Cat. no.: S25611A)
- Tris HCl (ThermoFisher Scientific, Waltham, MA, USA; Cat. no.: EC 201-064-4)
2.2. Equipment
- Azure c600 Imaging Station (Azure Biosystems, Dublin, CA, USA; Cat. no.: c600)
- Countess II (ThermoFisher Scientific, Waltham, MA, USA; Cat. no.: AMQAX1000)
- Countess Slides (ThermoFisher Scientific, Waltham, MA, USA; Cat. no.: C10283)
- MiniSpin (Eppendorf, Hamburg, Germany; Cat. no.: 22620100)
- Spectrafuge 6C (Labnet, Edison, NJ, USA; Cat. no.: LI-CF-SF6C)
- EVOS FL (ThermoFisher Scientific, Waltham, MA, USA; Cat. no.: AMF4300)
- FORMA SERIES II CO₂ Incubator (ThermoFisher Scientific, Waltham, MA, USA; Cat. no.: 31300)
3. Procedure
3.1. Preparing Single Cell Suspensions
- Wash adherent cancer cells growing in a tissue-culture-treated flask with a surface area of 75 cm2 with 7 mL of 1 X phosphate buffered saline (without Ca2+ and Mg2+). Remove phosphate buffer saline.
- Add 2 mL of pre-warmed 0.25% Trypsin-EDTA to each flask and return to the tissue culture incubator with the following conditions of 37 °C and 5% CO2 and incubate for 5 min or until most cells have detached from the bottom of the flask.
- Quench the trypsin by adding 2 X the volume (4 mL) of cell culture medium. Pipette the 6 mL solution up and down, pointing the tip towards the side of the flask on which the cells were growing.
- OPTIONAL STEP. DMEM or RPMI supplemented with 10% fetal bovine serum and penicillin/streptomycin are commonly used cell culture mediums for these cells, but this can be adaptable as long as a solution with proteins is used to quench the trypsin.
- Transfer the 6 mL of single cell suspensions to a 15 mL conical tube and centrifuge the solution at 1800× g and room temperature for 4 min.
- Decant the media solution and resuspend the cell pellet in 4–5 mL of fresh cell culture medium.
- Count cell concentrations. Set aside 1−1.5 million cells for each treatment condition in its own 1.7 mL microcentrifuge tube.
- Centrifuge cells again at 1800× g for four minutes and resuspend cells in 20 μL of phosphate-buffered saline.
3.2. Treating Cells with an SMS Inhibitor and Adding C6-NBD Ceramide
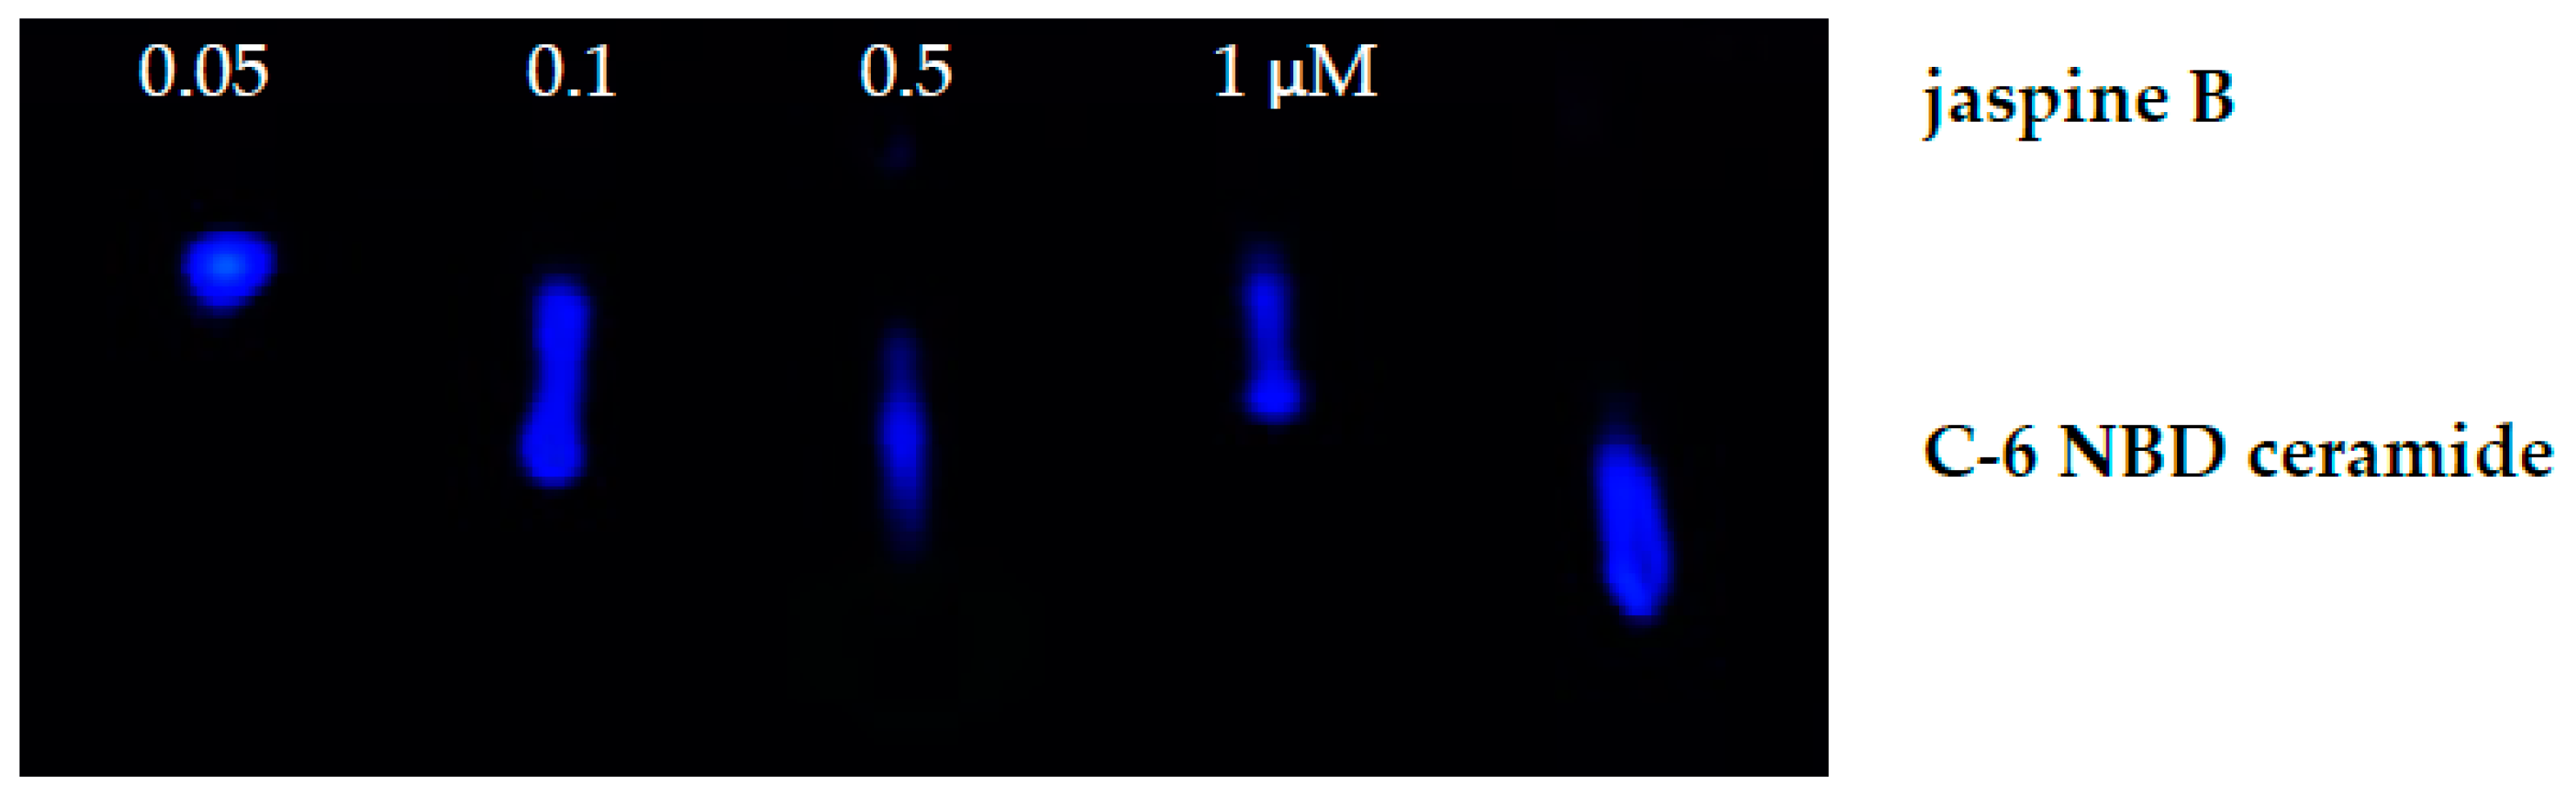
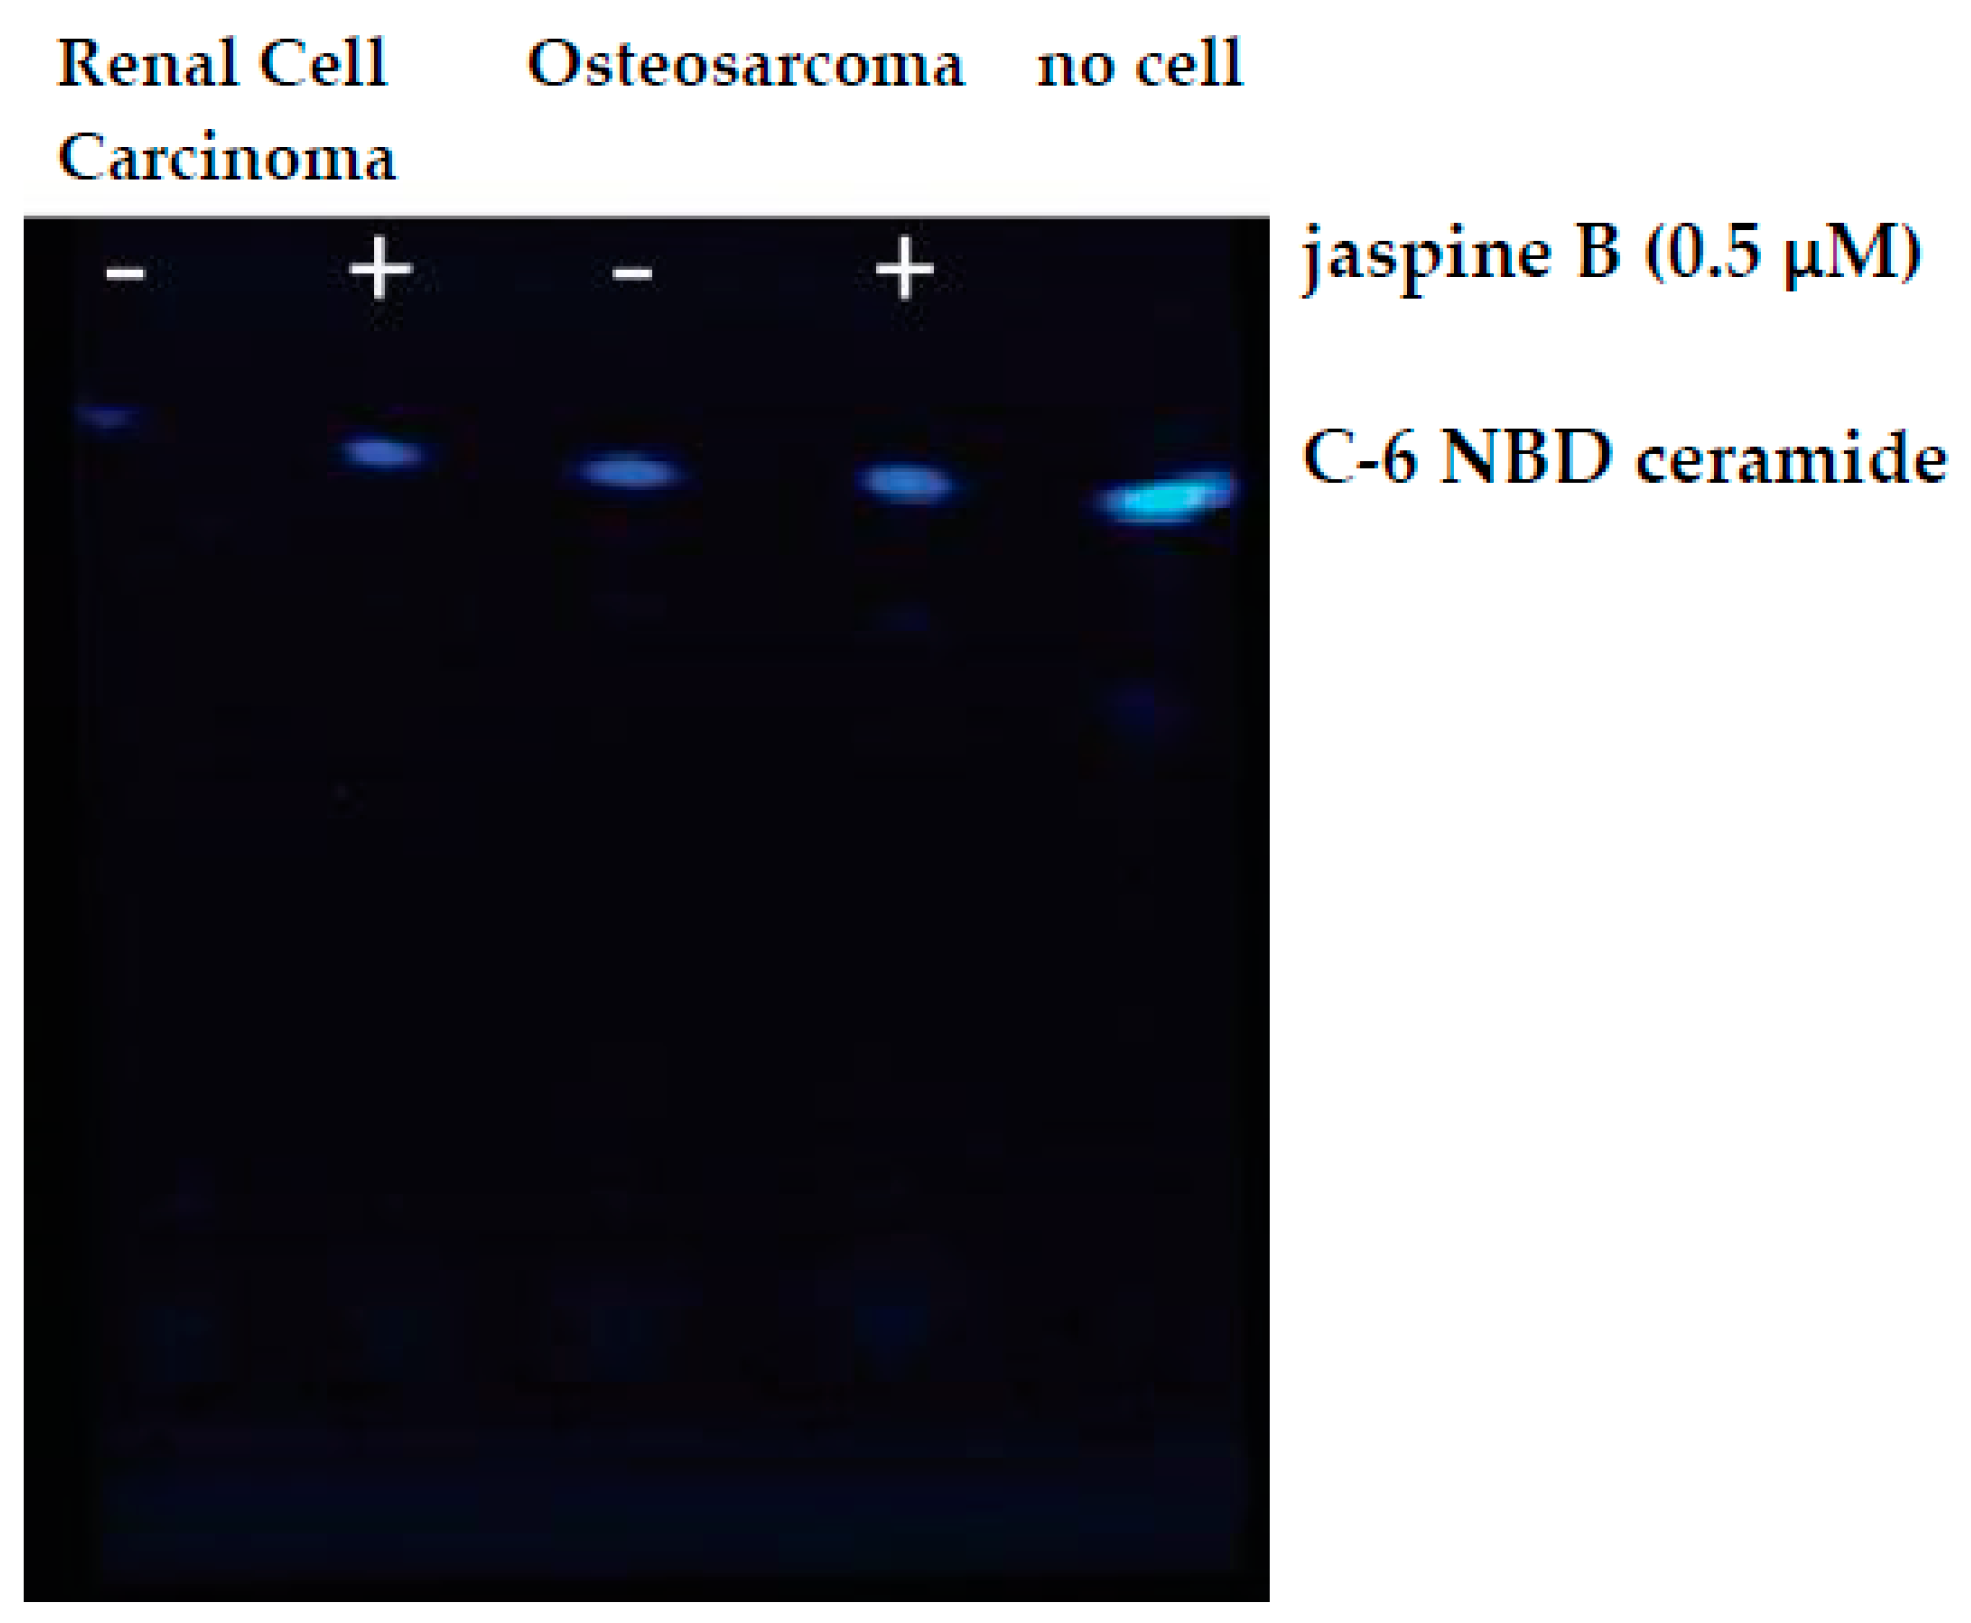
- For each cell line, test two conditions. Prepare a concentration of jaspine B, an SMS inhibitor, at 5 μM.
- OPTIONAL STEP. We prepare our stock solutions at a concentration of 10 mM in DMSO. Dilution to a working concentration of 5 μM is achieved with phosphate-buffered saline.
- To test the inhibition of SMS, add either 2 μL of 5 μM jaspine B or 2 μL of phosphate-buffered saline to the labeled microcentrifuge tubes containing 1−1.5 million cells in 20 μL of solution. This will dilute the jaspine B to a final concentration of 500 nM.
- Add 2 μL of 100 μM C6-NBD ceramide to all the cell solutions, both treated and control. Thus resulting in a final concentration of 10 μM.
- Incubate at 37 °C for 30 min.
- Centrifuge the cells and solution at 1800× g for four minutes and, using a micropipette, remove all liquid.⦷ PAUSE STEP. Cell pellets can be stored at −20 °C for later analysis.
- Add 50 μL of phosphate-buffered saline and pipet up and down to wash the cells.
- Centrifuge the cells and solution at 1800× g for four minutes and using a micropipette remove all liquid.
3.3. Lysing Cells and Sample Preparation for Running Thin-Layer Chromatography
- Incubate cells in 20 μL of mild cell lysis buffer for 10 min.NOTE: Mild cell lysis buffer consisted of 10 mM Tris-HCl pH 8.1, 10 mM NaCl, 0.5% NP-40.
- Clarify cell lysates by centrifuging at >10,000× g for 10 min.
- Collect the supernatant fraction and add 20 μL of 100% methanol.
3.4. Running the Thin-Layer Chromatography
- Load 40 μL of each sample by applying the liquid to a single location near the bottom of a silica gel plate.
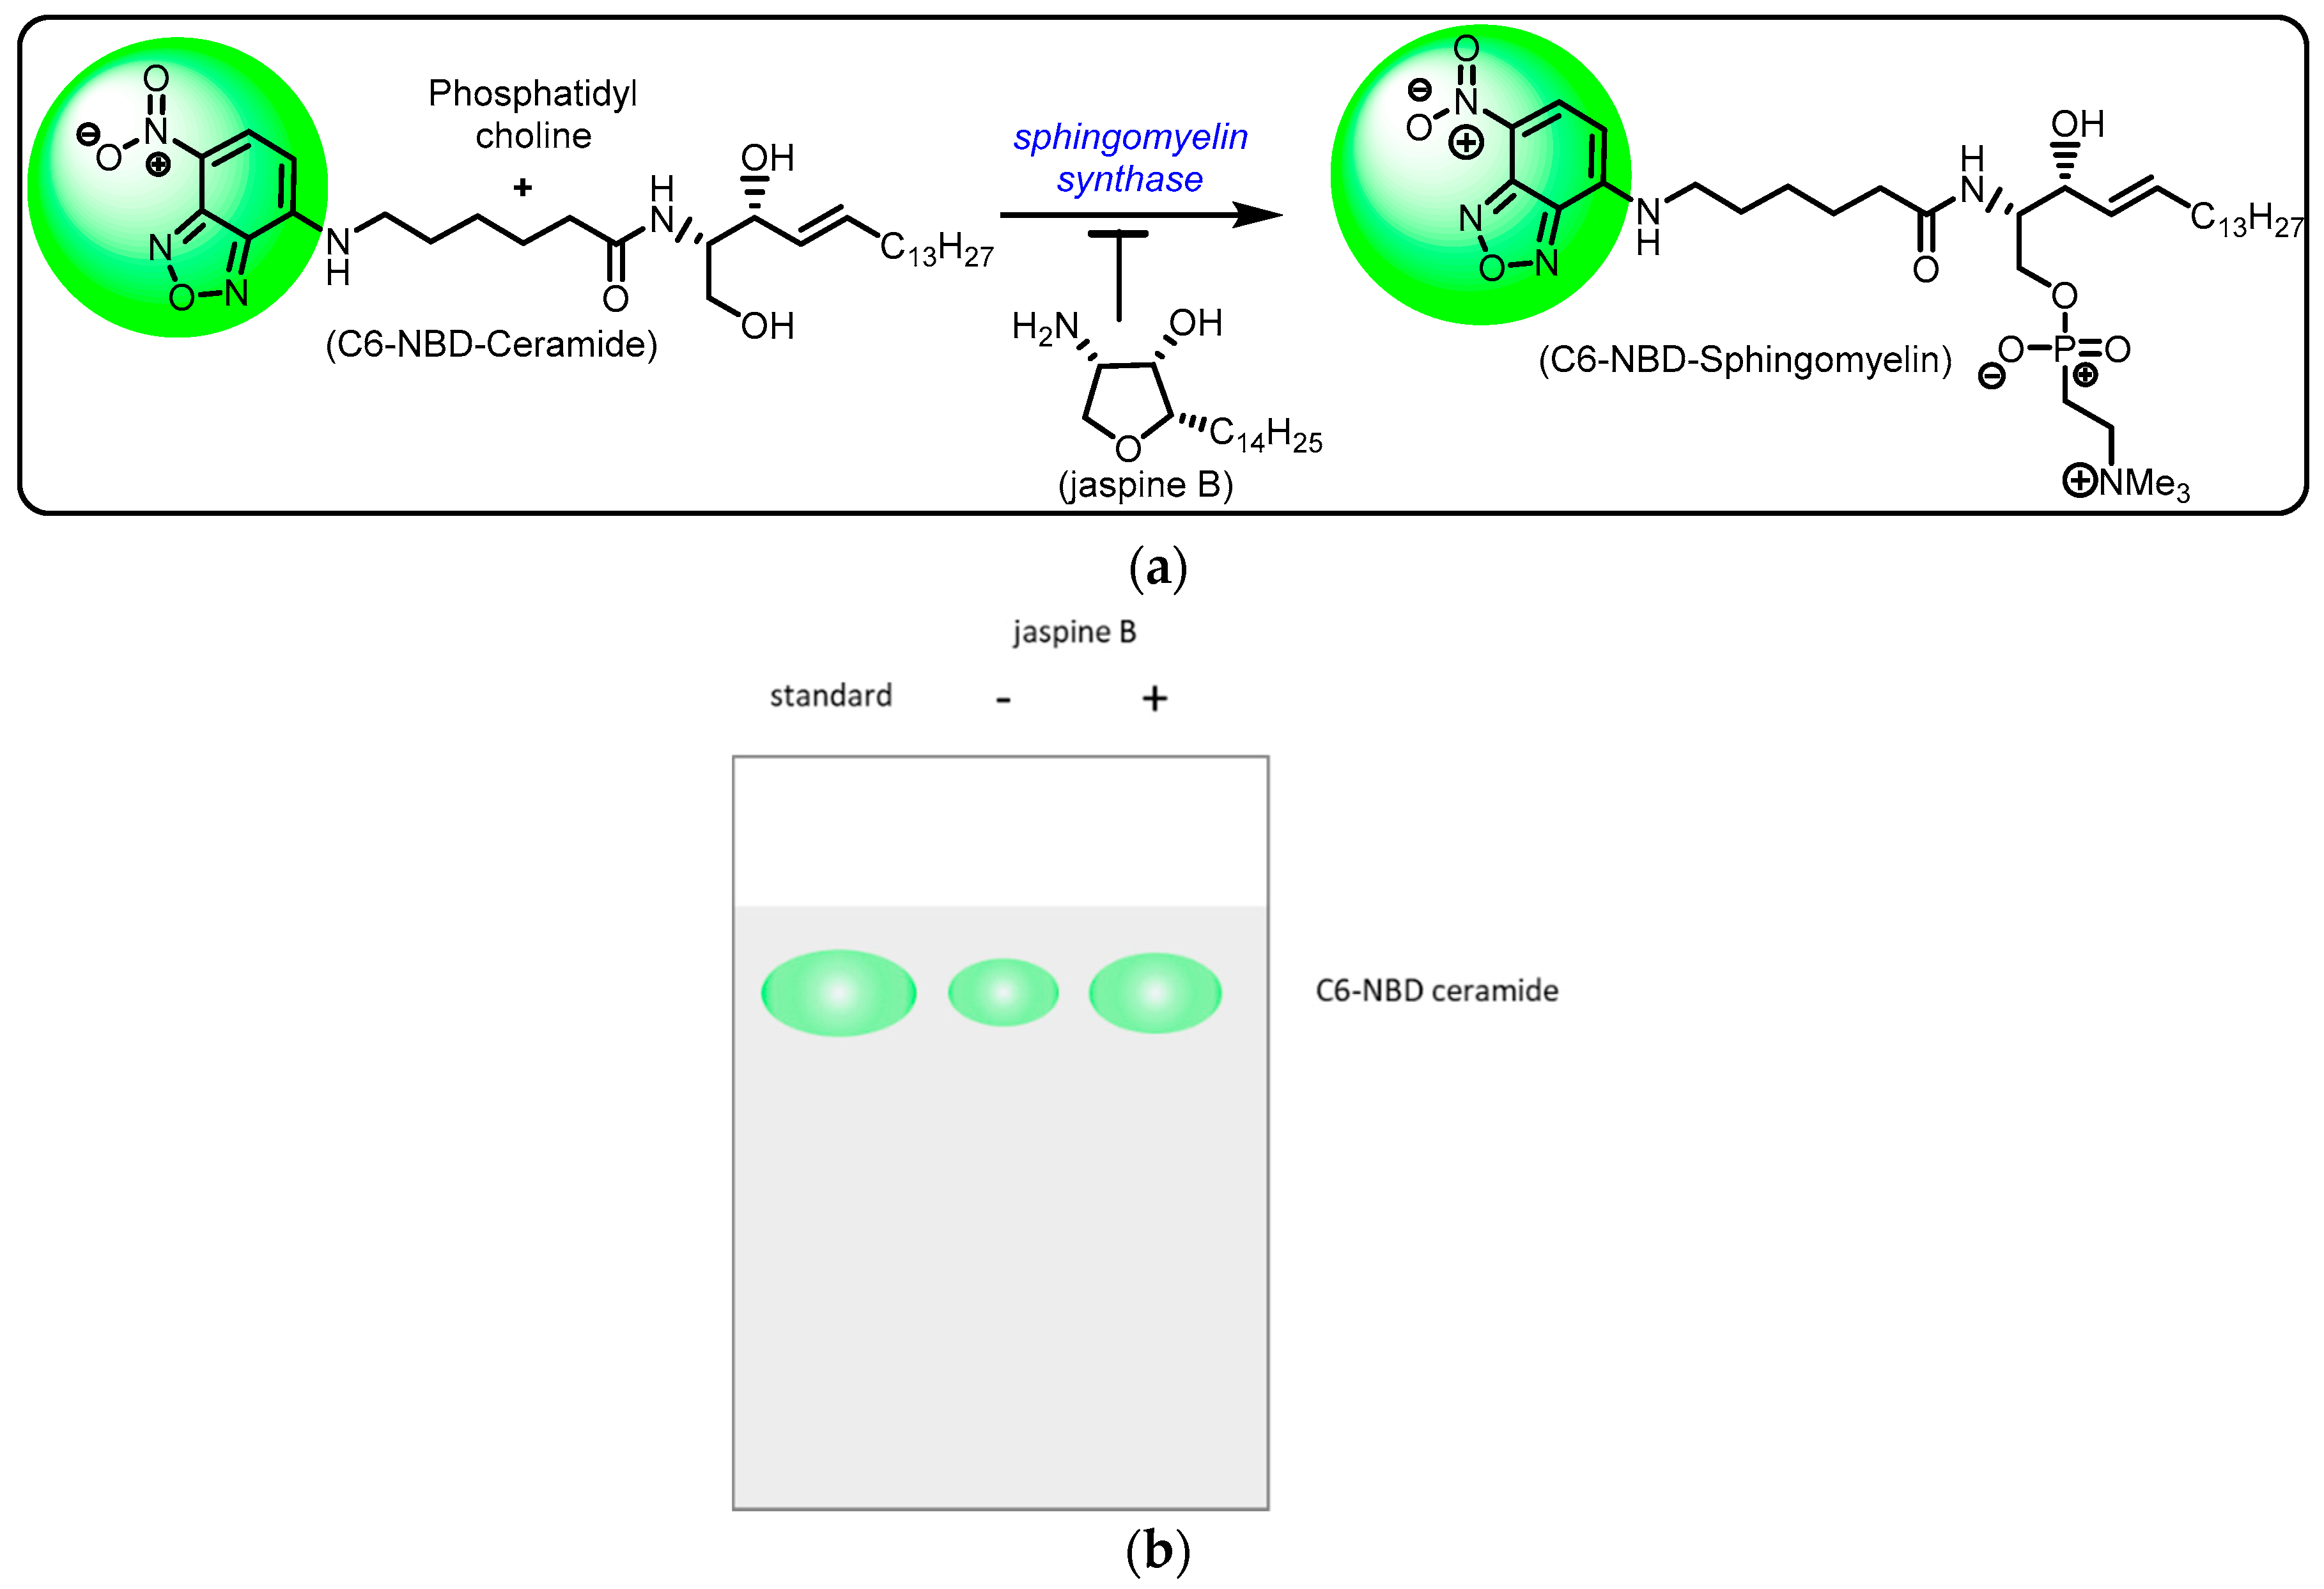
- Include a 2 μL standard of C6-NBD ceramide in 20 μL of methanol that will allow to detect where the unmodified C6-NBD ceramide is located on the gel.
- Place the plate in a beaker that has a solvent (Toluene: Pyridine:Water – 46:46:8) just below the blotted samples.
- Allow the solvent to carry the samples up the silica gel by capillary action.
- Remove the silica gel and allow to air dry.
3.5. Imaging Samples on a Fluorescent Imaging Station
- Using a fluorescent imaging station, expose the sample to 488 nm wavelength of light for excitation, then capture the emission with 520 nm wavelength filters.
- OPTIONAL STEP. The Azure c600 imaging system takes simultaneous images with blue, green and red filters. Fluorescence could be detected with both blue and green filters.
3.6. Analyzing the Images
- Export TIF image files and open in FIJI software [15].
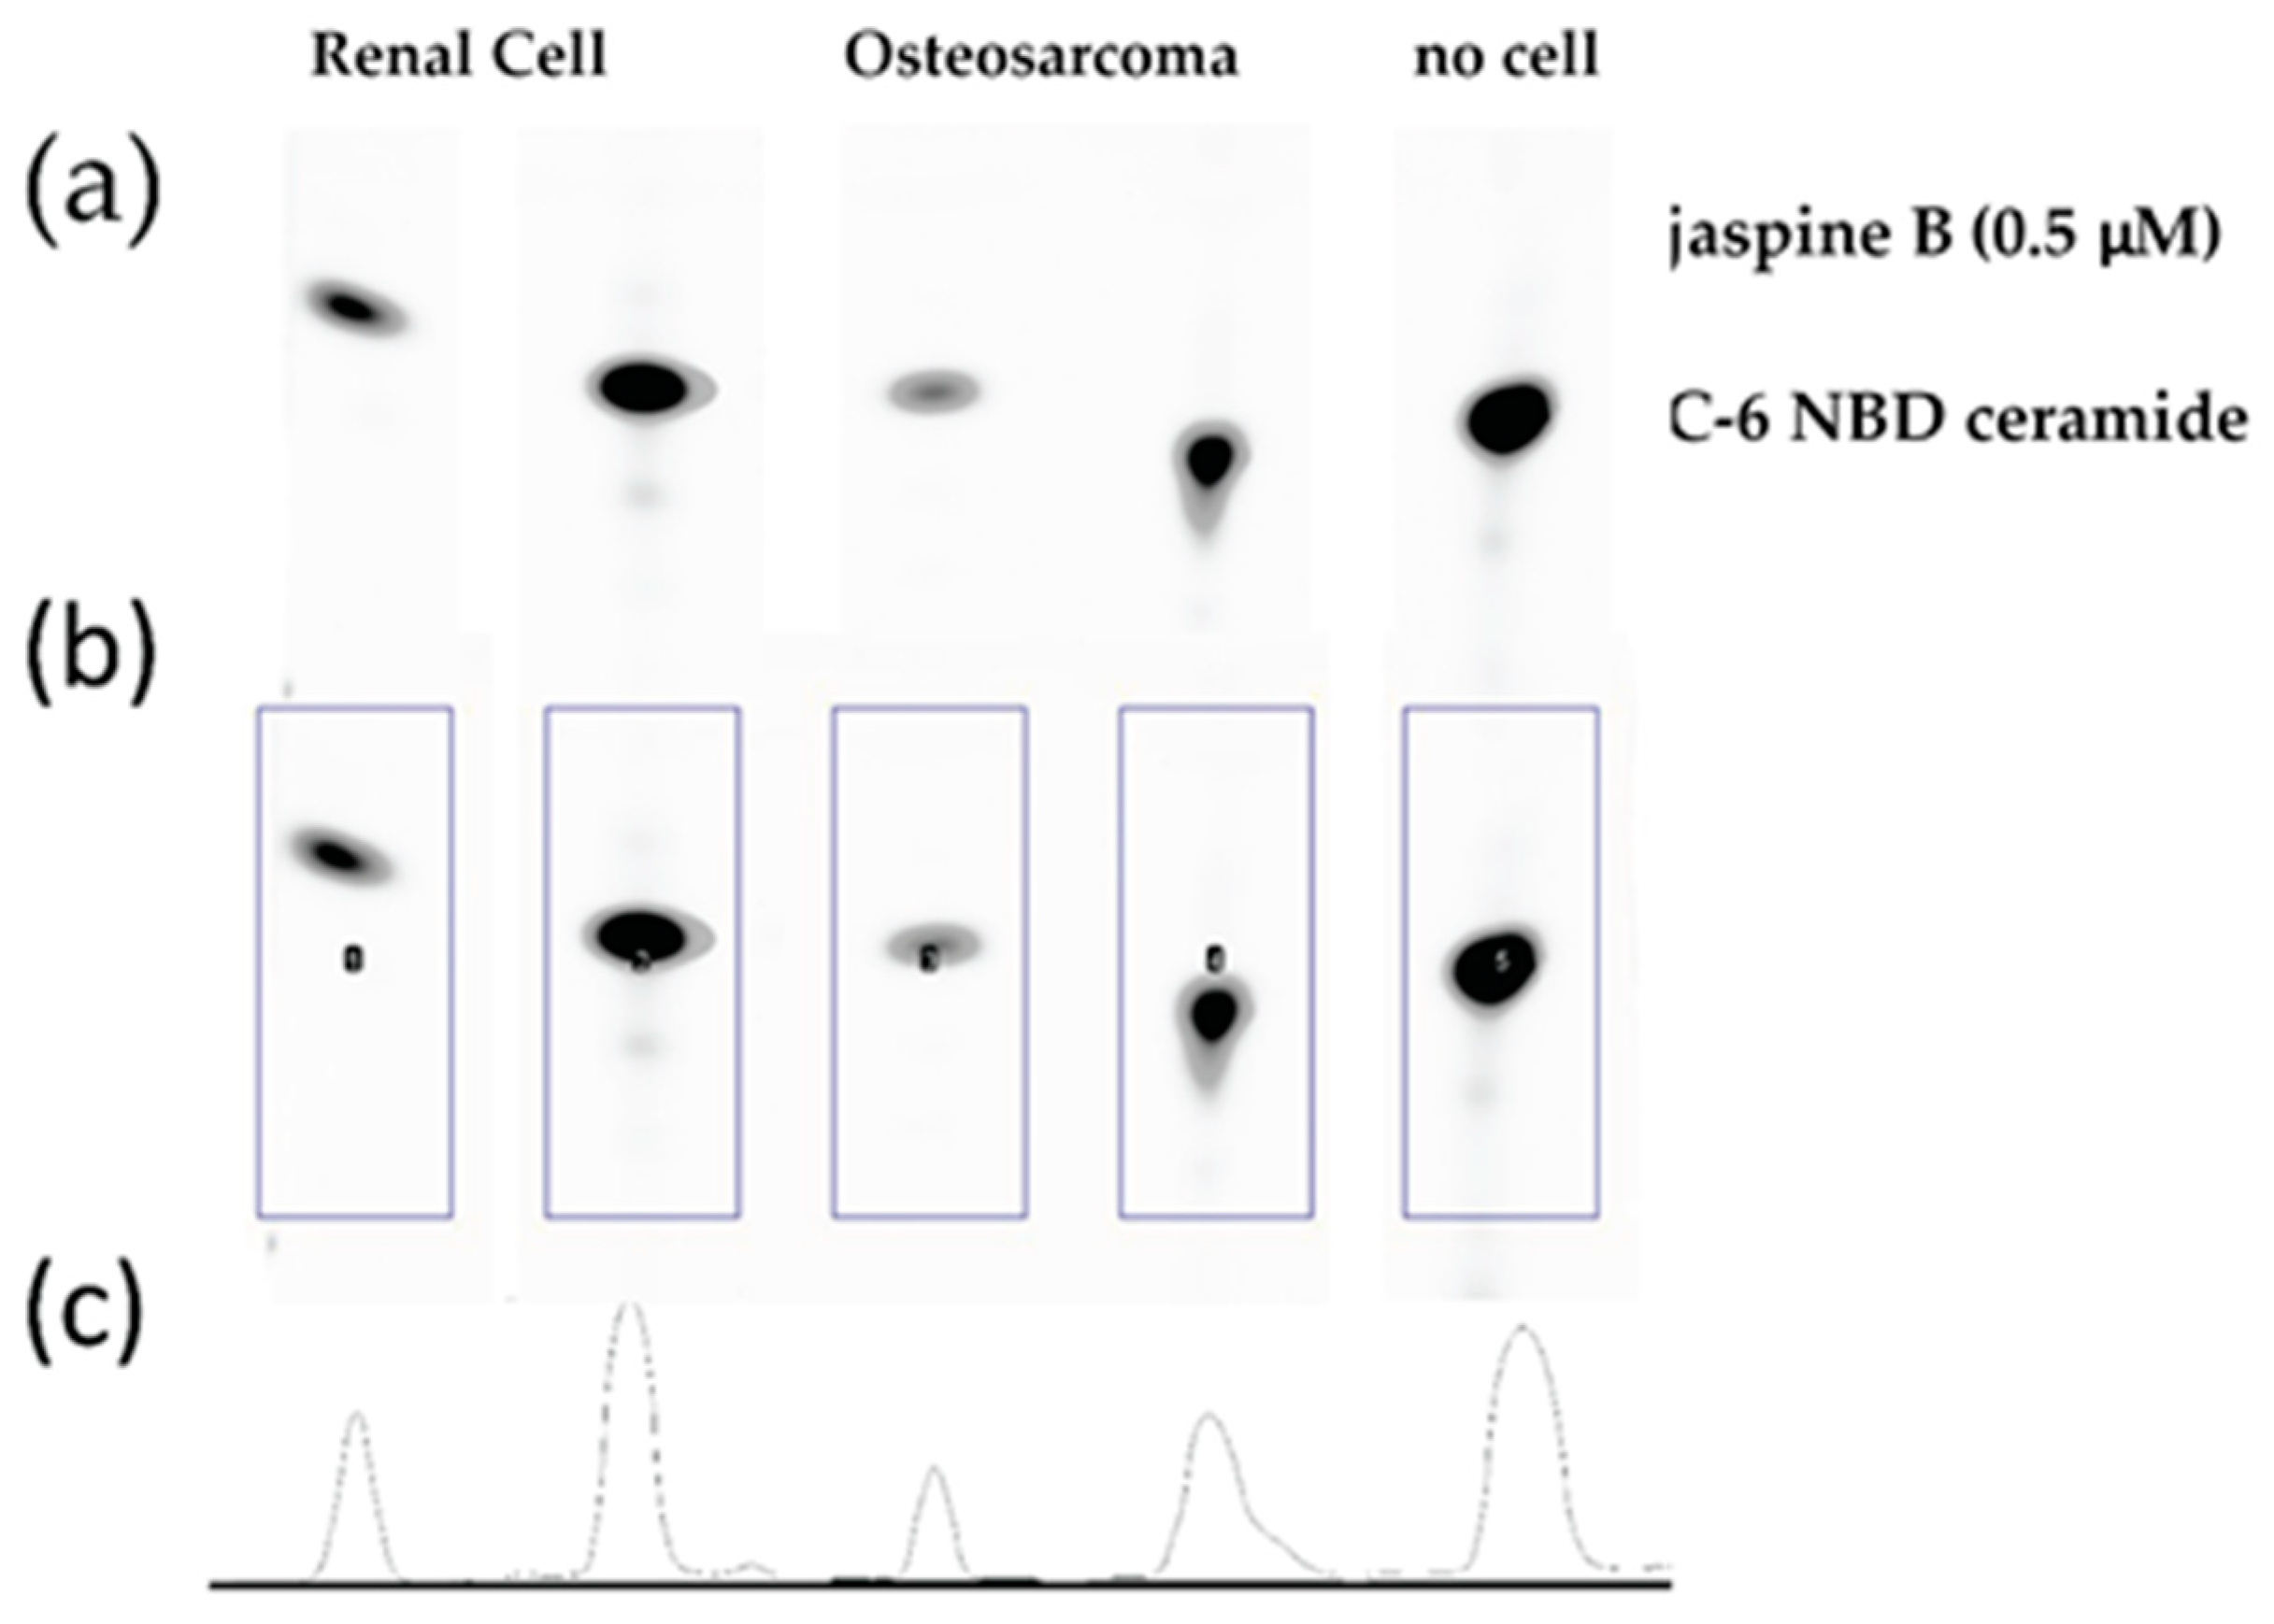
- Transform images to grayscale and invert the colors so as to have a white background with gray blots (Figure 3a).
- Create a rectangle box around the first blot and press 1 to mark as a region of interest. Drag the box, which creates a second region of interest, to the next blot and press 2 to continue marking regions of interest. Repeat for all blots on the silica gel by pressing 2 until the last blot and then press 3. This generates area under the curve images (Figure 3b,c).
- Select the wand tool in FIJI and click in the middle of the area under the curve. This measures the value and puts it in a separate window.
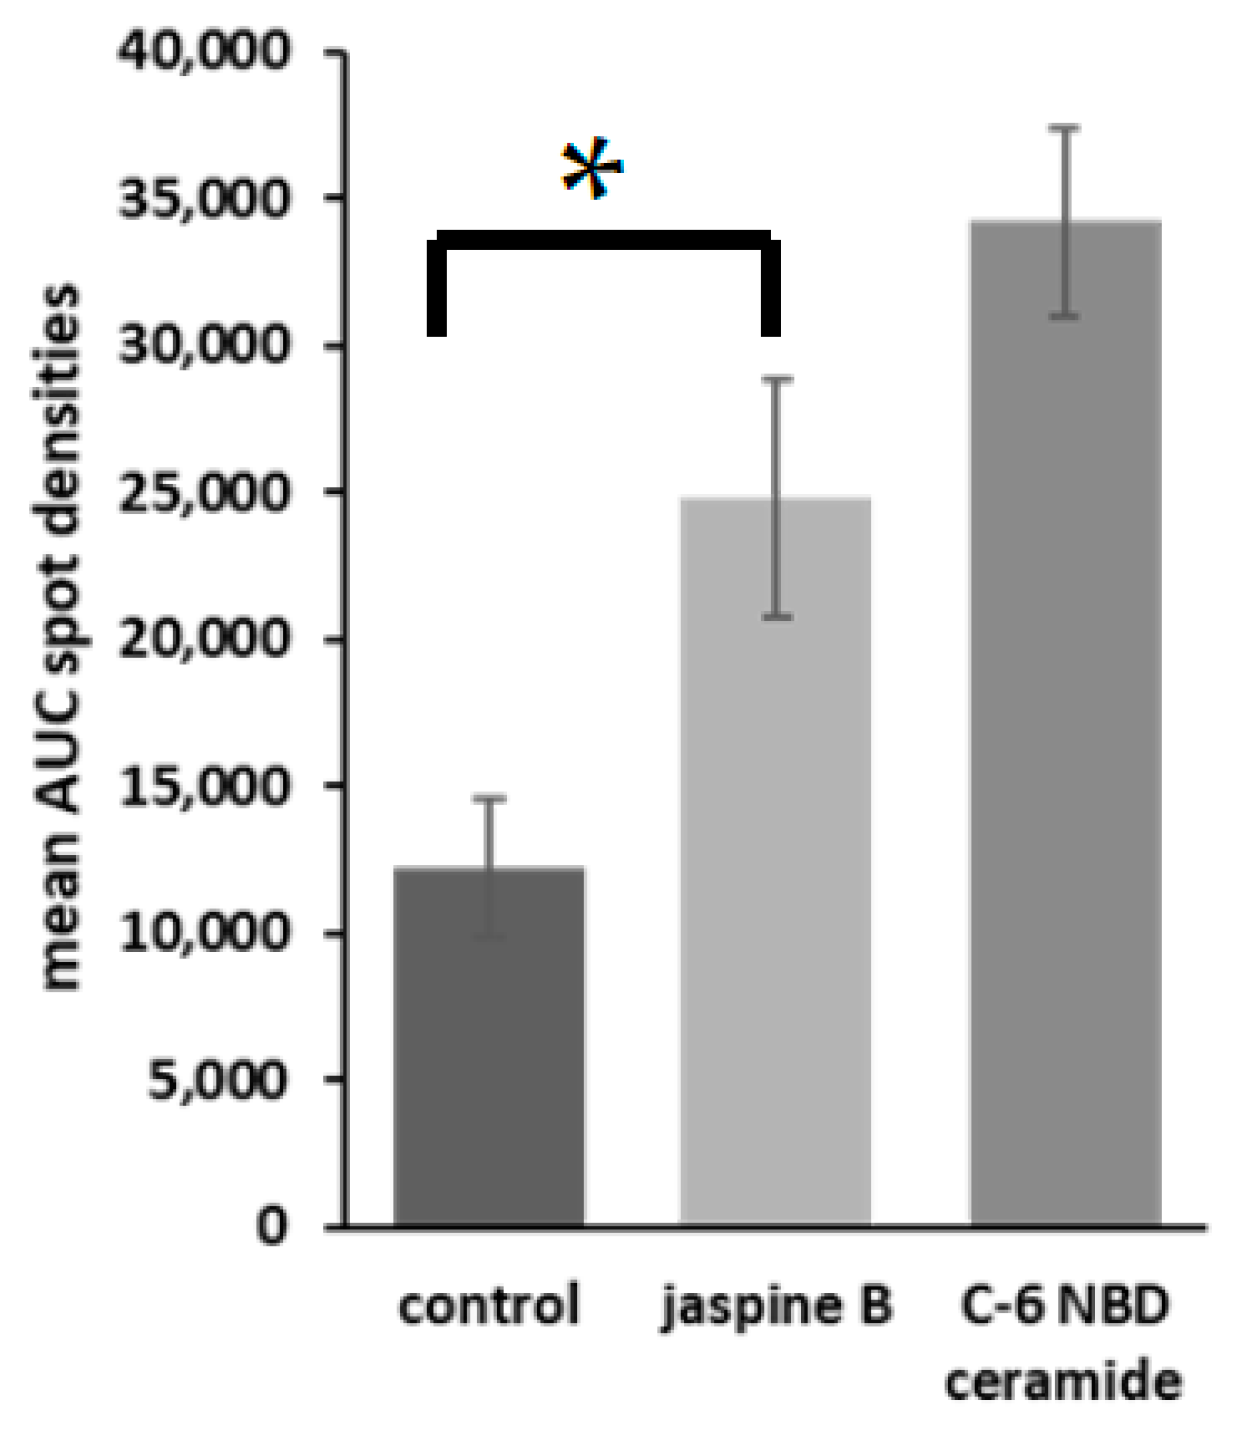
- Transfer to a spreadsheet document and perform statistical analyses to compare the control versus the treated samples (Figure 4).
4. Expected Results
5. Reagents Setup
Author Contributions
Funding
Acknowledgments
Conflicts of Interest
References
- Hanahan, D.; Weinberg, R.A. Hallmarks of cancer: The next generation. Cell 2011, 144, 646–674. [Google Scholar] [CrossRef] [PubMed]
- Ogretmen, B. Sphingolipid metabolism in cancer signalling and therapy. Nat. Rev. Cancer 2018, 18, 33–50. [Google Scholar] [CrossRef] [PubMed]
- Oskouian, B.; Saba, D. Cancer treatment strategies targeting sphingolipid metabolism. Adv. Exp. Med. Biol. 2010, 688, 185–205. [Google Scholar] [PubMed]
- Tafesse, F.G.; Huitema, K.; Hermansson, M.; Van Der Poel, S.; Van Den Dikkenberg, J.; Uphoff, A.; Somerharju, P.; Holthuis, J.C. Both sphingomyelin synthases SMS1 and SMS2 are required for sphingomyelin homeostasis and growth in human HeLa cells. J. Biol. Chem. 2007, 282, 17537–17547. [Google Scholar] [CrossRef] [PubMed]
- Lou, B.; Dong, J.; Li, Y.; Ding, T.; Bi, T.; Li, Y.; Deng, X.; Ye, D.; Jiang, X.C. Pharmacologic inhibition of sphingomyelin synthase (SMS) activity reduces apolipoprotein-B secretion from hepatocytes and attenuates endotoxin-mediated macrophage inflammation. PLoS ONE 2014, 9, e102641. [Google Scholar] [CrossRef] [PubMed]
- Gupta, V.; Patwardhan, G.A.; Zhang, Q.J.; Cabot, M.C.; Jazwinski, S.M.; Liu, Y.Y. Direct quantitative determination of ceramide glycosylation in vivo: A new approach to evaluate cellular enzyme activity of glucosylceramide synthase. J. Lipid Res. 2010, 51, 866–874. [Google Scholar] [CrossRef] [PubMed]
- Khiste, S.K.; Hosain, S.B.; Dong, Y.; Uddin, M.B.; Roy, K.R.; Hill, R.A.; Liu, Z.; Liu, Y.Y. Incorporation of Fluorescence Ceramide-Based HPLC Assay for Rapidly and Efficiently Assessing Glucosylceramide Synthase In Vivo. Sci. Rep. 2017, 7, 2976. [Google Scholar] [CrossRef] [PubMed]
- Goliwas, K.F.; Richter, J.R.; Pruitt, H.C.; Araysi, L.M.; Anderson, N.R.; Samant, R.S.; Lobo-Ruppert, S.M.; Berry, J.L.; Frost, A.R. Methods to Evaluate Cell Growth, Viability, and Response to Treatment in a Tissue Engineered Breast Cancer Model. Sci. Rep. 2017, 7, 14167. [Google Scholar] [CrossRef] [PubMed]
- Méry, B.; Guy, J.B.; Vallard, A.; Espenel, S.; Ardail, D.; Rodriguez-Lafrasse, C.; Rancoule, C.; Magné, N. In Vitro Cell Death Determination for Drug Discovery: A Landscape Review of Real Issues. J. Cell Death 2017, 10, 1179670717691251. [Google Scholar] [CrossRef] [PubMed]
- Bilal, F.; Pérès, M.; Andrieu-Abadie, N.; Levade, T.; Badran, B.; Daher, A.; Ségui, B. Method to measure sphingomyelin synthase activity changes in response to CD95L. In CD95: Methods and Protocols; Legembre, P., Ed.; Springer: New York, NY, USA, 2017; pp. 207–212. [Google Scholar]
- Blaess, M.; Claus, R.A.; Deigner, H.P. HPLC separation and ultrasensitive optical quantification of ceramide species applying 7-(diethylamino)coumarin-3-carbonyl azide derivatisation. J. Chromatogr. B Analyt. Technol. Biomed. Life Sci. 2015, 986, 123–128. [Google Scholar] [CrossRef] [PubMed]
- Kasumov, T.; Huang, H.; Chung, Y.M.; Zhang, R.; McCullough, A.J.; Kirwan, J.P. Quantification of ceramide species in biological samples by liquid chromatography electrospray ionization tandem mass spectrometry. Anal. Biochem. 2010, 401, 154–161. [Google Scholar] [CrossRef] [PubMed]
- Zhang, K.; Haynes, T.A.S.; Filippova, M.; Filippov, V.; Duerksen-Hughes, P.J. Quantification of ceramide levels in mammalian cells by high performance liquid chromatography coupled to tandem mass spectrometry with multiple-reaction-monitoring mode (HPLC-MS/MS-MRM). Anal. Methods 2011, 3, 1193–1197. [Google Scholar] [CrossRef]
- Pashikanti, S.; Ukani, R.; David, S.A.; Datta, A. Total Synthesis and Structure-Activity Relationship Studies of the Cytotoxic Anhydrophytosphingosine Jaspine B (Pachastrissamine). Synth. Stuttg. 2017, 49, 2088–2100. [Google Scholar]
- Schindelin, J.; Arganda-Carreras, I.; Frise, E.; Kaynig, V.; Longair, M.; Pietzsch, T.; Preibisch, S.; Rueden, C.; Saalfeld, S.; Schmid, B.; et al. Fiji: An open-source platform for biological-image analysis. Nat. Methods 2012, 9, 676–682. [Google Scholar] [CrossRef] [PubMed]
- Bielawska, A.; Szulc, Z.; Hannun, Y.A. Synthesis of key precursors of radiolabeled sphingolipids. Methods Enzym. 2000, 311, 518–535. [Google Scholar]
- Chigorno, V.; Giannotta, C.; Ottico, E.; Sciannamblo, M.; Mikulak, J.; Prinetti, A.; Sonnino, S. Sphingolipid uptake by cultured cells: Complex aggregates of cell sphingolipids with serum proteins and lipoproteins are rapidly catabolized. J. Biol. Chem. 2005, 280, 2668–2675. [Google Scholar] [CrossRef] [PubMed]
- Alberts, B.; Kirschner, M.W.; Tilghman, S.; Varmus, H. Rescuing US biomedical research from its systemic flaws. Proc. Natl. Acad. Sci. USA 2014, 111, 5773–5777. [Google Scholar] [CrossRef]
- Ballal, R.; Cheema, A.; Ahmad, W.; Rosen, E.M.; Tapas, S. Fluorescent oligonucleotides can serve as suitable alternatives to radiolabeled oligonucleotides. J. Biomol. Tech. 2009, 20, 190–194. [Google Scholar]
- Ying, B.W.; Fourmy, D.; Yoshizawa, S. Substitution of the use of radioactivity by fluorescence for biochemical studies of RNA. RNA 2007, 13, 2042–2050. [Google Scholar] [CrossRef]
- Kim, R.; Lou, K.; Kraft, M.L. A new, long-wavelength borondipyrromethene sphingosine for studying sphingolipid dynamics in live cells. J. Lipid Res. 2013, 54, 265–275. [Google Scholar] [CrossRef]
- Wang, Y.; Kasahara, J.; Yamagata, K.; Nakamura, H.; Murayama, T.; Suzuki, N.; Nishida, A. Development of a new doubly-labeled fluorescent ceramide probe for monitoring the metabolism of sphingolipids in living cells. Bioorg. Med. Chem. Lett. 2018, 28, 3222–3226. [Google Scholar] [CrossRef] [PubMed]
- Kim, R.; Lou, K.; Kraft, M. Use of Fluorescent Sphingolipid Precursors for Biophysical Studies of Sphingolipids. Biophys. J. 2012, 102, 200a. [Google Scholar] [CrossRef]


| Company | Catalog | Hybridoma Clone # | Applications |
|---|---|---|---|
| United States Biological | C2777-95 | 6D311 | AP, ELISA, FACS, IHC-F/P |
| Epigentek | A-0549-001 | MID15B4 | ELISA, ICC, IHC-F/P |
| Enzo Life Sciences | ALX-804-196-T050 | MID15B4 | ELISA, FACS, ICC, IHC-F/P |
| Lifespan Biosciences | LS-C79075 | MID15B4 | ELISA, FACS, ICC, IHC-F |
© 2019 by the authors. Licensee MDPI, Basel, Switzerland. This article is an open access article distributed under the terms and conditions of the Creative Commons Attribution (CC BY) license (http://creativecommons.org/licenses/by/4.0/).
Share and Cite
Pashikanti, S.; Afrin, F.; Meldrum, T.C.; Stegelmeier, J.L.; Pavek, A.; Habashi, Y.A.; Fatema, K.; Barrott, J.J. Quantifying Fluorescently Labeled Ceramide Levels in Human Sarcoma Cell Lines in Response to a Sphingomyelin Synthase Inhibitor. Methods Protoc. 2019, 2, 76. https://doi.org/10.3390/mps2030076
Pashikanti S, Afrin F, Meldrum TC, Stegelmeier JL, Pavek A, Habashi YA, Fatema K, Barrott JJ. Quantifying Fluorescently Labeled Ceramide Levels in Human Sarcoma Cell Lines in Response to a Sphingomyelin Synthase Inhibitor. Methods and Protocols. 2019; 2(3):76. https://doi.org/10.3390/mps2030076
Chicago/Turabian StylePashikanti, Srinath, Farjana Afrin, Trevor C. Meldrum, John L. Stegelmeier, Adriene Pavek, Yashar A. Habashi, Kaniz Fatema, and Jared J. Barrott. 2019. "Quantifying Fluorescently Labeled Ceramide Levels in Human Sarcoma Cell Lines in Response to a Sphingomyelin Synthase Inhibitor" Methods and Protocols 2, no. 3: 76. https://doi.org/10.3390/mps2030076
APA StylePashikanti, S., Afrin, F., Meldrum, T. C., Stegelmeier, J. L., Pavek, A., Habashi, Y. A., Fatema, K., & Barrott, J. J. (2019). Quantifying Fluorescently Labeled Ceramide Levels in Human Sarcoma Cell Lines in Response to a Sphingomyelin Synthase Inhibitor. Methods and Protocols, 2(3), 76. https://doi.org/10.3390/mps2030076