One-Step ARMS-PCR for the Detection of SNPs—Using the Example of the PADI4 Gene

 , ,
, ,
Abstract
:1. Introduction
2. Materials and Methods
2.1. Individuals
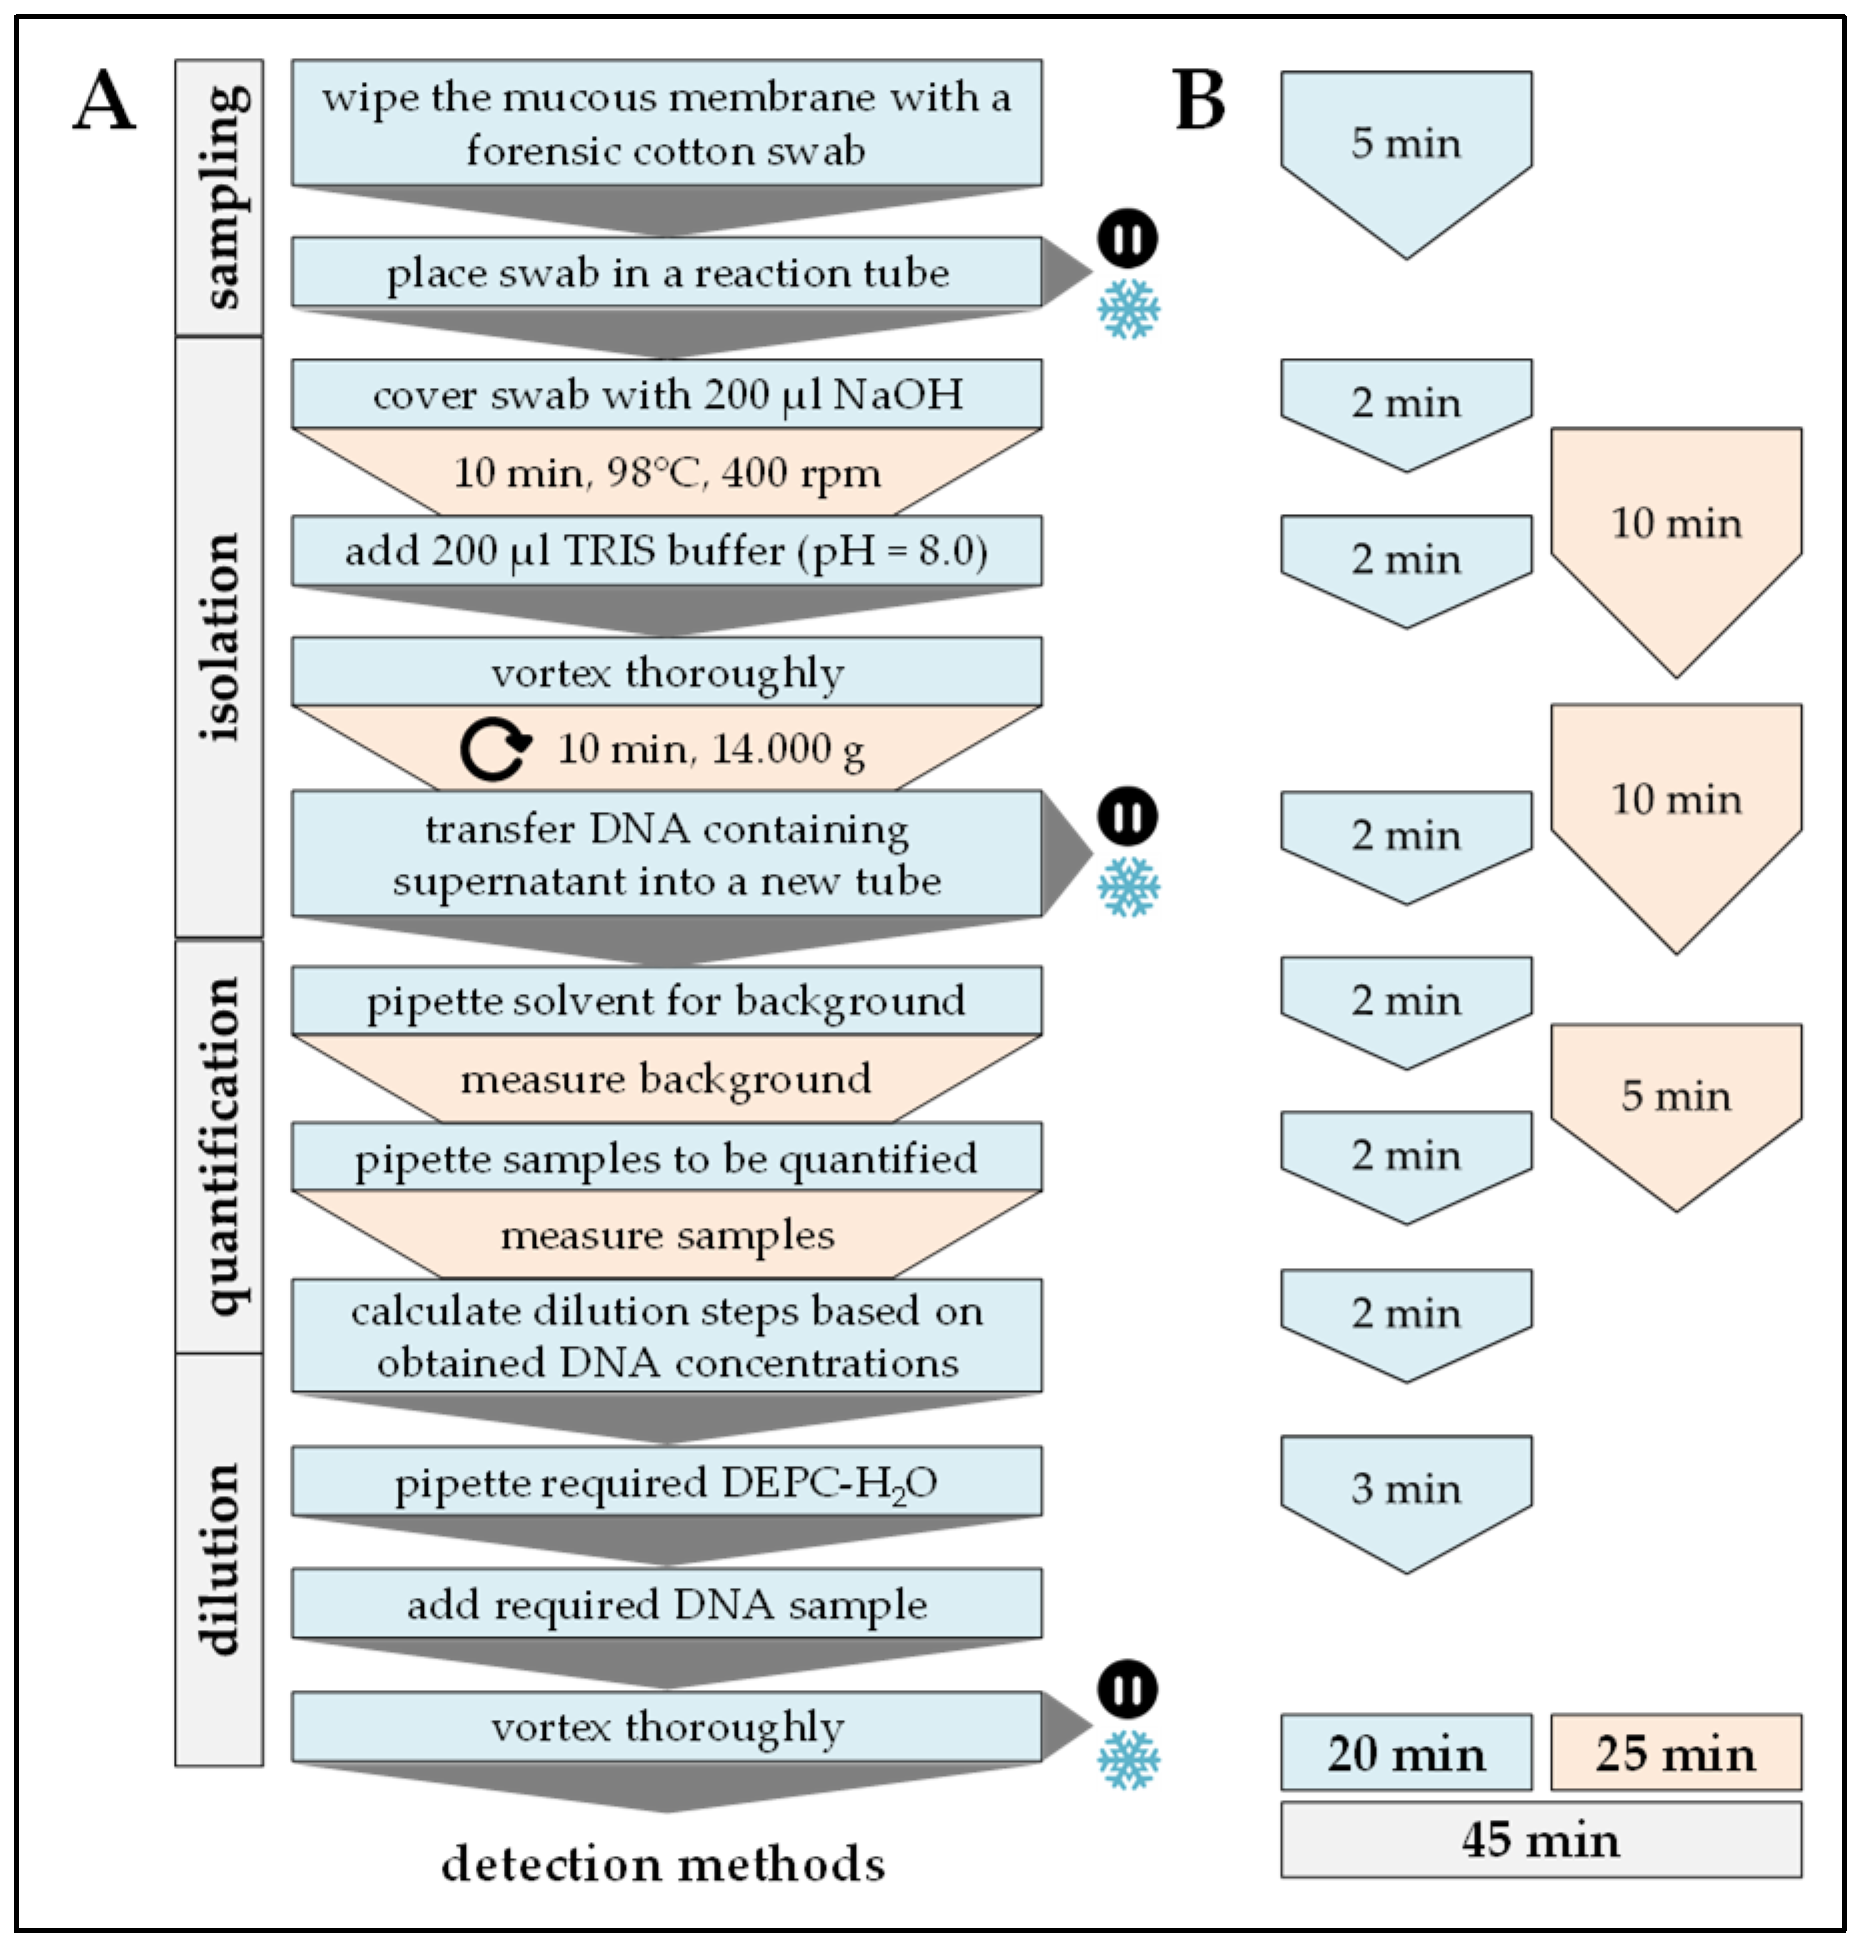
2.2. DNA Extraction
2.3. Primer Information
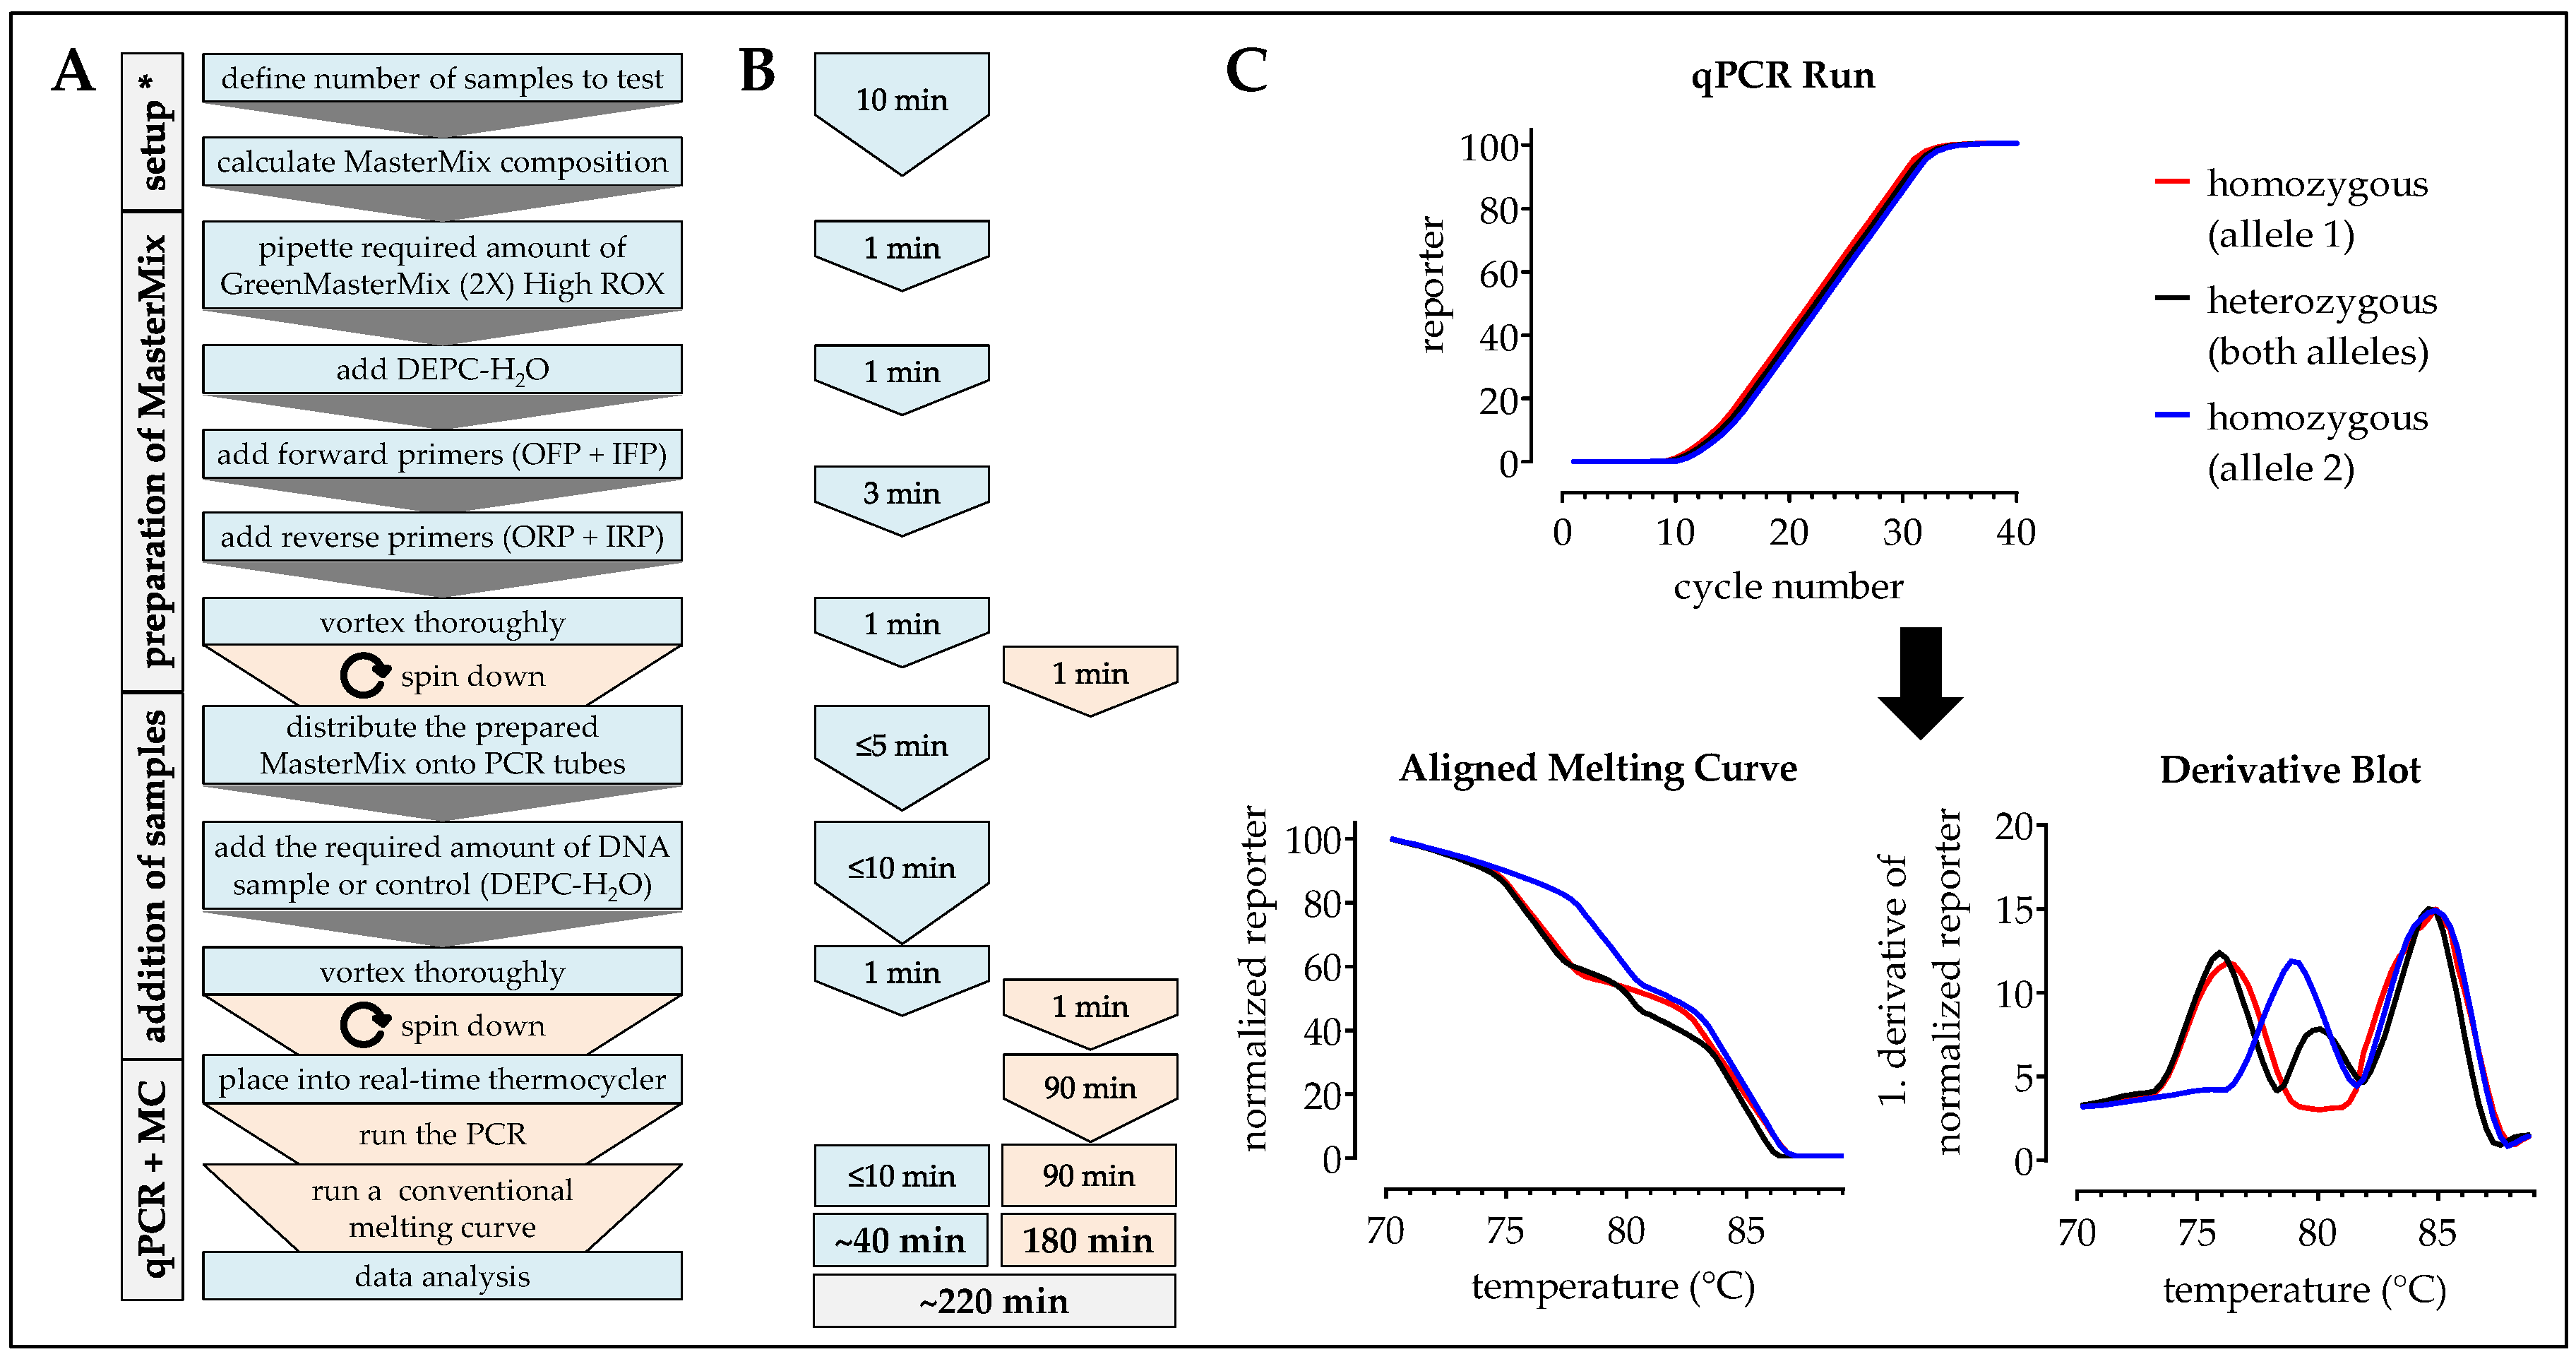
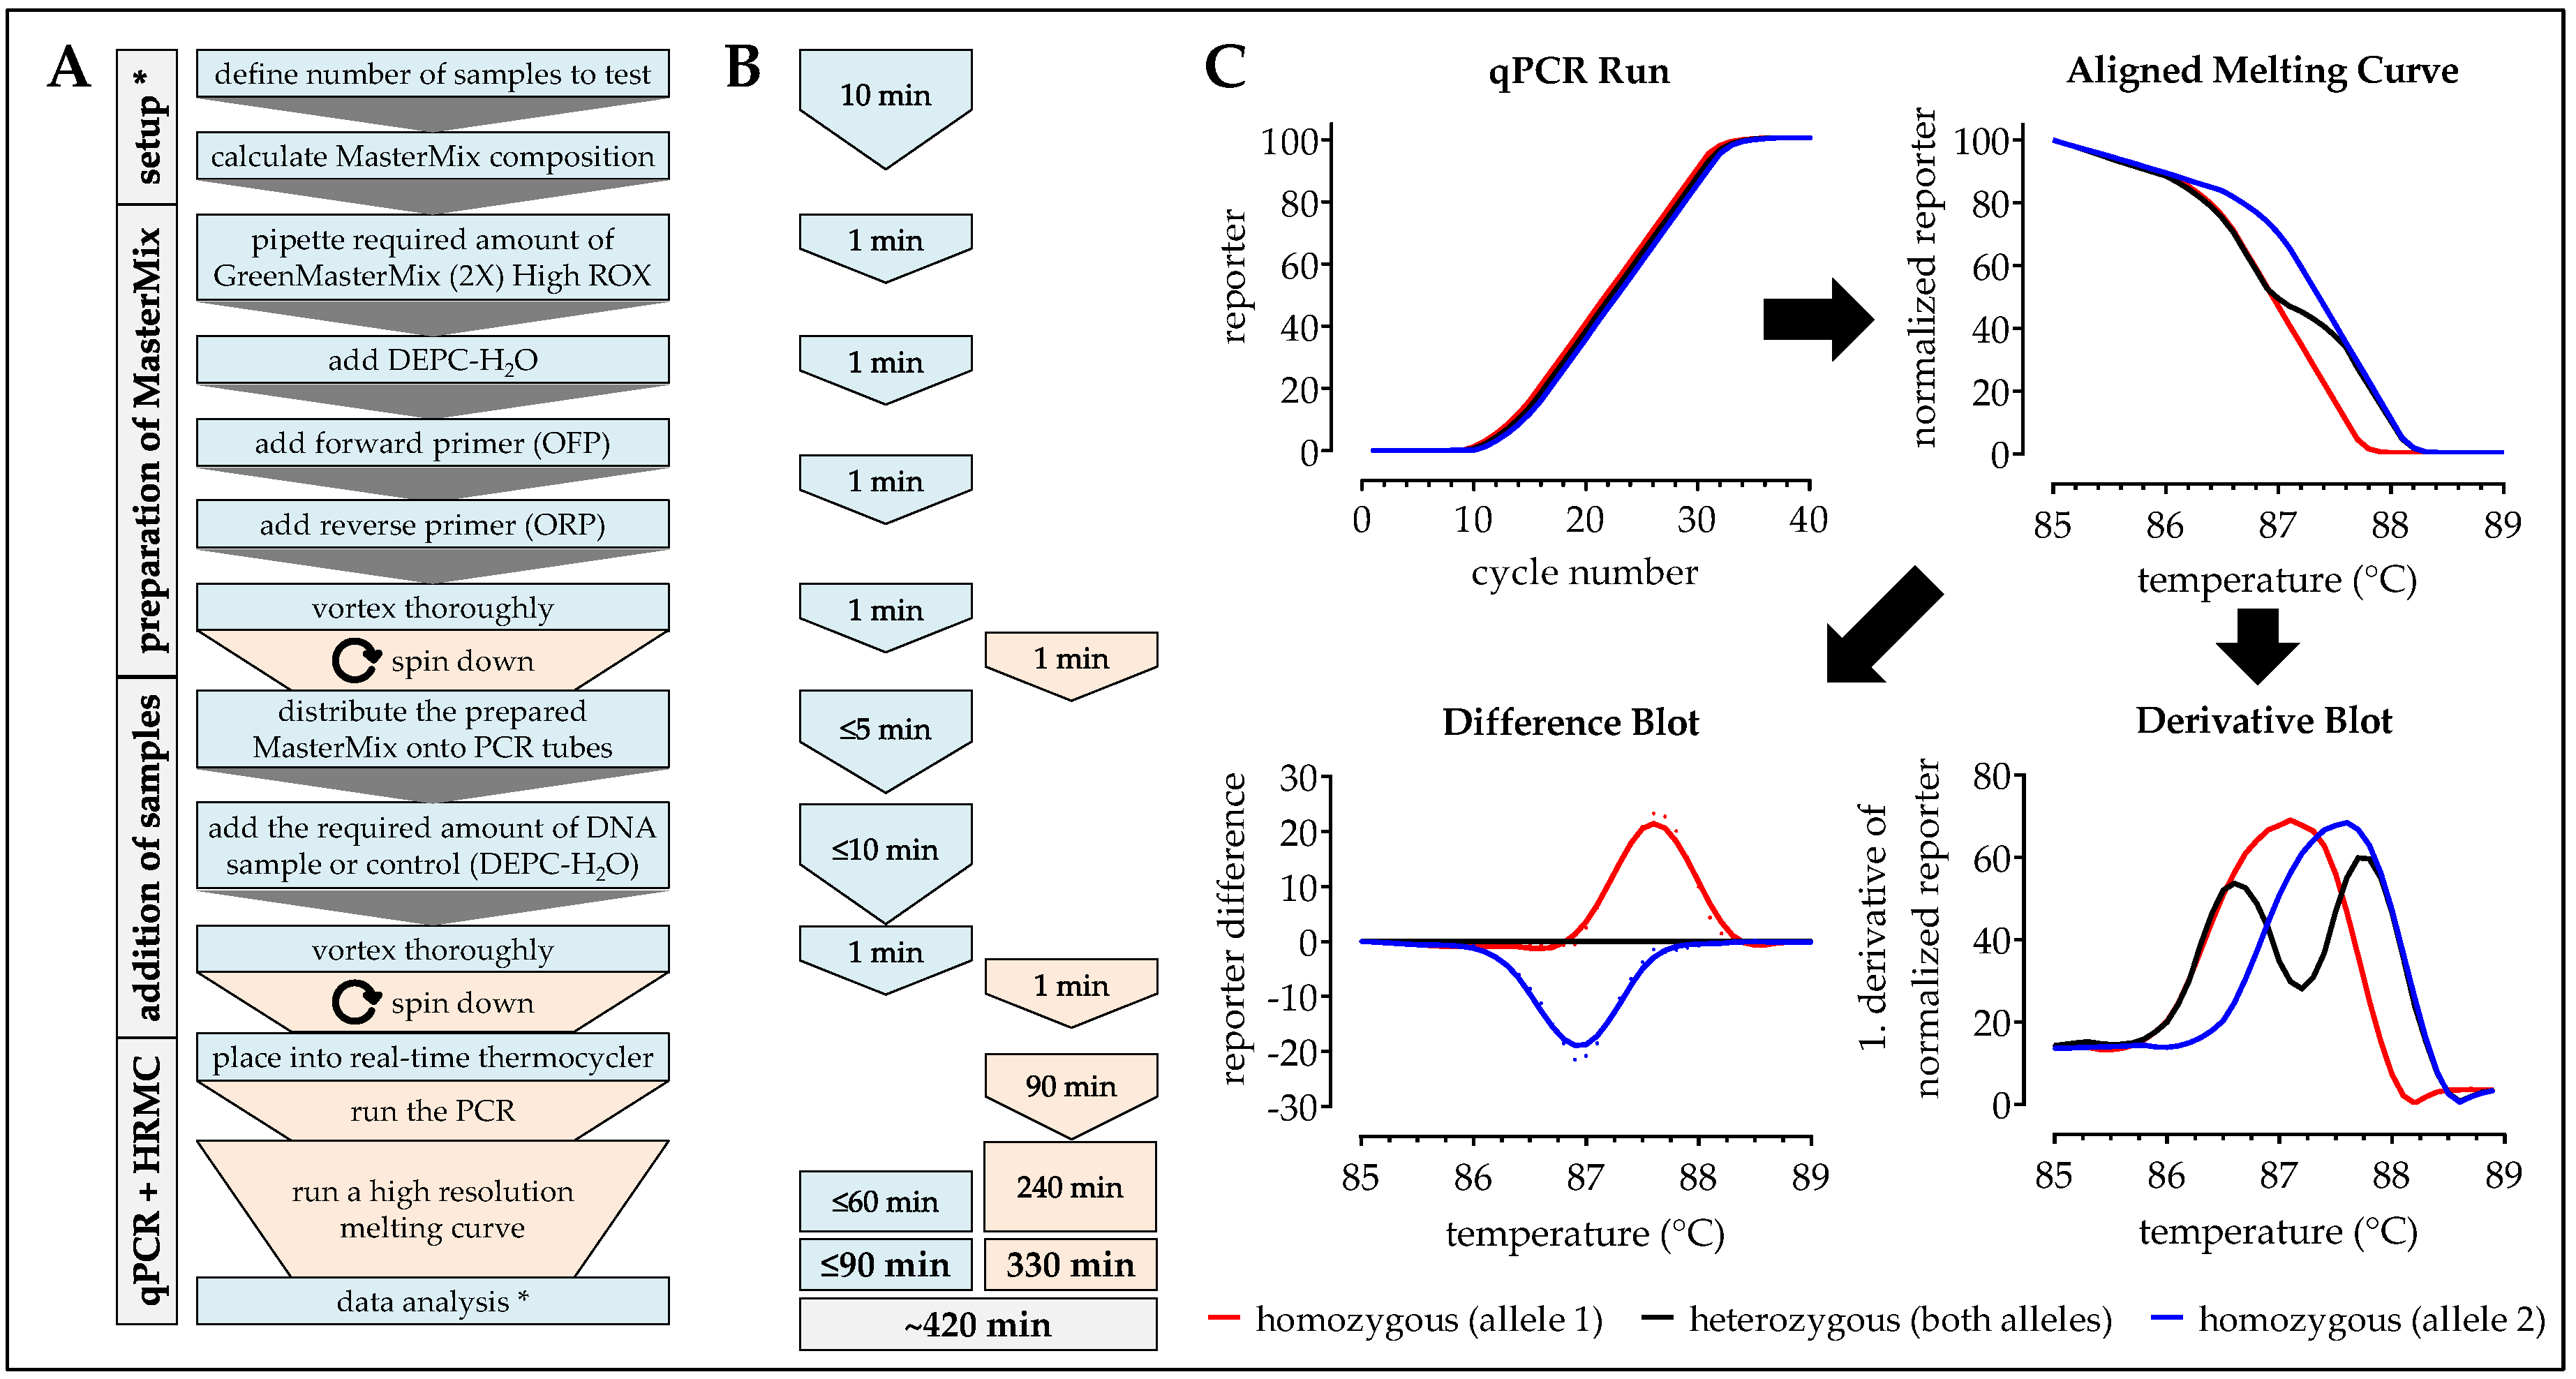
2.4. HRM-PCR
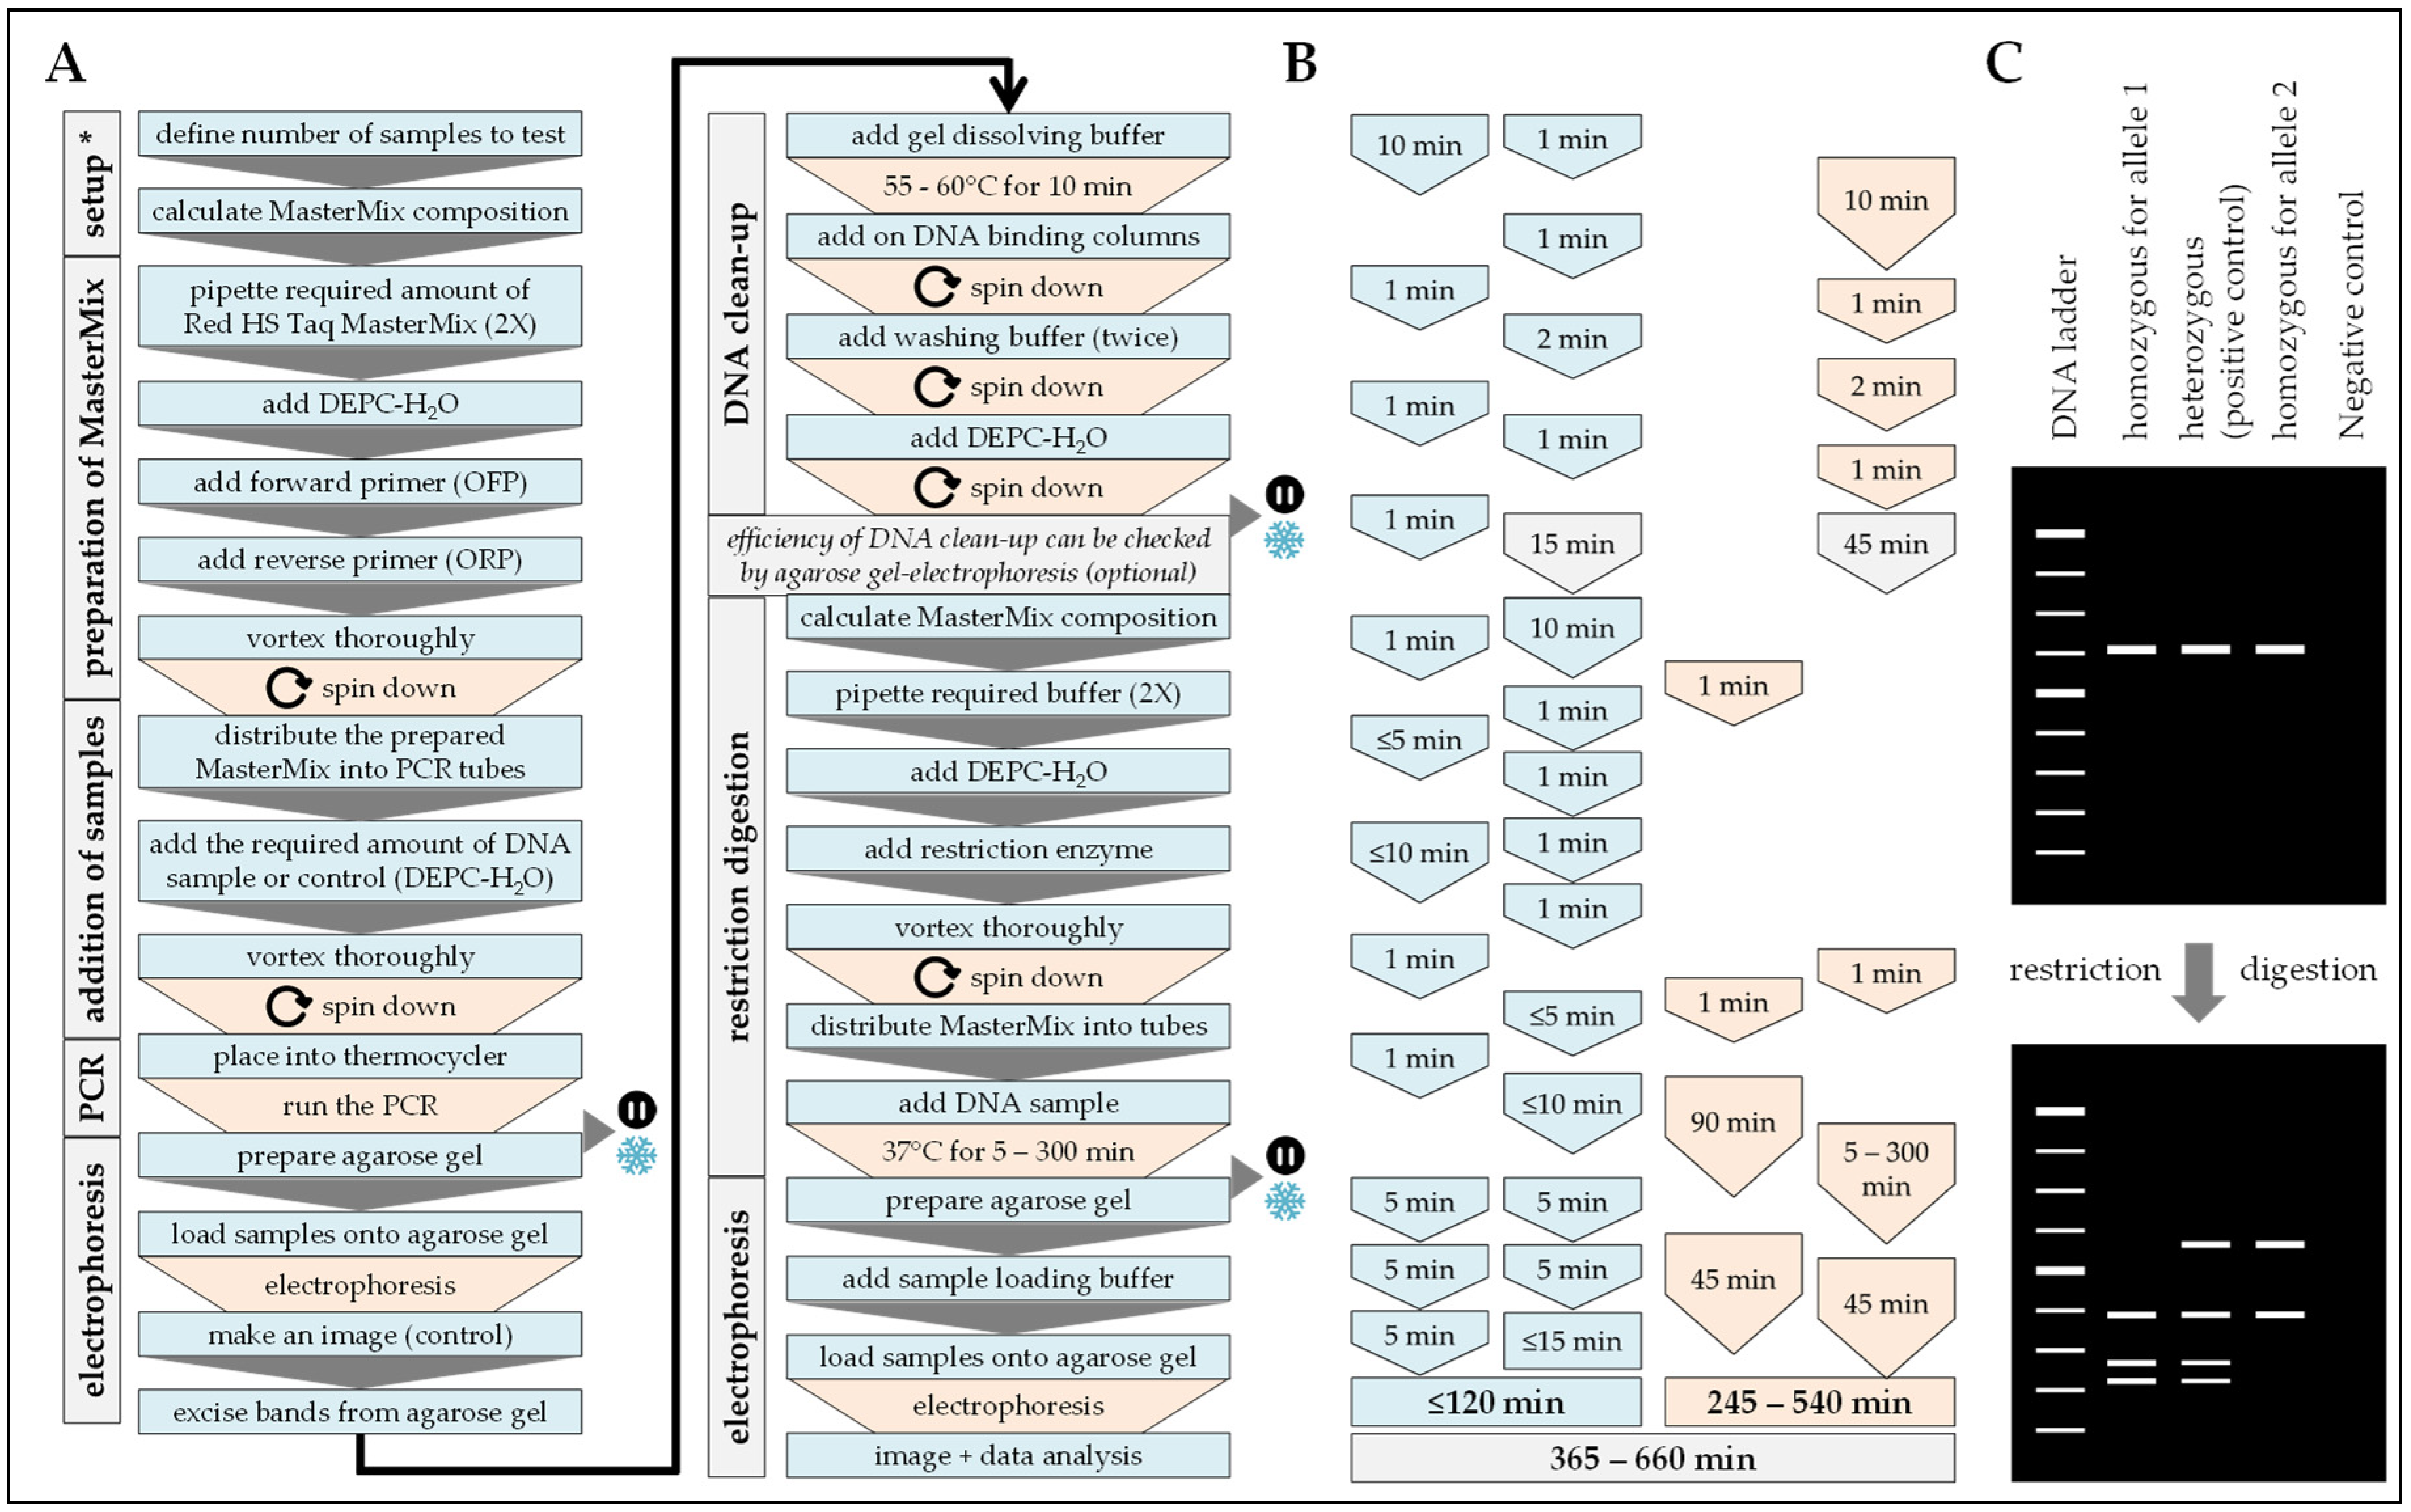
2.5. PCR-RFLP
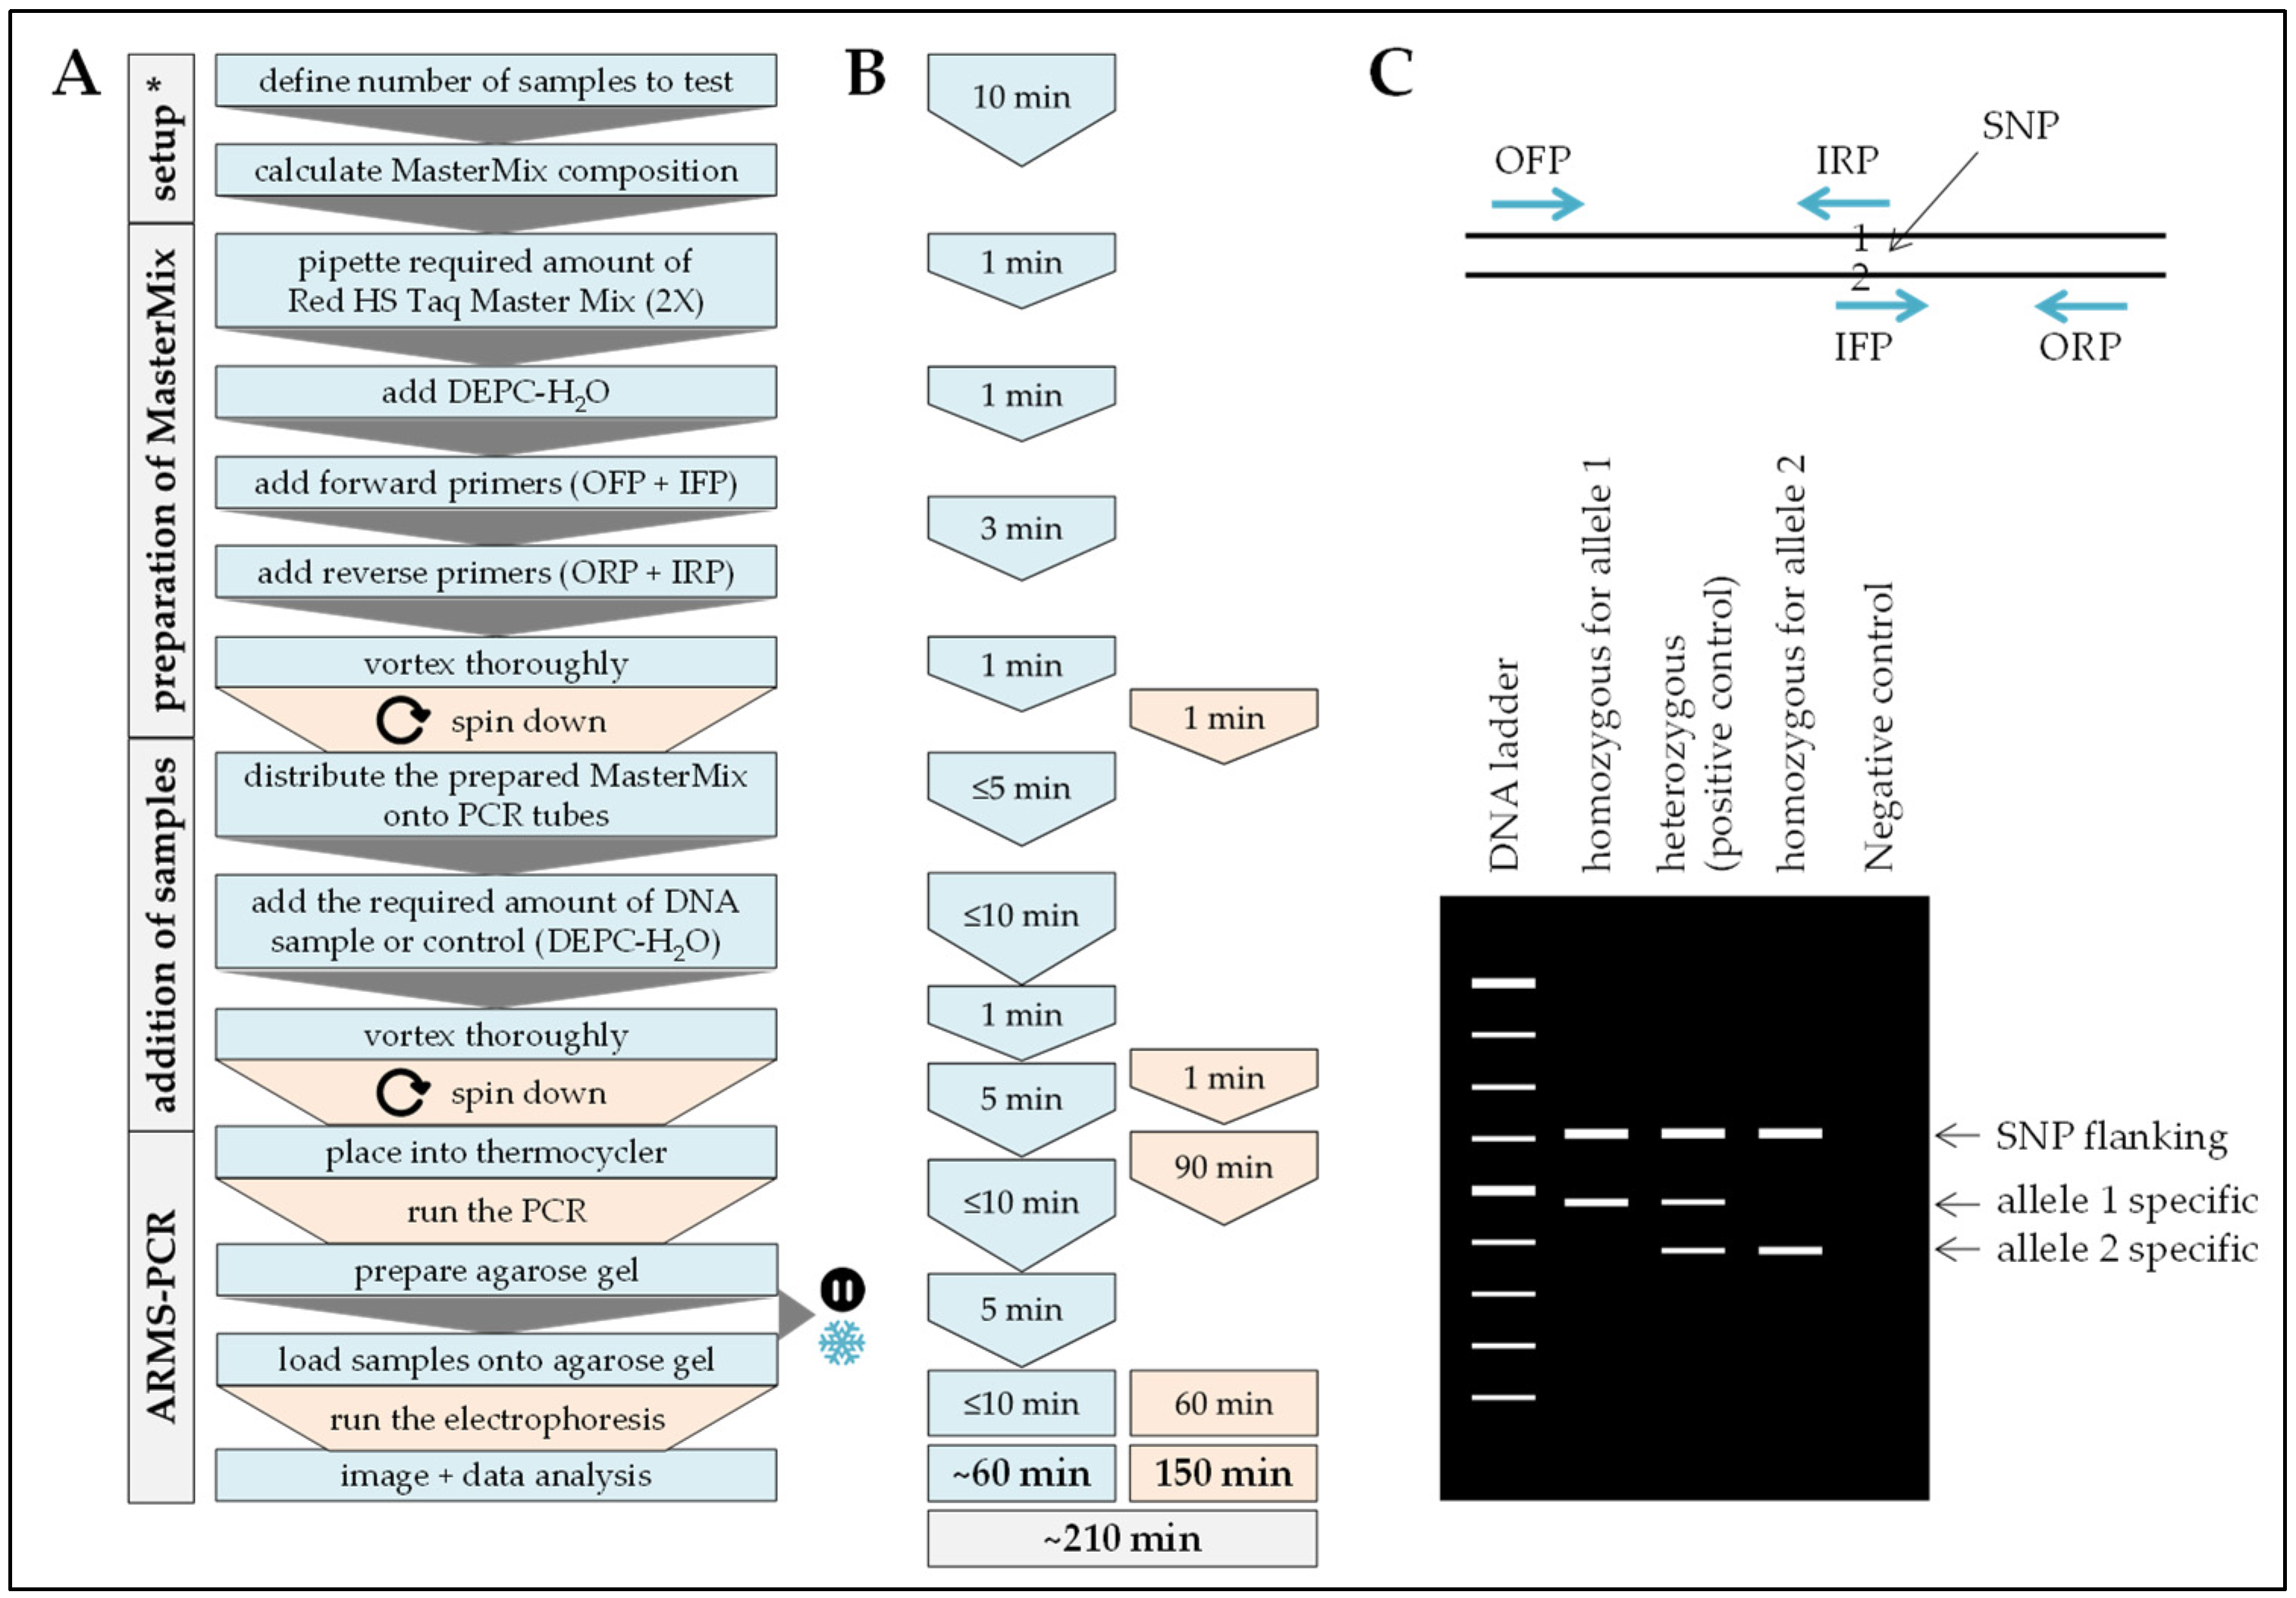
2.6. ARMS-PCR
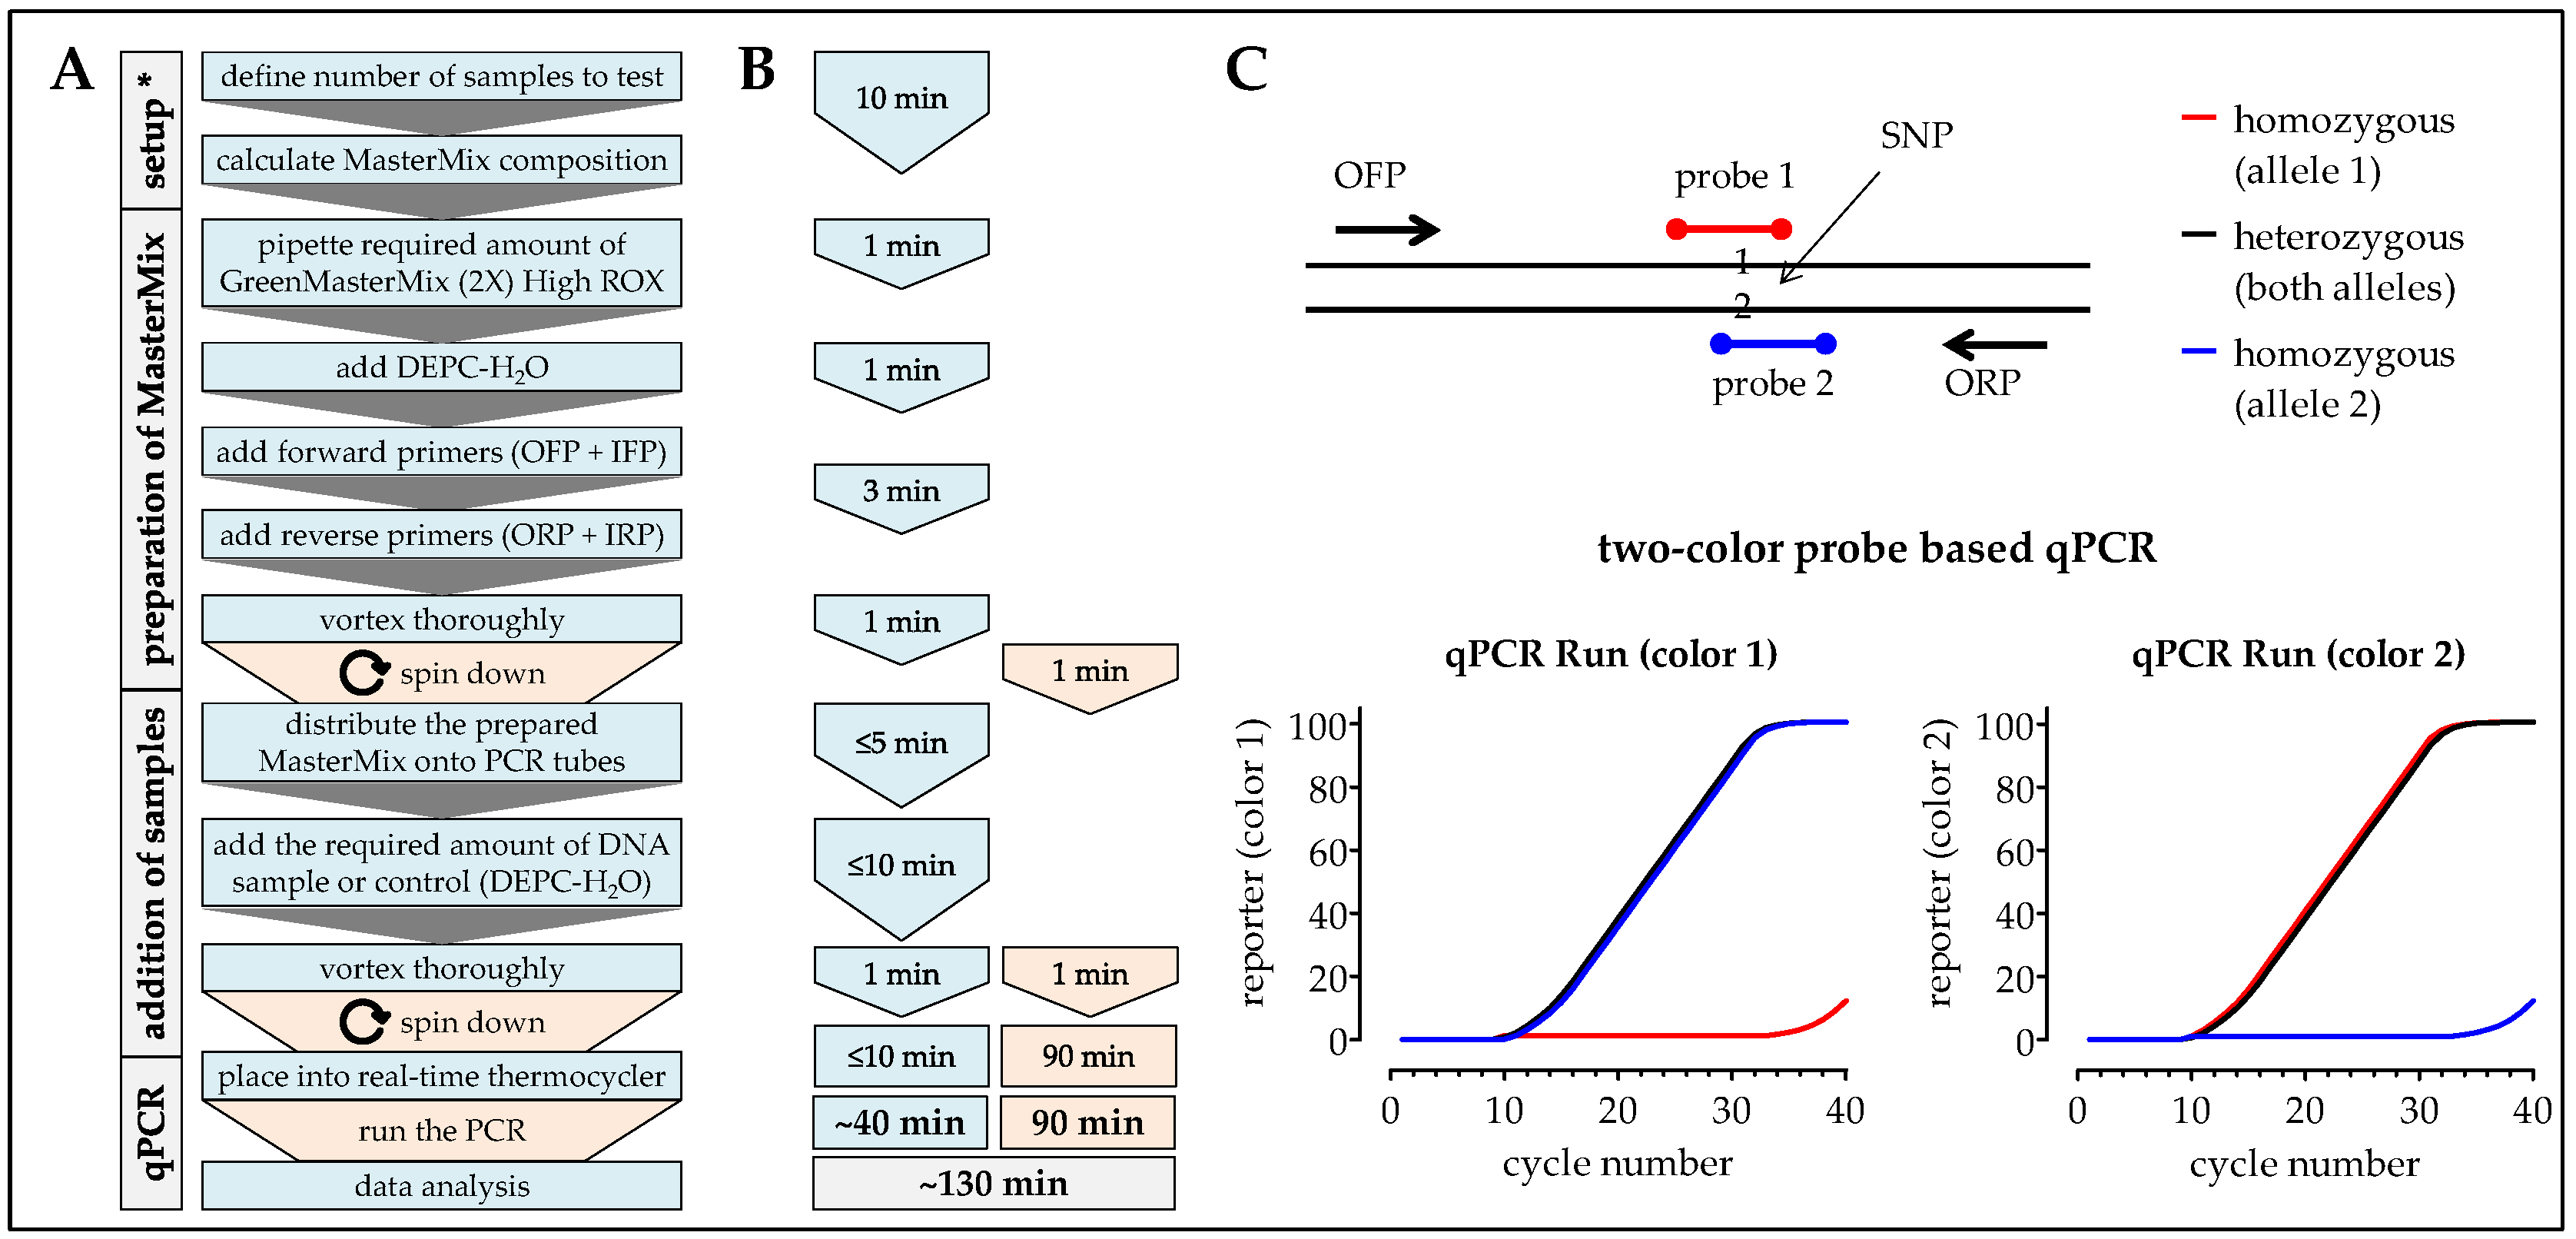
2.7. One-Step ARMS-PCR
3. Results
3.1. Comparison of the Different Methods Regarding Timing, Handling, and Costs
3.2. Interpretation of the Results with the Four Different Methods
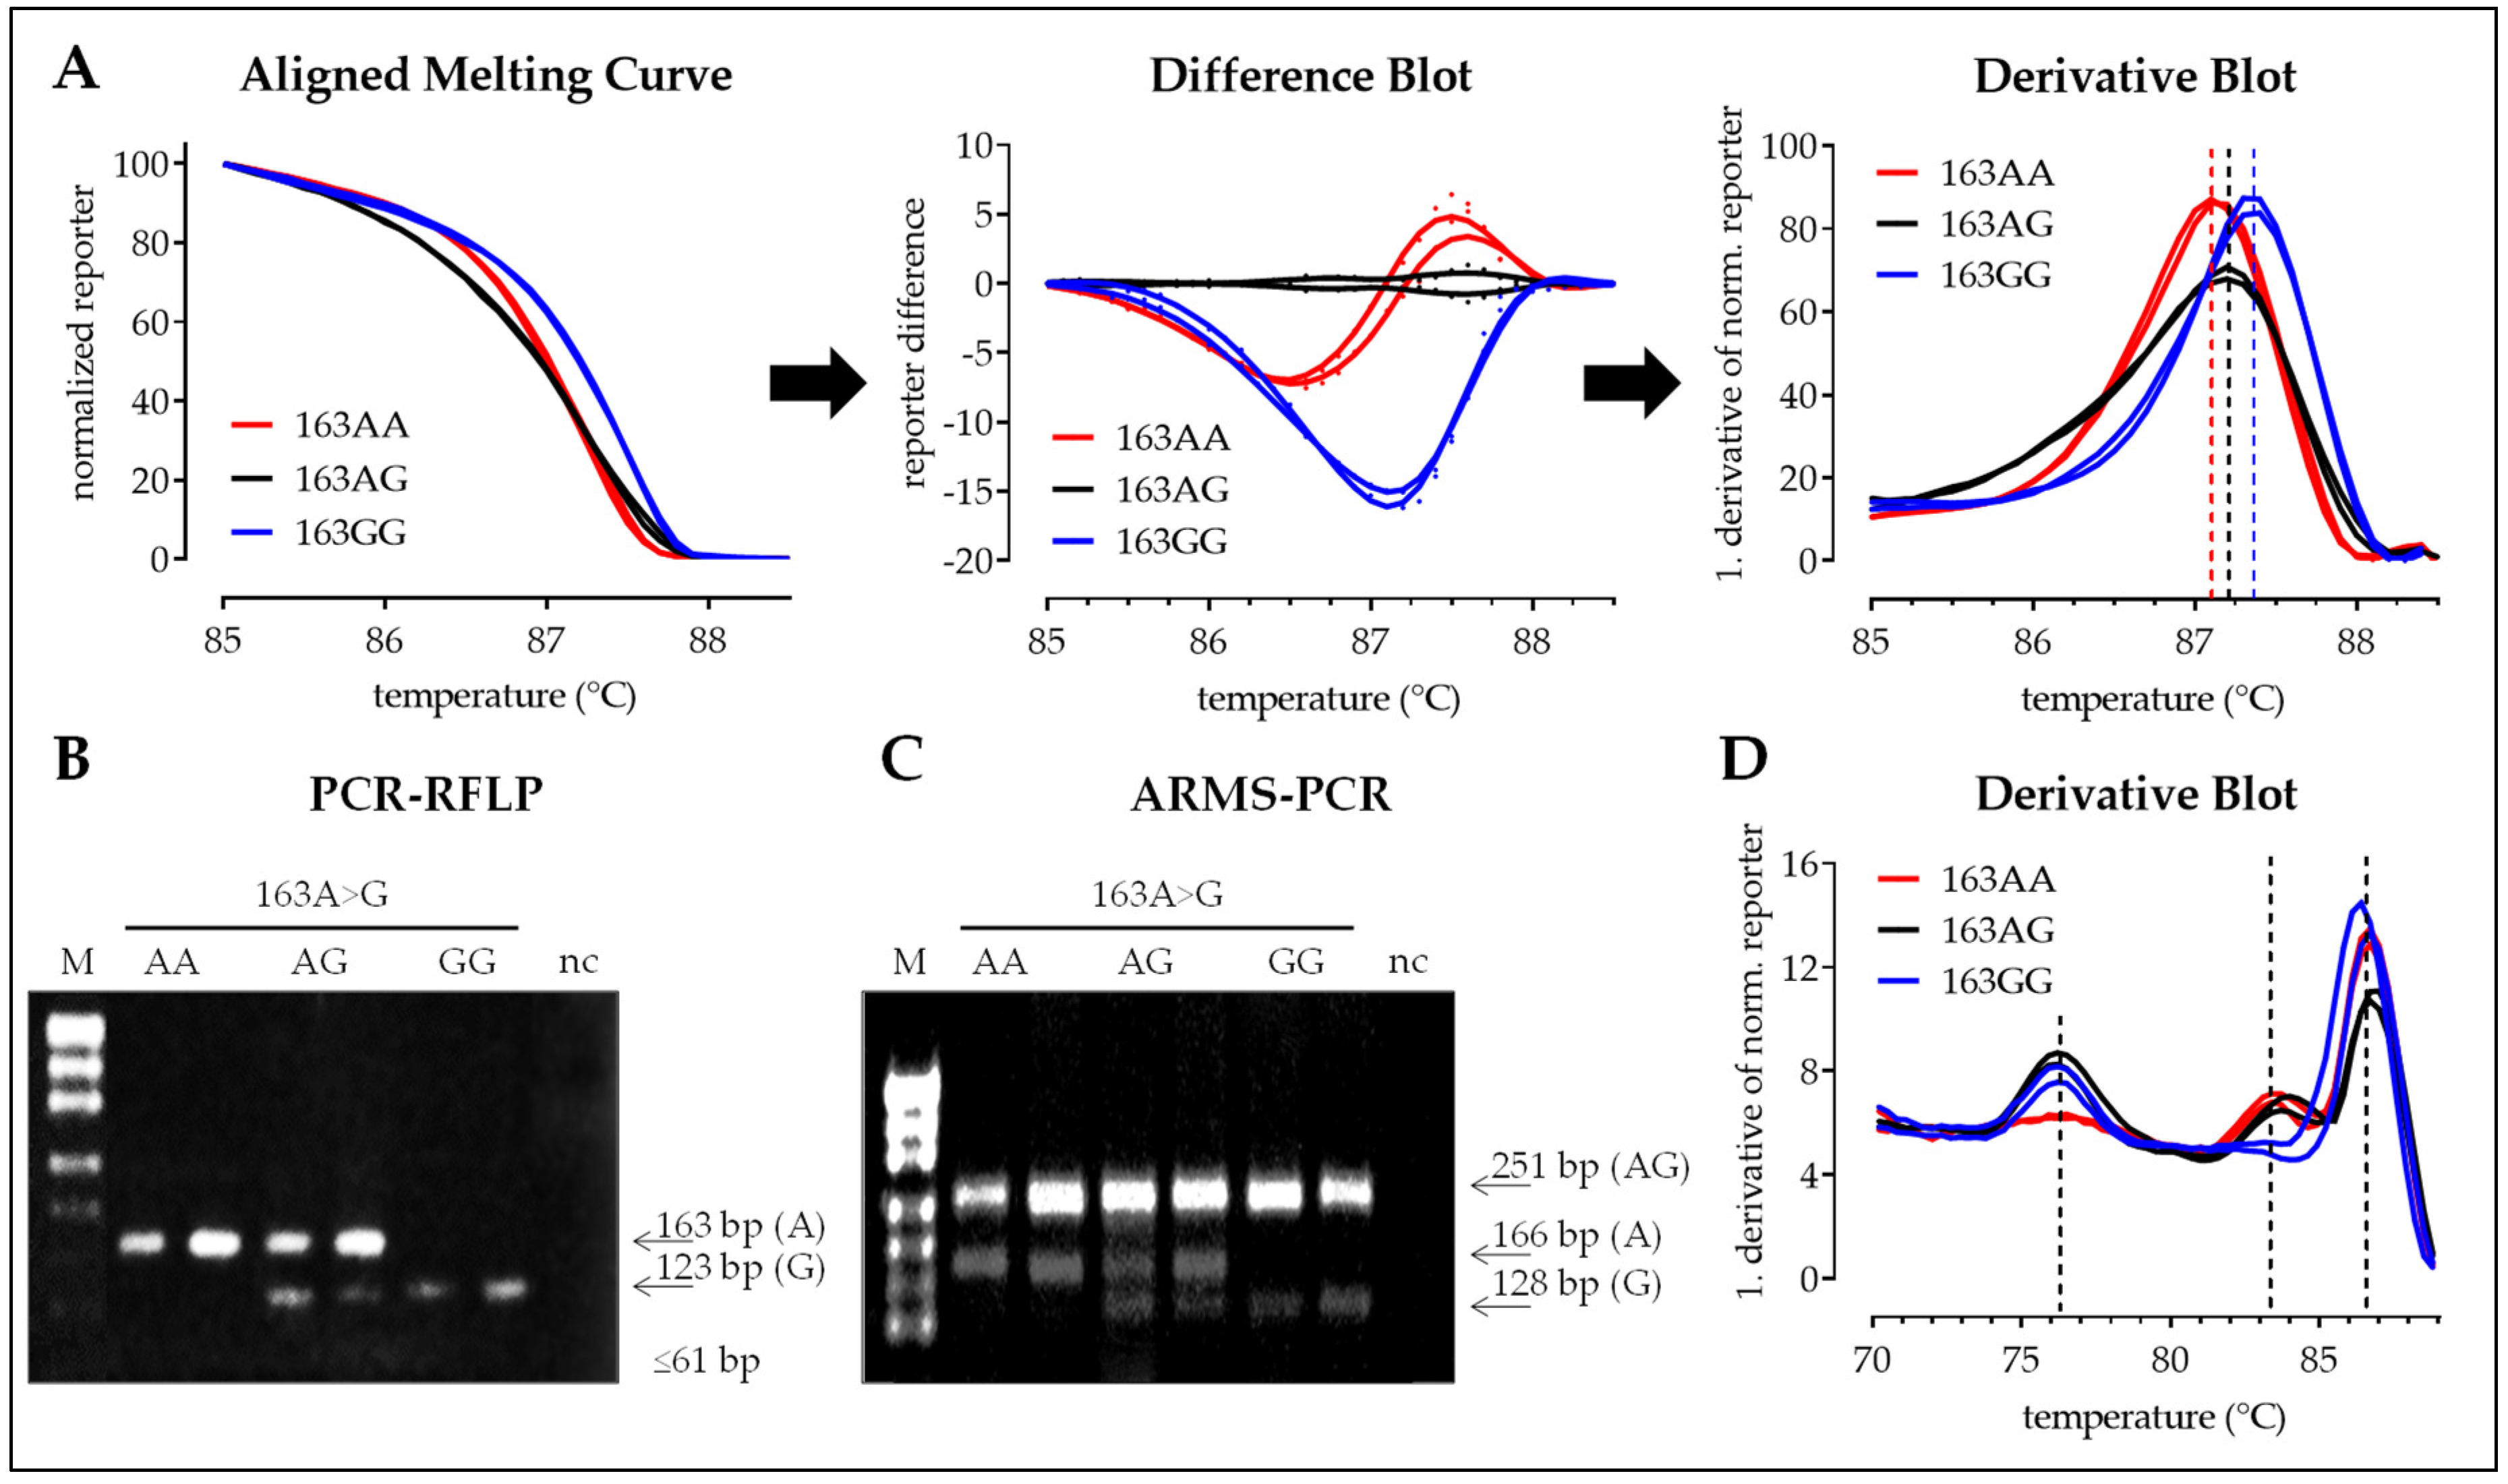
3.2.1. SNP 163A>G
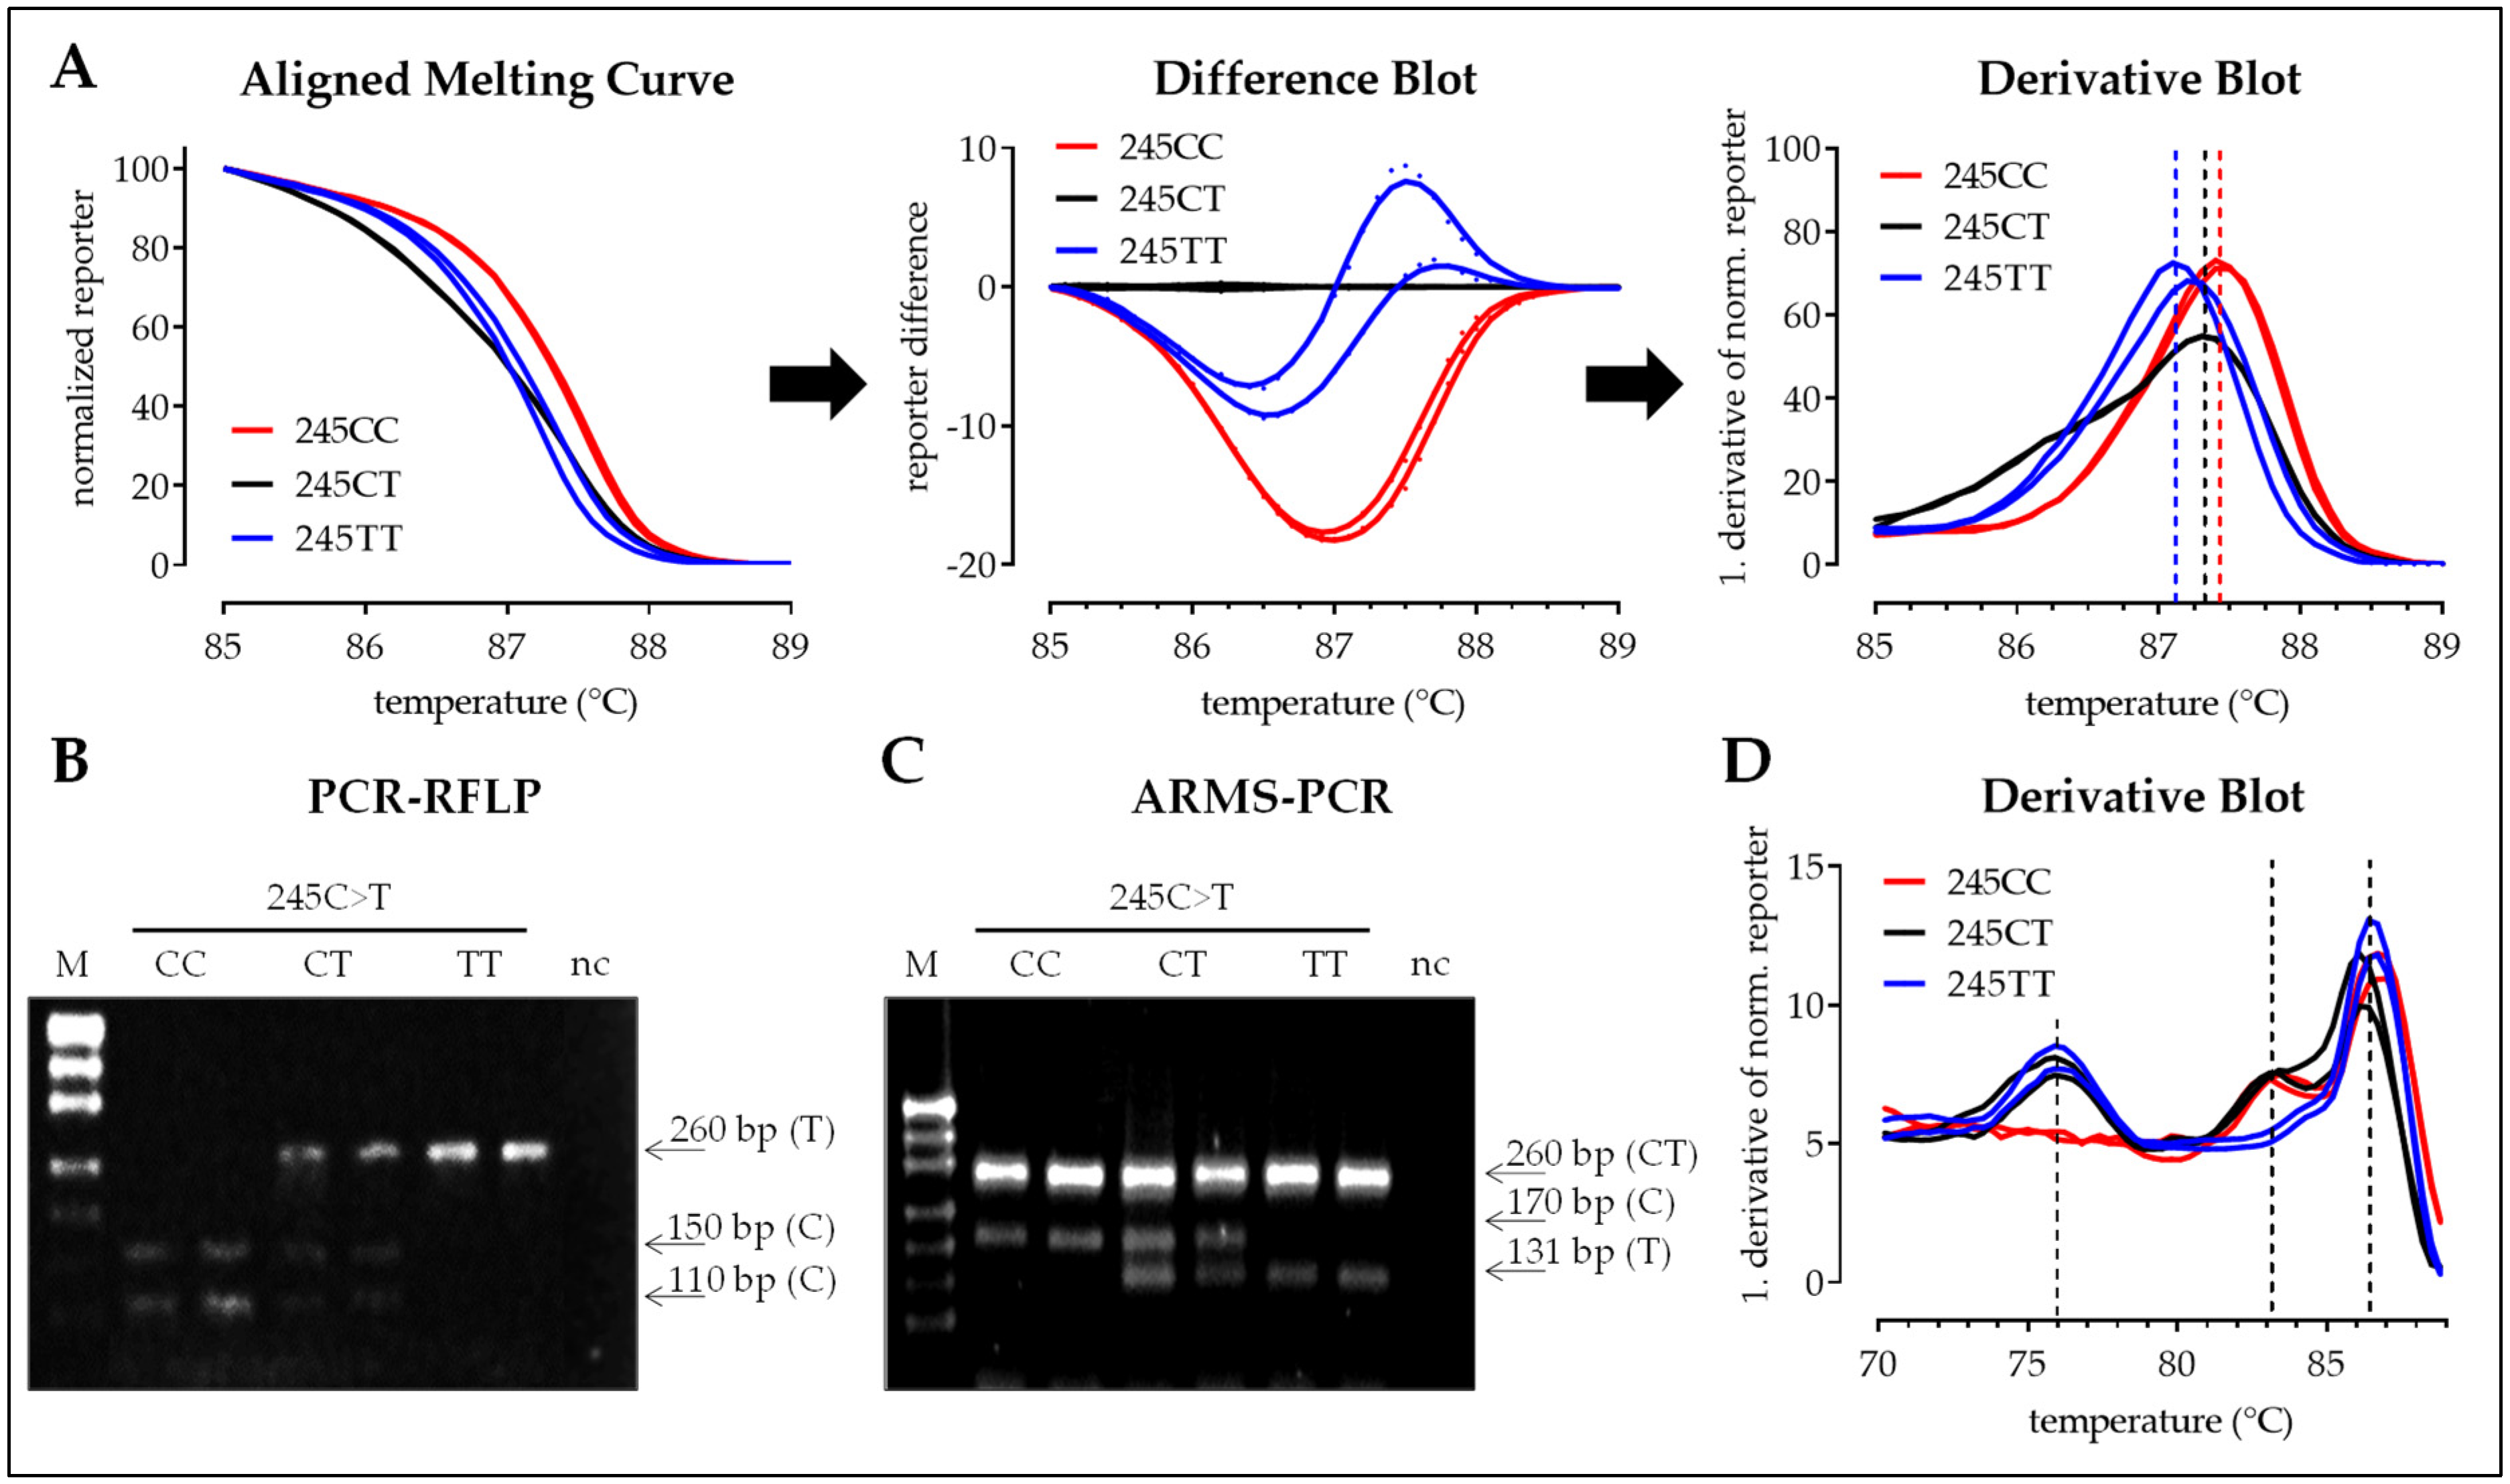
3.2.2. SNP 245C>T
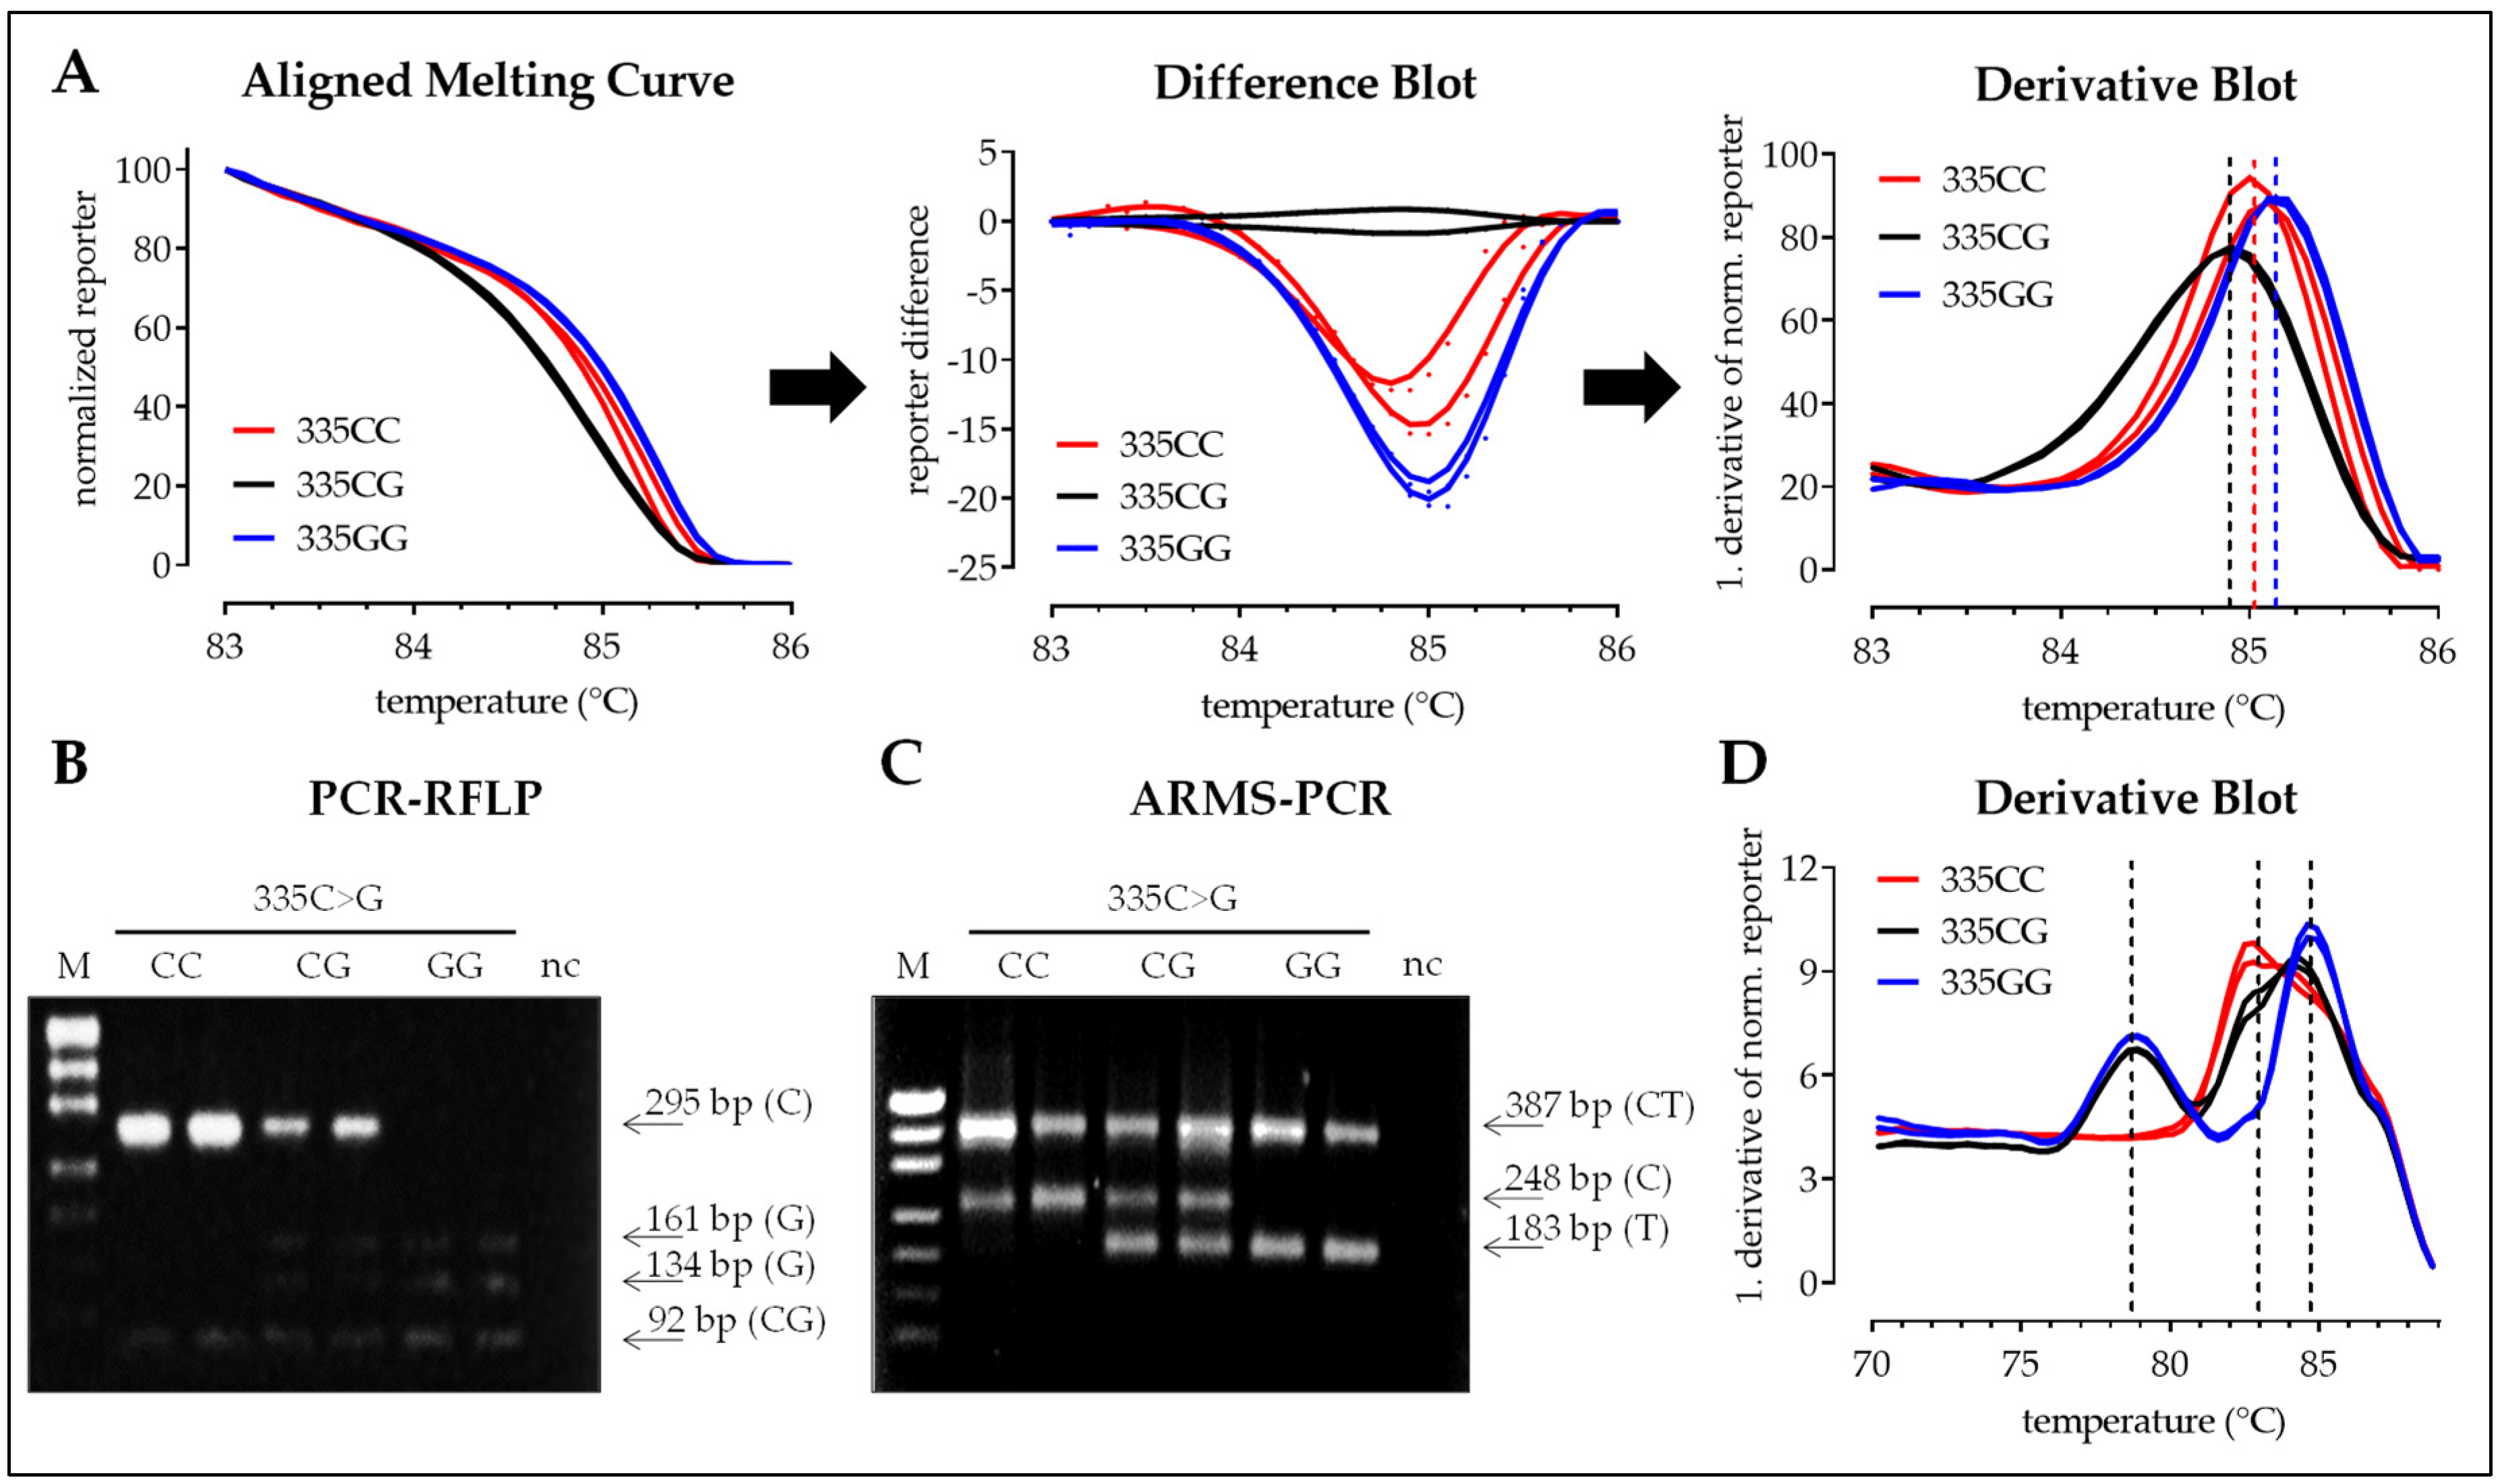
3.2.3. SNP 335C>G
3.3. SNP Distribution Within the Samples
4. Discussion
5. Conclusions
Supplementary Materials
Author Contributions
Funding
Acknowledgments
Conflicts of Interest
References
- Fuhrmann, J.; Thompson, P.R. Protein arginine methylation and citrullination in epigenetic regulation. ACS Chem. Biol. 2016, 11, 654–668. [Google Scholar] [CrossRef] [PubMed]
- Fuhrmann, J.; Clancy, K.W.; Thompson, P.R. Chemical biology of protein arginine modifications in epigenetic regulation. Chem. Rev. 2015, 115, 5413–5461. [Google Scholar] [CrossRef] [PubMed]
- Slade, D.J.; Subramanian, V.; Fuhrmann, J.; Thompson, P.R. Chemical and biological methods to detect post-translational modifications of arginine. Biopolymers 2014, 101, 133–143. [Google Scholar] [CrossRef] [PubMed]
- Bicker, K.L.; Thompson, P.R. The protein arginine deiminases: Structure, function, inhibition, and disease. Biopolymers 2013, 99, 155–163. [Google Scholar] [CrossRef] [PubMed]
- Wang, S.; Wang, Y. Peptidylarginine deiminases in citrullination, gene regulation, health and pathogenesis. Biochim. Biophys. Acta 2013, 1829, 1126–1135. [Google Scholar] [CrossRef] [PubMed] [Green Version]
- Gyorgy, B.; Toth, E.; Tarcsa, E.; Falus, A.; Buzas, E.I. Citrullination: A posttranslational modification in health and disease. Int. J. Biochem. Cell Biol. 2006, 38, 1662–1677. [Google Scholar] [CrossRef] [PubMed]
- Mondal, S.; Thompson, P.R. Protein arginine deiminases (pads): Biochemistry and chemical biology of protein citrullination. Acc. Chem. Res. 2019, 52, 818–832. [Google Scholar] [CrossRef] [PubMed]
- Anzilotti, C.; Pratesi, F.; Tommasi, C.; Migliorini, P. Peptidylarginine deiminase 4 and citrullination in health and disease. Autoimmun. Rev. 2010, 9, 158–160. [Google Scholar] [CrossRef] [PubMed]
- Horikoshi, N.; Tachiwana, H.; Saito, K.; Osakabe, A.; Sato, M.; Yamada, M.; Akashi, S.; Nishimura, Y.; Kagawa, W.; Kurumizaka, H. Structural and biochemical analyses of the human pad4 variant encoded by a functional haplotype gene. Acta Crystallogr. D Biol. Crystallogr. 2011, 67, 112–118. [Google Scholar] [CrossRef] [PubMed]
- Suzuki, A.; Yamada, R.; Chang, X.; Tokuhiro, S.; Sawada, T.; Suzuki, M.; Nagasaki, M.; Nakayama-Hamada, M.; Kawaida, R.; Ono, M.; et al. Functional haplotypes of padi4, encoding citrullinating enzyme peptidylarginine deiminase 4, are associated with rheumatoid arthritis. Nat. Genet. 2003, 34, 395–402. [Google Scholar] [CrossRef]
- Galmozzi, E.; Del Menico, B.; Rametta, R.; Dongiovanni, P.; Fracanzani, A.L.; Benedan, L.; Borroni, V.; Maggioni, P.; Fargion, S.; Valenti, L. A tetra-primer amplification refractory mutation system polymerase chain reaction for the evaluation of rs12979860 il28b genotype. J. Viral Hepat. 2011, 18, 628–630. [Google Scholar] [CrossRef] [PubMed]
- Fateh, A.; Aghasadeghi, M.; Siadat, S.D.; Vaziri, F.; Sadeghi, F.; Fateh, R.; Keyvani, H.; Tasbiti, A.H.; Yari, S.; Ataei-Pirkooh, A.; et al. Comparison of three different methods for detection of il28 rs12979860 polymorphisms as a predictor of treatment outcome in patients with hepatitis c virus. Osong. Public Health Res. Perspect. 2016, 7, 83–89. [Google Scholar] [CrossRef] [PubMed]
- Ye, S.; Dhillon, S.; Ke, X.; Collins, A.R.; Day, I.N. An efficient procedure for genotyping single nucleotide polymorphisms. Nucleic Acids Res. 2001, 29, E88. [Google Scholar] [CrossRef]
- Vossen, R.H.; Aten, E.; Roos, A.; den Dunnen, J.T. High-resolution melting analysis (hrma): More than just sequence variant screening. Hum. Mutat. 2009, 30, 860–866. [Google Scholar] [CrossRef] [PubMed]
- Zhang, R.; Zhu, Z.; Zhu, H.; Nguyen, T.; Yao, F.; Xia, K.; Liang, D.; Liu, C. Snp cutter: A comprehensive tool for snp pcr-rflp assay design. Nucleic Acids Res. 2005, 33, W489–W492. [Google Scholar] [CrossRef] [PubMed]
- Medrano, R.F.; de Oliveira, C.A. Guidelines for the tetra-primer arms-pcr technique development. Mol. Biotechnol. 2014, 56, 599–608. [Google Scholar] [CrossRef] [PubMed]
- Wang, H.; Lou, D.; Wang, Z. Crosstalk of genetic variants, allele-specific DNA methylation, and environmental factors for complex disease risk. Front. Genet. 2018, 9, 695. [Google Scholar] [CrossRef]
- Ota, M.; Asamura, H.; Oki, T.; Sada, M. Restriction enzyme analysis of pcr products. Methods Mol. Biol. 2009, 578, 405–414. [Google Scholar]
- Mesrian Tanha, H.; Mojtabavi Naeini, M.; Rahgozar, S.; Rasa, S.M.; Vallian, S. Modified tetra-primer arms pcr as a single-nucleotide polymorphism genotyping tool. Genet. Test. Mol. Biomark. 2015, 19, 156–161. [Google Scholar] [CrossRef]
- Heid, C.A.; Stevens, J.; Livak, K.J.; Williams, P.M. Real time quantitative pcr. Genome Res. 1996, 6, 986–994. [Google Scholar] [CrossRef]
- Holland, P.M.; Abramson, R.D.; Watson, R.; Gelfand, D.H. Detection of specific polymerase chain reaction product by utilizing the 5’-3’ exonuclease activity of thermus aquaticus DNA polymerase. Proc. Natl. Acad. Sci. USA 1991, 88, 7276–7280. [Google Scholar] [CrossRef] [PubMed]
- Khripin, Y. High-throughput genotyping with energy transfer-labeled primers. Methods Mol. Biol. 2006, 335, 215–240. [Google Scholar] [PubMed]
- Myakishev, M.V.; Khripin, Y.; Hu, S.; Hamer, D.H. High-throughput snp genotyping by allele-specific pcr with universal energy-transfer-labeled primers. Genome Res. 2001, 11, 163–169. [Google Scholar] [CrossRef] [PubMed]
 Procedure can be stopped at this step.
  Store samples at −20 °C/prevents repetitive freeze and thaw cycles.
Procedure can be stopped at this step. Store samples at −20 °C/prevents repetitive freeze and thaw cycles.
Store samples at −20 °C/prevents repetitive freeze and thaw cycles.
Procedure can be stopped at this step. Store samples at −20 °C/prevents repetitive freeze and thaw cycles.
 Procedure can be stopped at this step. Store samples at −20 °C/prevent repetitive freeze and thaw cycles.
Procedure can be stopped at this step. Store samples at −20 °C/prevent repetitive freeze and thaw cycles.
Procedure can be stopped at this step. Store samples at −20 °C/prevent repetitive freeze and thaw cycles. Procedure can be stopped at this step. Store samples at −20 °C/prevents repetitive freeze and thaw cycles.
Procedure can be stopped at this step. Store samples at −20 °C/prevents repetitive freeze and thaw cycles.
Procedure can be stopped at this step. Store samples at −20 °C/prevents repetitive freeze and thaw cycles.

| SNP 163 | SNP 245 | SNP 335 | |
|---|---|---|---|
| Reference | rs11203366 | rs11203367 | rs874881 |
| bp change | A > G (missense) | C > T (missense) | C > G (missense) |
| MAF (Ensembl) | 47.5% (G) | 46.7% (T) | 47.8% (G) |
| Amino acid mutation | Gly55Ser | Val82Ala | Gly112Ala |
| SNP | Primer | Primer Sequence (5′—3′) | Amplicons | Primer Location | ||
|---|---|---|---|---|---|---|
| Flanking | Allele Specific | |||||
| Length (bp) | Length (bp) | Specificity | ||||
| 163A>G | IFP | GTCGTGGATATTGCCCCCG | - | } 128 | G-allele |  |
| ORP | TCTGGTCGCCTGTGCTACCA | } 251 | ||||
| OFP | TGCTGGGAGAGCCATGGC | } 166 | A-allele | |||
| IRP | GGATTTCTTCTTGGCTGGAGGTCT | - | ||||
| 245C>T | IFP | GGTGACCCTGACGATGAACGT | - | } 131 | T-allele | |
| ORP | GTGGATCACGGCAGGACAGA | } 260 | ||||
| OFP | CTGCCCCTGAGGACTGCAC | } 170 | C-allele | |||
| IRP | GCCTGTGCTACCACTGGACG | - | ||||
| 335C>G | IFP | CAAAGCTCTACTCTACCTCACGGG | - | } 183 | G-allele | |
| ORP | ACTCCCAGATGTCTGACTGGCT | } 387 | ||||
| OFP | GCTTTCCCTCCATTCCCATC | } 248 | C-allele | |||
| IRP | TGGTTGTCACTTACCCAGCG | - | ||||
| SNP | 163A > G | 245C > T | 335C > G |
|---|---|---|---|
| Genomic DNA | 150 ng | 50 ng | 100 ng |
| OFP | 1 pmol | 1 pmol | 1 pmol |
| ORP | 1.5 pmol | 1 pmol | 1 pmol |
| IFP | 4 pmol | 5 pmol | 1 pmol |
| IRP | 2 pmol | 2.5 pmol | 2 pmol |
| Ta | 66 °C | 65 °C | 62 °C |
| DNA Isolation | HRM-PCR | PCR-RFLP | ARMS-PCR | One-Step ARMS-PCR | |
|---|---|---|---|---|---|
| Handling time (min) | 20 | 90 | 120 | 60 | 40 |
| Pause time (min) | 25 | 330 | 245–540 | 150 | 180 |
| Total time (min) | 45 | 420 | 365–660 | 210 | 220 |
| Material costs (€) | 1.81 | 31.45 | >120 | 14.51 | 31.49 |
| Personnel * costs (€) | 10 | 45 | 60 | 30 | 20 |
| Total costs (€) | 11.81 | 76.45 | >180 | 44.51 | 51.49 |
| Accuracy ° (%) | - | 76.7 | 100 | 100 | 93.3 |
© 2019 by the authors. Licensee MDPI, Basel, Switzerland. This article is an open access article distributed under the terms and conditions of the Creative Commons Attribution (CC BY) license (http://creativecommons.org/licenses/by/4.0/).
Share and Cite
Ehnert, S.; Linnemann, C.; Braun, B.; Botsch, J.; Leibiger, K.; Hemmann, P.; Nussler, A.K. One-Step ARMS-PCR for the Detection of SNPs—Using the Example of the PADI4 Gene. Methods Protoc. 2019, 2, 63. https://doi.org/10.3390/mps2030063
Ehnert S, Linnemann C, Braun B, Botsch J, Leibiger K, Hemmann P, Nussler AK. One-Step ARMS-PCR for the Detection of SNPs—Using the Example of the PADI4 Gene. Methods and Protocols. 2019; 2(3):63. https://doi.org/10.3390/mps2030063
Chicago/Turabian StyleEhnert, Sabrina, Caren Linnemann, Bianca Braun, Josephine Botsch, Karolin Leibiger, Philipp Hemmann, and Andreas K. Nussler. 2019. "One-Step ARMS-PCR for the Detection of SNPs—Using the Example of the PADI4 Gene" Methods and Protocols 2, no. 3: 63. https://doi.org/10.3390/mps2030063