Abstract
This study aims to investigate a set of electrocardiogram (ECG) electrode lead locations to improve the quality of four-lead ECG signals acquired during magnetic resonance imaging (MRI). This was achieved by identifying electrode placements that minimized the amount of induced magnetohydrodynamic voltages (VMHD) in the ECG signals. Reducing VMHD can improve the accuracy of QRS complex detection in ECG as well as heartbeat synchronization between MRI and ECG during the acquisition of cardiac cine. A vector model based on thoracic geometry was developed to predict induced VMHD and to optimize four-lead ECG electrode placement for the purposes of improved MRI gating. Four human subjects were recruited for vector model establishment (Group 1), and five human subjects were recruited for validation of VMHD reduction in the proposed four-lead ECG (Group 2). The vector model was established using 12-lead ECG data recorded from Group 1 of four healthy subjects at 3 Tesla, and a gradient descent optimization routine was utilized to predict optimal four-lead ECG placement based on VMHD vector alignment. The optimized four-lead ECG was then validated in Group 2 of five healthy subjects by comparing the standard and proposed lead placements. A 43.41% reduction in VMHD was observed in ECGs using the proposed electrode placement, and the QRS complex was preserved. A VMHD-minimized electrode placement for four-lead ECG gating was presented and shown to reduce induced magnetohydrodynamic (MHD) signals, potentially allowing for improved cardiac MRI physiological monitoring.
1. Introduction
The success of cardiovascular magnetic resonance imaging (MRI) depends largely on heartbeat synchronization between electrocardiograms (ECG) and MRI as well as the accuracy of real-time QRS complex detection in ECGs [1,2,3]. This presents a problem for MRI solutions since ECGs acquired during MRI are largely considered to be non-diagnostic [4].
The distortion of ECG signals is caused by the magnetohydrodynamic (MHD) effect, in which an induced voltage is overlaid onto ECG recordings, due to the interaction between the static magnetic field of the MRI (B0) and rapidly moving blood ejected into the aortic arch during early systole [2,5,6,7,8,9]. The resultant ECG signal distortion from these sources can lead to intermittent QRS complex detection and subsequent motion-based image artifacts, prolonged scan time, and may require repeat scans [10]. These issues are exacerbated at higher field strengths and with irregular or elevated heart rates.
Several approaches currently exist to achieve ECG acquisition for physiological monitoring. The predominant technique relies on the reduction of inter-electrode distances to 5–10 cm in four-lead ECGs, thereby decreasing induced noise levels by decreasing electrode distance from the synthesized Wilson Central Terminal (WCT) [11]. Additional approaches exist to reduce magnetohydrodynamic voltages (VMHD) through software adaptive filtering and independent component analysis (ICA). However, these methodologies are computationally intensive and are difficult to realize in real time for the purposes of MRI scanner gating [10,12,13,14]. The presented work was inspired by a study conducted by Dimick et al. to optimize ECG electrode placement for cardiac MRI gating by selecting electrode placements that were less susceptible to VMHD because the electrical path of VMHD was obscured by the left lobe of the lung [15].
In this study, we investigate four-lead ECG electrode placements to reduce the magnitude of induced VMHD obtained in intra-MRI ECG recordings. The derivation of the proposed electrode placements is intended to serve as a methodology to determine electrode placements that minimize VMHD. The methodology includes three central steps: (1) development of an MHD vector model; (2) four-lead ECG electrode position optimization; and (3) evaluation of the efficacy of VMHD reduction. Part of the work in this manuscript has been presented in the 19th Annual Society for Cardiovascular Magnetic Resonance Scientific Sessions in Los Angeles, CA, USA, 27–30th January 2016 [16].
2. Materials and Methods
Ethical approval of human trials was obtained from the University of Georgia Office of Research Institutional Review Board (IRB)—reference number MOD00003704. Informed consent to participate in the study and for publication of their individual details in this manuscript was obtained from all participants.
2.1. MHD-Vector Model
In order to accurately represent ECG reference planes in 3D space and predict measurements on the body surface, a thoracic geometric model was extracted from ECGSIM (StITPro, Nijmegan, the Netherlands), an open source simulation program designed to study the relationship between the heart’s electrical activity and resulting signals on the body surface [17,18]. An accurate model of the aortic arch was incorporated into the thoracic cavity based on simulations of the MHD effect taken from the literature [19,20]. Standardized locations for ECGs based on subject anthropometry [21,22] were used to select nodal locations on the thorax for the standard ECG electrode positions [23] (Table 1).

Table 1.
Standardized location of electrodes used during 12-lead electrocardiograph (ECG) recording.
The induced VMHD vector intra-MRI can be predicted using the cross-product of the magnetic field () and the direction of blood flow in the aortic arch (), across an electrode pair of separation distance L, assuming the primary contribution to is due to arch blood flow (Equation (1)) [8,24,25]. We will commonly reference the magnitude of this vector, VMHD, in this study.
The predicted VMHD vector was calculated based on an applied magnetic field in the +Z direction and the direction of flow in the aortic arch.
2.1.1. Human Subjects
Nine human subjects were recruited in this study and subjects were separated into Group 1 (four subjects) and Group 2 (five subjects). ECG recordings of Group 1 were used for MHD-vector model establishment (Section 2.1.3), and ECG recordings of Group 2 were used to validate VMHD reduction in ECG signals acquired with the proposed four-lead electrode placements (Section 2.3). All ECGs in this study were recorded at Emory University Hospital using a Nasiff CardioResting 12-lead ECG monitoring system (Central Square, NY, USA [26]) modified to be 3 Tesla (3T) MRI-compatible with a Siemens Trio TIM 3T scanner based on the method described in [10].
2.1.2. ECG Recordings for MHD-Vector Model Establishment
First, 12-lead ECG recordings were acquired for each subject in Group 1 during a 20 s breath-hold with the subject completely outside of the MRI scanner bore to register baseline physiological readings while avoiding the induction of motion and gradient artifacts into the ECG recordings. Next, the subject was positioned supine on the MRI scanner table and inserted head-first into the scanner bore. Finally, 12-lead ECG recordings were taken with the subject’s heart at the isocenter of the MRI scanner (3T). The purpose of the Group 1’s 12-lead ECG recording was to establish the MHD-vector model.
2.1.3. MHD-Vector Model Validation
The VMHD vector predicted in Section 2.1.1 was overlaid onto an anatomical reference plane to allow observation of the relationship between the predicted VMHD and mean electrical vectors recorded from ECG leads in Group 1.
The correlation coefficients between 12-lead ECG traces obtained inside (ECGreal + VMHD) and outside (ECGreal) the MRI bore were determined for each subject and averaged. The correlation coefficients followed the conventional definition where 1 represents perfect correlation and 0 represents no correlation. The mean inverse correlation coefficients were then calculated by subtracting the mean correlation coefficients from one. Therefore, the scale used for the inverse correlation coefficients ranged from 0 to 1, with 0 representing perfect correlation and 1 representing no correlation. When the signals matched (inverse correlation coefficient = 0), there was no VMHD present. When the signals did not match (inverse correlation coefficient = 1), there was maximum VMHD present. Thus, the inverse correlation coefficients represented the quantity of VMHD present in the ECG taken inside the MRI bore at each of the 12 leads.
The MHD-vector model was used to predict the VMHD vector. A vector model of the mean electrical vectors from 12-lead ECGs acquired from Group 1 was constructed and overlaid on the thoracic body model in MATLAB (Mathworks, Natick, MA, USA). This updated thoracic body model was used to calculate the angular displacement between the predicted VMHD vector and each of the 12 leads. The angular displacements represented the quantity of VMHD predicted to be present in each of the 12 ECG leads based on the MHD-vector model.
The mean inverse correlation coefficients and angular displacements calculated for each lead were plotted in the same graph to compare the trends of the actual and predicted VMHD. Spearman’s rank correlation coefficient was calculated between the inverse correlation coefficients and angular displacements for each of the 12 leads.
2.2. Electrode Position Optimization
To predict if unconventional electrode placements would be able to obtain ECGs with less induced VMHD, an optimization routine was implemented. The cost function was VMHD, and the input data were the electrode placement. Each point in the thorax geometry was taken and grouped into sets of four considering all possible combinations, and its alignment with respect to the heart and the induced MHD vector was measured. From the optimization routine, sets of electrode positions corresponding to maximum and minimum predicted induced VMHD were deduced. A line search method based on conjugate gradient descent was used to find the electrode set corresponding to a global minimum of the predicted VMHD [27]. This method was employed across the thorax.
2.3. Validation of VMHD Reduction
ECGs of each of the five subjects in Group 2 were recorded both outside the MRI bore during a 20 s breath hold and with the subject’s heart at the isocenter of the same MRI scanner used on Group 1 at 3T during a 20 s breath-hold using (i) the standard four-lead electrode placement for cardiac triggering in MRI for systems with a wireless triggering module [28], and (ii) the optimized VMHD-minimized electrode placement. QRS complexes were manually identified, time-stamped, and verified by a cardiologist to segment each cardiac cycle individually. Cardiac cycles were time-scaled to 60 beats per minute (bpm) as a baseline time scale for accurate and direct comparison [10,14,29,30].
The purpose of the Group 2’s ECG recording was to validate the MHD-vector model for isolation of MHD signals at certain positions of the ECG electrode placement in the human torso so as to enhance ECG gating during cardiac MR imaging. The ability of the proposed electrode positions to optimize induced VMHD for the purposes of cardiac synchronization was evaluated based on the percentage of MHD suppression in the P-wave, QRS complex, and S-T segment of the ECG recordings.
3. Results
3.1. MHD Vector Model
In Figure 1b, the addition of the extremity leads’ hexaxial reference plane onto the frontal plane illustrates qualitatively two major areas of vectorial alignment:
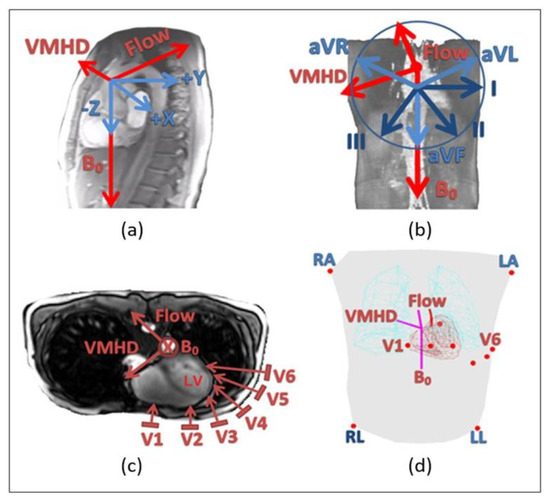
Figure 1.
Relationship of the magnetic resonance imaging (MHD) effect to the hexaxial reference plane established from 12-lead electrocardiogram (ECG) limb leads (I, II, III, aVL, aVR, aVF) and precordial leads (V1–V6). (a) Origination of the MHD effect in the heart (sagittal). (b) Relationship of the hexaxial reference plane to the MHD effect with respect to the WCT (coronal). (c) Relationship of the precordial reference plane to the MHD effect with respect to the WCT (transverse). (d) Three-dimensional representation of electrode positions (red) overlaid onto thorax geometry (gray) with the calculated MHD vector (maroon) dictated by the direction of the aortic arch (red).
- The superior to inferior alignment of aVF (shown as a light blue arrow pointing down) with the direction of the MRI magnetic field, B0 (shown as a red arrow), resulting in a predicted minimization of induced VMHD;
- The lateral alignment of aVL (shown as a light blue arrow pointing right) with the VMHD vector (shown as a red arrow pointing left), resulting in a predicted VMHD maxima. The remaining augmented lead (aVR, shown as a light blue arrow pointing left) and limb leads (I, II, and III, shown as dark blue arrows) are shown to be directed in an approximately 30° projection off the VMHD and B0 vectors, predicting a similar trend to that of lead I and aVF, respectively.
In Figure 1c, the mean electrical vectors of planar precordial lead signals are illustrated on a transverse thoracic slice. Progressing from lead V1 to V6, it can be observed that the signals approached parallel alignment with the predicted direction of induced VMHD.
Some representative ECGs acquired from Group 1 inside the MRI bore are plotted in Figure 2a. The thoracic body model used to calculate the angular displacements between the ECG leads and the predicted VMHD vector is displayed in Figure 2b. The inverse correlation coefficients and angular displacements for each lead are shown in Figure 2c to illustrate the relationship between trends in actual and predicted VMHD.
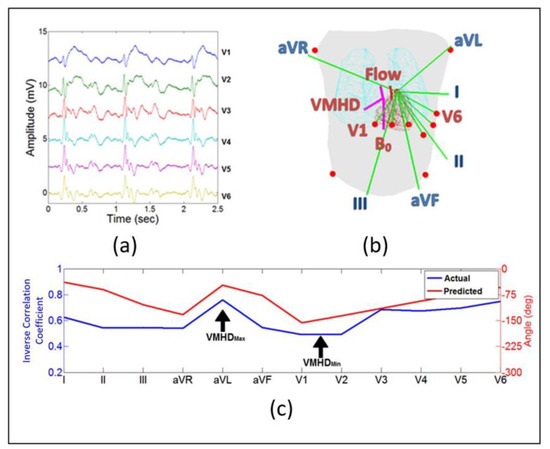
Figure 2.
Validation of the thoracic model to predict magnetohyrodynamic voltages (VMHD). Data are averaged from all subjects. (a) Representative ECGs (V1–V6) recorded inside the MRI bore (3T) from the study population used to validate the thoracic model as a predictor for induced VMHD. (b) Mapped electrical vectors (green) from 12-lead ECG in the thoracic body model. Vectors used to determine angular displacement between predicted VMHD vector and each lead. (c) The angular displacement between each lead and the predicted VMHD vector represents the quantity of VMHD predicted to be present in the lead (red line). The inverse correlation coefficients between ECGs acquired outside and inside the MRI bore represent the quantity of VMHD actually present in each lead (blue line). In the scale used for the inverse correlation coefficients, 0 represents perfect correlation between the two ECG signals and, thus, indicates no VMHD and 1 represents no correlation between the two signals and, thus, indicates maximum VMHD.
Through the evaluation of the inverse correlation coefficients in relationship to the angular displacements between the predicted VMHD vector and each electrode, a trend can be observed (Spearman’s rank correlation coefficient = 0.80). A peak in induced VMHD was observed at aVL due to its close parallel alignment to VMHD, and a gradual increase in VMHD was detected as the precordial electrode placements shifted laterally around the chest (V4–V6). Among the 12 leads, limb leads I and II and precordial leads V1 and V2 yielded the least amount of induced VMHD.
3.2. Electrode Position Optimization
As observed in the thoracic model, the VMHD-minimized locations had limited aorta visibility compared to standard positioning due to the left superior lung lobe (Figure 3a,b). Based on mapped ECG body surface potentials using ECGSIM, it was predicted that these locations would also correlate to QRS complexes with high amplitudes (Figure 3c). From the body surface maps obtained using ECGSIM [17], a less than 3% decrease in the signal amplitude of the Rpeak at the body surface was predicted for the VMHD-minimized four-lead electrode placement compared to the standard four-lead electrode placement.
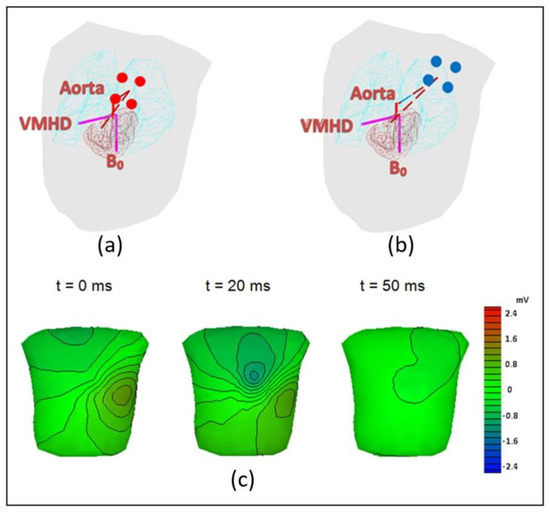
Figure 3.
Results of optimization routine for determining optimal electrode placement with respect to minimization of induced VMHD. (a) Standard electrode placement for ECG gating (red). Electrical vector from electrodes is nearly unobscured from heart and aorta by the lungs. (b) VMHD-minimized electrode placements (blue). Electrical vector is in view of heart but remains obscured from aorta by superior lobe of the lung. (c) Body surface maps of the R-wave amplitudes predicted by ECGSIM when taking ECG using the VMHD-minimized electrode placements, where t = 0 is the onset of the R peak.
3.3. Validation of VMHD Reduction
The ECGs of the subjects in Group 2 are displayed in Figure 4. Four-lead ECGs were acquired with the standard and VMHD-minimized electrode placements during 20 s breath-holds outside (Figure 4a) and inside (Figure 4b) the MRI bore.
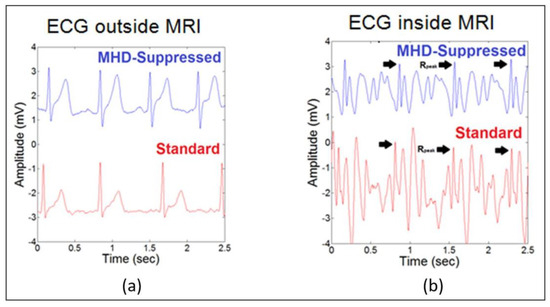
Figure 4.
ECG recordings using the standard and VMHD-minimized electrode placements illustrating a decrease in VMHD amplitude in the case of the VMHD-minimized placements. (a) Four-lead ECG recordings obtained outside the MRI bore with the standard and VMHD-minimized electrode locations (lead II). Rpeak in the VMHD-minimized case was found to have a <5% deviation from the standard placement. (b) Four-lead ECG recordings obtained inside the MRI bore with the standard and VMHD-minimized electrode locations (lead II). VMHD was reduced by 43.41% with the VMHD-minimized placement compared to the standard placement.
In ECGs acquired using the VMHD-minimized electrode placements, a 43.41% reduction in VMHD was observed, and the QRS complex was preserved. Table 2 outlines the level of MHD reduction in each ECG segment as demonstrated in each subject.
Table 2.
Evaluation of magnetohydrodynamic (MHD) reduction in each subject for QRS complex detection.
4. Discussion
Twelve-lead ECGs were processed in Group 1 (four healthy subjects) to establish an MHD-vector model based on thoracic geometry obtained from ECGSIM. Leads found to align with the predicted direction of the induced VMHD vector were shown to maintain the highest levels of VMHD. Similarly, induced VMHD was minimized as the angle between the electrode’s mean electrical vector and the predicted direction of induced VMHD increased. Among the 12-lead electrode placements, limb leads I and II and precordial leads V1 and V2 exhibited the least amount of induced VMHD, whereas the remaining leads showed increased signal magnitudes. Then an optimization routine was performed using the vector model to determine novel electrode positions for four-lead ECG that exhibited minimal induced VMHD.
The proposed VMHD-minimized electrode positions, illustrated in Figure 3b, were validated with ECG recordings acquired from five healthy subjects. A 43.41% reduction in VMHD was observed, so the quality of the ECG signal was improved. Additionally, the Rpeak amplitude was maintained since only a 3% decrease in amplitude was observed. These improvements may lead to improved capabilities for heartbeat synchronization between ECG and MRI as well as real-time QRS complex detection during MRI. Therefore, ECG would be able to yield improved cardiac monitoring during MRI scanning and interventional procedures without any additional hardware or software. This would be a significant development because intra-MRI ECG is currently considered to be non-diagnostic.
The method discussed in this paper focuses only on MHD suppression. The removal of gradient artifacts is not within the scope of this study. However, future studies should also consider the effects of fast switching gradient magnetic fields used during MRI on the ECG signal. Like the MHD effect, fast switching gradient magnetic fields cause interfering signals that are superimposed on the ECG signal [31,32]. Thus, many techniques have been developed to reduce the effects of these signals. For example, gradient artifacts can be reduced with algorithms based on adaptive filter techniques [33], Bayesian filters [34], and independent component analysis [35]. For a more thorough evaluation of the improvement in QRS detection provided by the presented method to reduce VMHD, the ECG recordings may need to be preprocessed to reduce the effects of gradient artifacts.
5. Limitations
As this method was only evaluated in a limited number of healthy subjects, its accuracy and precision must be verified in a larger population and in patients diagnosed with cardiac arrhythmias. The ECG recording time should also be increased so that a larger number of QRS complexes can be evaluated from each subject. Once the population size and recording time have been increased, it may be appropriate to calculate the sensitivity and specificity of QRS complex detection to evaluate the improvement of the ECGs obtained with the VMHD-minimized four-lead electrode placement compared to the standard four-lead electrode placement. Additionally, the effect of each subject’s breathing motion on the ECG should be taken into consideration because this movement can have a major impact on QRS detection. Similarly, the effect of the angle of the aorta on electrode positioning should be further examined as it may lead to the formation of subject-specific ECG recommendations.
6. Conclusions
A set of electrode placements to minimize VMHD in intra-MRI four-lead ECG was presented to further improve cardiac gating standards and then validated in subjects. Future research will include applying this method in a population of patients with different cardiac arrhythmias because abnormal ECGs may contain signatures which are different from healthy ECGs and, thus, difficult to isolate from the VMHD signal.
Author Contributions
Z.T.H.T. conceived and designed the experiments; T.S.G. performed the experiments, analyzed the data, and wrote the paper; J.N.O. contributed MRI scanning resources and analysis tools.
Funding
This study was supported in part by the National Institutes of Health (NIH) Bench-to-Bedside Award, the NIH Center for Interventional Oncology Grant, the National Science Foundation (NSF) I-Corps Team Grant (1617340), NSF REU site program 1359095, the AU-UGA inter-institutional Seed Funding Program, the American Society for Quality Dr. Richard J. Schlesinger Grant, the PHS Grant UL1TR000454 from the Clinical and Translational Science Awards Program of the NIH National Center for Advancing Translational Sciences, and the University of Georgia Clinical and Translational Research Unit Seed Grant.
Conflicts of Interest
The authors declare no conflict of interest. The founding sponsors had no role in the design of the study; in the collection, analyses, or interpretation of data; in the writing of the manuscript, or in the decision to publish the results.
References
- Larson, A.C.; White, R.D.; Laub, G.; McVeigh, E.R.; Li, D.; Simonetti, O.P. Self-gated cardiac cine MRI. Magn. Reson. Med. 2004, 51, 93–102. [Google Scholar] [CrossRef] [PubMed]
- Gregory, T.S.; Schmidt, E.J.; Zhang, S.H.; Tse, Z.T.H. 3DQRS: A method to obtain reliable QRS complex detection within high field MRI using 12-lead electrocardiogram traces. Magn. Reson. Med. 2014, 71, 1374–1380. [Google Scholar] [CrossRef] [PubMed]
- Fischer, S.E.; Wickline, S.A.; Lorenz, C.H. Novel real-time R-wave detection algorithm based on the vectorcardiogram for accurate gated magnetic resonance acquisitions. Magn. Reson. Med. 1999, 42, 361–370. [Google Scholar] [CrossRef]
- Birkholz, T.; Schmid, M.; Nimsky, C.; Schuttler, J.; Schmitz, B. ECG artifacts during intraoperative high-field MRI scanning. J. Neurosurg. Anesthesiol. 2004, 16, 271–276. [Google Scholar] [CrossRef] [PubMed]
- Blandford, R.; Thorne, K. Magnetohydrodynamics. In Applications of Classical Physics; CalTech: Pasadena, CA, USA, 2004. [Google Scholar]
- Jekie, M.; Dzwonczyk, R.; Ding, S.; Raman, V.; Simonetti, O. Quantitative evaluation of magnetohydrodynamic effects on the electrocardiogram. Proc. Intl. Soc. Mag. Reson. Med. 2009, 17, 3795. [Google Scholar]
- Kinouchi, Y.; Yamaguchi, H.; Tenforde, T.S. Theoretical analysis of magnetic field interactions with aortic blood flow. Bioelectromagnetics 1996, 17, 21–32. [Google Scholar] [CrossRef]
- Kyriakou, A.; Neufeld, E.; Szczerba, D.; Kainz, W.; Luechinger, R.; Kozerke, S.; McGregor, R.; Kuster, N. Patient-specific simulations and measurements of the magneto-hemodynamic effect in human primary vessels. Physiol. Meas. 2012, 33, 117–130. [Google Scholar] [CrossRef] [PubMed]
- Gregory, T.S.; Oshinski, J.; Schmidt, E.J.; Kwong, R.Y.; Stevenson, W.G.; Tse, Z.T.H. Continuous rapid quantification of stroke volume using magnetohydrodynamic voltages in 3T Magnetic Resonance Imaging. Circ. Cardiovasc. Imaging 2015, 8, e003282. [Google Scholar] [PubMed]
- Tse, Z.; Dumoulin, C.L.; Clifford, G.D.; Schweitzer, J.; Qin, L.; Oster, J.; Jerosch-Herold, M.; Kwong, R.Y.; Michaud, G.; Stevenson, W.G.; et al. A 1.5t MRI-conditional 12-lead electrocardiogram for MRI and intra-MR intervention. Magn. Reson. Med. 2014, 71, 1336–1347. [Google Scholar] [CrossRef] [PubMed]
- Niendorf, T.; Winter, L.; Frauenrath, T. Electrocardiogram in an MRI environment: Clinical needs, practical considerations, safety implications, technical solutions and future directions. In Advances in Electrocardiograms-Methods and Analysis; Millis, R.M., Ed.; InTech: London, UK, 2012; pp. 309–324. [Google Scholar]
- Krug, J.; Rose, G.; Clifford, G.; Oster, J. Improved ecg based gating in ultra high field cardiac MRI using an independent component analysis approach. J. Cardiovasc. Magn. Reson. 2013, 15, 33. [Google Scholar] [CrossRef]
- Krug, J.; Rose, G.; Stucht, D.; Clifford, G.; Oster, J. Filtering the magnetohydrodynamic effect from 12-lead ECG signals using independent component analysis. In Proceedings of the 2012 Computing in Cardiology, Krakow, Poland, 9–12 September 2012; pp. 589–592. [Google Scholar]
- Tse, Z.T.H.; Dumoulin, C.L.; Clifford, G.; Jerosch-Herold, M.; Kacher, D.; Kwong, R.; Stevenson, W.G.; Schmidt, E.J. Real-ECG extraction and stroke volume from MR-compatible 12-lead ECGs; testing during stress, in PVC and in AF patients. J. Cardiovasc. Magn. Reson. 2011, 13, P6. [Google Scholar] [CrossRef]
- Dimick, R.N.; Hedlund, L.W.; Herfkens, R.J.; Fram, E.K.; Utz, J. Optimizing electrocardiograph electrode placement for cardiac-gated magnetic resonance imaging. Investig. Radiol. 1987, 22, 17–22. [Google Scholar] [CrossRef]
- Gregory, T.S.; Oshinski, J.; Schmidt, E.J.; Tse, Z.T. ECG electrode placements for magnetohydrodynamic voltage suppression and improving cardiac gating in high-field MRI. J. Cardiovasc. Magn. Reson. 2016, 18, P328. [Google Scholar] [CrossRef]
- Oostendorp, T.F.; van Oosterom, A. Ecgsim: An interactive tool for the study of the relation between the electric activity of the heart and the qrst waveforms at the body surface. In Proceedings of the 26th Annual International Conference of the IEEE Engineering in Medicine and Biology Society (IEMBS’04), San Francisco, CA, USA, 1–5 September 2004; pp. 3559–3562. [Google Scholar]
- Van Oosterom, A.; Oostendorp, T. Ecgsim: An interactive tool for studying the genesis of QRST waveforms. Heart 2004, 90, 165–168. [Google Scholar] [CrossRef] [PubMed]
- Fujioka, H.; Tanishita, K. Computational fluid mechanics of the blood flow in an aortic vessel with realistic geometry. In Clinical Application of Computational Mechanics to the Cardiovascular System; Springer: Tokyo, Japan, 2000; pp. 99–117. [Google Scholar]
- Gupta, A.; Weeks, A.R.; Richie, S.M. Simulation of elevated T-waves of an ECG inside a static magnetic field (MRI). IEEE Trans. Biomed. Eng. 2008, 55, 1890–1896. [Google Scholar] [CrossRef] [PubMed]
- Frank, E. General theory of heart-vector projection. Circ. Res. 1954, 2, 258–270. [Google Scholar] [CrossRef] [PubMed]
- Grishman, A.; Scherlis, L.; Lasser, R.P. Spatial vectorcardiography. Am. J. Med. 1953, 14, 184–200. [Google Scholar] [CrossRef]
- Oster, J.; Llinares, R.; Payne, S.; Tse, Z.T.H.; Schmidt, E.J.; Clifford, G.D. Comparison of three artificial models of the magnetohydrodynamic effect on the electrocardiogram. Comput. Methods Biomech. Biomed. Eng. 2015, 18, 1400–1417. [Google Scholar] [CrossRef] [PubMed]
- Nijm, G.; Swiryn, S.; Larson, A.; Sahakian, A. Extraction of the magnetohydrodynamic blood flow potential from the surface electrocardiogram in magnetic resonance imaging. Med. Biol. Eng. Comput. 2008, 46, 729–733. [Google Scholar] [CrossRef] [PubMed]
- Buchenberg, W.B.; Mader, W.; Hoppe, G.; Lorenz, R.; Menza, M.; Büchert, M.; Timmer, J.; Jung, B. In vitro study to simulate the intracardiac magnetohydrodynamic effect. Magn. Reson. Med. 2014, 74, 850–857. [Google Scholar] [CrossRef] [PubMed]
- Nasiff Associates, Inc. Nasiff Cardiocard PC Based Resting ECG System. Available online: https://nasiff.com/resting.html (accessed on 28 June 2018).
- Nocedal, J.; Wright, S. Line search methods. In Numerical Optimization; Mikosch, T., Resnick, S., Robinson, S., Eds.; Springer Science: New York, NY, USA, 2006; Volume 2. [Google Scholar]
- De Kok, W. Tips for Cardiac Triggering in MRI. Available online: http://clinical.netforum.healthcare.philips.com/us_en/Operate/Application-Tips/MRI/Tips-for-cardiac-triggering-in-MRI (accessed on 28 June 2018).
- Gregory, T.S.; Schmidt, E.J.; Zhang, S.H.; Kwong, R.Y.; Stevenson, W.G.; Murrow, J.R.; Tse, Z.T.H. Left-ventricular mechanical activation and aortic-arch orientation recovered from magneto-hydrodynamic voltages observed in 12-lead ECGs obtained inside MRIs: A feasibility study. Ann. Biomed. Eng. 2014, 42, 2480–2489. [Google Scholar] [CrossRef] [PubMed]
- Tse, Z.; Dumoulin, C.; Clifford, G.; Jerosch-Herald, M.; Kacher, D.; Kwong, R.; Stevenson, W.; Schmidt, E. MRI-Compatible 12-lead ECGs with MHD separation: Application to cardiac MRI gating, physiological monitoring and noninvasive cardiac-output estimation. Proc. Intl. Soc. Mag. Reson. Med. 2010, 18, 286. [Google Scholar]
- Felblinger, J.; Slotboom, J.; Kreis, R.; Jung, B.; Boesch, C. Restoration of electrophysiological signals distorted by inductive effects of magnetic field gradients during MR sequences. J. Magn. Reson. Med. 1999, 41, 715–721. [Google Scholar] [CrossRef]
- Schmidt, M.; Krug, J.W.; Rose, G. Reducing of gradient induced artifacts on the ECG signal during MRI examinations using wilcoxon filter. Curr. Dir. Biomed. Eng. 2016, 2, 175–178. [Google Scholar] [CrossRef]
- Abi-Abdallah, D.; Drochon, A.; Robin, V.; Fokapu, O. Cardiac and respiratory MRI gating using combined wavelet sub-band decomposition and adaptive filtering. Ann. Biomed. Eng. 2007, 35, 733–743. [Google Scholar] [CrossRef] [PubMed]
- Oster, J.; Pietquin, O.; Kraemer, M.; Felblinger, J. Bayesian framework for artifact reduction on ECG in MRI. In Proceedings of the 2010 IEEE International Conference on Acoustics, Speech and Signal Processing, Dallas, TX, USA, 14–19 March 2010; pp. 489–492. [Google Scholar]
- Oster, J.; Pietquin, O.; Abacherli, R.; Kraemer, M.; Felblinger, J. Independent component analysis-Based artefact reduction: Application to the electrocardiogram for improved magnetic resonance imaging triggering. Physiol. Meas. 2009, 30, 1381–1397. [Google Scholar] [CrossRef] [PubMed]
© 2018 by the authors. Licensee MDPI, Basel, Switzerland. This article is an open access article distributed under the terms and conditions of the Creative Commons Attribution (CC BY) license (http://creativecommons.org/licenses/by/4.0/).