Article

Evaluation of 3D/2D Imaging and Image Processing Techniques for the Monitoring of Seed Imbibition

1
Laboratoire Angevin de Recherche en Ingénierie des Systèmes (LARIS), UMR INRA IRHS, Université d’Angers, 49035 Angers, France
2
Plateforme d’Ingénierie et Analyses Moléculaires (PIAM), Université d’Angers, 49035 Angers, France
3
GEVES, Station Nationale d’Essais de Semences (SNES), 49071 Beaucouzé CEDEX, France
4
MATEIS, UMR CNRS 5510, Université Lyon 1, INSA Lyon, 69100 Villeurbanne, France
*
Author to whom correspondence should be addressed.
J. Imaging 2018, 4(7), 83; https://doi.org/10.3390/jimaging4070083
Submission received: 18 May 2018 / Revised: 11 June 2018 / Accepted: 18 June 2018 / Published: 21 June 2018

Abstract

:
Seed imbibition is a very important process in plant biology by which, thanks to a simple water income, a dry seed may turn into a developing organism. In natural conditions, this process occurs in the soil, e.g., with difficult access for a direct observation. Monitoring the seed imbibition with non-invasive imaging techniques is therefore an important and possibly challenging task if one tries to perform it in natural conditions. In this report, we describe a set of four different imaging techniques that enable to addressing this task either in 3D or in 2D. For each technique, the following items are proposed. A detailed experimental protocol is provided to acquire images of the imbibition process. With the illustration of real data, the significance of the physical quantities measured in terms of their relation to the income of water in the seed is presented. Complete image analysis pipelines are then proposed to extract dynamic information on the imbibition process from such monitoring experiments. A final discussion compares the advantages and current limitations of each technique in addition to elements concerning the associated throughput and cost. These are criteria especially relevant in the field of plant phenotyping where large populations of plants are imaged to produce quantitatively significative traits after image processing.

1. Introduction

Over the last decade, many research works have been conducted in imaging techniques and computer vision applied to plant science. It has enabled the development of many technological solutions for plant phenotyping. Best imaging practices for given biological questions such as plant growth [1], plant architecture [2], pathogen detection [3,4] and plant physiology [5] are now identified and often presented under the form of review articles [6,7]. The new bottleneck for these questions is now moving in the direction of image processing in order to efficiently and automatically extract quantitative phenotypic traits from the acquired data [8]. In this perspective, emerging works exploit advanced machine learning techniques to automatically determine the best feature spaces enabling one to address given informational tasks [9]. However, these image processing approaches are especially efficient, in terms of computation time or learning dataset size, when applied to well-contrasted imaging. Most of the effort for determining the best imaging techniques providing well-contrasted images has so far been concentrated at the scales of young or adult plants. The very early stages, e.g., at the seed stage, are however also very interesting from a fundamental biological point of view since they strongly condition the further development of the plants [10,11]. In this article, considering the seed scale, we focus on the imbibition process in seeds [12,13].
Imbibition is a key process triggering the transition from an inert dry seed into a living plant [14]. Because this biological process occurs in the soil, the dynamics of imbibition and water distribution in seeds are however far from being completely elucidated, starting with the observation of their spatiotemporal evolutions. Nonetheless, the recent progress of plant imaging and associated image processing techniques gives access to new windows to monitor non-invasively the imbibition process of seeds in conditions related to what would occur in the soil. A few studies have reported observations of imbibing seeds for leading crop species [15,16,17].
In this article, we present and discuss four imaging techniques that can be relevant to monitoring the imbibition process of seeds, while mimicking natural conditions. In this context, we present the use of 3D X-ray imaging, 3D magnetic resonance imaging (MRI), 2D thermography and 2D biospeckle imaging techniques. We detail the principle of each of these four non-invasive imaging techniques and the experimental protocols we used for the monitoring of seed imbibition according to these techniques. We describe the associated image processing algorithms, based on standard tasks in image processing and specifically tested among acquired images, suitable to extract quantitative information of the imbibition. The four imaging techniques depicted here can have broad applicability to any seed, and we show the usability and ability of each technique to provide a significant contrast capable of qualitatively characterizing the seed imbibition. A small population of seeds of sugar beet and Medicago truncatula is selected for illustration. Besides, because of the many factors involved in the complex imbibition process, we do not aim here at systematic quantitative analyses. More specifically, Medicago truncatula seed is a model species commonly used in plant science with easily accessible genomic sequences. The sugar beet seed presents the specificity of having a cork shell surrounding the seed, which is an additional trait not always present in other species.

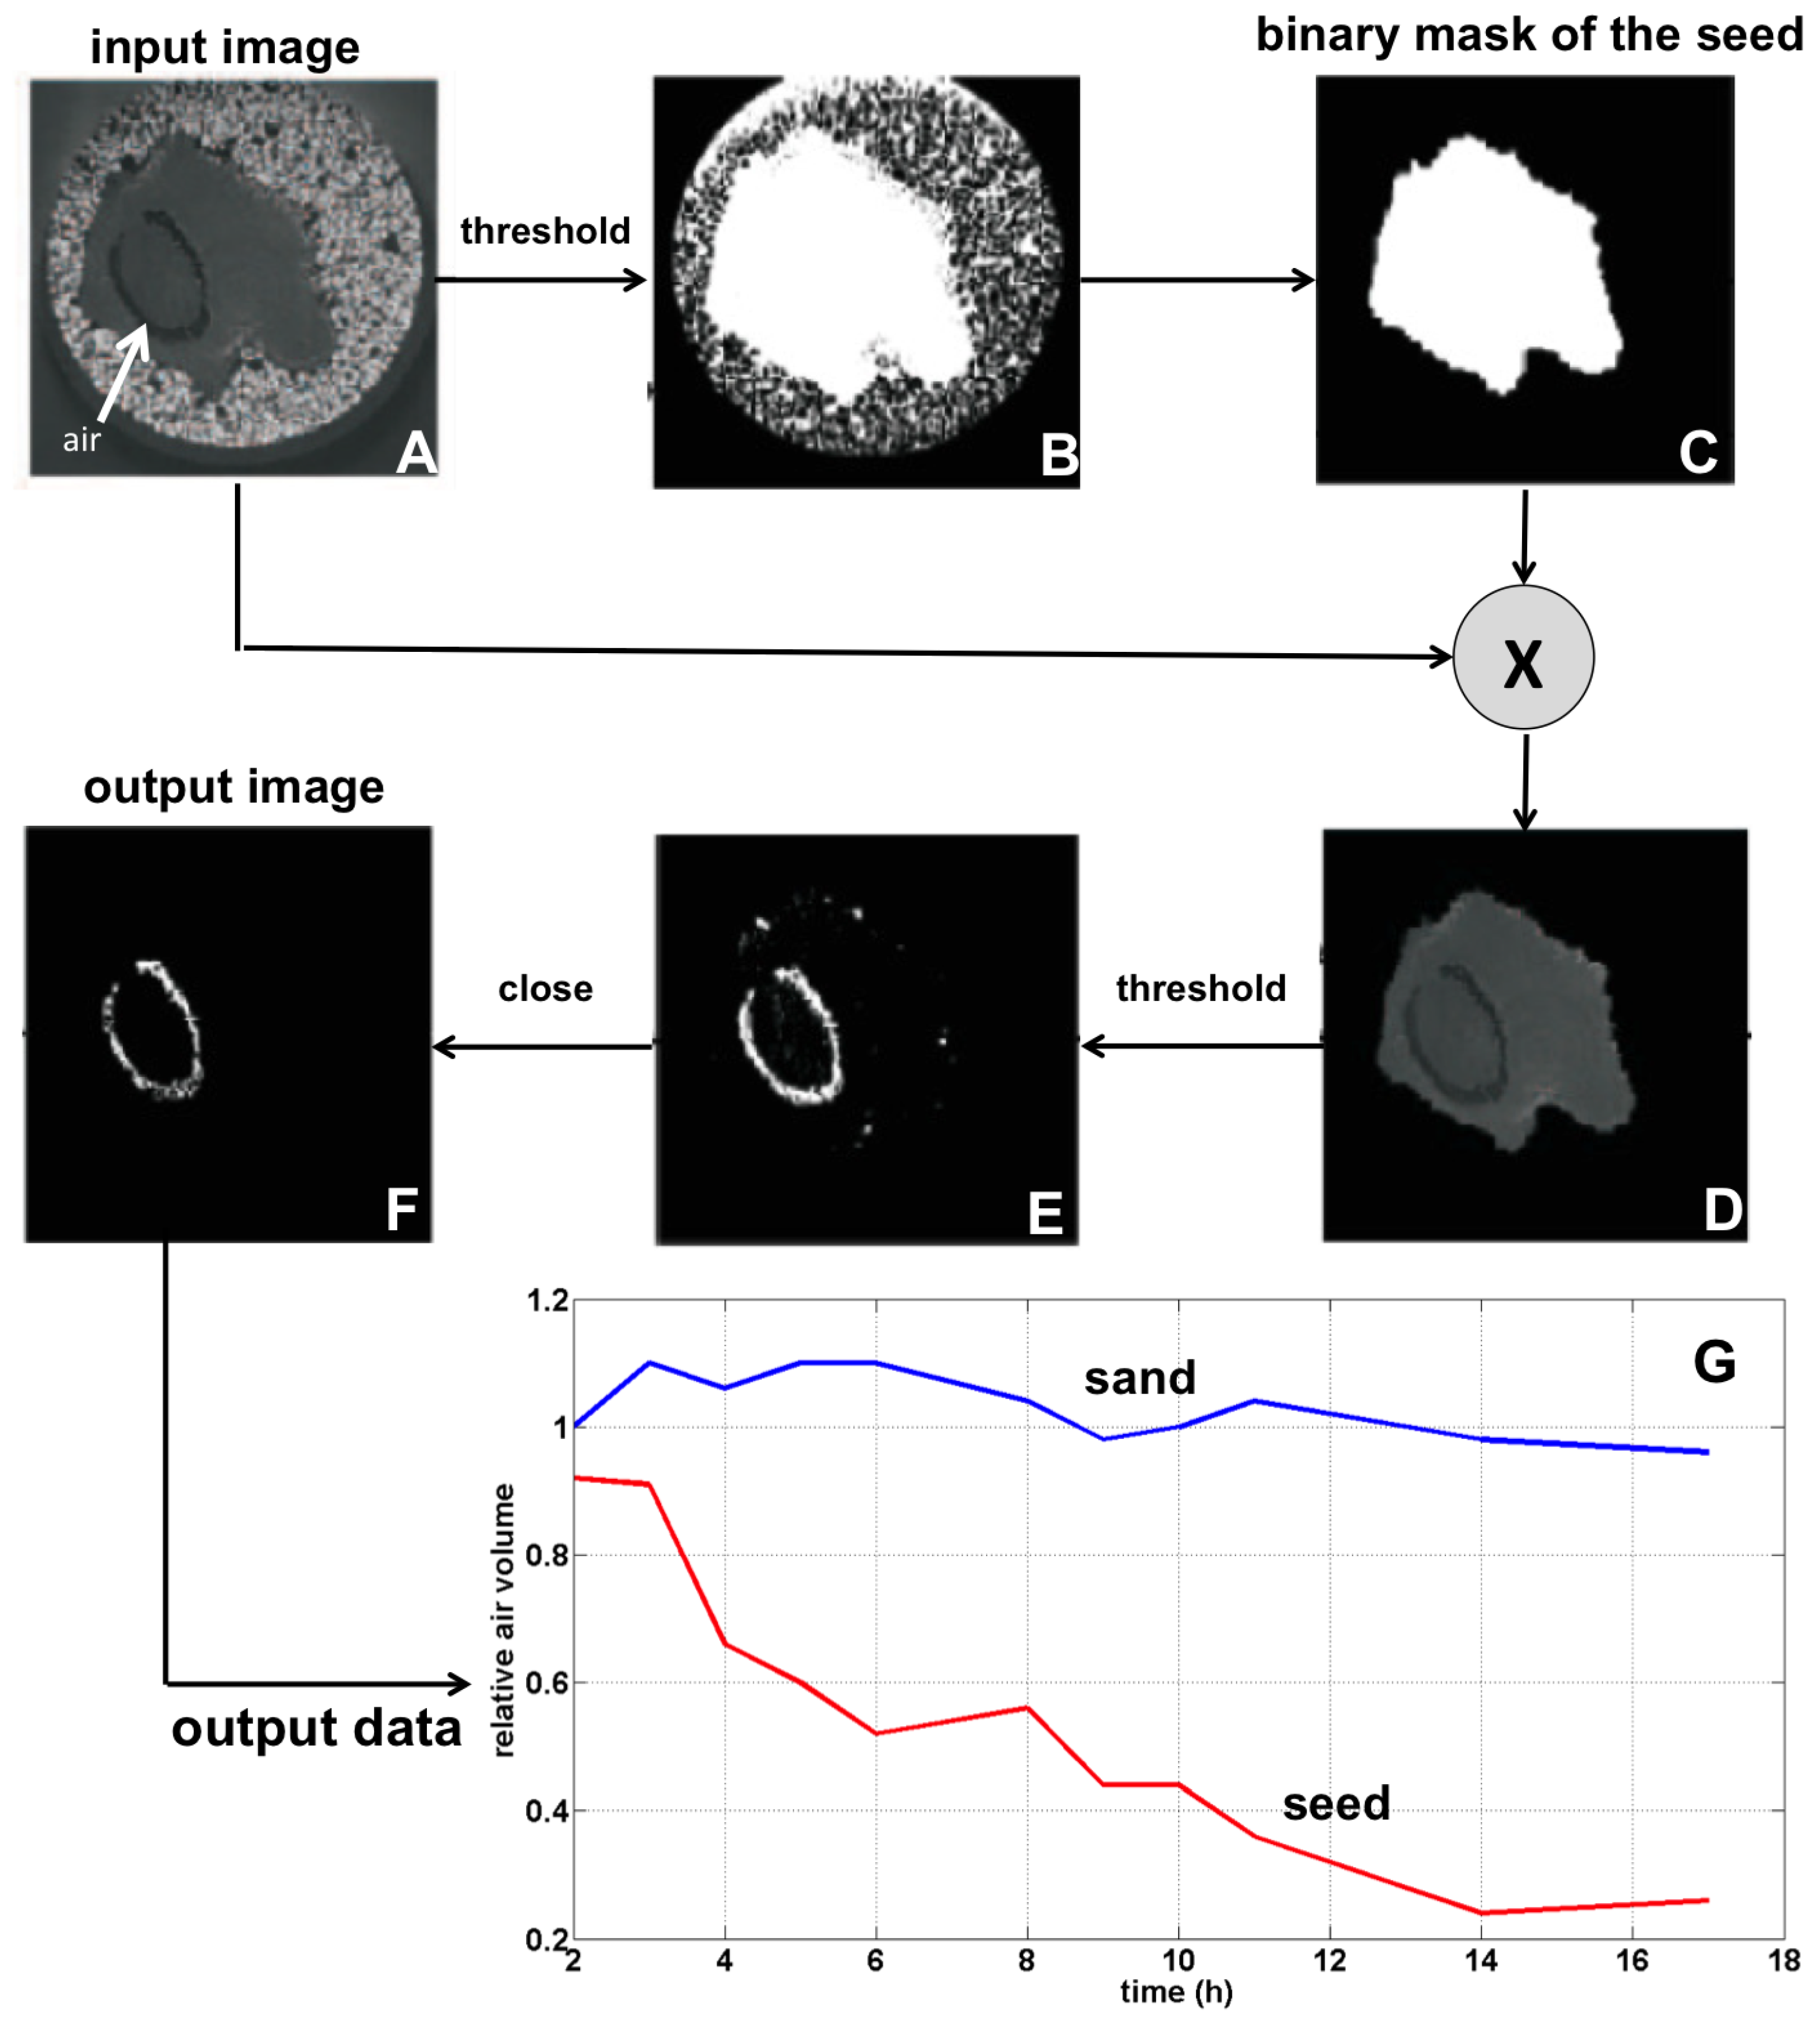
2. 3D X-Ray Imaging of Seed Imbibition in Soil Conditions

In X-ray imaging, the observed contrast is associated with the Beer–Lambert law in which two physical parameters come into play: the attenuation coefficient and thickness of the sample [18]. A strong contrast of attenuation differentiates between plant tissues, which absorb X-rays, and the air, which does not absorb X-rays. This situation is especially found in dry seeds. Consequently, X-ray radiography (2D) or tomography (3D) are widely used in dry seed phenotyping [10]. In this section, using classical absorption 3D X-ray tomography, we provide a protocol and an image processing pipeline to monitor and quantitatively characterize the evolution of the X-ray contrasts observed in an imbibing seed, from a dry state to an imbibed state. In this case, the water penetrating the seed both fills the volume of air by water and expands imbibed tissues. These two effects of the imbibition contribute to reducing the volume of air. Monitoring the evolution of the volume of air remaining in the seed can thus be correlated with the imbibition process.

2.1. Acquisition Protocol

The 3D X-ray imaging system is an NSI X5000 equipped with a micro-focus X-ray source operating with a voltage range of 10 kV–450 kV, using a tungsten transmission target with a 280-mA current. The geometric magnification is up to 3000×, for an overall maximum system resolution of 500 nm. The digital X-ray detector is a flat panel (DDA) with a detector size up to 10 cm × 10 cm. For this study, the system was operated with a 80-kV voltage. The number of projections was 900, and each radiograph was an average of three exposures of 333 ms each to reduce the noise. The voxel size was set at 30 μ m. The acquisition time was 20 min. A sugar beet seed was positioned in a tube of 1 cm in diameter with wet sand, sand being a homogeneous water carrier support for the seed. A scan without water was first realized. Water was introduced in the tube. Automatic acquisition was performed of a series of X-ray tomographic reconstructions over time on the seed. With X-ray tomography, only the contrast between air and tissues is present [19]. During the imbibition process, the volume of air is reduced and progressively shrinks to zero. This corresponds to a first step in the imbibition process, which occurs typically over 10 h in sugar beet seeds.

2.2. Image Processing Pipeline

The progress of the imbibition process is therefore accessible by the estimation of the volume of air remaining in the seed. Air regions in X-ray images will be identified by voxels with low gray-level intensities in images and correspond to regions between the embryo of the seed and the cork, as is visible in Figure 1A.
In order to automatically detect the voxels with low intensities identifying the air regions, we devised an image processing pipeline based on the segmentation methodology, applied to the 60 slices of the 3D X-ray image. As is visible in Figure 1B–F, where we show the process on one slice, e.g., 2D for an easier illustration, this is achieved in a two-step process realized by simple thresholdings automatically calculated according to the Otsu method [20]. A first threshold is applied to the image to separate the sand coded in high gray-level intensities from the seed coded in relatively low gray-level intensities (Figure 1B). This serves as a mask (Figure 1C), which is then applied to the original image (Figure 1D). A second threshold is then applied to separate the air in the seed coded in lower gray-level intensities than the rest of the seed coded in higher gray-level intensities (Figure 1E). A particle size filtering by morphological closing [21] is then applied to remove isolated tiny structures composed of less than three voxels (Figure 1F). Thus, the output image delivers pixels corresponding to air in the seed. Considering voxels by stacking all output images, these voxels can be counted to evaluate the air volume remaining in the seed. This can be repeated on images acquired on different dates across the imbibition process, so as to deliver the evolution over time of the remaining volume of air.

2.3. Illustration

The region with low gray-level intensities corresponding to air is gradually reduced to zero as the imbibition process progresses. This can either be due to the filling of air by water or the expansion of imbibed tissue. We found over multiple acquisitions that this process typically lasts less than 10 h for sugar beet. The imaging approach makes it possible to obtain a characterization of the cork envelop surrounding the sugar beet seed and of its impact on water dynamics during imbibition. Other species where this cork envelop surrounding the seed is less bulky or non-existent could benefit from a similar characterization of the impact of the envelop on water dynamics during imbibition. The result of applying the segmentation algorithm is shown in the output data of Figure 1G, where we clearly see the volume of air progressively shrinking to zero, whereas the volume of air in the sand surrounding the seed is relatively constant.

2.4. Interests and Limitations

An essential interest of X-ray tomographic imaging at imbibition monitoring in seeds is that it makes possible non-invasive observations of internal air dynamics in 3D with a very high spatial resolution. A limitation is that the contrast between imbibed tissue and dry tissue is almost null. In principle, the estimation of the imbibed part and the dry part could be better contrasted with the use of contrast agents, from solutions with metallic ions, such as those used in the biomedical domain for angiography [22,23]. While using such a solution, one should pay attention to its viscosity and its concentration. A too high viscosity will simply prevent the contrast agent from penetrating deeply into the seed. A too high concentration could prevent the seed from normal development, while a too low concentration would fail to enhance the contrast.

3. 3D Magnetic Resonance Imaging of Seed Imbibition in Soil Conditions

Magnetic Resonance Imaging (MRI) as a non-invasive 3D imaging modality is very well suited to the observation of internal structures of biological samples. Accordingly, it is widely applied in medical imaging. Comparatively, MRI is much less developed for plant science, and in this direction, MRI presents great potentiality still open for exploration [24]. In the present study, we address an original application of MRI in plant science, for the monitoring of the spatiotemporal dynamics of water in imbibing seeds. A few studies have reported MRI observations of imbibing seeds for leading crop species [15,16,25]. We realize here an original application to seeds of sugar beet.

3.1. Acquisition Protocol

MRI experiments were performed using a Bruker Avance DRX 300 system (Bruker Biospin SA, Wissembourg, France) equipped with a vertical super wide-bore magnet operating at 7 T, a 10-mm inner diameter gradient set capable of 2000-mT/m maximum gradient strength and a 10 mm-diameter saddle resonator. High resolution MR imaging was performed on a 10-mm glass tube filled with two sugar beet seeds in wet sand. Wet sand provides the dual benefits of keeping the seed in a wet environment while facilitating image segmentation. A 3D spoiled gradient-echo sequence was used with TR/TE = 100/3 ms, a flip angle of 20 , an isotropic field of view of 1 cm, a matrix of 128 × 128 × 64 and eight averages, affording a spatial resolution of 0.078 × 0.078 × 0.156 mm 3 . Imaging of water uptake in seed during the imbibition process required both high spatial resolution to visualize water penetration pathways and speed to characterize the dynamics of water uptake. The gradient echo sequence offers a good compromise as a 3D isotropic high spatial resolution image with a good signal-to-noise ratio can be obtained in less than one hour using a combination of short TR and small flip angle. Automatic acquisition was performed of series of MRI images over time, on sugar beet seeds undergoing an imbibition process developing over typically three to four days, so that observed contrasts are related to water dynamics and the volume of all imbibed tissues in the seed. The acquisition duration was 55 min repeated over up to 100 h.

3.2. Image Processing Pipeline

Such series of acquired MRI images are then to be processed so as to segment and quantify the imbibed regions in the seeds. For this purpose, we devised an image segmentation methodology in order to automatically detect the voxels with high MRI intensities identifying the imbibed regions. It is especially important to obtain a segmentation in 3D, and not all 2D image segmentation methods extend conveniently to 3D. We chose for segmentation in 3D a thresholding of the MRI intensities exploited to drive a region-growing method with a 3D neighborhood, according to the pipeline of Figure 2 and operating as follows. However, for an easier illustration, we show the process on a 2D image.
The range of high MRI intensities identifying the imbibed regions is determined by an average threshold obtained by the Otsu method, simultaneously minimizing the intraclass intensity variance and maximizing the interclass variance over the two voxel populations (imbibed and non-imbibed) [21]. This determination of the threshold by the Otsu method is performed as a preliminary step, from a set of typical images where imbibition is known to be significantly advanced. As depicted in Figure 2A, based on such a threshold, each 3D image taken at any date of the imbibition process is then segmented through a region-growing procedure [21] extended in 3D. Initially, a voxel with high intensity above the threshold is searched in the image. When such a voxel is found, as shown in Figure 2B by a red circle, it is taken as an imbibed voxel to serve as a germ for the region growing procedure. Initially, the segmented region is restricted to this germ voxel. Then, an iterative process is launched where the set of voxels neighboring the current segmented region is visited, and each of such neighbor voxel that is found with an intensity above the threshold is aggregated to the segmented region under construction. This processing is iterated until no voxel neighbor to the current segmented region is found with an intensity above the threshold. In the 3D image, the notion of a six-neighborhood is used to define the six neighbors of a current voxel, in each of the three directions in space. A sketch of the region-growing segmentation as it progresses over iterations is displayed with 2D slices in Figure 2C. Once such an iterative processing is complete, it has segmented a connected region of voxels with high intensities, defining an imbibed region in the 3D image. The remaining voxels not belonging to such a segmented region, but with a high intensity above the threshold can serve as a new germ to initiate the iterative segmentation of another connected imbibed region. This is repeated until no other germ voxel remains available. At completion, the process provides the output segmented image as illustrated in Figure 2D. Among the several imbibed regions that are issued by this segmentation procedure, it is possible to discard the regions comprised of too few voxels, which will be reputed as contributed by a local noise artifact rather than by a consistent imbibed region. In this study, regions comprised of less than three voxels were discarded, which was appropriate for the noise conditions of our images. This forms an essential advantage of region-growing for segmentation compared to direct thresholding: it enables one to smooth out the noise, and it segments one or a few consistent connected regions in 3D as is physically suitable for an imbibition process progressing as a continuous water filling. The connectivity information obtained for each segmented region allows their characterization in terms of the number and sizes of the imbibed regions.
In this way, after segmentation of the imbibed regions, counting the voxels comprising them gives access to an imbibed volume in the seed or volume of absorbed water. This can be repeated on images acquired at different dates across the imbibition process, so as to deliver the evolution over time of the imbibed volume in an imbibing seed.

3.3. Illustration

This segmentation pipeline is exploited for typical MRI images of sugar beet seeds. Segmentation results then give access to the quantification of the imbibed volume and its evolution over time, as depicted as output data in Figure 2E for two sugar beet seeds over three to four days of the imbibition process.
The temporal evolution of the imbibed volume provides useful information for characterizing the imbibition process of a seed. For the two sugar beet seeds, a rapid and regular water uptake is observed, from the onset of imbibition up to around 40 h. By macroscopic observation, it is also known that 40 h or two days are typically the amounts of time it takes from the onset of imbibition to germination of the seed. After 40 h, there is a visible slowdown of water uptake for the seed (1); and for the seed (2), the small decrease observed for the water volume precisely coincides with the occurrence of the germination when a seedling stems out of the seed. Such a seedling external to the initial seed is not included in the segmentation, and it drains a quantifiable amount of water out of the seed. Meanwhile, no germination is observed for the seed (1), consistent with an imbibed volume still slowly increasing as more water continues to be absorbed by the seed, yet at a rate much reduced compared to the rate for the dry seed at the onset of imbibition.
In this way, quantitative microscopic monitoring is able to provide, in a non-invasive way, useful information on the water dynamics. It is possible to know when water uptake is regular over time, compared to alternative situations of, for instance, rapid water inflow followed by saturation, or on the contrary, water restriction with hindered inflow. Such measurements in principle can be applied over systematic studies on many seeds, in different conditions and for different species, possibly enabling one to obtain differential characterizations between them based on their imbibition behavior. Beyond the global imbibed volume, MRI can deliver additional information concerning water localization, also useful to the characterization of imbibition dynamics.

3.4. Interests and Limitations

An essential interest of MRI imaging for imbibition monitoring in seeds is that it allows a fine characterization of water dynamics, both in space and time, by non-invasive observations of internal water dynamics in 3D, by contrast with macroscopic observation, usually providing a gross and external characterization of the imbibition process. A limitation is that it has relatively coarse spatial resolution. In principle, a finer resolution could be accessible, but at the cost of reducing the signal magnitude, and consequently, the signal-to-noise ratio. This could be compensated by increasing the magnitude of the static magnetic field, but at the cost of a more sizable and bulky MRI instrument. These are in fact compromises of general applicability common to many MRI applications. The throughput of MRI is also relatively slow, with only one or a few seeds being able to be accommodated inside the static electromagnet facing the MRI antenna, and signal accumulation required over typically several minutes to construct an image with a satisfactory signal-to-noise ratio. However, this is mitigated when dealing with the monitoring of slow processes, like imbibition in seed tissues, which develops typically over a few days. MRI imaging is therefore more of a laboratory technique, useful for low-throughput exploratory observations rather than for high-throughput routine characterization.

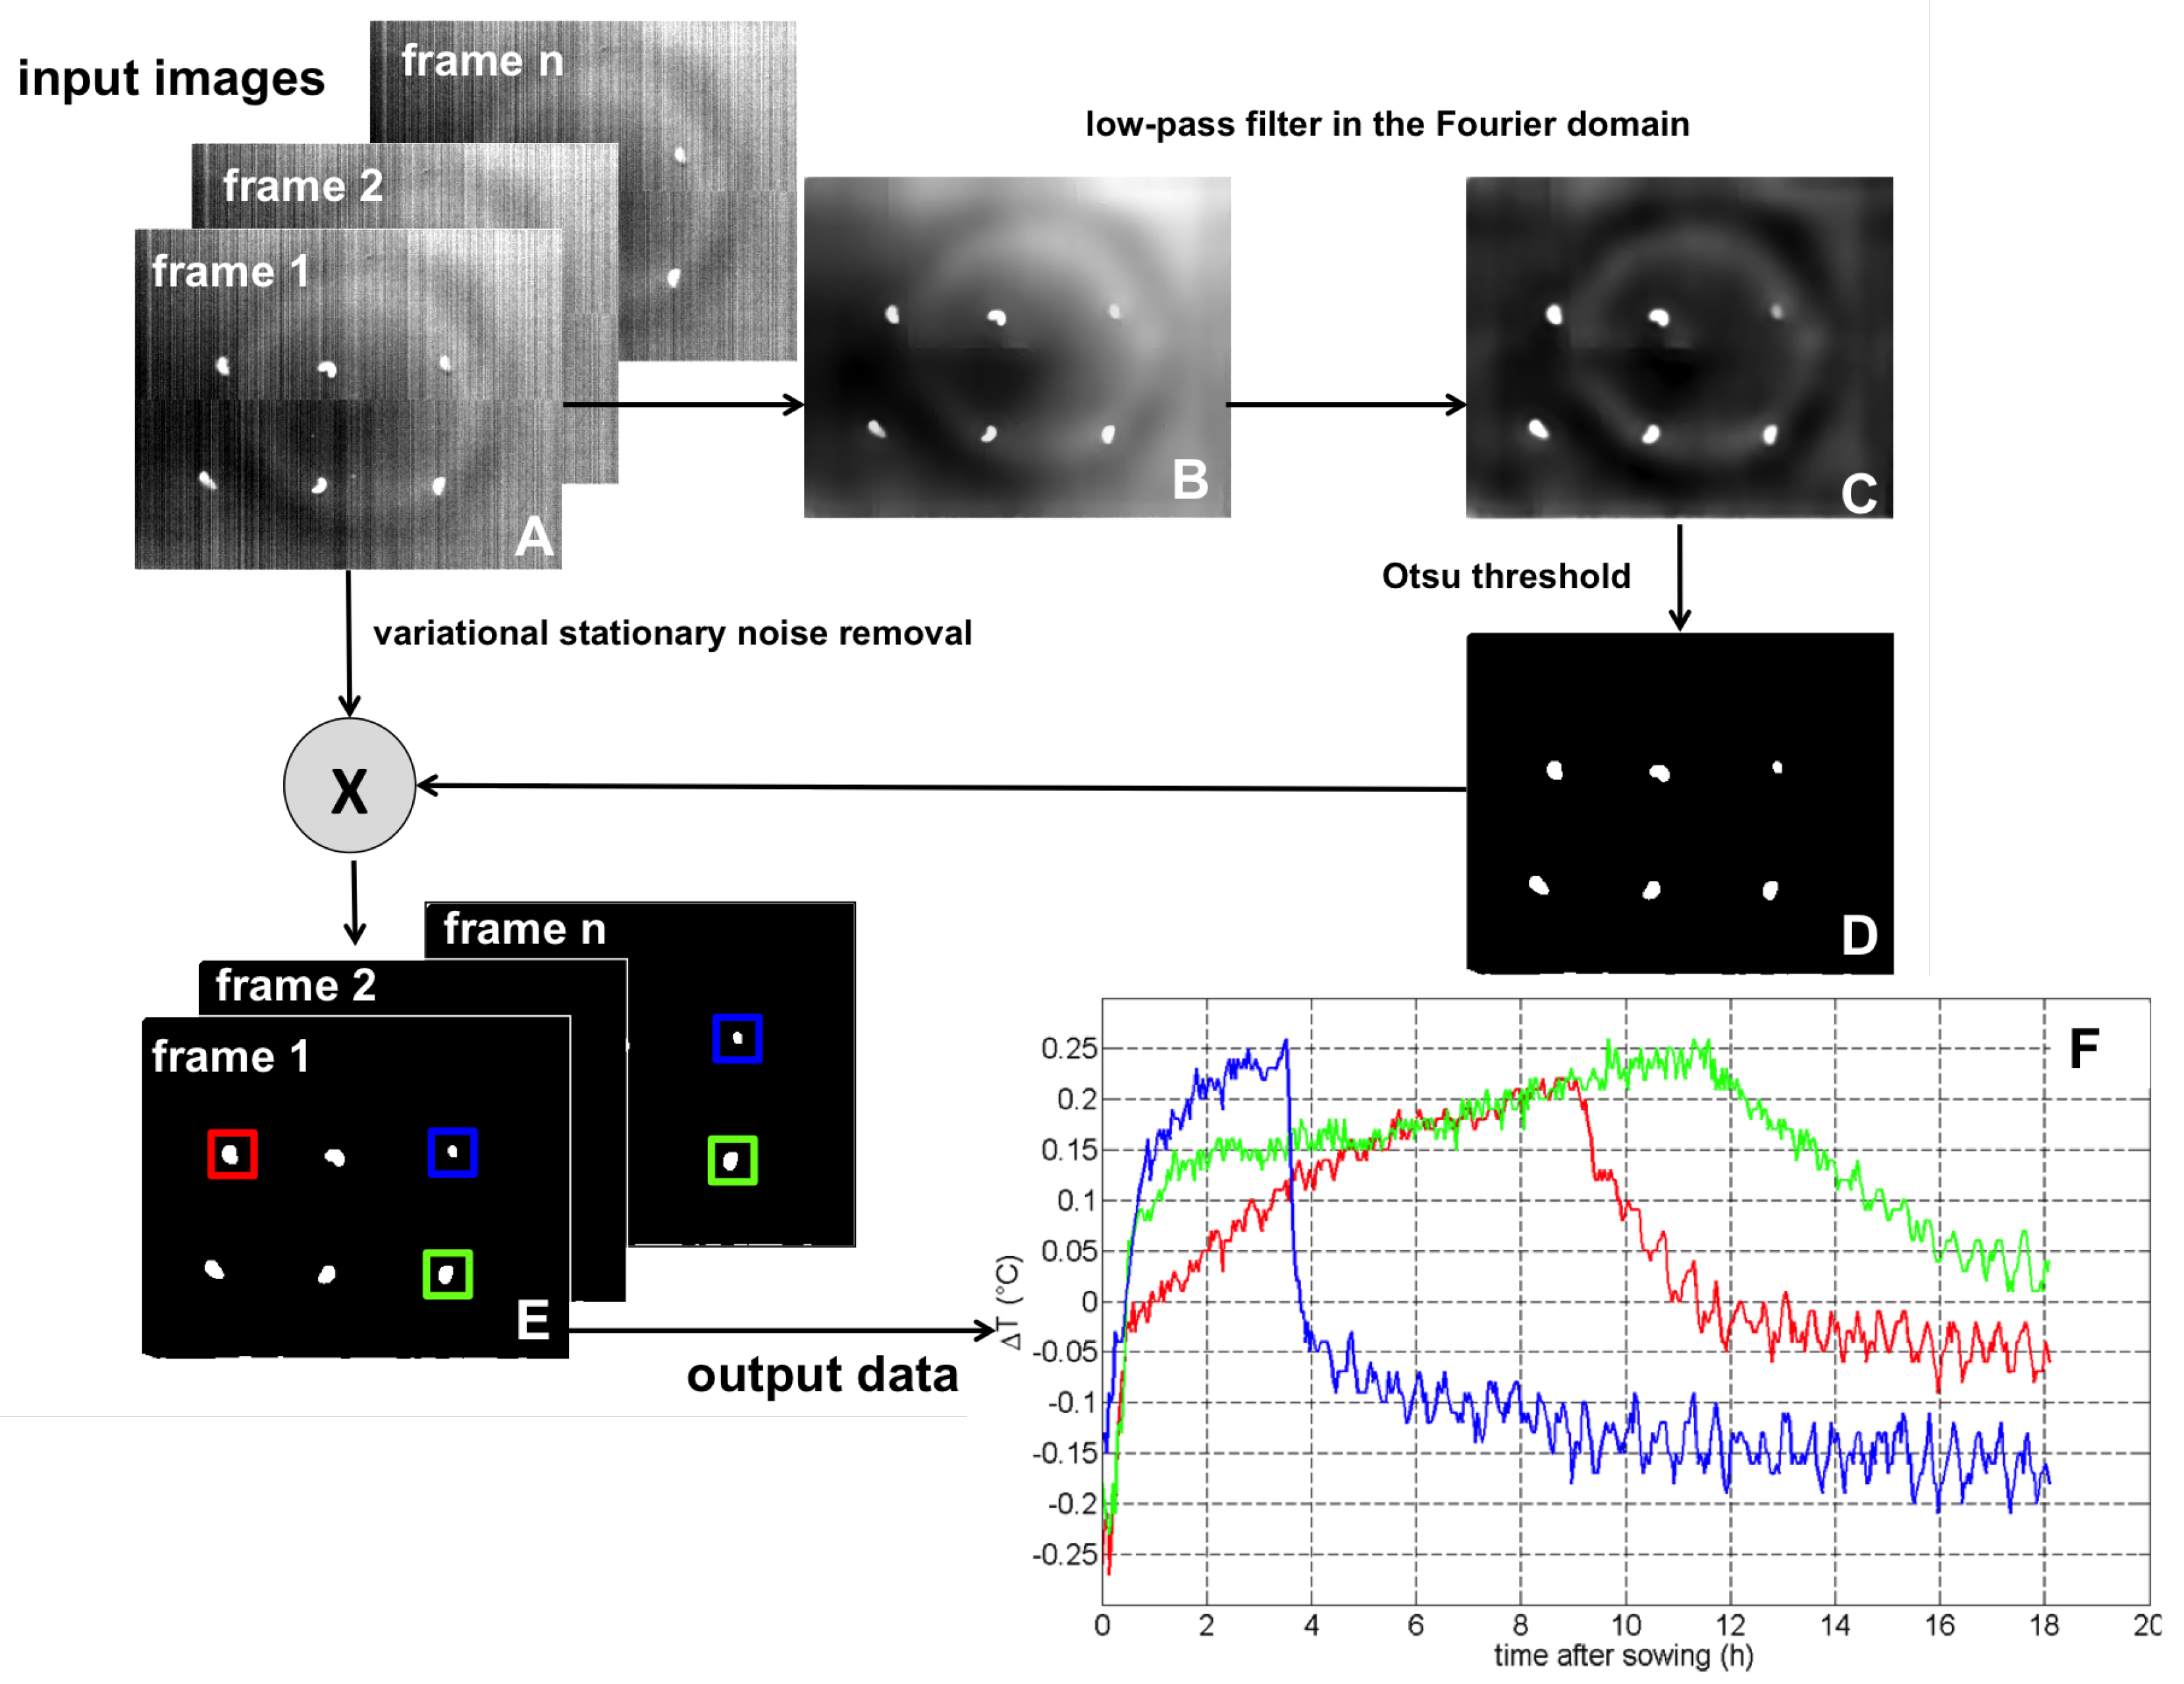
4. 2D Passive Thermography of Seed Imbibition out of Soil

Thermography is a non-invasive imaging technique. It gives access to 2D maps of the apparent temperature of an observed scene. The camera captures the emitted thermal radiation of the scene and therefrom computes temperature maps assuming the black body law holds. In plant science, thermography has been used at various scales of observation from the single leaf for studying pathosystems interactions [26,27,28] to water stress at the forest canopy scale [29]. The early stages of plant development at the scale of seeds and seedlings can also be analyzed using thermography. It has recently been used to evaluate the germination capacity of legume seeds [30], to detect biophysical and biochemical changes during imbibition and germination correlated to viability [31] and to discriminate hypocotyl and radicle of seedlings during the elongation stage due to significant thermal differences [32,33].

4.1. Acquisition Protocol

The experimental setup for thermography of seed imbibition is based on an FLIR SC 5000 cooled infrared camera, composed of a quantum detector allowing one to achieve a thermal resolution of 0.01 C, in the spectral range between 2.5 and 5 μ m. The image size is 320 × 240 pixels, and the pixel size is of 0.33 mm 2 , with a 12-bit dynamics. The camera is positioned vertically above the samples and acquires images every 5 min. The seeds are sowed on a Petri dish full of sand placed in a cryostat regulated at 24 C, and the entire system is itself placed in a growth chamber regulated at 24 C, as well. The distance of observation was some tens of cm to maximize the spatial resolution at 0.1 mm per pixel.

4.2. Image Processing Pipeline

In order to analyze the thermal evolution of the seeds, it is necessary to realize a segmentation as proposed in the pipeline of Figure 3.
Thermographic images present typical stochastic noise [34], due to temperature fluctuation noise in thermal sensors coupled with some influence of the manufacturing process [35] and the emissivity fluctuations of observed objects and background. All these factors contribute to a non-uniformity in the response of the thermal sensor, leading to various responses of the pixels. As is visible in Figure 3A, the noise in our thermal images includes some readout noise corresponding to vertical stripes of random intensities. Furthermore, this includes the “Narcisse” effects where the radiation of the camera itself creates annular artifacts in the image. In the algorithm presented and illustrated in Figure 3, the stripes are eliminated by means of the variational stationary noise removal technique [36], which is specially designed to withdraw the noise pattern of a known shape while preserving edges thanks to a prior of piecewise constant objects. As is visible in Figure 3B, the background annular noise is then reduced after a low-pass filter designed in the Fourier domain. A mask of the seeds (Figure 3C) can then be obtained after an Otsu thresholding [20]. This mask is then applied on the original image (Figure 3D), and the average temperature at the surface of each seed can therefrom be computed for each image (Figure 3E).

4.3. Illustration

We illustrate some results accessible through the image processing described above. We consider an experiment with seeds of Medicago truncatula where we compute the difference between the spatial average temperature, coded in gray-level intensity pixels, of the background surrounding seeds and the spatial average temperature, also coded in gray-level intensity pixels, of three distinct seeds, respectively in red, green and blue squares, for about 20 h of imbibition. As visible in Figure 3F, the temperature profile varies according to the various stages of the imbibition process, starting with a step of temperature increase (from less than 1 h to several hours), then followed by a sharp temperature decrease. Tested in significant amounts on imbibed seeds in [31], these changes in temperature profile may be used to reliably detect and predict the capability of seeds in the first hours for imbibition, as such thermal variations may be related to biochemical changes and transformation of the seed reserves before germination.

4.4. Interests and Limitations

Thermography is a 2D non-invasive technique that can detect and characterize imbibition associated with biophysical and biochemical changes as described in [31,33], via temperature profiles as illustrated in Figure 3F. Access to such profiles constitutes a characteristic indicator of the seed imbibition, which may vary depending on the species and environmental conditions of this imbibition process. The use of this technique has a limitation in terms of high sensitivity of the sensor to surrounding radiations of the observed scene and especially absorption by the atmosphere. To minimize this, attention has to be paid in experiments to maintain an equilibrium thermal state around the observed samples. For this purpose, experiments have to be preferentially conducted in a controlled temperature environment like growth chambers where the convection effects may be limited. Another limitation is the relatively coarse spatial resolution of the sensor, so the distance of observation has to be relatively short.

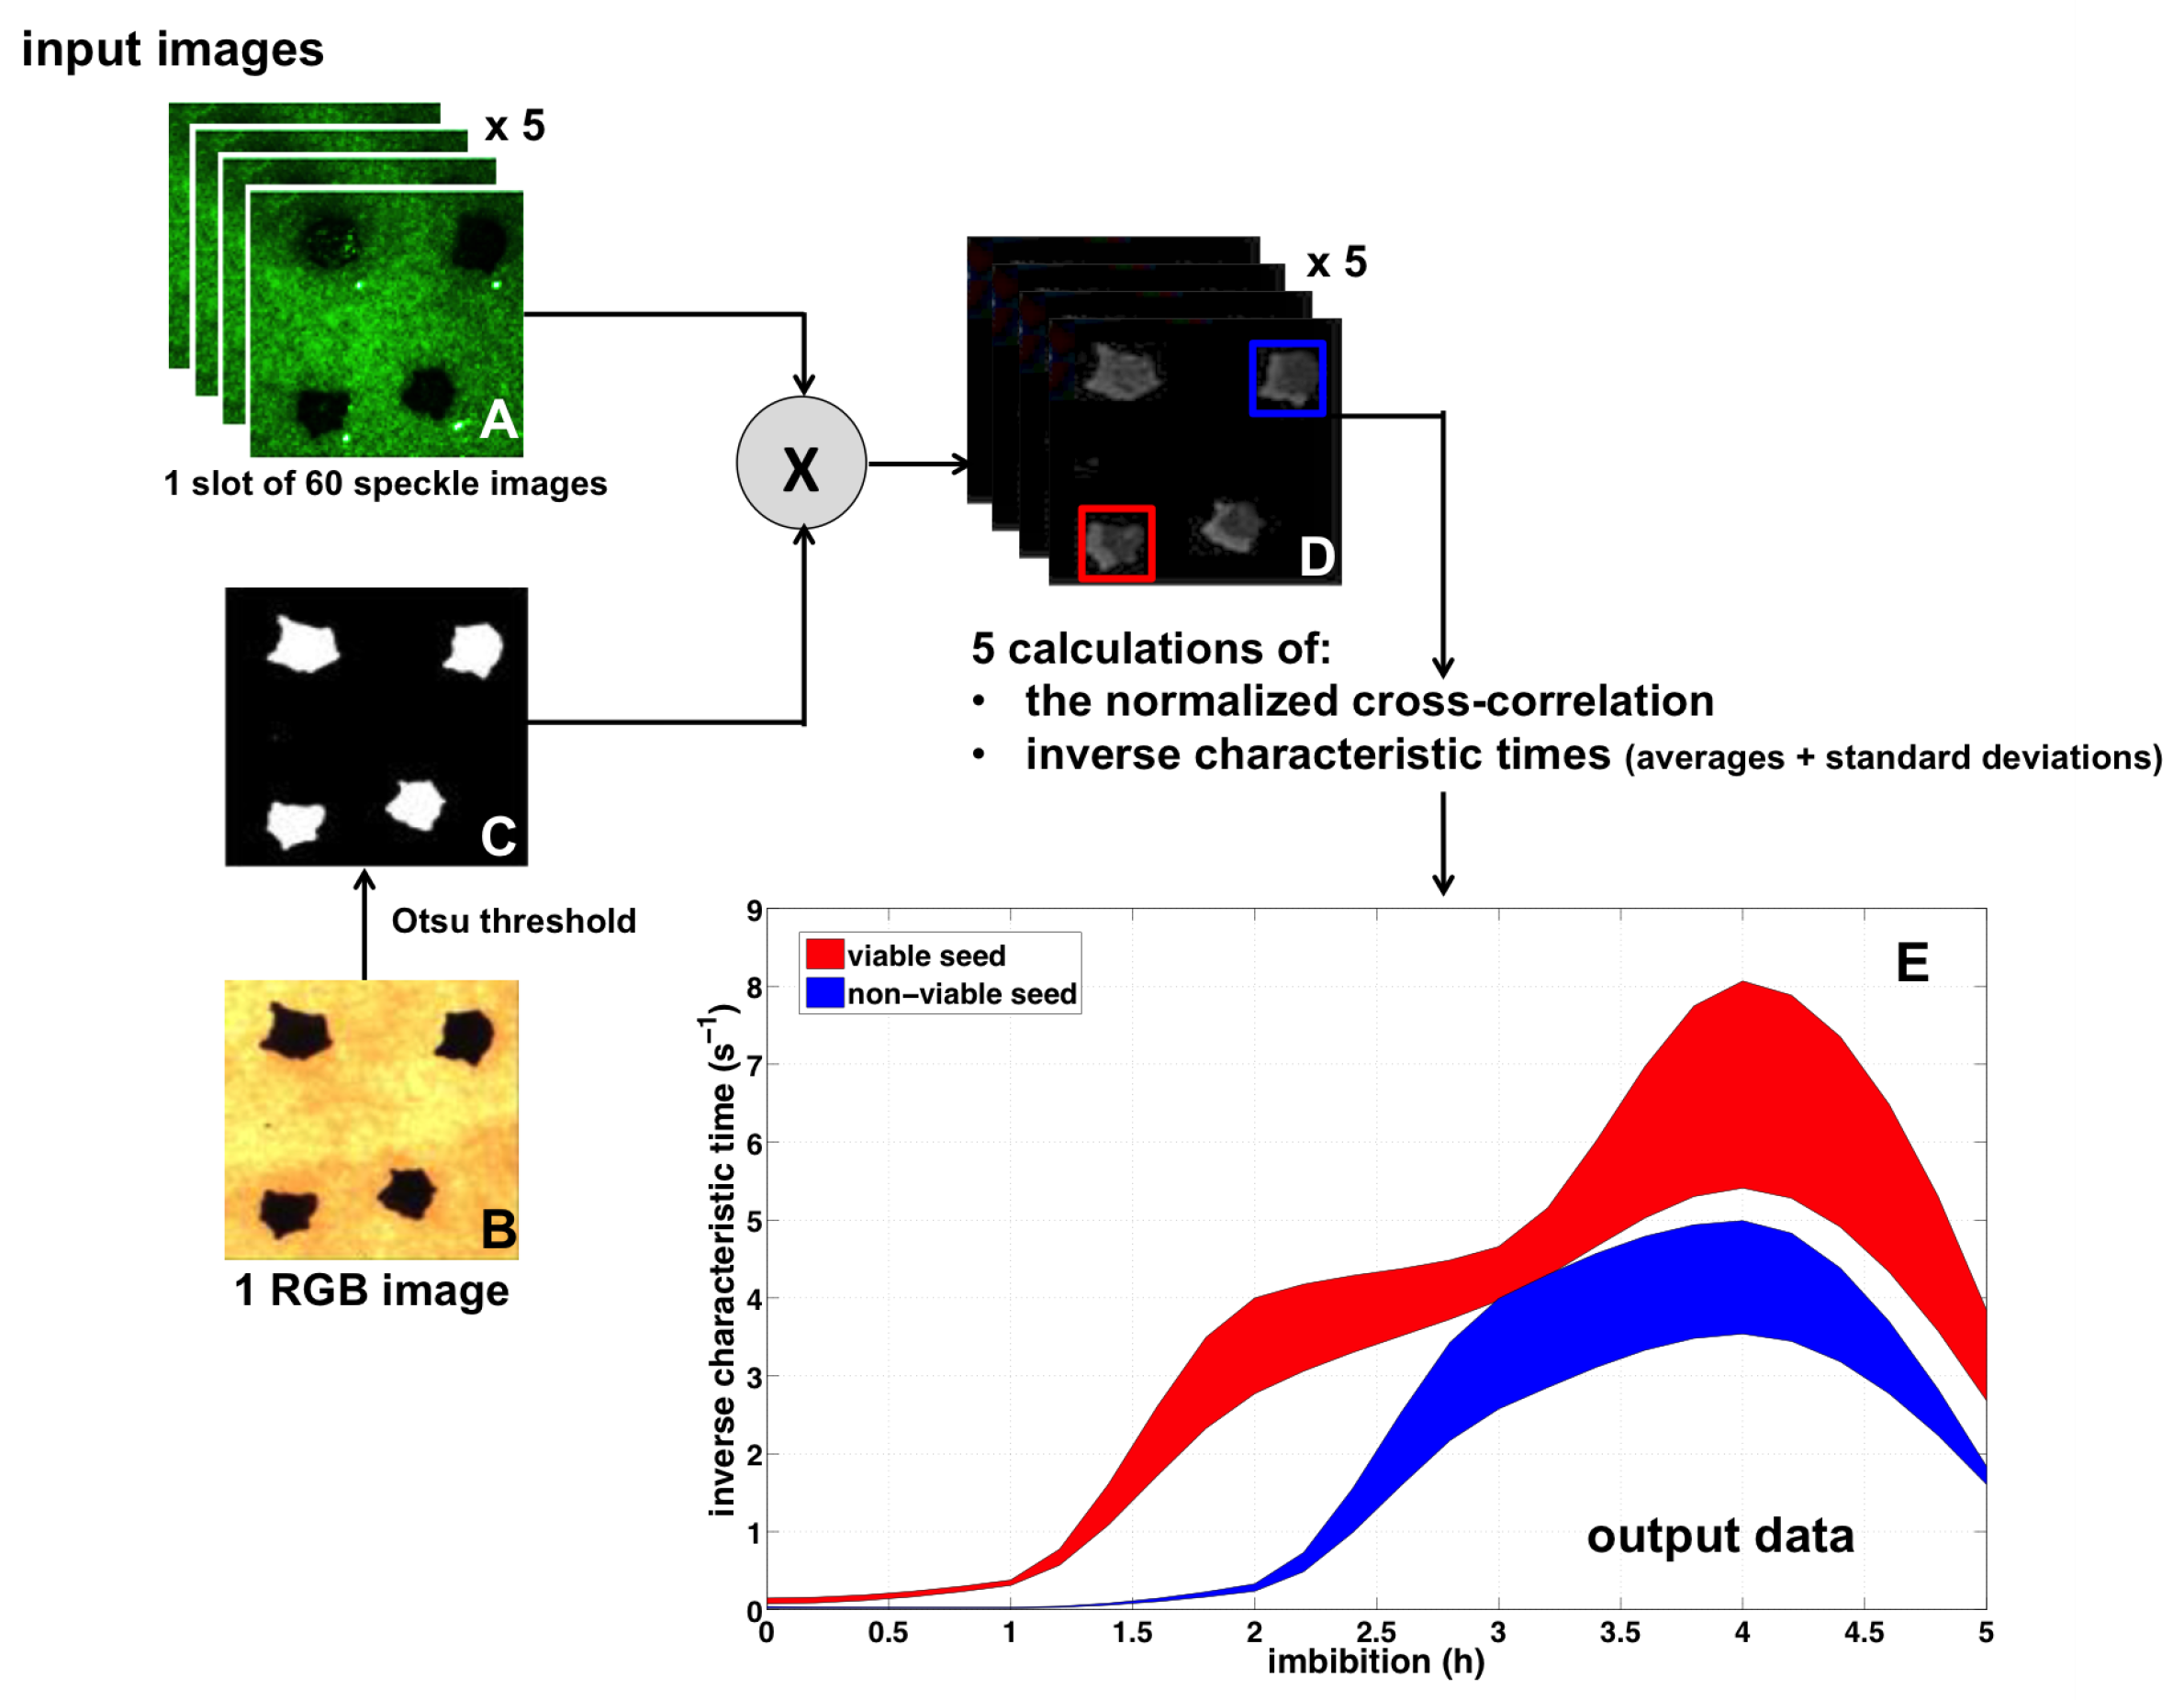
5. 2D Biospeckle Imaging of Seed Imbibition out of Soil

Biospeckle imaging is a non-invasive and non-destructive technique that gives access to 2D images of micromovements of the surface of samples by measuring the deformation of a laser light at the wavelength scale [37]. A typical biospeckle image displays irregular noisy fluctuations of intensities due to the microrugosity of the sample surface. When the microrugosity evolves over time, cross-correlation calculations enable one to evaluate the decorrelation speeds of such temporal evolutions. Therefore, the biospeckle laser is an imaging technique widely used to monitor biological activities in different research domains such as medicine or agriculture [37,38]. With a high sensitivity to follow very tiny movements in biological tissues, this technique is well-adapted for microscopic characterization of biological samples and phenomena such as bacterial spreading [39] or for the detection of drug action on parasites [40]. In plant science, at the seed scale, biospeckle imaging is especially used for the prediction of seed viability or the early detection of pathogen infestations [41,42]. In this section, we present a device coupling two imaging modalities: a full-field speckle working in coherent light and an RGB working in incoherent light, applied to monitor the early stages of the imbibition process of seeds.

5.1. Acquisition Protocol

For the speckle imaging, the optical setup is composed of a coherent green laser source of 532 nm, delivering a power of 5 mW and being linearly polarized. The distance between laser output and seed samples is 40 cm. The laser beam illuminates an area of 5 cm 2 through a diffuser, delivering a full-field speckle so that all observed seeds are homogeneously illuminated. Due to diffusion of light, the relative weakness of power and illumination time, we considered that the green laser source did not induce thermal or transforming effects. The laser source is positioned vertically with an incidence angle of 10 above the samples. Positioned vertically above the samples, the camera is a 3 × 8 -bit sensor with a matrix size of 2448 × 2050 pixels with a pixel size of 3.45 μ m 2 . It is mounted with a Navitar Zoom 7000 lens, having a focal length from 18–108 mm, with a working distance of 10 cm to infinity and an aperture of 2.5 . The depicted optical setup was assembled to provide a satisfactory spatial resolution for seed sample observations, within speckle measurements. The curvature of seeds is not taken into account in the processing protocol, as sugar beet seeds are considered as flat (less than 3 mm of thickness) regarding distances. For the RGB imaging, using the same camera, incoherent light from white LEDs is used. This white LEDs system enables one to illuminate samples in backlight mode to directly access binary masks and shapes of samples by automatic thresholding. The whole device, synchronized and driven by a computer, has been designed to acquire various sequences. The biospeckle measurements are performed in a subjective configuration, as we do not use any inert material as a reference, e.g., a plastic sample providing no evolution of the microrugosity at its surface. A typical sequence consists of an alternation of an acquisition of one RGB image in white incoherent light in backlight mode followed by the acquisition of one slot of N speckle images (typically N = 60 ) over one minute. Such a one-minute slot is then reproduced several times without acquiring the RGB image (typically five times during 5 min). As illustrated in Figure 4, this typical sequence is then reproduced at regular intervals (every hour for instance) over several hours. Acquisition duration is typically a few hours (5 h) since measurements are focused on the micromovements at the surface of the seed linked to the water fluxes as soon as the seed is in contact with water.

5.2. Image Processing Pipeline

Images are processed to evaluate the decorrelation speeds of the speckle patterns during imbibition. The image processing requires both the speckle images (Figure 4A) and back-lit RGB images (Figure 4B). Back-lit RGB images are used to create a binary mask of the seeds (Figure 4C), by automatic thresholding. The mask is then applied to the speckle images (Figure 4D). In each one-minute slot, the normalized cross-correlation is computed between the initial speckle image of the slot and each successive image in the slot. This provides N values of cross-correlation over the slot, which usually follow a decaying pattern as the fluctuations, characteristic of the biospeckle produced by the micromovements in the biological sample, gradually destroy the correlations with the initial image of the slot. The normalized cross-correlation C ( t ) between a speckle image I t ( x , y ) acquired at time t and the initial image I 0 ( x , y ) acquired at time t = 0 is defined by:
C ( t ) = x , y ( I t ( x , y ) I t ( x , y ) ) ( I 0 ( x , y ) I 0 ( x , y ) ) σ I t ( x , y ) σ I 0 ( x , y )
where · represents the spatial average computed over the images and σ I t ( x , y ) and σ I 0 ( x , y ) are respectively the standard deviations of I t and I 0 . The decrease of the normalized cross-correlation C ( t ) is usually the exponential type, with a characteristic time relative to the biological phenomenon. The slope of the decaying C ( t ) on a semilog plot defines an inverse characteristic time for the decay, local to the current slot and typical of the micromovements at the surface of the seed at this stage of imbibition. To better control the variability of the measurements, such inverse characteristic time can be averaged considering that such a kind of slot is acquired several times (for instance, five, as mentioned above). As is visible in Figure 4, it can then be plotted with filled error bars, offering a representation of the standard deviation around the average value of the inverse characteristic time. Such a procedure is then evaluated in the same way every hour over several hours of the imbibition process.

5.3. Illustration

We illustrate in Figure 4E the results of an experiment with four seeds of sugar beet. Two seeds (upper line) are known as non-viable because of a heat treatment, and two other seeds (lower row) are supposed to be viable. The evolution of the inverse characteristic time of biospeckle has been measured during the first 5 h of imbibition. Every hour, five one-minute slots of 60 images have been acquired, providing an average value of the inverse characteristic time and its standard deviation for every hour. We therefore obtain average values and standard deviations of the inverse characteristic time that we plotted in Figure 4E. Considering one viable and one non-viable seed, we can clearly see a different behavior. Consistently over the successive imbibition stages, the viable seed displays larger inverse characteristic times. This identifies a higher speed of micromovements at the surface of the seed in imbibition, consistent with more intense water fluxes in a viable seed initiating its development toward an adult plant. By contrast, the non-viable seed displays smaller inverse characteristic times, consistent with less intense water fluxes for a seed, which will stay inert and not develop into a living plant. Considering a subjective biospeckle activity measurement, both inverse characteristic times show a maximum after 4 h that may be consistent with the beginning of a new physiological process inside seeds or less water flux activities in both seeds. As demonstrated in [43], it remains a relevant result as it efficiently provides information relative to the viability of a seed, only after 2 h of imbibition.

5.4. Interests and Limitations

An essential interest of biospeckle imaging for imbibition monitoring in seeds is that it makes it possible to measure, with non-invasive 2D observations, micromovements at the surface of samples. These micromovements can be linked, for their production, to water fluxes through the sample surface. It is also a low-cost technique to implement in terms of setup, with potentially high throughput. From this point of view, biospeckle imaging could be a good candidate as a high-throughput sensor for phenotyping. Furthermore, performing speckle measurements over long times, e.g., more than 24 h, may allow a better appreciation of the relevance of the speckle imaging technique on imbibition of seeds of sugar beet. The micromovements at the surface of samples are imputed to water fluxes within the seeds. For sugar beet, the seed is surrounded by a cork shell, which during the imbibition process, first captures the water before transferring it to the seed so that the imbibition begins. By measuring for longer times, we therefore may assess the impact of water fluxes at the seed surface. A major limitation of this technique is its high sensitivity to fluctuations like mechanical vibrations of the samples, of the sample holder or air convection between samples and the sensor. Avoiding these fluctuations requires the use of a specific table protected from mechanical vibrations, by means of a massive bench common in optical instrumentation, which may affect the cost and portability of the setup. However, as illustrated in [42], some rigid registration techniques implemented on the digital images may compensate some of these fluctuations. Biospeckle imaging is also sensitive to the size of the samples to be imaged, inducing a variability in measurements. A solution to reduce this defect is to mount the digital camera with a high magnification lens.

6. Conclusions

In this report, we have tested and reviewed four non-invasive imaging techniques to monitor seed imbibition in conditions mimicking natural conditions. We discussed in this context of seed imbibition the use of 3D X-ray imaging, 3D MRI imaging, 2D thermography and 2D biospeckle imaging techniques. For each technique tested successfully during experiments, we have detailed the setup and experimental protocol we used to acquire images of seeds during the imbibition process and proposed dedicated image processing methods to extract some characteristic traits of the imbibition process. Considering a reproducible science approach, the implemented algorithms developed within ImageJ (National Institutes of Health: Bethesda, MD, USA) and MATLAB software (The MathWorks: Natick, MA, USA) and a dataset of associated images are accessible online [44]. We demonstrated that these imaging techniques generate strong contrasts, enabling simple, but efficient expert-based image processing methods that are useful to monitor seed imbibition.
We discussed the specificities for each technique in terms of interest and limitation and costs, regarding the imbibition traits we measured. Summarized in Table 1, these specificities also reveal possible complementarities between these techniques and encourage coupling them. For instance, it would technologically be possible to associate thermography and biospeckle. In addition to providing two different contrasts, this could also serve to provide a 2.5-dimensional image via the production of a disparity map as if these two cameras were considered as a stereovision system [45]. Another example considering 3D modalities is the association of MRI with X-ray tomography [46]. The MRI technique delivers information concerning water localization, useful to characterize the dynamics of imbibition. With other sequences of the instrument, MRI can also deliver well-contrasted images of specific biochemical constituents such as lipids, which are an important constituent of the dry seed embryo. Such MRI sequences could therefore be very useful at the very start of imbibition to localize the embryo when water is not yet detectable in the seed, so as to provide spatial references useful to subsequently register water MRI images in relation to this essential internal organ of the seed. The X-ray tomography technique is well suited for visualization of the internal anatomy of dry seeds and structures possibly implied in water channeling. The registration of images acquired in MRI and X-ray tomography may therefore be very relevant to better understand pathways and networks used by water in the seed during the imbibition process. This constitutes a challenging task for registration algorithms. In Figure 5, we illustrate a proof of feasibility of an approach of registration between MRI and X-ray tomography images. To facilitate such registration, experimental solutions can be envisaged by using the same seed holder, so as to control that the sample is positioned in a close position in both modalities.
The costs of the devices and their daily use prices can be additional elements for comparison. The cost of the X-ray device is 350 k€ with a daily use price of 300 €. The cost of the MRI device is approximately 1 M€ with a daily use price of 500 €. The cost for the thermal imaging device is relatively expensive, as well, with a cost of 80 k€ with a daily use price of 100 €. Inversely, the home-made speckle device is very low-cost (less than 3 k€), taking into account all the optical setup, and the daily price has not been calculated. The costs of these devices, especially 3D devices with very specific sources, sensors and technologies are very expensive, and such costs constitute an additional limitation.
Some of the current limitations, in terms of contrasts or costs, of the imaging techniques reviewed in this article may also evolve with the improvement of technologies. For instance, other sources and sensors of X-rays could be used to monitor seed imbibition such as the monochromatic synchrotron radiation sources or energy-resolved sensors, which give access to enhanced contrast. Such enhanced contrast has recently been shown for imbibed seeds during the morphogenesis of the seed [22], providing promising new insight into the imbibition process of seeds.

Author Contributions

E.B., F.C.B. and D.R. conceived of the study, drafted the manuscript, designed the image acquisitions protocols for the 3D X-ray, 3D MRI, thermal and biospeckle imaging evaluated in this study and developed the associated image processing pipelines. C.D. performed the 3D X-ray imaging acquisitions and contributed to the 3D X-ray image processing pipeline. N.G. performed the 3D MRI imaging acquisitions and contributed to the 3D MRI image processing pipeline. F.F. led the 3D MRI imaging acquisitions. J.R.V. performed the biospeckle imaging acquisitions and contributed to the biospeckle image processing development. D.D. carried out the seed imaging, participated in the thermal and biospeckle imaging acquisitions and helped to draft the manuscript. J.A. and E.M. performed 3D X-ray imaging acquisitions and contributed to the 3D X-ray image processing development. All authors read and approved the final manuscript.

Funding

This research received no external funding.

Acknowledgments

This work received support from the French Government supervised by the “Agence Nationale de la Recherche” in the framework of the program Investissements d’Avenir under Reference ANR-11-BTBR-0007 (AKER program). This work also received support from the European Phenotyping Platform Network program (Project ID2MDS). The authors thank Craig Sturrock at the Hounsfield Facility, University of Nottingham (UK), for useful preliminary microCT experiments and discussions. The Hounsfield Facility received funding from the European Research Council (FutureROOTS), BBSRC and The Wolfson Foundation.

Conflicts of Interest

The authors declare no conflict of interest.

References

  1. Bucksch, A.; Burridge, J.; York, L.M.; Das, A.; Nord, E.; Weitz, J.S.; Lynch, J.P. Image-based high-throughput field phenotyping of crop roots. Plant Physiol. 2014, 166, 470–486. [Google Scholar] [CrossRef] [PubMed]
  2. Liu, S.; Acosta-Gamboa, L.M.; Huang, X.; Lorence, A. Novel Low Cost 3D Surface Model Reconstruction System for Plant Phenotyping. J. Imaging 2017, 3, 39. [Google Scholar] [CrossRef]
  3. Mutka, A.M.; Bart, R.S. Image-based phenotyping of plant disease symptoms. Front. Plant Sci. 2015, 5, 734. [Google Scholar] [CrossRef] [PubMed]
  4. Subramanian, R.; Spalding, E.P.; Ferrier, N.J. A high throughput robot system for machine vision based plant phenotype studies. Mach. Vis. Appl. 2013, 11, 619–636. [Google Scholar] [CrossRef]
  5. Humplík, J.F.; Lazár, D.; Husičková, A.; Spíchal, L. Automated phenotyping of plant shoots using imaging methods for analysis of plant stress responses—A review. Plant Methods 2015, 11, 1. [Google Scholar] [CrossRef] [PubMed]
  6. Dhondt, S.; Wuyts, N.; Inzé, D. Cell to whole-plant phenotyping: The best is yet to come. Trends Plant Sci. 2013, 18, 428–439. [Google Scholar] [CrossRef] [PubMed]
  7. Paulus, S.; Behmann, J.; Mahlein, A.K.; Plümer, L.; Kuhlmann, H. Low-cost 3D systems: Suitable tools for plant phenotyping. Sensors 2014, 14, 3001–3018. [Google Scholar] [CrossRef] [PubMed]
  8. Minervini, M.; Scharr, H.; Tsaftaris, S.A. Image analysis: The new bottleneck in plant phenotyping. IEEE Signal Process. Mag. 2015, 32, 126–131. [Google Scholar] [CrossRef]
  9. Tsaftaris, S.A.; Minervini, M.; Scharr, H. Machine learning for plant phenotyping needs image processing. Trends Plant Sci. 2016, 21, 989–991. [Google Scholar] [CrossRef] [PubMed]
  10. Dell’Aquila, A. Towards new computer imaging techniques applied to seed quality testing and sorting. Seed Sci. Technol. 2007, 35, 519–538. [Google Scholar] [CrossRef]
  11. Dell’Aquila, A. Development of novel techniques in conditioning, testing and sorting seed physiological quality. Seed Sci. Technol. 2009, 37, 608–624. [Google Scholar] [CrossRef]
  12. Bewley, J.D.; Black, M. Seeds: Physiology of Development and Germination; Plenum Press: New York, NY, USA, 1994. [Google Scholar]
  13. Woodstock, L.W. Seed imbibition: A critical perido for successful germination. J. Seed Technol. 1988, 12, 1–15. [Google Scholar]
  14. Bewley, J.D. Seed germination and dormancy. Plant Cell 1997, 9, 1055. [Google Scholar] [CrossRef] [PubMed]
  15. Pietrzak, L.N.; Fregeau-Reid, J.; Chatson, B.; Blackwell, B. Observations on water distribution in soybean seed during hydration processes using nuclear magnetic resonance imaging. Can. J. Plant Sci. 2002, 82, 513–519. [Google Scholar] [CrossRef] [Green Version]
  16. Manz, B.; Müller, K.; Kucera, B.; Volke, F.; Leubner-Metzger, G. Water uptake and distribution in germinating tobacco seeds investigated in vivo by nuclear magnetic resonance imaging. Plant Physiol. 2005, 138, 1538–1551. [Google Scholar] [CrossRef] [PubMed]
  17. Dell’Aquila, A. Pepper seed germination assessed by combined X-radiography and computer-aided imaging analysis. Biol. Plant. 2007, 51, 777–781. [Google Scholar] [CrossRef]
  18. Romans, L.E. Computed Tomography for Technologists: A Comprehensive Text; Wolters Kluwer Health/Lippincott Williams & Wilkins: Alphen aan den Rijn, The Netherlands, 2010. [Google Scholar]
  19. Foucat, L.; Chavagnat, A.; Renou, J.P. Nuclear magnetic resonance micro-imaging and X-radiography as possible techniques to study seed germination. Sci. Hortic. 1993, 55, 323–331. [Google Scholar] [CrossRef]
  20. Otsu, N. A threshold selection method from gray-level histograms. Automatica 1975, 11, 23–27. [Google Scholar] [CrossRef]
  21. Gonzalez, R.C.; Woods, R.E. Digital Image Processing, 3rd ed.; Pearson Prentice Hall: New York, NY, USA, 2008. [Google Scholar]
  22. Rousseau, D.; Widiez, T.; Tommaso, S.; Rositi, H.; Adrien, J.; Maire, E.; Langer, M.; Olivier, C.; Peyrin, F.; Rogowsky, P. Fast virtual histology using X-ray in-line phase tomography: Application to the 3D anatomy of maize developing seeds. Plant Methods 2015, 11, 1. [Google Scholar] [CrossRef] [PubMed]
  23. Staedler, Y.M.; Masson, D.; Schönenberger, J. Plant tissues in 3D via X-ray tomography: Simple contrasting methods allow high resolution imaging. PLoS ONE 2013, 8, e75295. [Google Scholar] [CrossRef] [PubMed]
  24. Borisjuk, L.; Rolletschek, H.; Neuberger, T. Surveying the plant’s world by magnetic resonance imaging. Plant J. 2012, 70, 129–146. [Google Scholar] [CrossRef] [PubMed] [Green Version]
  25. Nonogaki, H.; Bassel, G.W.; Bewley, J.D. Germination—Still a mystery. Plant Sci. 2010, 179, 574–581. [Google Scholar] [CrossRef]
  26. Chaerle, L.; Leinonen, I.; Jones, H.G.; der Straeten, D.V. Monitoring and screening plant populations with combined thermal and chlorophyll fluorescence imaging. J. Exp. Bot. 2007, 58, 773–784. [Google Scholar] [CrossRef] [PubMed]
  27. Belin, E.; Rousseau, D.; Boureau, T.; Caffier, V. Thermography versus chlorophyll fluorescence imaging for detection and quantification of apple scab. Comput. Electron. Agric. 2013, 90, 159–163. [Google Scholar] [CrossRef] [Green Version]
  28. Chéné, Y.; Belin, E.; Chapeau-Blondeau, F.; Boureau, T.; Caffier, V.; Rousseau, D. Anatomo-functional bimodality imaging for plant phenotyping: An insight through depth imaging coupled to thermal imaging. In Plant Image Analysis: Fundamentals and Applications; Dutta Gupta, S., Ibaraki, Y., Eds.; CRC Press: Boca Raton, FL, USA, 2015. [Google Scholar]
  29. Wang, X.Z.; Yang, W.P.; Wheaton, A.; Cooley, N.; Moran, B. Automated canopy temperature estimation via infrared thermography: A first step towards automated plant water stress monitoring. Comput. Electron. Agric. 2010, 73, 74–83. [Google Scholar] [CrossRef]
  30. Baranowski, P.; Mazurek, W.; Walczak, R.T. The use of thermography for pre-sowing evaluation of seed germination capacity. In Proceedings of the International Conference on Quality Chains—An Integrated View on Fruit and Vegetable, Wageningen, The Netherlands, 1 July 2003; Volumes 1 and 2. [Google Scholar]
  31. Kranner, I.; Kastberger, G.; Hartbauer, M.; Pritchard, H.W. Non-invasive diagnosis of seed viability using infrared thermography. Proc. Natl. Acad. Sci. USA 2010, 107, 3912–3917. [Google Scholar] [CrossRef] [PubMed]
  32. Belin, E.; Rousseau, D.; Rojas-Varela, J.; Demilly, D.; Wagner, M.H.; Cathala, M.H.; Dürr, C. Thermography as a non-invasive functional imaging for monitoring seedling growth. Comput. Electron. Agric. 2011, 79, 236–240. [Google Scholar] [CrossRef] [Green Version]
  33. Belin, E.; Rousseau, D.; Benoit, L.; Demilly, D.; Ducournau, S.; Chapeau-Blondeau, F.; Dürr, C. Thermal imaging for evaluation of seedling growth. In Plant Image Analysis: Fundamentals and Applications; Dutta Gupta, S., Ibaraki, Y., Eds.; CRC Press: Boca Raton, FL, USA, 2015. [Google Scholar]
  34. Budzan, S.; Wyżgolik, R. Noise reduction in thermal images. In International Conference on Computer Vision and Graphics; Springer: Berlin, Germany, 2014; pp. 116–123. [Google Scholar]
  35. Rogalski, A. Infrared Detectors, 2nd ed.; CRC Press: Boca Raton, FL, USA, 2011. [Google Scholar]
  36. Fehrenbach, J.; Weiss, P.; Lorenzo, C. Variational algorithms to remove stationary noise: Applications to microscopy imaging. IEEE Trans. Image Process. 2012, 21, 4420–4430. [Google Scholar] [CrossRef] [PubMed] [Green Version]
  37. Pieczywek, P.M.; Kurenda, A.; Zdunek, A.; Adamiak, A. The biospeckle method for the investigation of agricultural crops: A review. Opt. Lasers Eng. 2014, 52, 156–158. [Google Scholar]
  38. Braga Júnior, R.A. When noise became information: State-of-the-art in biospeckle laser. Cienc. Agrotecnologia 2017, 41, 359–366. [Google Scholar] [CrossRef] [Green Version]
  39. Ramirez-Miquet, E.E.; Darias, J.G.; Otero, I.; Rodriguez, D.; Murialdo, S.; Rabal, H.; Trivi, M. Biospeckle technique for monitoring bacterial colony growth with minimal photo-exposure time associated. In Proceedings of the VI Latin American Congress on Biomedical Engineering CLAIB 2014, Parana, Argentina, 29–31 October 2014; Springer: Cham, Switzerland, 2014; pp. 313–316. [Google Scholar]
  40. Ramirez-Miquet, E.E.; Cabrera, H.; Grassi, H.C.; Andrades, E.D.J.; Otero, I.; Rodriguez, D.; Darias, J.G. Digital imaging information technology for biospeckle activity assessment relative to bacteria and parasites. Lasers Med. Sci. 2017, 32, 1375–1386. [Google Scholar] [CrossRef] [PubMed]
  41. Rabelo, G.F.; Enes, A.M.; Braga Júnior, R.A.; Dal Fabbro, I.M. Frequency response of biospeckle laser images of bean seeds contaminated by fungi. Biosyst. Eng. 2011, 110, 297–301. [Google Scholar] [CrossRef]
  42. Rousseau, D.; Caredda, C.; Morille, Y.; Belin, E.; Chapeau-Blondeau, F.; Gindre, D. Low-cost biospeckle imaging applied to the monitoring of seed germination. In Proceedings of the 3rd International Workshop on Image Analysis Methods for the Plant Sciences (IAMPS), Aberystwyst, UK, 15–16 September 2014. [Google Scholar]
  43. Braga, R.A.; Dal Fabbro, I.M.; Borem, F.M.; Rabelo, G.; Arizaga, R.; Rabal, H.J.; Trivi, M. Assessment of seed viability by laser speckle techniques. Biosyst. Eng. 2003, 86, 287–294. [Google Scholar] [CrossRef]
  44. Platform PHENOTIC. Available online: http://laris.univ-angers.fr/fr/activites-scientifiques/projets/plateformes-1/plateforme-phenotic-1.html (accessed on 1 June 2018).
  45. Hartley, R.; Zisserman, A. Multiple View Geometry in Computer Vision; Cambridge University Press: Cambridge, UK, 2003. [Google Scholar]
  46. Rousseau, D.; Chéné, Y.; Belin, E.; Semaan, G.; Trigui, G.; Boudehri, K.; Franconi, F.; Chapeau-Blondeau, F. Multiscale imaging of plants: Current approaches and challenges. Plant Methods 2015, 11, 6. [Google Scholar] [CrossRef] [PubMed] [Green Version]
Figure 1. Main steps of the image processing pipeline for the extraction of the volume of air remaining in the seed during the progress of the imbibition process. The pipeline is illustrated on a 2D slice from a 3D X-ray image. The air (identified with a white arrow on the input image (A)) corresponds to the dark region between the embryo of the seed and the cork. The output data show the evolution of volume of air relative to the initial volume of air in a dry seed and in the sand, as a function of time.
Jimaging 04 00083 g001
Figure 2. Main steps of the image processing pipeline performing 3D segmentation of the MRI images. The pipeline is illustrated with a 2D slice of 128 × 128 pixels from a 3D MRI image of 128 × 128 × 64 voxels. The output data show the temporal evolution over the imbibition process of the imbibed volume in two different sugar beet seeds (1) and (2).
Jimaging 04 00083 g002
Figure 3. Main steps of the image processing pipeline performing 2D segmentation of thermographic images, with the illustration of extracted output data in (F). The three colored curves were obtained by a computation of the difference between the average temperature of three distinct seeds and the average temperature of the background surrounding the seeds, delimited by colored squares, respectively red, green and blue.
Jimaging 04 00083 g003
Figure 4. Main steps of the image processing pipeline performing the calculations of the normalized cross-correlation and inverse characteristic times of a typical sequence of speckle images with four sugar beet seeds in imbibition. Seeds in the upper line (blue square) are non-viable, whereas seeds in the lower line (red square) are considered as viable. Considering the five slots, the average value and standard deviation are also accessible, as depicted in the output data.
Jimaging 04 00083 g004
Figure 5. (A) X-ray tomography used as a reference map; (B) registration of MRI lipid-contrasted images (in green) with X-ray tomography (in purple) images; (C) registration of MRI water-contrasted images (in green) with X-ray tomography (in purple) images. We first register the lipid content from the embryo of the dry seed in MRI with the tomography image, as the embryo shape and orientation are recognizable at the spatial resolution of MRI images. After registration, it gives us the transformations we need to apply to water MRI images to be registered with the anatomy of the seed identified by X-ray tomography.
Jimaging 04 00083 g005
Table 1. Specificities of the four non-invasive imaging techniques reviewed in this report.
Imaging TechniqueImbibition Trait MeasuredInterestsLimitations
X-rayremaining air volume3D, high spatial resolutionlow contrast, very expensive costs
MRIimbibed volume3D, high water sensitivitylow throughput, low spatial resolution, very expensive costs
thermographythermal signature of biochemical activitieshigh sensitivity2D, expensive costs
biospeckleexternal deformationshigh micrometer sensitivity, very low costs2D

