Article

Characterization of Crystallographic Structures Using Bragg-Edge Neutron Imaging at the Spallation Neutron Source †

1
Neutron Scattering Division, Neutron Sciences Directorate, Oak Ridge National Laboratory, Oak Ridge, TN 37830, USA
2
Materials Science and Technology Division, Physical Sciences Directorate, Oak Ridge National Laboratory, Oak Ridge, TN 37830, USA
3
Experimental Astrophysics Group, Space Sciences Laboratory, University of California, Berkeley, CA 94720, USA
*
Authors to whom correspondence should be addressed.
This manuscript has been authored by UT-Battelle, LLC under Contract No. DE-AC05-00OR22725 with the U.S. Department of Energy. The United States Government retains and the publisher, by accepting the article for publication, acknowledges that the United States Government retains a non-exclusive, paid-up, irrevocable, worldwide license to publish or reproduce the published form of this manuscript, or allow others to do so, for the purposes of the United States Government. The Department of Energy will provide public access to these results of federally sponsored research in accordance with the DOE Public Access Plan (http://energy.gov/downloads/doe-public-access-plan).
J. Imaging 2017, 3(4), 65; https://doi.org/10.3390/jimaging3040065
Submission received: 10 November 2017 / Revised: 4 December 2017 / Accepted: 7 December 2017 / Published: 20 December 2017
(This article belongs to the Special Issue Neutron Imaging)

Abstract

:
Over the past decade, wavelength-dependent neutron radiography, also known as Bragg-edge imaging, has been employed as a non-destructive bulk characterization method due to its sensitivity to coherent elastic neutron scattering that is associated with crystalline structures. Several analysis approaches have been developed to quantitatively determine crystalline orientation, lattice strain, and phase distribution. In this study, we report a systematic investigation of the crystal structures of metallic materials (such as selected textureless powder samples and additively manufactured (AM) Inconel 718 samples), using Bragg-edge imaging at the Oak Ridge National Laboratory (ORNL) Spallation Neutron Source (SNS). Firstly, we have implemented a phenomenological Gaussian-based fitting in a Python-based computer called iBeatles. Secondly, we have developed a model-based approach to analyze Bragg-edge transmission spectra, which allows quantitative determination of the crystallographic attributes. Moreover, neutron diffraction measurements were carried out to validate the Bragg-edge analytical methods. These results demonstrate that the microstructural complexity (in this case, texture) plays a key role in determining the crystallographic parameters (lattice constant or interplanar spacing), which implies that the Bragg-edge image analysis methods must be carefully selected based on the material structures.

1. Introduction

Due to its high penetration depth, the neutron is a unique probe for studying the structure of diverse materials (such as functional energy materials) in a non-destructive manner [1,2,3,4]. One of the most common neutron techniques is neutron diffraction. Diffraction is based on the interaction between neutrons and the crystal structure in a defined gauge volume that is in the order of cubic millimeters (mm3). This enables the characterization of atomic structures of materials, such as the lattice parameter and crystallographic texture. A variety of sample environments (load frame, heating furnace, levitation equipment, etc.) have enabled more complex dynamic or real-time microstructure measurements [5,6,7,8,9,10]. Moreover, attenuation-based neutron imaging has been widely adopted to visualize micron-scale structures inside materials (porosity, density inhomogeneity) [11,12,13]. Compared to other imaging techniques such as X-ray imaging, neutron imaging has unique capabilities that allow measurement of bulk components as well as detection of lightweight elements (hydrogen and lithium) [14,15,16].
Recently, wavelength-dependent neutron radiography or Bragg-edge imaging has received growing attention due to its promising capability of providing quantitative spatial information regarding the atomic and internal structures of bulk components [17,18]. Wavelength-resolved neutron radiography has made a rapid advance due to the development of the boron-doped micro-channel plate (MCP) neutron detectors with sufficient time resolution and detection efficiency [19,20]. Other types of neutron detectors with different capabilities (counting rate, spatial resolution) have been utilized [21,22]. The wavelength-resolved transmission spectrum displays Bragg features (abrupt changes in the transmission called Bragg edge) resulting from the interaction of neutrons with the crystalline structure of a material, as governed by Bragg’s law. Specifically, Bragg edges are related to coherent elastic scattering, which is due to the diffraction of neutrons in the sample at all Bragg angles ( λ h k l = 2 d h k l sin θ h k l ). When the neutron wavelength is shorter than or equal to 2 d h k l , neutrons are scattered by the (hkl) plane; thus, the transmitted intensity is reduced. However, neutrons with wavelengths longer than 2 d h k l are not scattered by the (hkl) plane, which leads to a considerable increase in the transmitted intensity, resulting in the sharp steps (Bragg edges). This technique enables the study of spatially resolved lattice strain [23,24], crystallographic grain orientation [25,26,27], and phase distribution [17,28]. Theoretical and mathematical approaches to fit and interpret the transmission spectra have been proposed and applied to several engineering materials [29,30,31,32,33].
In the present research, Bragg-edge neutron radiography investigates microstructures of metallic powder and additively manufactured (AM) Inconel 718 samples. The rationale behind the choice of materials was to confirm that the microstructural complexity (in this case, texture) affects the crystallographic parameters (lattice constant or interplanar spacing) extracted from Bragg-edge imaging. For instance, the powder samples are free of texture whereas AM Inconel 718 samples are strongly textured. Two analytical methods that we have recently implemented (such as theoretical Bragg-edge modeling and phenomenological function, which will be described in detail in the following sections) were used and the derived parameters compared with each other. Moreover, neutron diffraction measurements at SNS’s VULCAN engineering materials diffractometer [34] were conducted to validate the results obtained from both approaches.

2. Materials and Methods

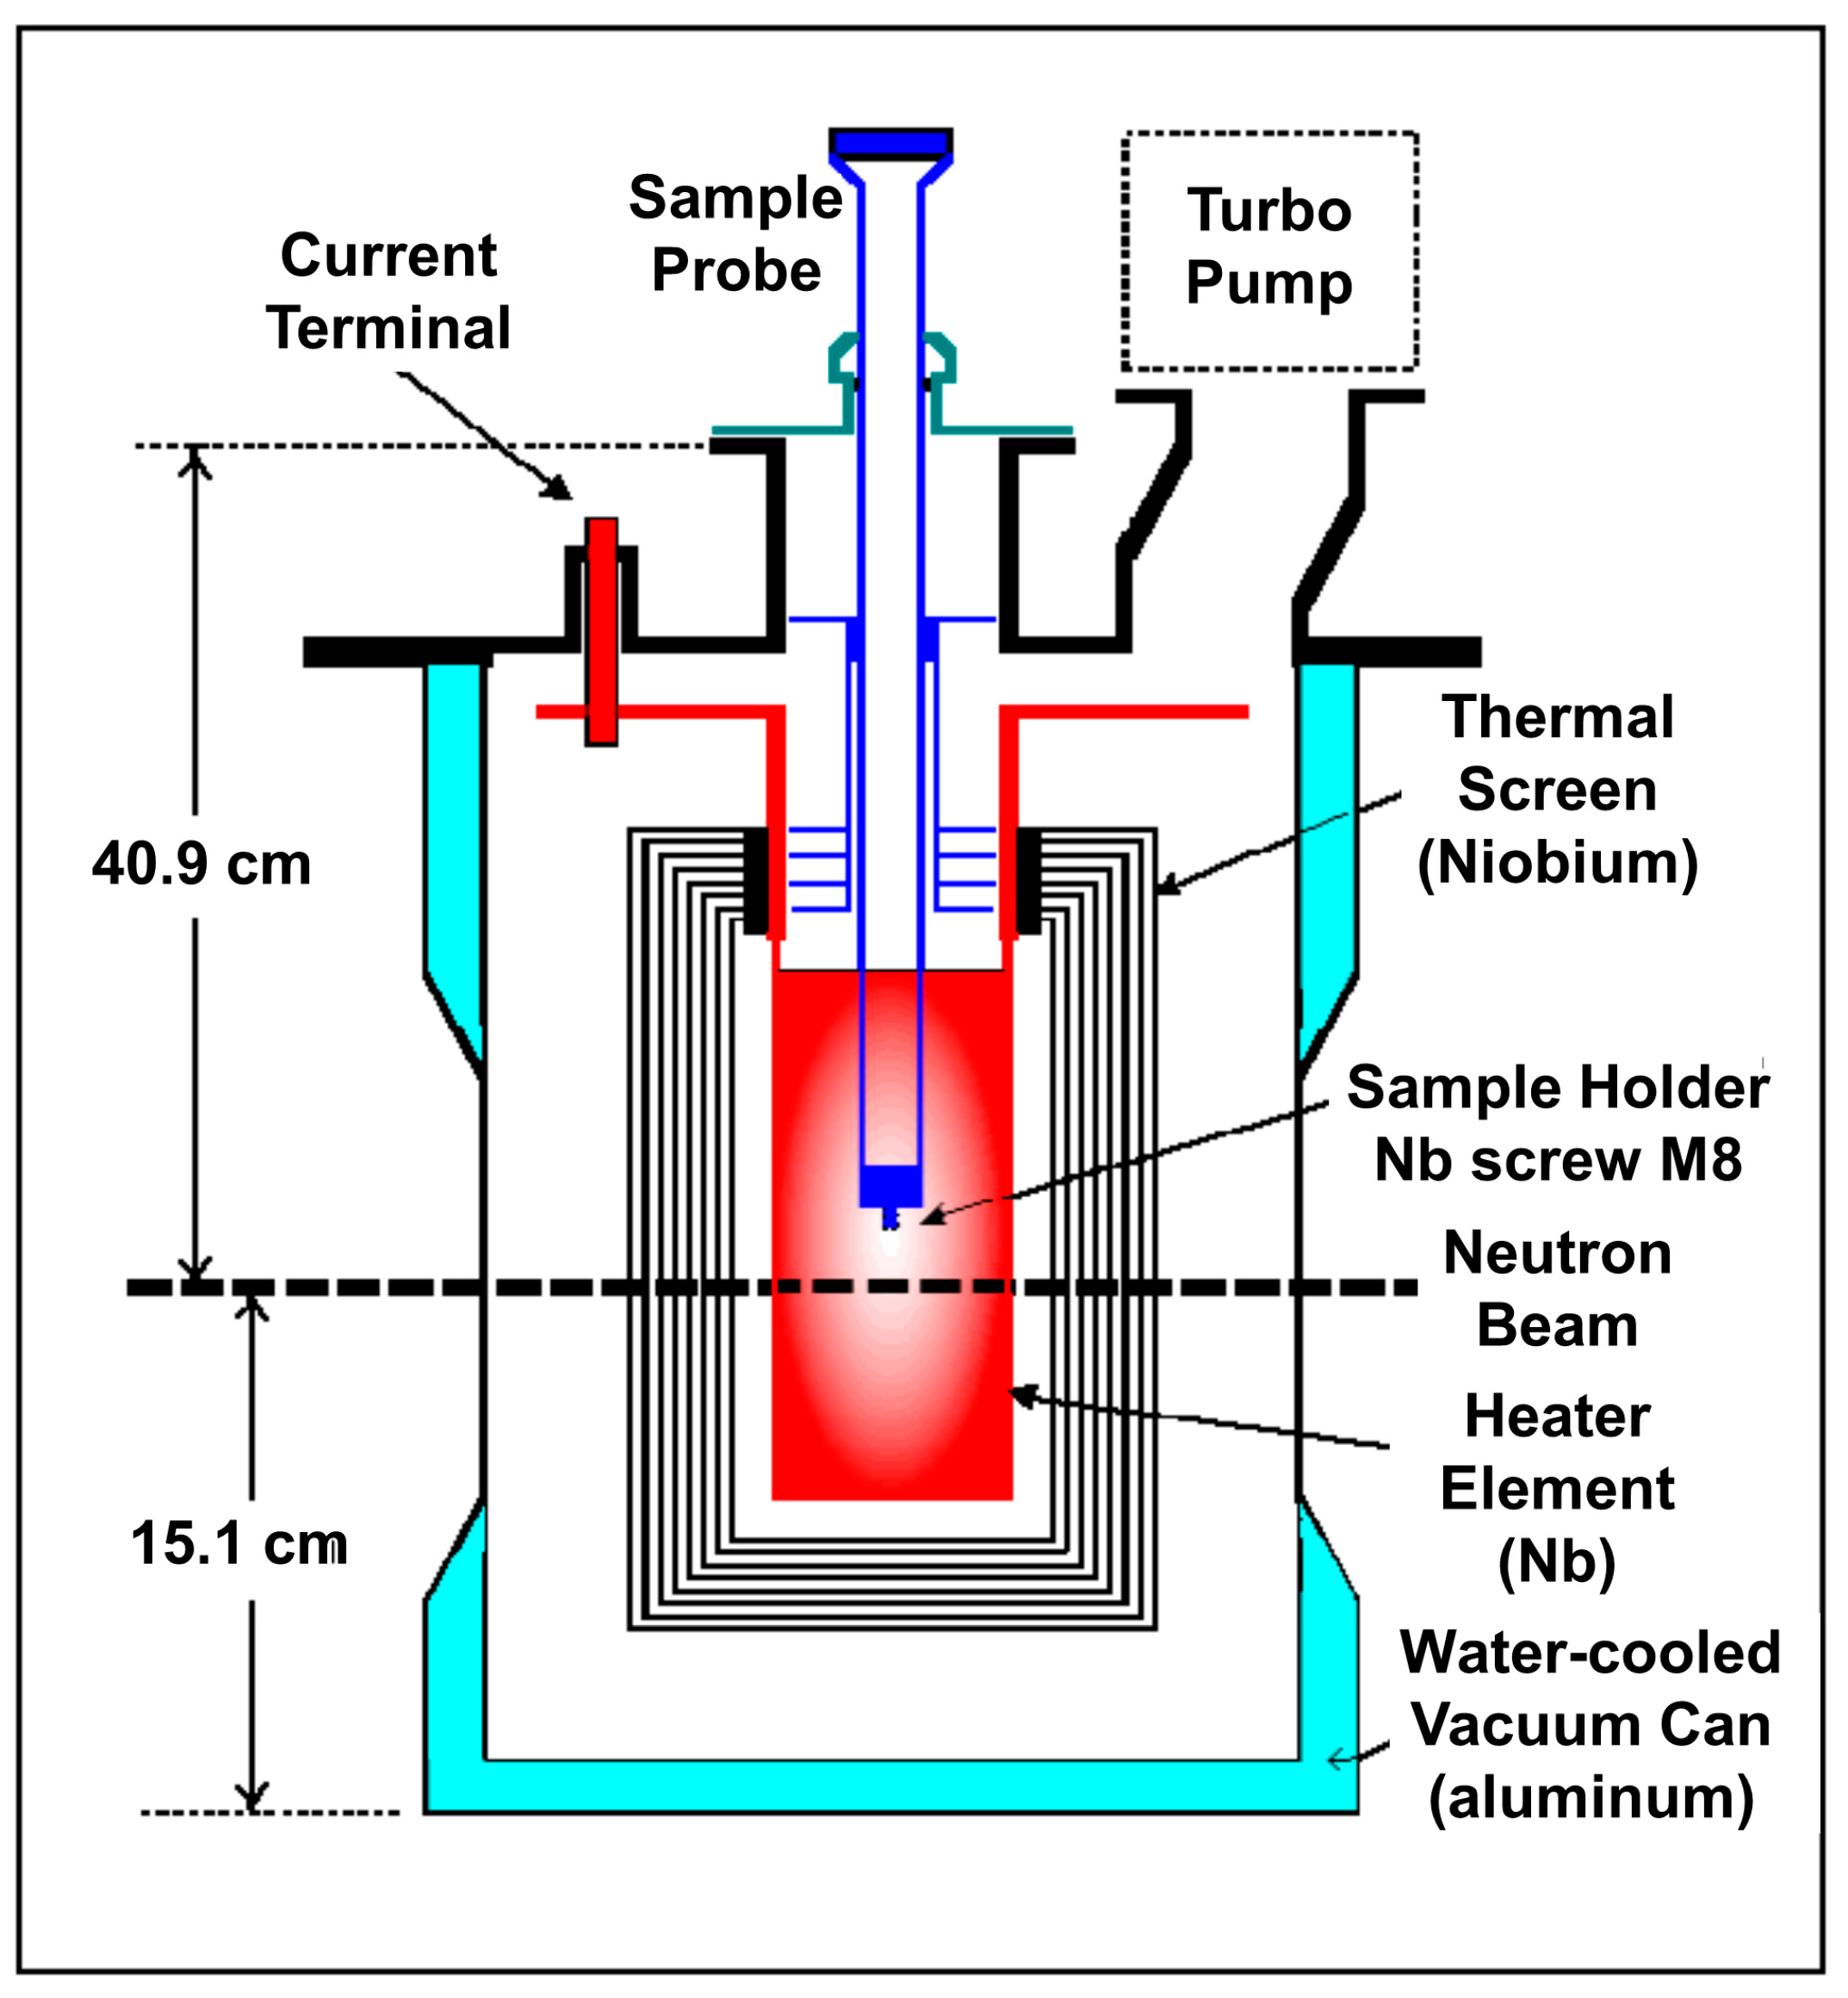
2.1. Bragg-Edge Neutron Radiography at SNS SNAP and Neutron Diffraction at SNS VULCAN Beamlines

The neutron radiography experiments reported in this paper were conducted at the Spallation Neutron Source (SNS) Spallation Neutrons and Pressure Diffractometer (SNAP) beamline. The MCP detector has a field of view of 2.8 × 2.8 cm2 with a pixel size of 55 × 55 μm2 [20]. The time resolution used for these measurements was 10 μs. The sample-to-moderator distance was calibrated by means of a Si powder sample and was determined to be, depending on the experimental setup, at a distance between 15 and 16 m. The MCP detector was delayed by 4.5 ms (the delay value of 4.5 ms is only relevant at 16 m. It is a smaller value at 15 m) using a TTL generator that received the t = 0 signal from the first bandwidth chopper. The sample was placed as close as possible to the detector while maintaining space for the load frame and furnace. Data were collected at 60 Hz, the pulse frequency of the SNS facility. Further details on the calculation of wavelength from time-of-flight (TOF) and experimental configuration of the Bragg-edge radiography at SNS can be found in reference [35].

2.2. Powder Samples

Commercially available pure Ni and Ni39Cr11 (in wt. %) powders with a purity higher than 99.9% and the rotary atomized powder of the Ni base Inconel 718 superalloy (the chemical composition is given in Table 1 [36]) were loaded in aluminum cans. These samples were placed in front of the MCP detector and radiographs were measured for an hour at room temperature. In addition, the pure Ni powder sample was loaded into a vanadium can and measured in situ at different temperatures (room, 573 K, and 873 K) with the sample being held at constant temperature during each measurement. The VULCAN vacuum furnace was utilized for heating experiments, which resulted in the distance of the sample to the detector increasing to 13 cm, as compared to 2 cm for room temperature measurements. Figure 1 displays a layout of the VULCAN furnace. The furnace heating is done by radiative heating with a niobium foil element driven by a high current power supply. The shield and heating elements are thin, and the external body is made of aluminum, which allow high amounts of transmission neutrons.

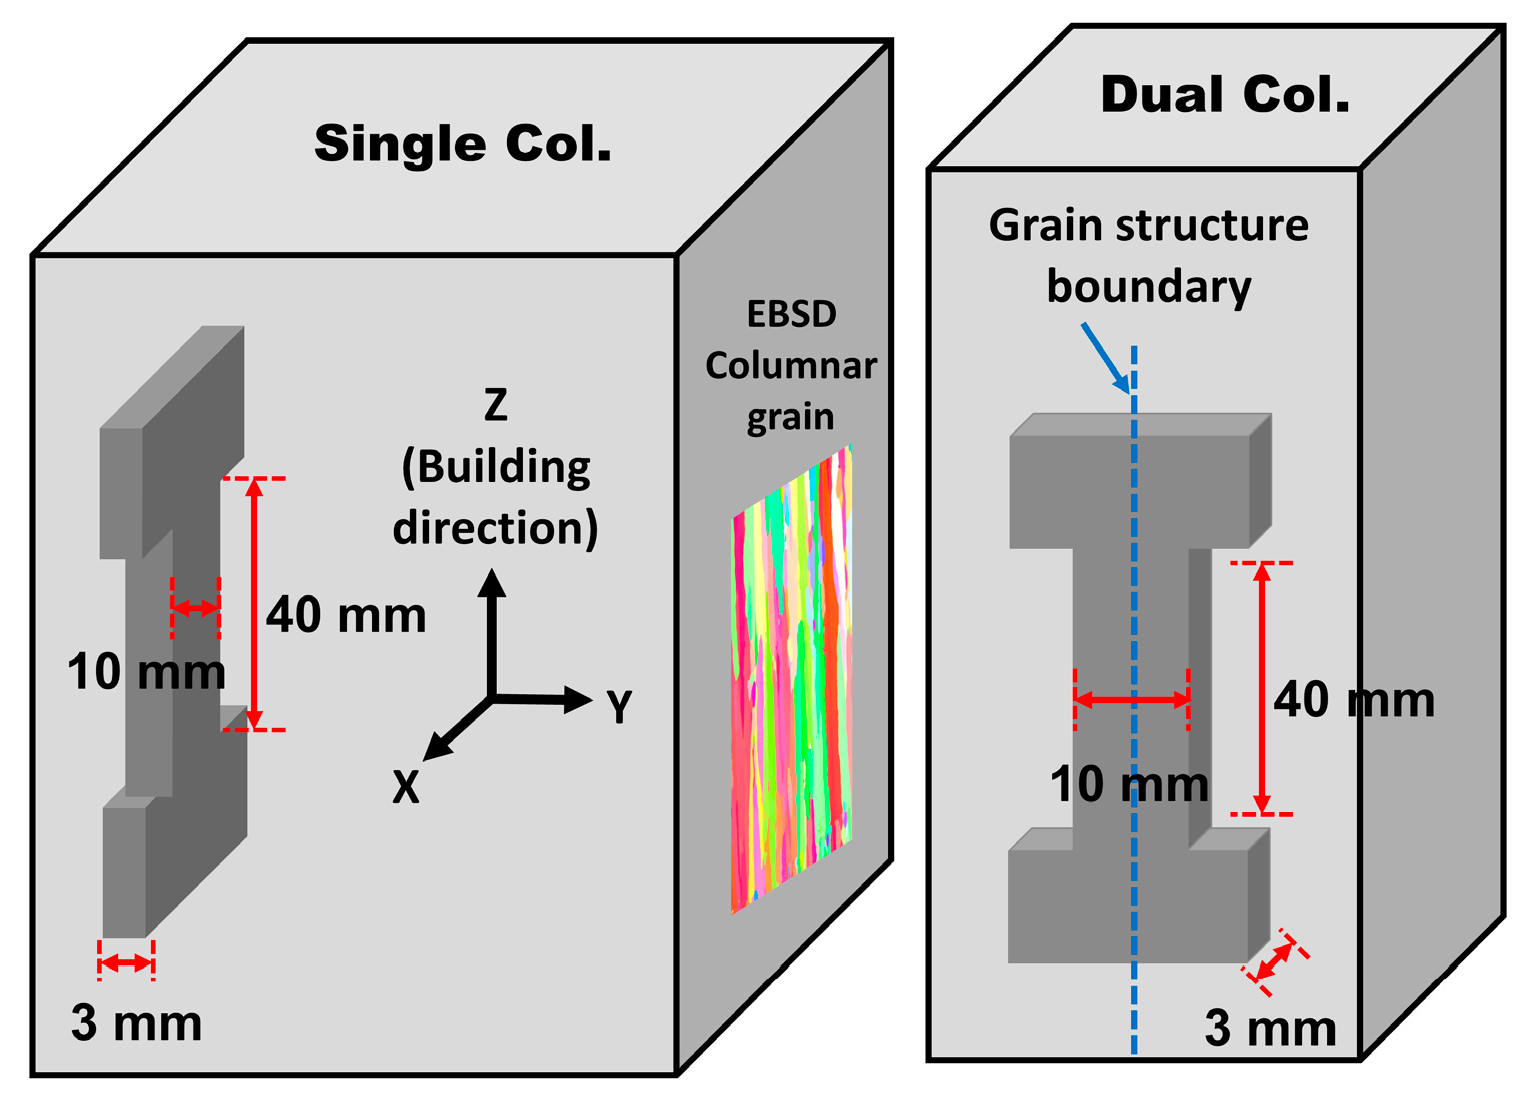
2.3. AM Inconel 718 Block

The samples were fabricated using rotary atomized Inconel 718 powder. Two types of bulk blocks were built using electron beam melting (EBM) at the ORNL Manufacturing Demonstration Facility (MDF). The orientation of the microstructures of the AM blocks were selected by assigning specific EBM strategies (strong texture) [37]. One sample was composed of a homogeneous columnar grain structure and a preferred orientation of (001) plane (single columnar structure: identified in this manuscript by “single Col.”). Another sample contained the preferred orientation of (001) plane with a different grain distribution (dual columnar structure: identified in this manuscript by “dual Col.”).
Dog-bone samples with a thickness of 3 mm, a width of 10 mm, and a gauge length of 40 mm were machined for the in situ tension loading experiments. The University of Tennessee’s load frame [24] was placed in front of the MCP detector. Neutron transmission measurements were made at room temperature under stress holding mode at four stress levels: 15 (reference), 200, 400, and 550 MPa. Neutron radiographs were collected over 20-min periods at each stress level. To validate the imaging results, neutron diffraction experiments were performed on similar (and previously unloaded) AM Inconel 718 samples at VULCAN. Two detectors, which are fixed at an angle of 45° to the loading direction, collected the diffracted beams from the polycrystalline grains with lattice planes parallel to the transverse and axial directions, respectively. Therefore, the lattice parameters of the constitutive phases can be measured simultaneously both parallel and perpendicular to the loading direction. A direct comparison between the perpendicular direction of the diffraction data and the transmitted Bragg-edge data is reported here. The (hkl) interplanar spacings were determined from the diffraction data via a single peak fitting approach employing VULCAN Data Reduction and Interactive Visualization (VDRIVE) software [38].

3. Quantitative Data Analysis of Bragg Edges

3.1. Phenomenological Bragg-Edge Analysis (iBeatles)

Similar to diffraction techniques, the Bragg edge can be analyzed by fitting the phenomenological function [39]
T ( λ ) = a 1 + a 2 ( λ a 4 ) + ( a 3 a 2 ) 2 × ( λ a 4 ) × h ( λ a 4 , λ 0 , σ , α ) × ( λ a 4 )
h ( λ , λ 0 , σ , α ) = λ ( G ( σ ) E ( α ) ) ( λ , λ 0 ) d λ
where λ 0 is the position of the Bragg edge, σ and α are the width and asymmetry of the edge, respectively, and a 1 ,   a 2 ,   a 3 , and a 4 are constants responsible for the two linear functions. The edge profile h ( λ , λ 0 , σ , α ) represents a normalized Gaussian integral G ( σ ) convoluted with a cut-off decaying exponential E ( α ) [40,41]. The model function provides four parameters (position, width, asymmetry, height of the edge). It has been reported that the resolution of interplanar spacing is not just determined by the energy resolution of the experimental setup (width of moderated neutron pulse Δ E / E ), but by the shift in the Bragg edge of the sample as well. The Bragg-edge fitting approach using an analytical function allows for accurate determination of the Bragg edge position with improved resolution to ~100 microstrain (μɛ) [32,39,42]. We have recently developed a Python-based graphical user interface (GUI), the so-called iBeatles [43], which facilitates automated data processing, analysis, and mapping reconstruction of the structural parameters (such as interplanar spacing) onto the radiograph. In the following results sections, the Bragg-edge radiographs are analyzed using the iBeatles software to extract the above-mentioned microstructure features and construct two-dimensional (2D) pixel-by-pixel maps of interplanar spacing.

3.2. Theoretical Model Based on Materials Properties, Scattering Properties, and Instrument Characteristics

The transmission T ( λ ) of a neutron beam through a polycrystalline material, containing a crystalline phase (cp), is given by
T ( λ ) = I ( λ ) I 0 ( λ ) = exp ( p σ t o t _ c p ( λ ) t c p ρ c p )
where I ( λ ) is the attenuated neutron intensity experienced by the incident intensity I 0 ( λ ) , σ t o t _ c p ( λ ) is the total cross-section for a unit cell of the crystalline phase, t c p is the thickness of the crystalline phase, and ρ c p is the number of unit cells per unit volume. The total cross-section results from five scattering effects represented by the absorption cross-section σ a b s _ c p ( λ ) , incoherent elastic cross-section σ i n c o h   e l a _ c p ( λ ) , incoherent inelastic cross-section σ i n c o h   i n e l a _ c p ( λ ) , coherent inelastic cross-section σ c o h   i n e l a _ c p ( λ ) , and coherent elastic scattering cross-section σ c o h   e l a _ c p ( λ ) . In general, the first four components ( σ a b s , σ i n c o h   e l a , σ i n c o h   i n e l a , and σ c o h   i n e l a ) are influenced by the composition and temperatures and have a smooth and continuous dependence as a function of the neutron wavelength (generally considered to vary as 1/v where v is the neutron velocity), and can be calculated from previous studies [44,45]. More importantly, the coherent elastic scattering cross-section depends on the crystalline structure properties (i.e., lattice structure, parameter, and orientation). To fit the coherent elastic scattering cross-section of a polycrystalline material, we have proposed the following expression:
σ c o h   e l a ( λ ) = λ 2 2 V 0 h k l 2 d h k l > λ | F h k l | 2 d h k l P ( α h ( λ ) ) E h k l ( λ , F h k l ) h ( Δ , σ , α , β )
where V 0 is the volume of the unit cell, F h k l is the structure factor, and d h k l is the (hkl) interplanar spacing. P ( α h ( λ ) ) accounts for the distribution of the crystallite orientation, which is calculated using the modified March–Dollase function [46], and E h k l ( λ , F h k l ) is Sabine’s primary extinction function needed to consider the crystallite size effect [47]. Briefly, the March–Dollase function [ P ( α h ( λ ) ) ] in Equation (4) includes two adjustable parameters; the degree of crystalline anisotropy ( r h k l ) and the most probable angle of preferred orientation ( β h k l ), which addresses the crystallographic orientation distribution. For example, r h k l = 1 indicates random orientation distribution, whereas anisotropic orientation distribution can be introduced by varying values of r h k l . The ‘ β h k l ’ factor determines angular position of the most probable grains. The Sabine’s primary extinction function [ E h k l ( λ , F h k l ) ] takes crystallite size into consideration (where S is a value that is related to the crystallite size); for example, as ‘S’ increases, the transmitted neutron intensity decreases due to the primary extinction phenomenon [48]. The last term h ( Δ , σ , α , β ) is the Bragg- edge profile function used to describe the edge broadening due to the width of the neutron pulse, strain, and microstructure of the sample [46]. In the present study, we have implemented this Bragg- edge model into a Python code (Lin, J.Y.Y., and Song, G., Bragg-edge modeling, 2017), which allows fitting the experimental results by adjusting the parameters, such as lattice parameter, the degree of crystalline anisotropy, and the most probable angle of preferred crystalline orientation. We are currently working on developing a Python-based interface that will expedite automated data processing, quantitative data analysis, and visualization of the crystallographic structures in two dimensions in materials. Thus, in the following section, this approach will be limited to the structural data analysis for certain regions of interest or whole sample areas.

4. Results and Discussion

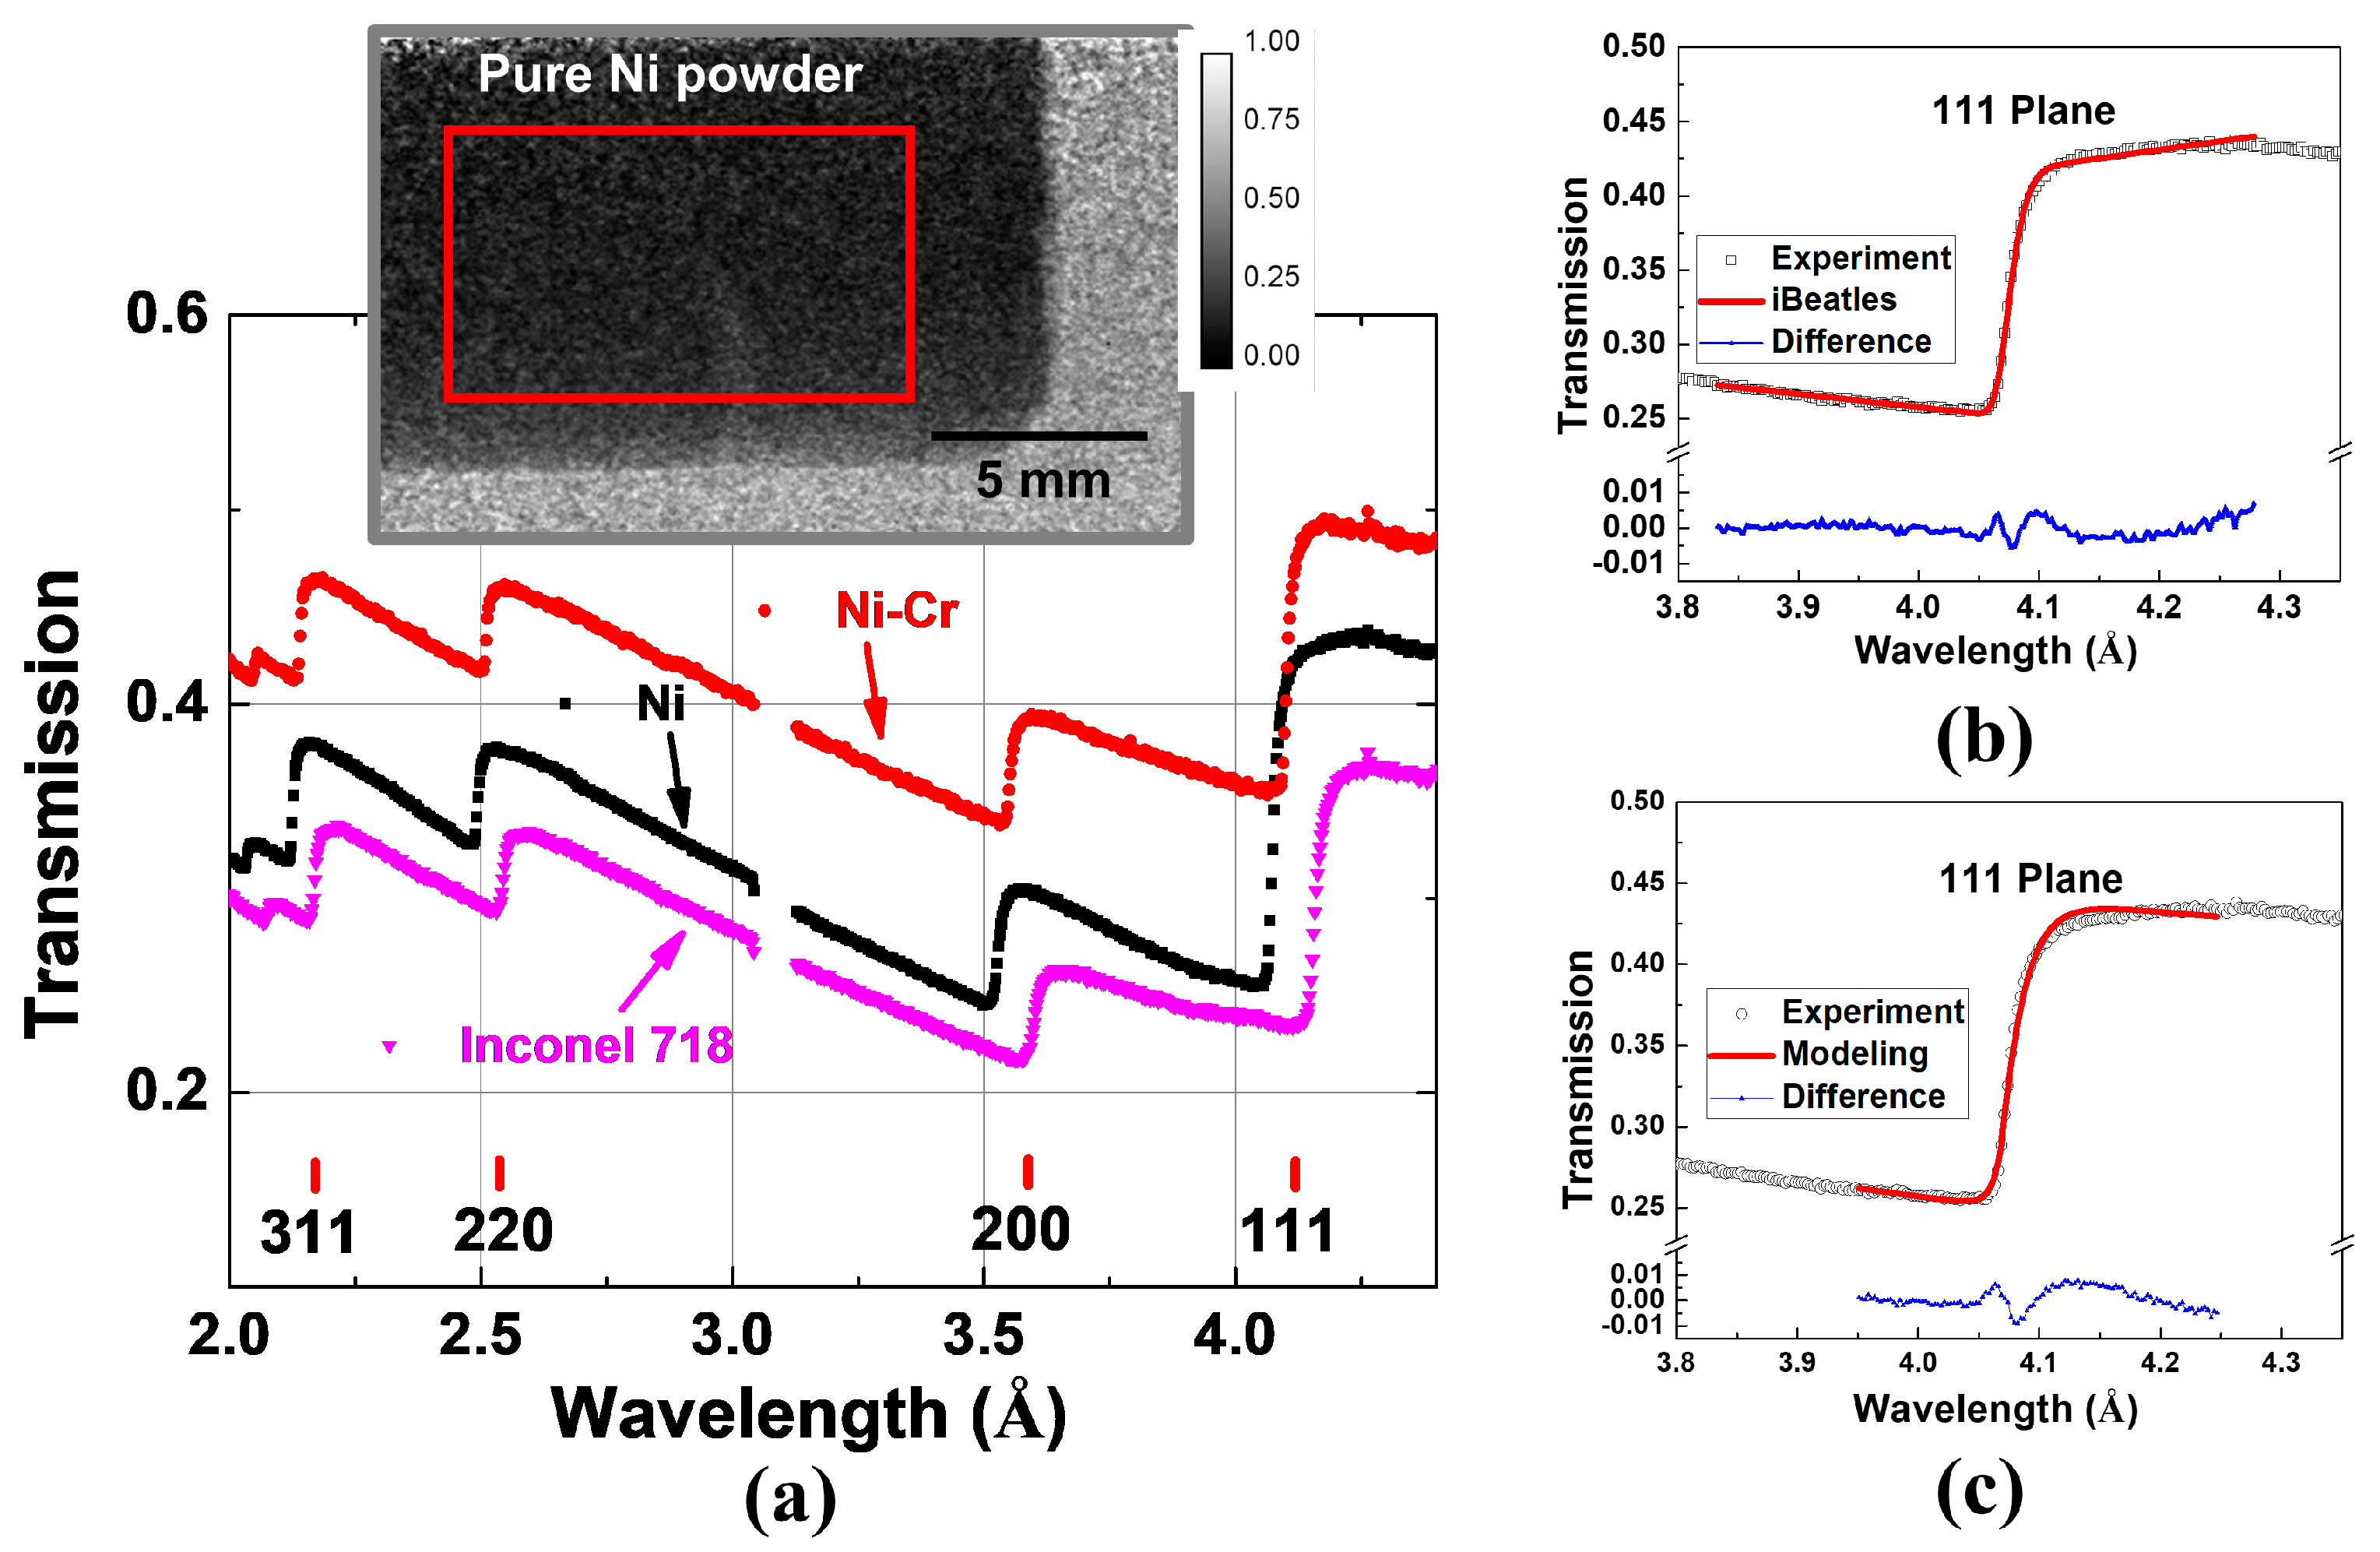
4.1. Powder Sample Measurements

Face-centered cubic (FCC) pure Ni, Ni39Cr11, and Inconel 718 powder samples were investigated using Bragg-edge radiography at room temperature at SNAP. Inconel 718 is known to be strengthened by γʹ, γʺ and δ precipitates whose volume fraction in the peak aged condition is less than 20 vol. % [49,50] (the composition of each precipitate is available in [51]). However, in the current study, the powder and AM samples have not been subjected to heat treatment, and were, thus, expected to contain less precipitates. Indeed, the Bragg edge features from the strengthening precipitates were not observed in the imaging results, which indicate limited volume fraction and low contrast. Therefore, the present study will focus mainly on the analysis of the solid solution FCC phase. Powder samples contain random distributions of grains (homogeneous microstructure) and, thus, Bragg edges do not exhibit texture-related features. For instance, a radiograph obtained from pure Ni powder at a wavelength of 3.52 Å (close to the 200 Bragg edge), shown in Figure 2a (radiograph in gray scale), displays a featureless dark contrast. Therefore, the selected region’s transmission of the sample, as denoted by a red region in Figure 2a, was averaged and analyzed for the structural analysis of the powder. Figure 2a presents relative transmission spectra of the pure Ni, Ni39Cr11, and Inconel 718 powder samples. For all powder samples, well-defined Bragg edges (abrupt increase in intensity) associated with the FCC structure are clearly observed with slightly-different edge positions due to the difference in interplanar spacing.
The Bragg edges indexed in Figure 2a correspond to the (hkl) planes of the FCC phase oriented perpendicular to the incident neutron beam; thus, the edge position corresponds to λ h k l = 2 d h k l . The (hkl) interplanar spacings of the powder samples were extracted by fitting the Bragg edges in Figure 2a using the two methods described in the “Quantitative data analysis of Bragg edges” section. The fitting results based on iBeatles and Bragg-edge modeling are presented in Figure 2b,c, respectively, for the (111) pure Ni powder. Both fitting curves are in good agreement with the experimental spectra. The extracted interplanar spacing values from the fitting of (111) and (200) planes are listed in Table 2. For comparison, the interplanar spacings derived from neutron diffraction measured at VULCAN are also included in Table 2. The interplanar spacings obtained from the different techniques are consistent with each other and exhibit a gradual increase due to the solid solution effect in Ni39Cr11 and Inconel 718.
In situ heating of the pure Ni powder sample was carried out to 873 K to study the evolution of the Bragg edge features as a function of temperature. One representative radiograph of the sample at room temperature is shown in the inset of Figure 3a, and the red region was selected to retrieve an average relative transmission spectrum at each temperature. Figure 3a displays the relative transmission spectra at room temperature, 573 K, and 873 K. As the temperature increases, the position and height of the Bragg edge varies. Specifically, the Bragg edge position values (i.e., interplanar spacings) gradually increase due to thermal expansion. The spectra in Figure 3a were quantitatively analyzed to extract the (111) and (200) interplanar spacings using the iBeatles and Bragg-edge modeling, respectively, and the values are listed in Table 3. The extracted values between the aforementioned fitting methods are in fair agreement. The temperature-dependent lattice strains ( ε ) were calculated using
ε = d h k l d h k l 0 d h k l 0
where d h k l and d h k l 0 represent the interplanar distance of the strained and unstrained conditions, respectively. Linear coefficients of thermal expansion (CTE) were derived by linear fitting the thermal strain vs. temperature in Figure 3b; the values are 1.577 × 10⁻⁵ K−1 and 1.756 × 10⁻⁵ K−1 for the Bragg-edge modeling and iBeatles, respectively. The value obtained from the Bragg-edge modeling is in better agreement with the average CTE of a commercial Ni (1.55 × 10⁻⁵ K−1 from 293 to 873 K) [52]. The fitting error for iBeatles is larger than that for Bragg-edge modeling but they are in fair agreement with each other considering the fitting error. Moreover, the height gradually decreases, especially after the (111) edge in Figure 3a. Based on the Bragg-edge modeling results, the value of Sabine’s function, which is related to the crystallite size, gradually increases. Thus, the height reduction is believed to be caused by the grain growth.

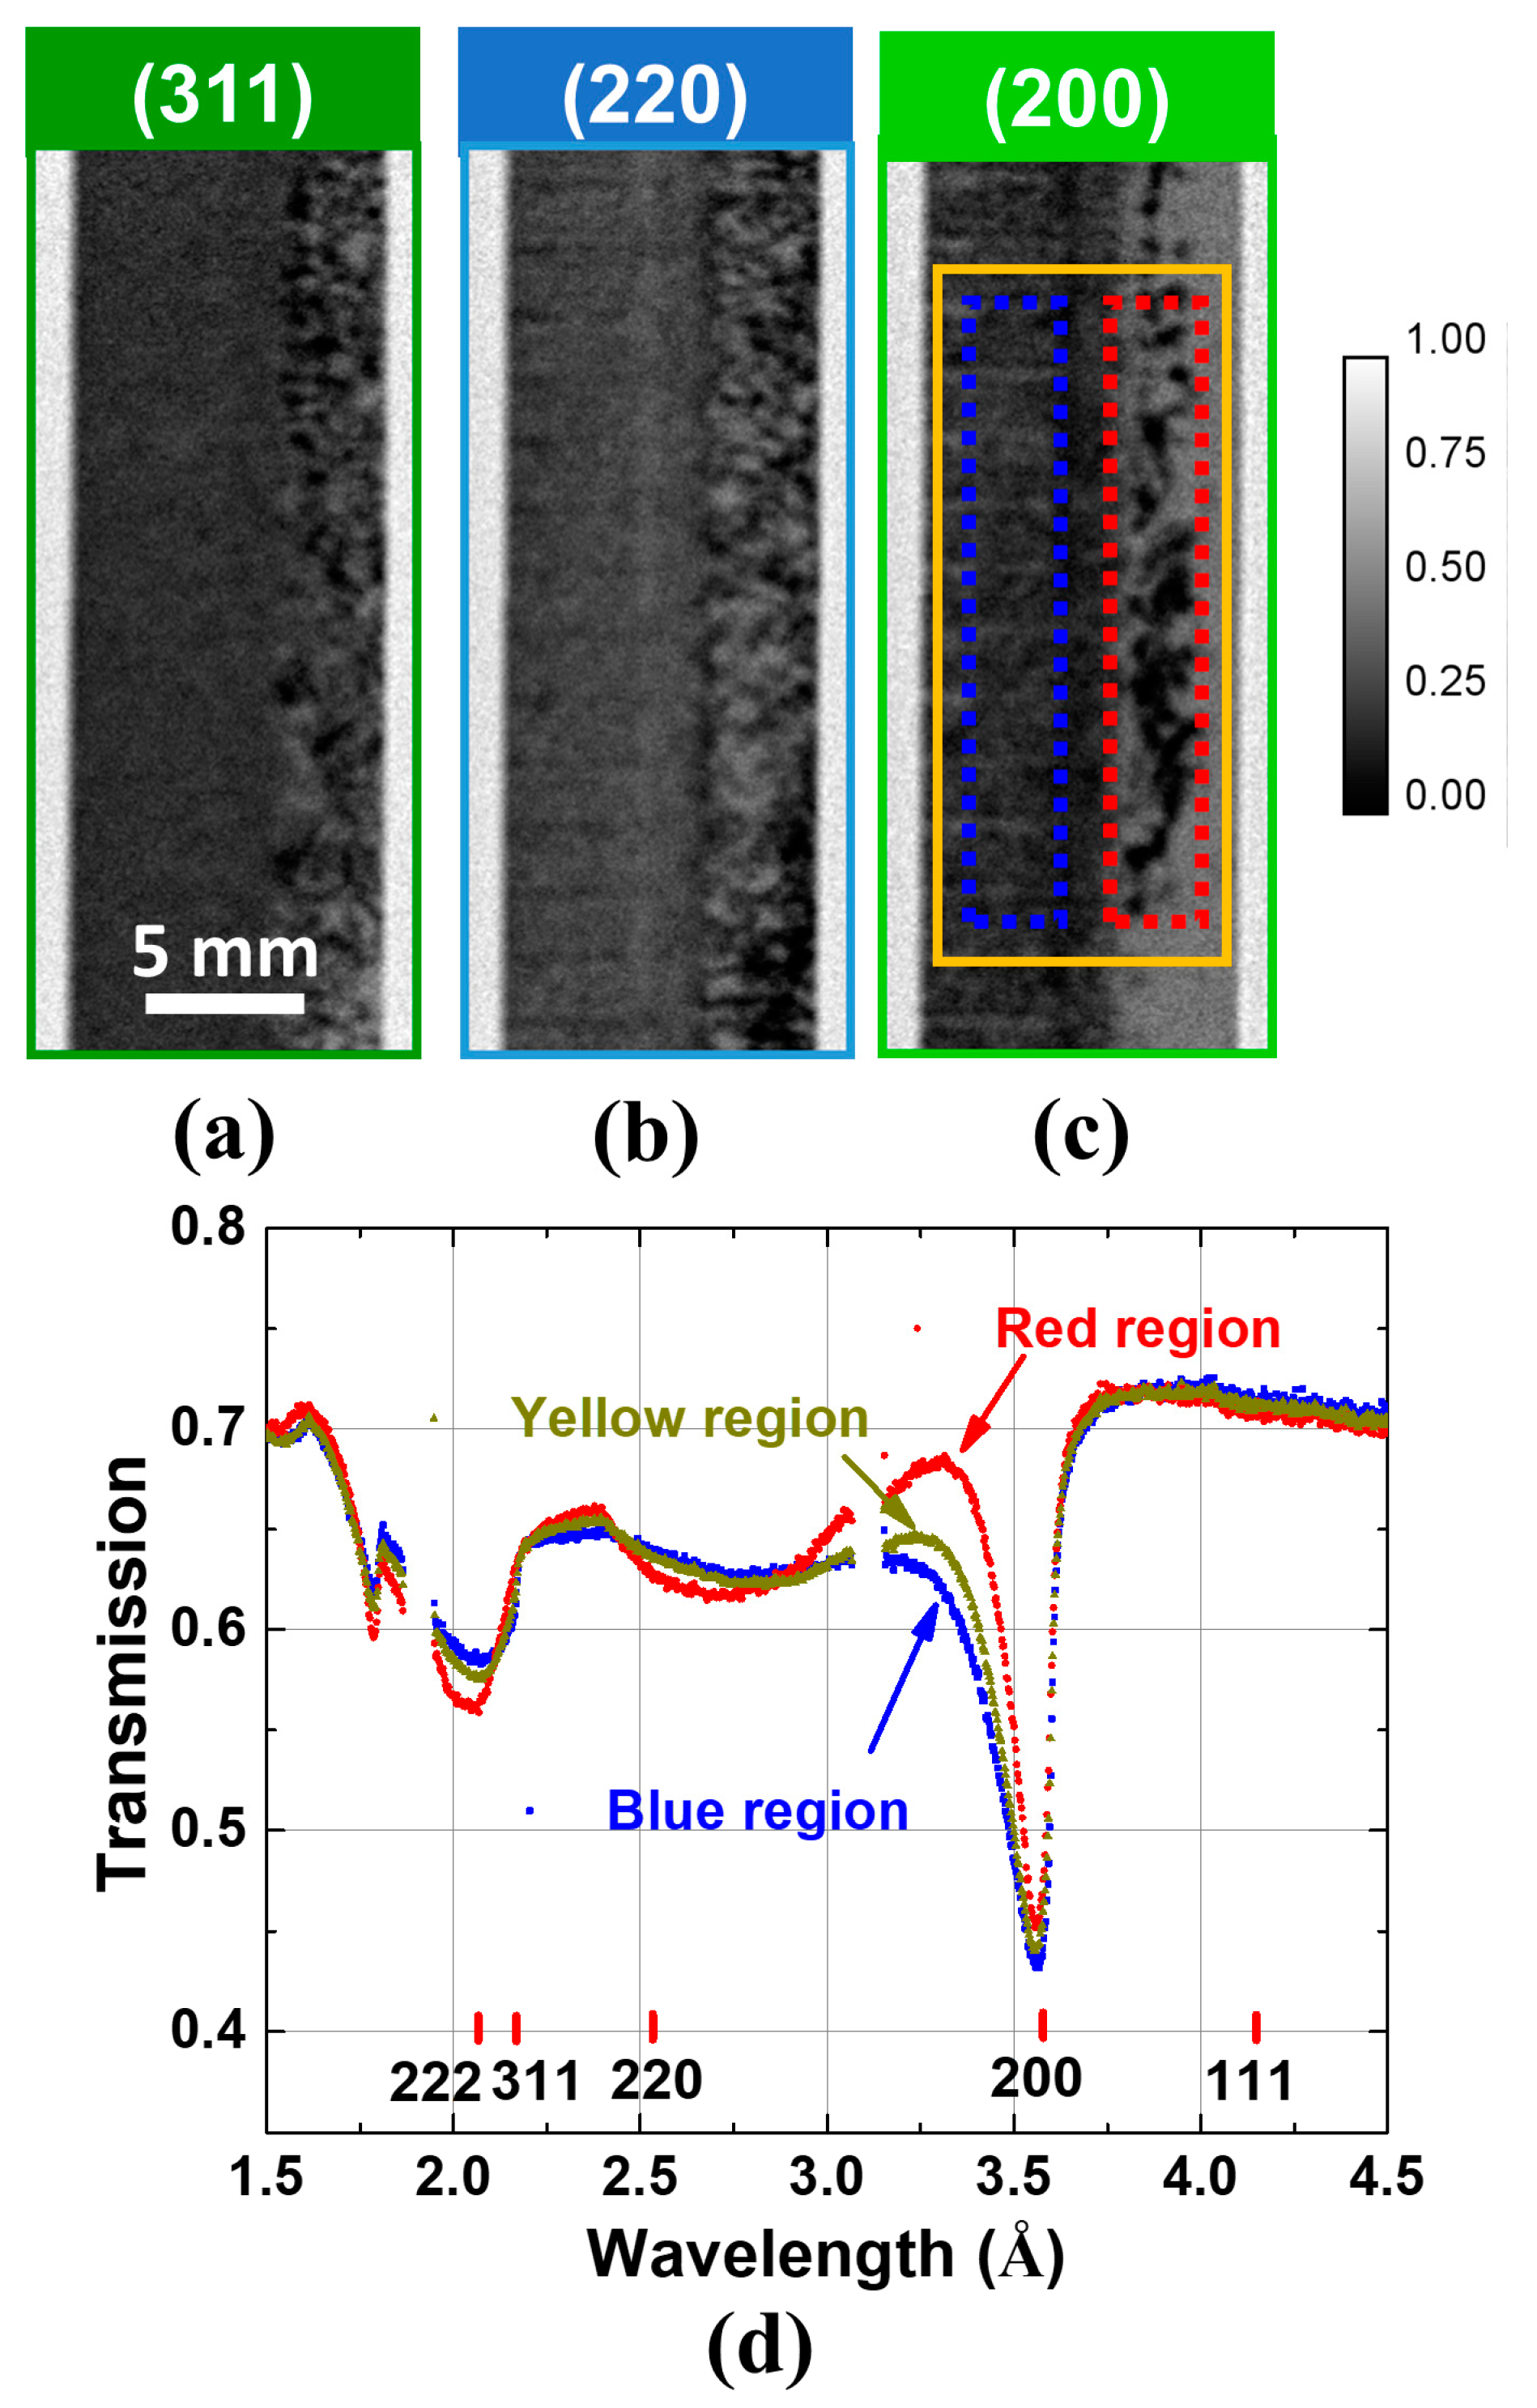
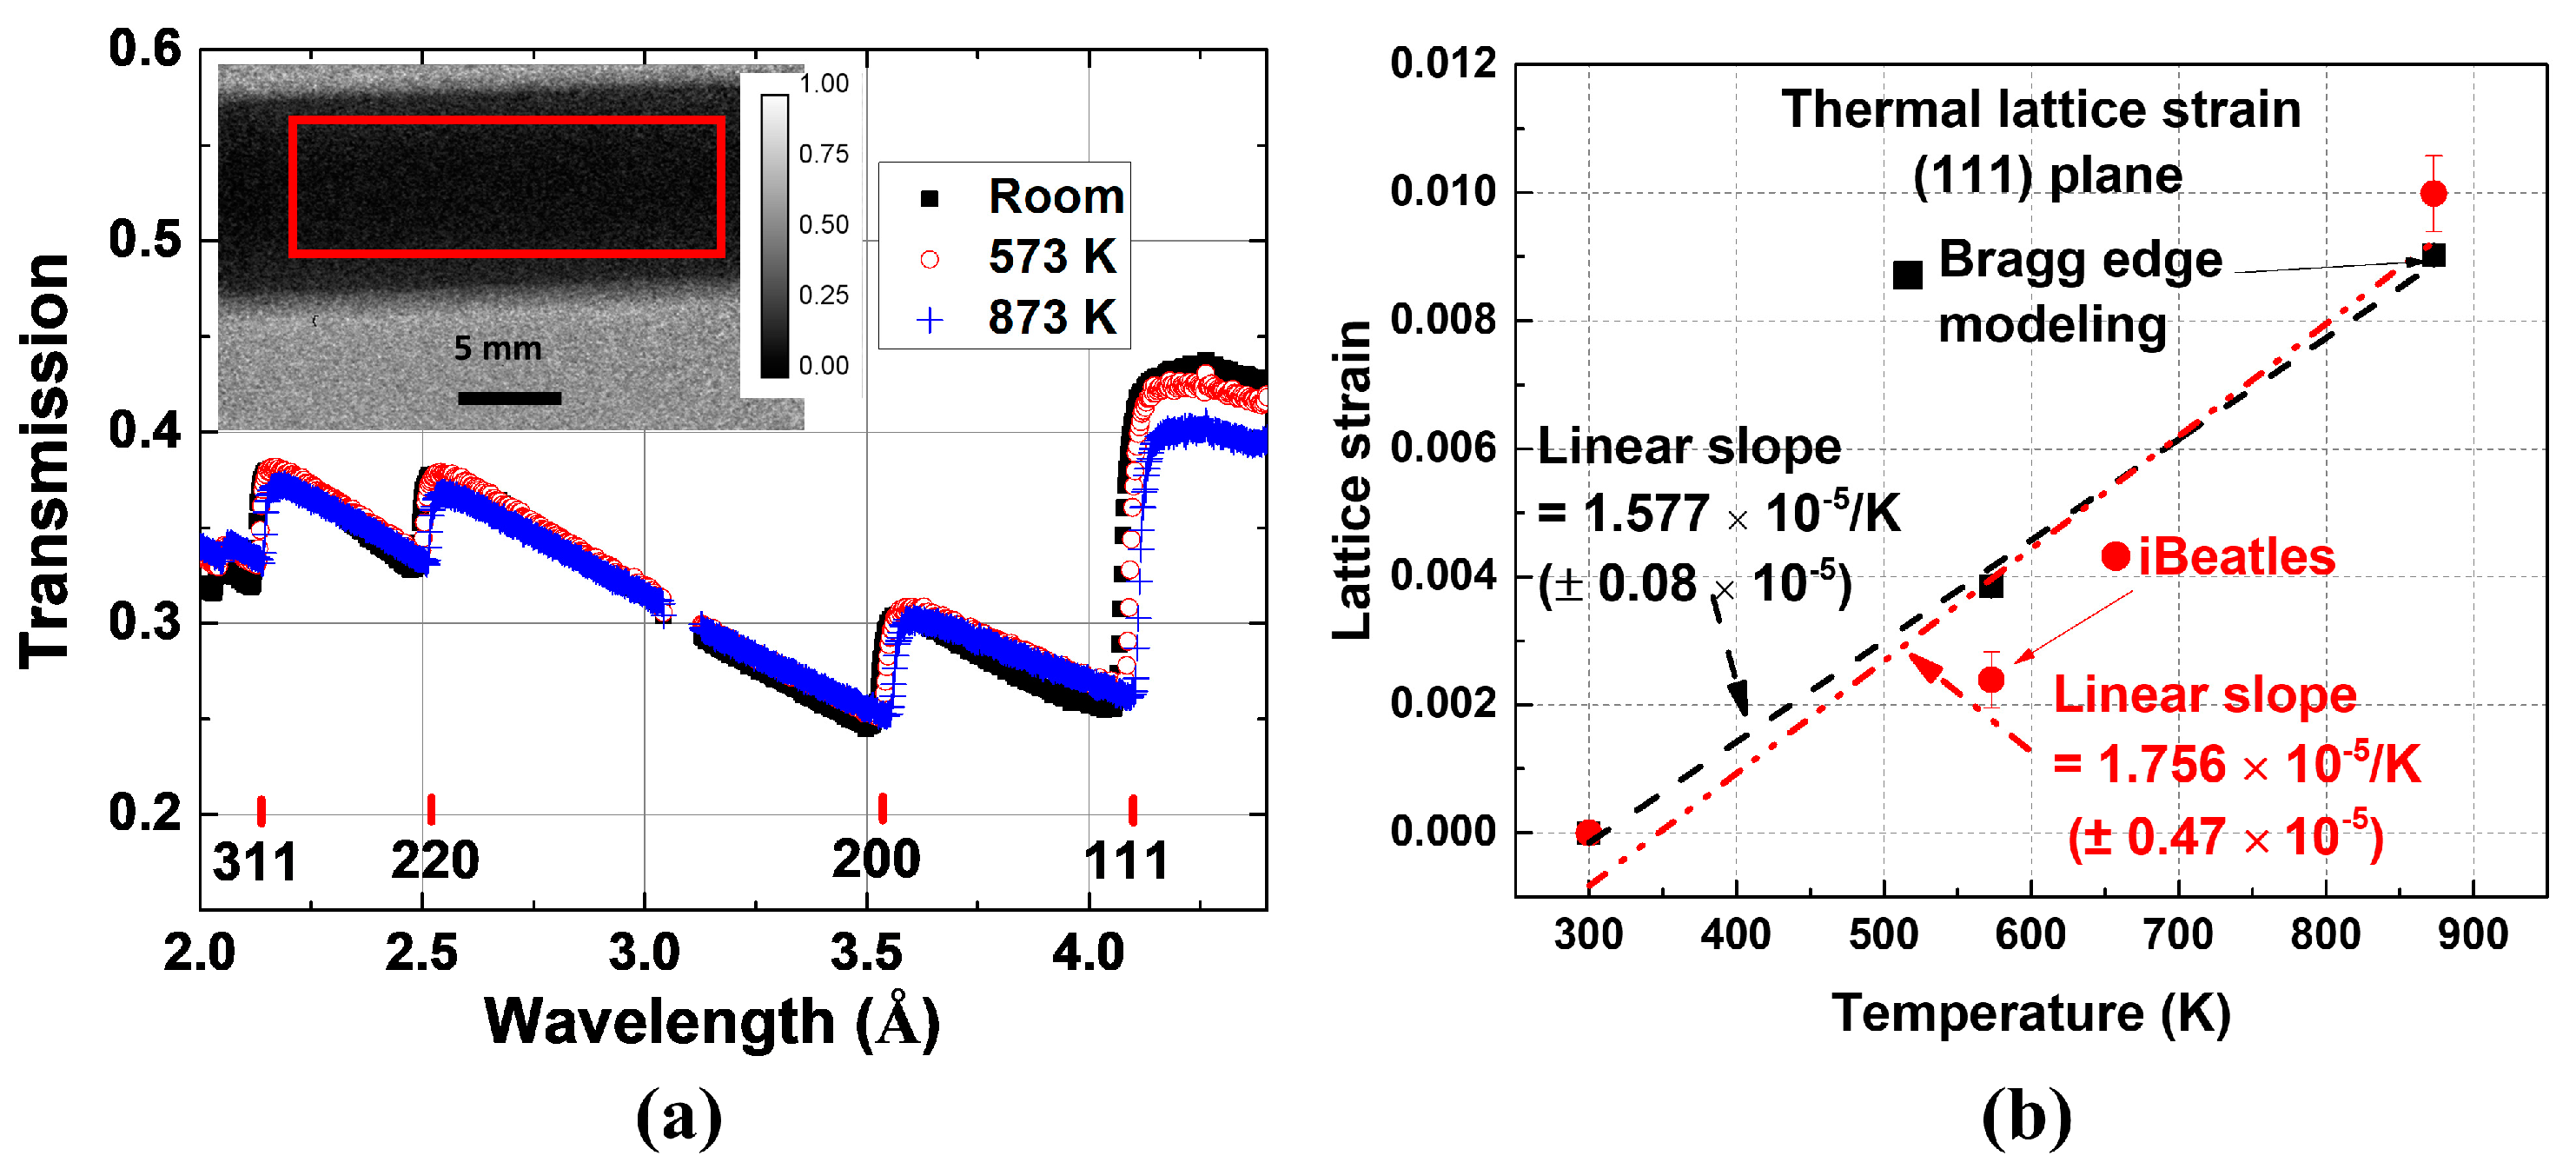
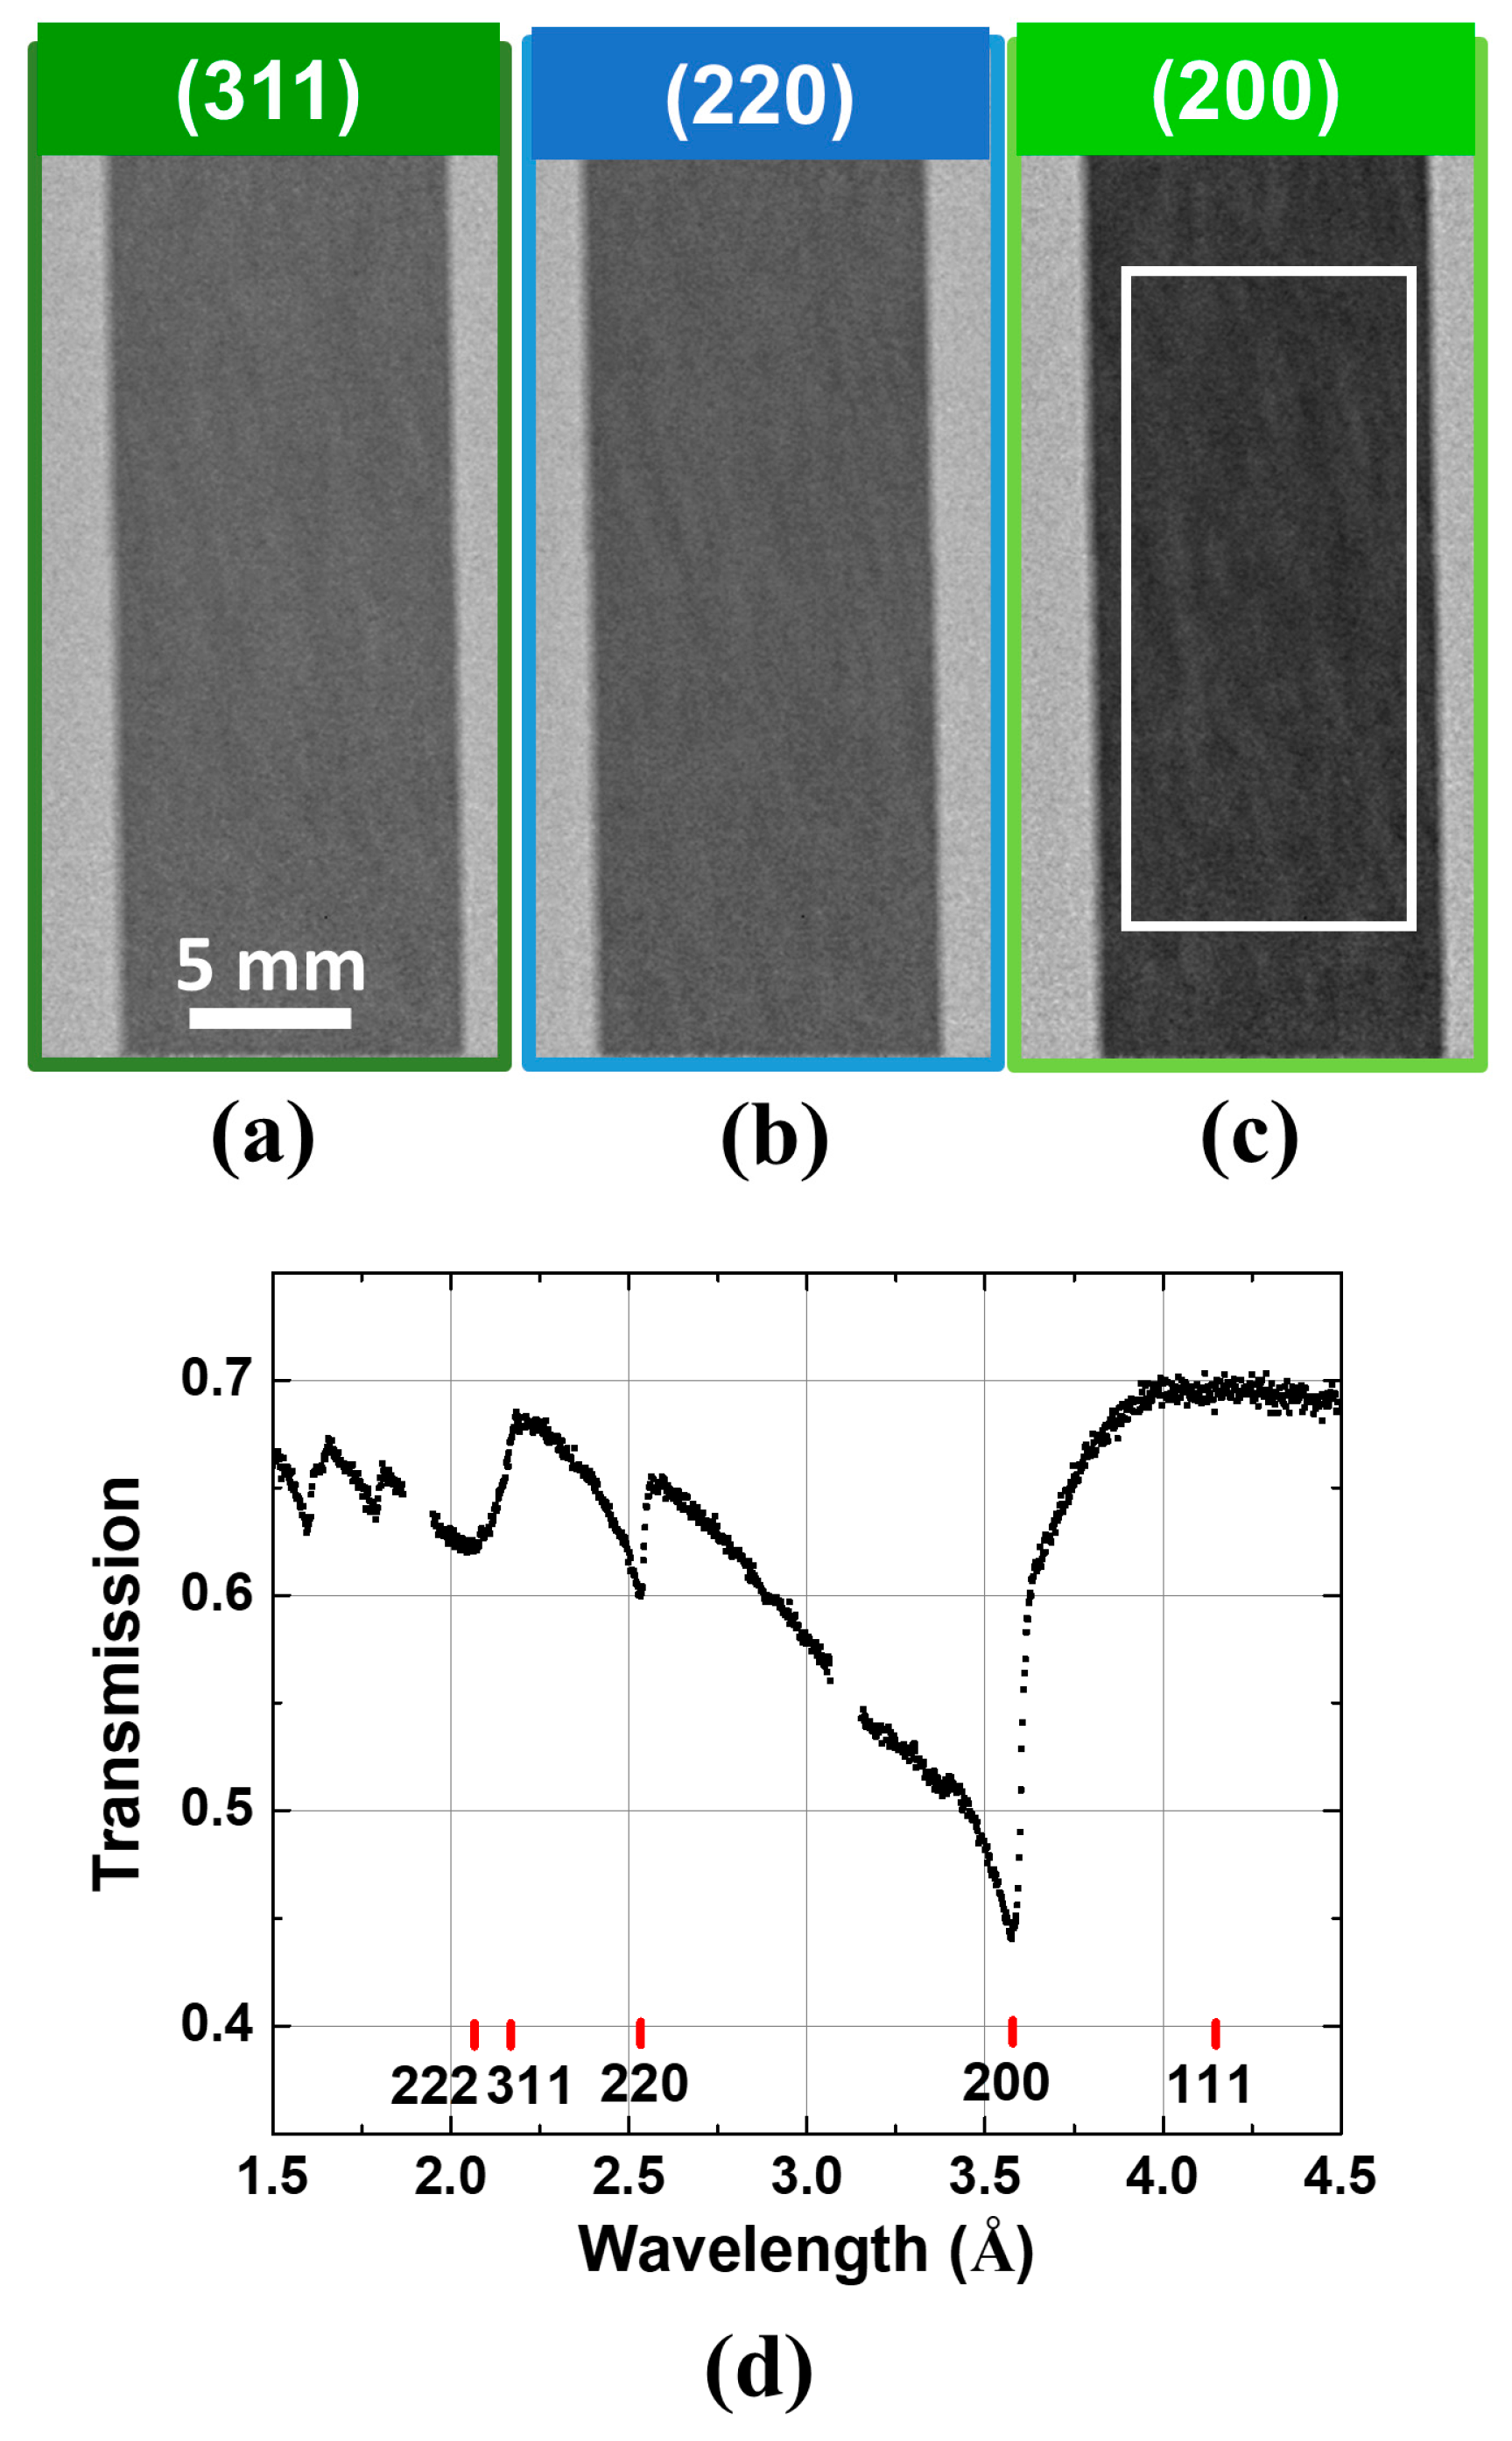
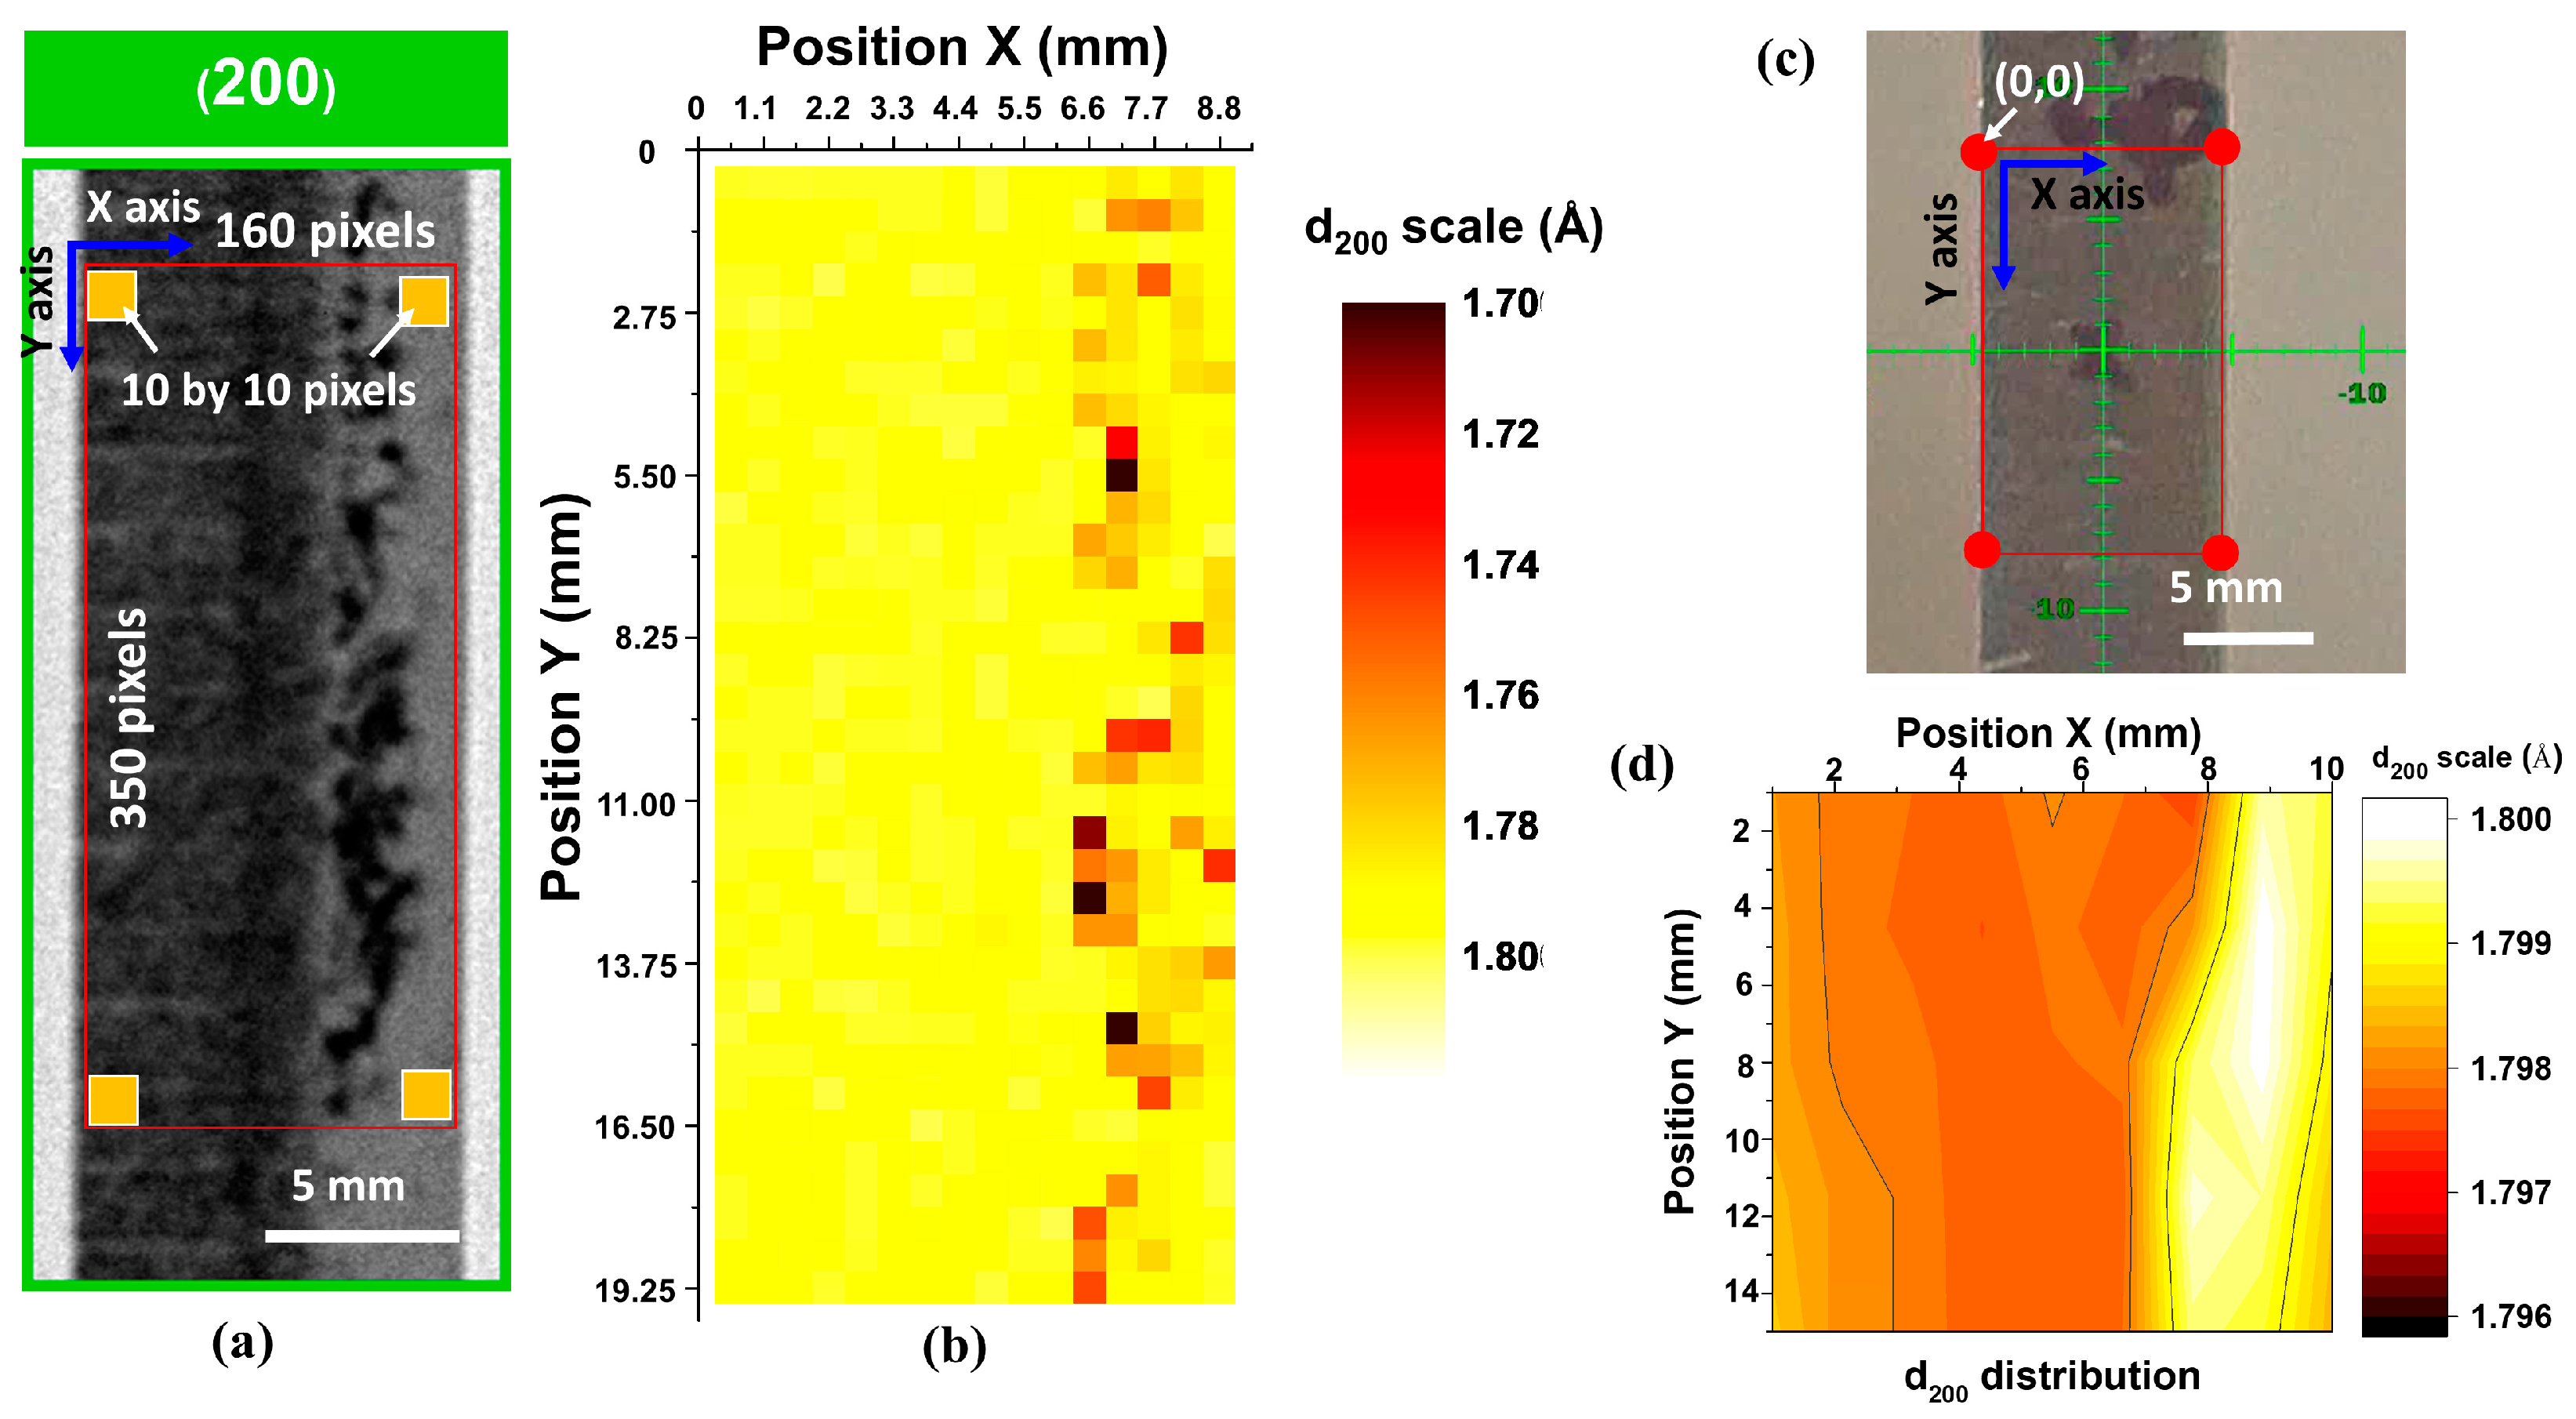
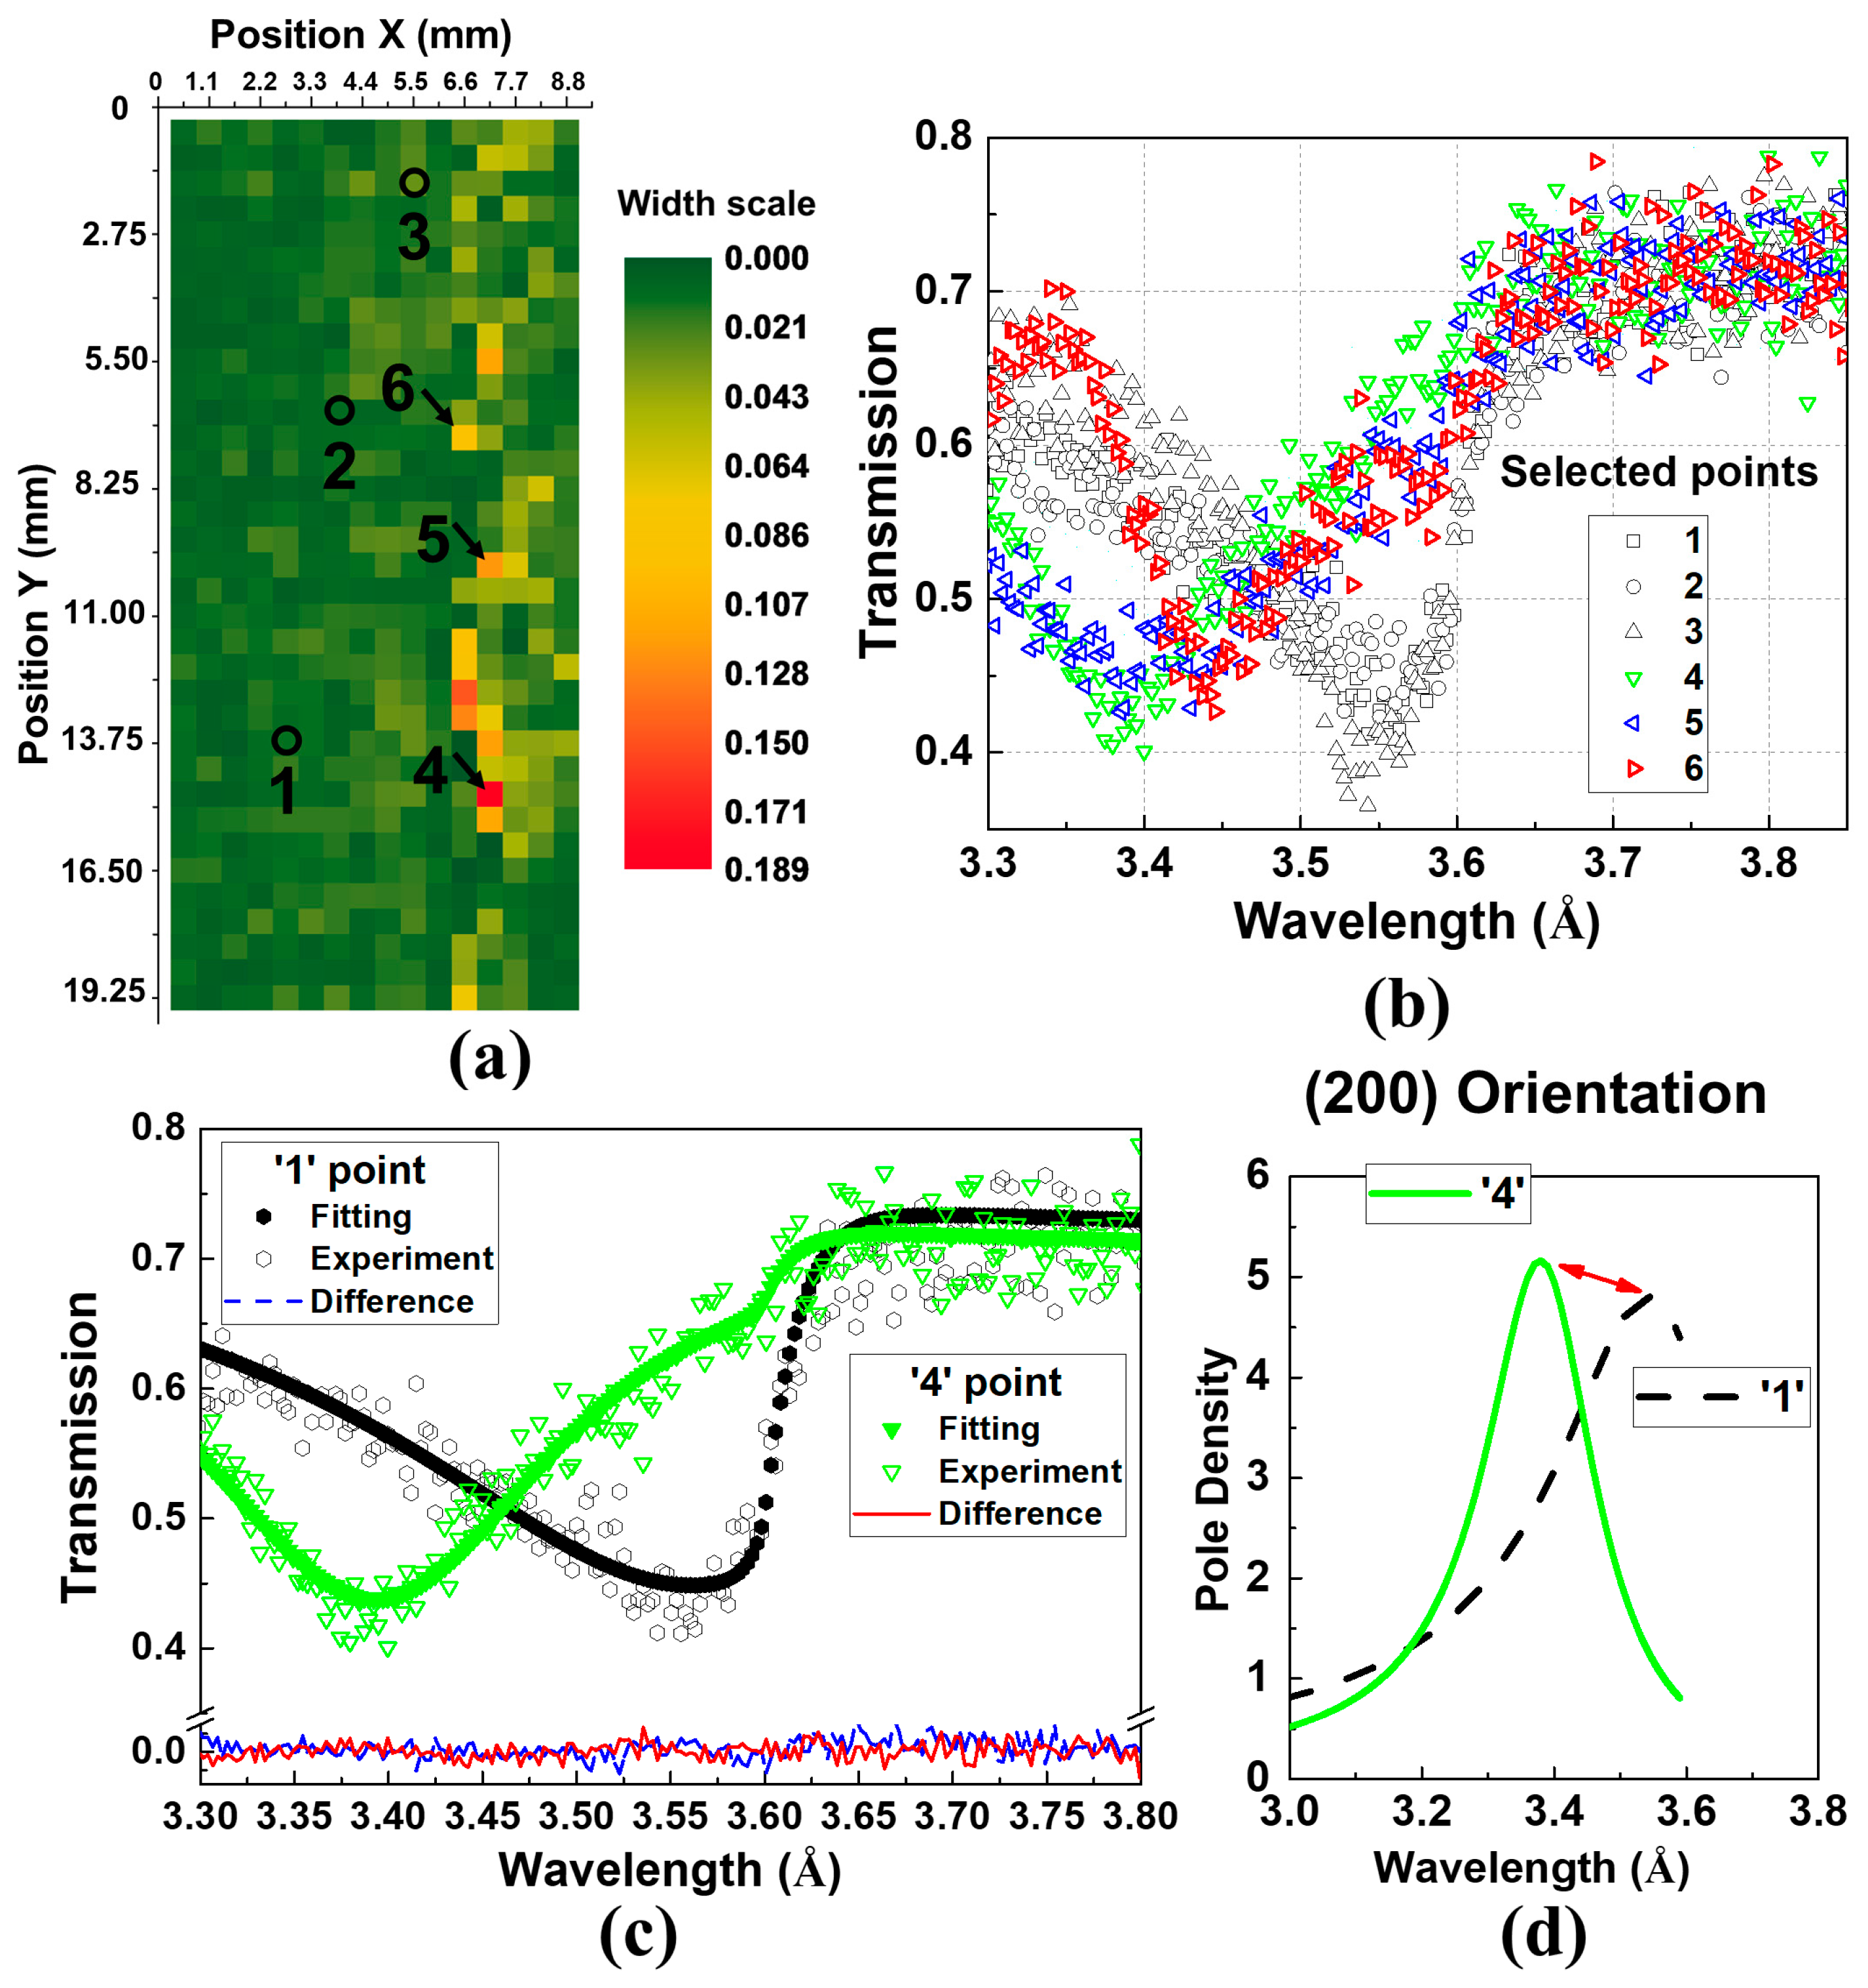
4.2. Microstructural Characterization of AM Inconel 718 Components

In this section, two AM Inconel 718 parts with different microstructures are investigated using Bragg-edge imaging. Figure 4 illustrates the two AM Inconel 718 parts and extracted tension samples. One component contained a strong cube texture homogenously distributed throughout the sample (single Col. sample), whereas spatial inhomogeneity of crystallographic texture was introduced to the other sample (dual Col. sample). The neutron imaging results were analyzed using iBeatles to extract the crystallographic features, such as lattice parameter, and to construct a 2D strain map. These Bragg edge results were compared with neutron diffraction for validation. Furthermore, we discuss the influence of the texture on the crystallographic parameters (lattice constant or interplanar spacing) derived by the two fitting methods. As mentioned before, the pixel-by-pixel analysis using the Bragg-edge modeling will be conducted in the future once the automated data analysis software becomes available.
In situ tension loading tests were conducted from 15 MPa to 550 MPa on the single Col. sample. The single Col. sample was measured with the Y-direction close to the neutron beam during loading. Figure 5 shows the radiographs and relative transmission spectrum for the single Col. sample at 15 MPa. The wavelength-dependent radiographs in Figure 5a–c were obtained at a wavelength close to the (311), (220), and (200) edges, respectively. Note that the wavelength near the edges was selected since the radiograph shows the microstructural features more clearly as compared to other wavelengths. These radiographs display weak stripe features along the oblique direction. The stripe features resemble the columnar grain structure observed in the electron backscatter diffraction (EBSD) image (Figure 4), which indicate that the radiography contrast results from the orientation of groups of grains averaged through the sample thickness. The transmission spectrum averaged over the selected white region in Figure 5d exhibits the strongly anisotropic grain distribution (for example, the strong (200) Bragg edge and the absence of the (111) edge), compared to the powder spectrum in (Figure 2a). In the given measurement geometry, no (111) grain is oriented perpendicular to the incident beam, which explains the absence of the (111) Bragg edge around 4.15 Å. A comparison of the transmission spectra for different regions of the sample reveals no obvious variation in the spectra shapes, which indicates homogenous distribution of the crystalline orientation throughout the sample.
The transmission spectra of the single Col. sample in Figure 5d at different loadings were analyzed by fitting the (200) Bragg edge, using iBeatles to extract its position (Figure 6a). Based on the (200) interplanar spacing, the elastic strain ε was derived from Equation (5). Similarly, in situ tension loading experiments were carried out at VULCAN using neutron diffraction for the single Col. sample. For comparison, the elastic strain evolution from the diffraction and transmission results are presented in Figure 6b. Figure 6c displays the configuration of in situ loading neutron diffraction at VULCAN. More details of the in situ loading neutron diffraction results on the single Col. sample will be reported elsewhere. The diffraction and imaging results in Figure 6b, acquired from the large sample volume (diffraction ≈ 3 × 3 × 3 mm3, transmission ≈ 2 × 3 × 5 mm3), show the consistent trend that the overall elastic strain of the (200) plane increases linearly with increasing applied stress (elastic deformation stage). Furthermore, the reconstruction of the (200) strain map was achieved by averaging 10 × 10 pixels on the radiographs (corresponding to a binning pixel size of 550 × 550 μm2) to study the distribution of the elastic strain during in situ loading (Figure 6d). A binning smaller than 10 × 10 gives rise to excessive statistical noise (i.e. a reduction in the strain accuracy), due to the relatively short acquisition time (20 min). The strain map in Figure 6d shows a few dark and bright areas, which should indicate high tensile and compressive strain. However, the corresponding Bragg edge spectra (not displayed here) of these binned pixels show that the abnormally strained sites seem to result from the low statistical data, which implies a longer measurement time is required to perform a more accurate mapping analysis. Despite the limited statistics, the (200) strain map from the single Col. sample exhibits the general trend of a gradual increase in the elastic strain as the applied stress increases, which is consistent with the averaged strain evolution in Figure 6b.
The dual Col. sample was measured using Bragg-edge radiography to characterize the microstructure and strain distribution (without loading). Figure 7 shows the transmission radiographs and relative transmission spectra for the dual Col. sample. The radiographs in Figure 7a– c were obtained at wavelengths close to the (311), (220), and (200) edges, respectively. The Bragg-edge radiographs show a strong contrast variation between the left and right sides of the sample, indicating the inhomogeneous microstructure in this sample. Specifically, the left side of the sample is uniform and featureless with weak horizontal stripes, which indicate the columnar grain forms along the Y-axis. In contrast, the right side shows inhomogeneous contrast, reflecting different grain morphology, as compared to the left side. The transmission spectra were obtained from the yellow area in Figure 7c. Particularly, in this position with respect to the beam, the dual Col. sample displays a strong (200) Bragg edge with no presence of the (111) edge (no (111) grain in this given measurement configuration). Transmission spectra in Figure 7d obtained from the left (blue square) and right (red square) sides of the dual Col. sample in Figure 7c exhibit a slight difference in the (200) edge shape (see red and blue spectra in Figure 7d).
Similar to the single Col. sample, data analysis was performed on the dual Col. sample by fitting the (200) Bragg edge in 10 × 10 binned pixels, as illustrated in Figure 8a. In Figure 8b, the (200) interplanar spacing map shows a large distribution of interplanar spacing from 1.7 to 1.8 Å. Moreover, the data points with low interplanar spacings are mainly distributed in the area that corresponds to the distribution of grains along the beam direction (see Figure 8a). Considering the (200) interplanar spacing of 1.797 Å determined from the fitting of the single Col. sample in Figure 6a, the abnormally low interplanar spacing of 1.7 Å corresponds to 55,000 με (see Figure 6b for comparison), and such a high strain value is not possible in the sample. Therefore, neutron diffraction mapping measurements were conducted over a sample area of 10 × 15 mm2 with a gauge volume of 2 × 3 × 3 mm3 (width × height × depth). By moving the sample at horizontal and vertical intervals of 1 mm (9 points) and 3 mm (5 points), respectively, 45 measurements were obtained (Figure 8c). For direct comparison with imaging, the (200) peak was analyzed using a single peak fitting to obtain the distribution of interplanar spacing, as presented in Figure 8d. The diffraction-based (200) plane map shows a slight variation of interplanar spacing distribution, but the range is significantly lower (1.796 to 1.800 Å) than for imaging (see Figure 8b).
Since the width of the Bragg edge is known to be influenced by microscopic strain and instrument parameters [31,53], the width of the Bragg edge ( σ 200 ) was examined from the iBeatles fitting results. The maps of the (200) Bragg edge width ( σ 200 ) for the dual Col. sample, which is a measure of edge sharpness, are shown in Figure 9a. Interestingly, the distribution of the edge width for the (200) plane is similar to that of the interplanar spacing in Figure 8b. Particularly, the left part of the dual Col. sample shows a narrow edge width (less than 0.03), but the right part exhibits higher values (up to 0.188), as seen in the brighter color points. Representative data points were selected, as marked by the black circles and arrows in Figure 9a, to plot the transmission spectra, as displayed in Figure 9b. The Bragg edges obtained from the circles are sharp and have narrow widths, comparable to the ones in Figure 7d. However, Bragg edges with considerably larger widths are observed on the right side of the sample (edges obtained from the arrows) where the interplanar spacing is smaller. As mentioned before, such a high strain (low interplanar spacing) cannot be accommodated and the effect of instrument parameters can be ruled out in this present study. In the past, the significance and influence of texture structure on the shape of the wavelength-dependent transmission spectrum has been reported using both theoretical and experimental approaches [25,54]. Thus, grain orientation (crystallographic texture) was postulated to be another effect dominating the broadened Bragg edge. Texture can affect the analysis performed by iBeatles since the code is based on a single Bragg-edge analysis in which the edge is generated exclusively by the grains oriented perpendicular to the incident beam. In other words, iBeatles can give rise to misleading quantitative analysis of Bragg edges affected by other microstructural features, such as secondary phase and strong crystallographic grain orientation.
To justify this hypothesis, the Bragg edges selected from Figure 9b were analyzed using Bragg-edge modeling, as shown in Figure 9c. In this analysis, the (200) interplanar spacings and orientation-related factors, such as the degree of crystalline anisotropy ( r h k l ) and the most probable angle of preferred orientation ( β h k l ), were taken into consideration while the broadening parameters [ h ( Δ , σ , α , β ) ] were fixed. The (200) interplanar spacings retrieved from the two most accurate (i.e. minimum error) fittings are identical (≈1.7992 Å). However, the orientation fittings show that the difference in the observed broadening is affected by the distribution of the grain orientation ( P ( α h ( λ ) ) ). The P ( α h ( λ ) ) distribution from the March–Dollase function accounts for the crystallographic distribution of the crystal lattice planes with respect to the beam direction. For instance, the P ( α h ( λ ) ) distribution in Figure 9d shows the distribution of the grain orientation. Specifically, the difference in the distribution of the (200) pole density (Figure 9d) gives rise to the broadened (200) Bragg edge (Figure 9c). Based on these results, the Bragg-edge theoretical modeling is considered a more advanced and accurate method that provides quantitative information regarding crystal structure, lattice spacing, and angular orientation of grains for complex-structured materials with strong texture, dual phases, or structural inhomogeneity.

5. Conclusions

We have investigated the crystal structures of metallic powders and additively manufactured Inconel 718 samples using wavelength-dependent neutron (Bragg-edge) imaging. To quantitatively analyze the Bragg-edge spectrum—for instance, precisely extract lattices or (hkl) interplanar spacings—two different analytical fitting methods employing phenomenological (iBeatles) and materials-scattering instrument-based (Bragg-edge modeling) calculations were applied. Neutron diffraction was performed to validate Bragg-edge imaging retrieved by the two analysis methods. For the powder samples (pure Ni, Ni39Cr11, and Inconel 718) with the random grain orientation (no texture), the two methods successfully estimated the lattice spacings and coefficient of thermal expansion. However, the complex grain anisotropy (strong texture) in the AM Inconel 718 samples gives rise to the broadening phenomenon of Bragg edges, yielding an underestimation of the interplanar spacing by iBeatles analysis. By considering the grain orientation in the Bragg-edge modeling, the modeling results show good agreement with neutron diffraction. This study suggests that the quantitative analysis of wavelength-dependent neutron imaging results should be carefully conducted by a proper analysis method depending on the microstructure of the materials.

Acknowledgments

This research was sponsored by the Laboratory Directed Research and Development Program of ORNL, managed by UT-Battelle LLC, for DOE. Resources at the High Flux Isotope Reactor and Spallation Neutron Source, U.S. DOE Office of Science User Facilities operated by ORNL, were used in this research. Research at the Manufacturing Demonstration Facility (MDF) was sponsored by the U.S. Department of Energy, Office of Energy Efficiency and Renewable Energy, Advanced Manufacturing Office, under contract DE-AC05- 00OR22725 with UT-Battelle, LLC. The team thanks M. Frost and R. Mills for setting up the detector and furnace at the SNS beamlines. The team would like to thank Prof. Dayakar Penumadu, from the University of Tennessee-Knoxville for providing the load frame during the imaging experiments at SNAP.

Author Contributions

G.S. and H.Z.B. conceived and designed the experiments; G.S., H.Z.B., J.J.M., H.D.S., A.M.D.S., C.A.T., K.A., A.D.S., J.C.B., A.S.T., J.B., L.M.S.-K. performed the experiments; G.S. and Q.X. analyzed the data; J.Y.Y.L. and G.S. developed the Bragg edge modeling, J.C.B. developed iBeatles. M.M.K. and R.R.D. provided AM materials; G.S. wrote the paper. All authors discussed the results and implications and commented on the manuscript at all stages.

Conflicts of Interest

The authors declare no conflict of interest. The founding sponsors had no role in the design of the study; in the collection, analyses, or interpretation of data; in the writing of the manuscript, nor in the decision to publish the results.

References

  1. Cekanova, M.; Donnell, R.; Bilheux, H.; Bilheux, J. 2014 Annual oak ridge national laboratory biomedical science and engineering center conference. In Proceedings of the Biomedical Science and Engineering Center Conference (BSEC), Oak Ridge, TN, USA, 6–8 May 2014; pp. 1–4. [Google Scholar]
  2. Jorgensen, S.W.; Johnson, T.A.; Payzant, E.A.; Bilheux, H.Z. Anisotropic storage medium development in a full-scale, sodium alanate-based, hydrogen storage system. Int. J. Hydrogen Energy 2016, 41, 13557–13574. [Google Scholar] [CrossRef]
  3. Chen, Y.; Cheng, Y.; Li, J.; Feygenson, M.; Heller, W.T.; Liang, C.; An, K. Lattice-cell orientation disorder in complex spinel oxides. Adv. Energy Mater. 2017, 7, 1601950. [Google Scholar] [CrossRef]
  4. Huang, H.; Wu, Y.; He, J.; Wang, H.; Liu, X.; An, K.; Wu, W.; Lu, Z. Phase-transformation ductilization of brittle high-entropy alloys via metastability engineering. Adv. Mater. 2017, 29, 1701678. [Google Scholar] [CrossRef] [PubMed]
  5. Wang, Y.D.; Tian, H.; Stoica, A.D.; Wang, X.L.; Liaw, P.K.; Richardson, J.W. The development of grain-orientation-dependent residual stressess in a cyclically deformed alloy. Nat. Mater. 2003, 2, 101–106. [Google Scholar] [CrossRef] [PubMed]
  6. Santodonato, L.J.; Zhang, Y.; Feygenson, M.; Parish, C.M.; Gao, M.C.; Weber, R.J.K.; Neuefeind, J.C.; Tang, Z.; Liaw, P.K. Deviation from high-entropy configurations in the atomic distributions of a multi-principal-element alloy. Nat. Commun. 2015, 6, 5964. [Google Scholar] [CrossRef] [PubMed]
  7. Stoica, G.M.; Stoica, A.D.; Miller, M.K.; Ma, D. Temperature-dependent elastic anisotropy and mesoscale deformation in a nanostructured ferritic alloy. Nat. Commun. 2014, 5, 5178. [Google Scholar] [CrossRef] [PubMed]
  8. Wu, W.; Liaw, P.K.; An, K. Unraveling cyclic deformation mechanisms of a rolled magnesium alloy using in situ neutron diffraction. Acta Mater. 2015, 85, 343–353. [Google Scholar] [CrossRef]
  9. Song, G.; Sun, Z.; Li, L.; Xu, X.; Rawlings, M.; Liebscher, C.H.; Clausen, B.; Poplawsky, J.; Leonard, D.N.; Huang, S.; et al. Ferritic alloy with extreme creep resistance via coherent hierarchical precipitates. Sci. Rep. 2015, 5, 16327. [Google Scholar] [CrossRef] [PubMed]
  10. Song, G.; Sun, Z.; Li, L.; Clausen, B.; Zhang, S.Y.; Gao, Y.; Liaw, P.K. High temperature deformation mechanism in hierarchical and single precipitate strengthened ferritic alloys by in situ neutron diffraction studies. Sci. Rep. 2017, 7, 45965. [Google Scholar] [CrossRef] [PubMed]
  11. Garlea, E.; King, M.O.; Galloway, E.C.; Boyd, T.L.; Smyrl, N.R.; Bilheux, H.Z.; Santodonato, L.J.; Morrell, J.S.; Leckey, J.H. Identification of lithium hydride and its hydrolysis products with neutron imaging. J. Nucl. Mater. 2017, 485, 147–153. [Google Scholar] [CrossRef]
  12. Zhou, H.; An, K.; Allu, S.; Pannala, S.; Li, J.; Bilheux, H.Z.; Martha, S.K.; Nanda, J. Probing multiscale transport and inhomogeneity in a lithium-ion pouch cell using in situ neutron methods. ACS Energy Lett. 2016, 1, 981–986. [Google Scholar] [CrossRef]
  13. Nanda, J.; Bilheux, H.; Voisin, S.; Veith, G.M.; Archibald, R.; Walker, L.; Allu, S.; Dudney, N.J.; Pannala, S. Anomalous discharge product distribution in lithium-air cathodes. J. Phys. Chem. C. 2012, 116, 8401–8408. [Google Scholar] [CrossRef]
  14. Perfect, E.; Cheng, C.L.; Kang, M.; Bilheux, H.Z.; Lamanna, J.M.; Gragg, M.J.; Wright, D.M. Neutron imaging of hydrogen-rich fluids in geomaterials and engineered porous media: A review. Earth Sci. Rev. 2014, 129, 120–135. [Google Scholar] [CrossRef]
  15. Warren, J.M.; Bilheux, H.; Kang, M.; Voisin, S.; Cheng, C.; Horita, J.; Perfect, E. Neutron imaging reveals internal plant water dynamics. Plant Soil 2013, 366, 683–693. [Google Scholar] [CrossRef]
  16. Ossler, F.; Santodonato, L.J.; Bilheux, H.Z. In-situ neutron imaging of hydrogenous fuels in combustion generated porous carbons under dynamic and steady state pressure conditions. Carbon 2017, 116, 766–776. [Google Scholar] [CrossRef]
  17. Kardjilov, N.; Manke, I.; Hilger, A.; Strobl, M.; Banhart, J. Neutron imaging in materials science. Mater. Today 2011, 14, 248–256. [Google Scholar] [CrossRef]
  18. Kockelmann, W.; Frei, G.; Lehmann, E.H.; Vontobel, P.; Santisteban, J.R. Energy-selective neutron transmission imaging at a pulsed source. Nucl. Instrum. Methods Phys. Res. Sect. A 2007, 578, 421–434. [Google Scholar] [CrossRef]
  19. Tremsin, A.S.; McPhate, J.B.; Kockelmann, W.; Vallerga, J.V.; Siegmund, O.H.W.; Feller, W.B. High resolution Bragg-edge transmission spectroscopy at pulsed neutron sources: Proof of principle experiments with a neutron counting MCP detector. Nucl. Instrum. Methods Phys. Res. Sect. A 2011, 633, S235–S238. [Google Scholar] [CrossRef]
  20. Tremsin, A.; Vallerga, J.; McPhate, J.; Siegmund, O. Optimization of high count rate event counting detector with Microchannel Plates and quad Timepix readout. Nucl. Instrum. Methods Phys. Res. Sect. A 2015, 787, 20–25. [Google Scholar] [CrossRef]
  21. Parker, J.D.; Harada, M.; Hattori, K.; Iwaki, S.; Kabuki, S.; Kishimoto, Y.; Kubo, H.; Kurosawa, S.; Matsuoka, Y.; Miuchi, K.; et al. Applications of a micro-pixel chamber (μPIC) based, time-resolved neutron imaging detector at pulsed neutron beams. J. Phys. Conf. Ser. 2014, 502, 012048. [Google Scholar] [CrossRef]
  22. Kiyanagi, Y.; Kamiyama, T.; Kino, K.; Sato, H.; Sato, S.; Uno, S. Pulsed neutron imaging using 2-dimensional position sensitive detectors. J. Inst. 2014, 9, C07012. [Google Scholar] [CrossRef]
  23. Tremsin, A.S.; McPhate, J.B.; Vallerga, J.V.; Siegmund, O.H.; Feller, W.B.; Bilheux, H.Z.; Molaison, J.J.; Tulk, C.A.; Crow, L.; Cooper, R.G.; et al. Transmission Bragg-edge spectroscopy measurements at ORNL Spallation Neutron Source. J. Phys. Conf. Ser. 2010, 251, 012069. [Google Scholar] [CrossRef]
  24. Woracek, R.; Penumadu, D.; Kardjilov, N.; Hilger, A.; Strobl, M.; Wimpory, R.C.; Manke, I.; Banhart, J. Neutron Bragg-edge-imaging for strain mapping under in situ tensile loading. J. Appl. Phys. 2011, 109, 093506. [Google Scholar] [CrossRef]
  25. Santisteban, J.R.; Vicente-Alvarez, M.A.; Vizcaino, P.; Banchik, A.D.; Vogel, S.C.; Tremsin, A.S.; Vallerga, J.V.; McPhate, J.B.; Lehmann, E.; Kockelmann, W. Texture imaging of zirconium based components by total neutron cross-section experiments. J. Nucl. Mater. 2012, 425, 218–227. [Google Scholar] [CrossRef]
  26. Boin, M.; Hilger, A.; Kardjilov, N.; Zhang, S.Y.; Oliver, E.C.; James, J.A.; Randau, C.; Wimpory, R.C. Validation of Bragg-edge experiments by Monte Carlo simulations for quantitative texture analysis. J. Appl. Crystallogr. 2011, 44, 1040–1046. [Google Scholar] [CrossRef]
  27. Boin, M.; Wimpory, R.C.; Hilger, A.; Kardjilov, N.; Zhang, S.Y.; Strobl, M. Monte Carlo simulations for the analysis of texture and strain measured with Bragg-edge neutron transmission. J. Phys. Conf. Ser. 2012, 340, 012022. [Google Scholar] [CrossRef]
  28. Woracek, R.; Penumadu, D.; Kardjilov, N.; Hilger, A.; Boin, M.; Banhart, J.; Manke, I. 3D mapping of crystallographic phase distribution using energy-selective neutron tomography. Adv. Mater. 2014, 26, 4069–4073. [Google Scholar] [CrossRef] [PubMed]
  29. Wensrich, C.; Hendriks, J.; Meylan, M. Bragg-edge neutron transmission strain tomography in granular systems. Strain. 2016, 52, 80–87. [Google Scholar] [CrossRef]
  30. Tremsin, A.S.; Kockelmann, W.; Paradowska, A.M.; Shu, Y.Z.; Korsunsky, A.M.; Shinohara, T.; Feller, W.B.; Lehmann, E.H. Investigation of microstructure within metal welds by energy resolved neutron imaging. J. Phys. Conf. Ser. 2016, 746, 012040. [Google Scholar] [CrossRef]
  31. Sato, H.; Sato, T.; Shiota, Y.; Kamiyama, T.; Tremsin, A.S.; Ohnuma, M.; Kiyanagi, Y. Relation between vickers hardness and Bragg-edge broadening in quenched steel rods observed by pulsed neutron transmission imaging. Mater. Trans. 2015, 56, 1147–1152. [Google Scholar] [CrossRef]
  32. Tremsin, A.; McPhate, J.; Steuwer, A.; Kockelmann, W.; Paradowska, A.M.; Kelleher, J.; Vallerga, J.; Siegmund, O.; Feller, W. High-Resolution strain mapping through time-of-flight neutron transmission diffraction with a microchannel plate neutron counting detector. Strain 2012, 48, 296–305. [Google Scholar] [CrossRef]
  33. Iwase, K.; Sato, H.; Harjo, S.; Kamiyama, T.; Ito, T.; Takata, S.; Aizawa, K.; Kiyanagi, Y. In situ lattice strain mapping during tensile loading using the neutron transmission and diffraction methods. J. Appl. Crystallogr. 2012, 45, 113–118. [Google Scholar] [CrossRef]
  34. Wang, X.L.; Holden, T.; Rennich, G.Q.; Stoica, A.; Liaw, P.K.; Choo, H.; Hubbard, C.R. VULCAN—The engineering diffractometer at the SNS. Physica B Condens. Matter. 2006, 385, 673–675. [Google Scholar] [CrossRef]
  35. Bilheux, H. Neutron characterization of additively manufactured Inconel 718. Adv. Mater. Processes. 2016, 175, 16–20. [Google Scholar]
  36. Kirka, M.; Lee, Y.; Greeley, D.; Okello, A.; Goin, M.; Pearce, M.; Dehoff, R. Strategy for texture management in metals additive manufacturing. JOM 2017, 69, 523–531. [Google Scholar] [CrossRef]
  37. Dehoff, R.; Kirka, M.; Sames, W.; Bilheux, H.; Tremsin, A.; Lowe, L.; Babu, S. Site specific control of crystallographic grain orientation through electron beam additive manufacturing. Mater. Sci. Technol. 2015, 31, 931–938. [Google Scholar] [CrossRef]
  38. An, K. VDRIVE-Data Reduction and Interactive Visualization Software for Event Mode Neutron Diffraction; ORNL Report No. ORNL-TM-2012-621; Oak Ridge National Laboratory: Oak Ridge, TN, USA, 2012. [Google Scholar]
  39. Steuwer, A.; Santisteban, J.R.; Withers, P.J.; Edwards, L.; Fitzpatrick, M.E.; Daymond, M.R.; Bruno, G. Bragg-edge determination for accurate lattice parameter and elastic strain measurement. Phys. Stat. Sol.(a). 2001, 185, 221–230. [Google Scholar] [CrossRef]
  40. Kropff, F.; Granada, J.R.; Mayer, R.E. The bragg lineshapes in time-of-flight neutron powder spectroscopy. Nucl. Instrum. Methods Phys. Res. 1982, 198, 515–521. [Google Scholar] [CrossRef]
  41. Von Dreele, R.B.; Jorgensen, J.D.; Windsor, C.G. Rietveld refinement with spallation neutron powder diffraction data. J. Appl. Crystallogr. 1982, 15, 581–589. [Google Scholar] [CrossRef]
  42. Tremsin, A.S.; Gao, Y.; Dial, L.C.; Grazzi, F.; Shinohara, T. Investigation of microstructure in additive manufactured Inconel 625 by spatially resolved neutron transmission spectroscopy. Sci. Technol. Adv. Mater. 2016, 17, 324–336. [Google Scholar] [CrossRef] [PubMed]
  43. Github Library for iBeatles. Available online: https://github.com/ornlneutronimaging/iBeatles (accessed on 6 April 2017).
  44. Binder, K. Total Coherent Cross sections for the scattering of Neutrons from Crystals. Phys. Stat. Sol. 1970, 41, 767–779. [Google Scholar] [CrossRef]
  45. Granada, J.R. Total Scattering Cross Section of Solids for Cold and Epithermal Neutrons. Z. Naturforsch. A 1984, 39, 1160. [Google Scholar] [CrossRef]
  46. Vogel, S. A Rietveld-Approach for the Analysis of Neutron Time-of-Flight Transmission data. Ph.D. Thesis, Christian-Albrechts Universität Kiel, Kiel, Germany, 2000. [Google Scholar]
  47. Sabine, T. A reconciliation of extinction theories. Acta Crystallogr. Sect. A Found. Crystallogr. 1988, 44, 368–374. [Google Scholar] [CrossRef]
  48. Sabine, T.M.; von Dreele, R.B.; Jorgensen, J.E. Extinction in time-of-flight neutron powder diffractometry. Acta Crystallogr. Sect. A Found. Crystallogr. 1988, 44, 374–379. [Google Scholar] [CrossRef]
  49. Chaturvedi, M.C.; Han, Y. Strengthening mechanisms in Inconel 718 superalloy. Metal Sci. 1983, 17, 145–149. [Google Scholar] [CrossRef]
  50. Han, Y.F.; Deb, P.; Chaturvedi, M.C. Coarsening behaviour of γ″- and γ′-particles in Inconel alloy 718. Met. Sci. 1982, 16, 555–562. [Google Scholar] [CrossRef]
  51. Cao, W.D. Solidification and solid state phase transformation of Allvac® 718Plus™ alloy. Superalloys 2005, 718, 165–177. [Google Scholar]
  52. Hidnert, P. Thermal expansion of some nickel alloys. J. Res. Natl. Bur. Stand. 1957, 58, 89. [Google Scholar] [CrossRef]
  53. Santisteban, J.R.; Edwards, L.; Steuwer, A.; Withers, P.J. Time-of-flight neutron transmission diffraction. J. Appl. Crystallogr. 2001, 34, 289–297. [Google Scholar] [CrossRef]
  54. Santisteban, J.R.; Edwards, L.; Stelmukh, V. Characterization of textured materials by TOF transmission. Phys. B Condens. Matter 2006, 385–386, 636–638. [Google Scholar] [CrossRef]
Figure 1. A layout of the VULCAN furnace.
Jimaging 03 00065 g001
Figure 2. (a) Measured relative transmission spectra (i.e., uncorrected for sample thickness) of pure Ni, Ni39Cr11, and Inconel 718 powder samples. Neutron transmission radiograph in (a) displaying the dark sample contrast was obtained at a wavelength near the (200) Bragg edge. Comparison between experimental and fitting results of the (111) plane using (b) iBeatles and (c) Bragg-edge modeling, respectively.
Jimaging 03 00065 g002
Figure 3. (a) Measured transmission spectra of a pure Ni powder sample during in situ heating to 873 K. Neutron transmission radiograph in (a) is displayed at a wavelength near the (200) Bragg edge. (b) Plot of thermal lattice strains as a function of temperature and linear fittings of the pure Ni powder based on the interplanar spacing values obtained by the iBeatles (red circles) and Bragg-edge modeling (black squares), respectively.
Jimaging 03 00065 g003
Figure 4. Schematic illustrations of dimension and orientation of single Col. and dual Col., extracted from the additively manufactured (AM) bulk blocks. An electron backscatter diffraction (EBSD) image shows how the columnar grains form in the single Col. sample.
Jimaging 03 00065 g004
Figure 5. Transmission radiographs obtained at the narrow range of wavelength near the (a) (311), (b) (220), and (c) (200) Bragg edges and (d) transmission spectrum combined from all the pixels within the white rectangle in (c) for the single Col. sample before loading (15 MPa: reference loading).
Jimaging 03 00065 g005
Figure 6. (a) iBeatles fitting result of the single Col. Inconel 718 sample. (b) Strain evolution during tension loading up to 550 MPa determined by in situ neutron diffraction and iBeatles. (c) A schematic illustration of neutron diffraction configuration for in situ tension loading measurements at VULCAN. (d) Strain mapping of the (200) Bragg edge during in situ loading up to 550 MPa. The unstrained value of λ0 edge position was determined from the fitting of the unstrained sample in (a) (15 MPa). The strain mapping was conducted over the sample area of 19.25 × 8.25 mm2 with 10 × 10 binned pixels. The color scale represents strain values in microstrain (μɛ).
Jimaging 03 00065 g006
Figure 7. Radiographs obtained at wavelengths near the (a) (311), (b) (220), and (c) (200) Bragg edges and (d) transmission spectra of the dual columnar structure of Inconel 718. The transmission spectra were acquired by selecting different regions, as marked by blue, red, and yellow rectangles in the radiograph in (c).
Jimaging 03 00065 g007
Figure 8. (a) A (200) Bragg-edge radiograph displaying the imaging data analysis details, and (b) the distribution of the (200) interplanar spacing (d200) for the dual Col. sample (no loading) determined by iBeatles fitting. The mapping analysis was conducted over a sample area of 19.25 × 8.80 mm2 and the value in each point is based on fitting spectra in 10 pixel × 10 pixel areas. (c) A photograph of the dual Col. sample showing the coordinate of the neutron diffraction scanning method, and (d) the distribution of the (200) interplanar spacing for the dual Col. sample derived from neutron diffraction.
Jimaging 03 00065 g008
Figure 9. (a) Distribution of the (200) Bragg edge width ( σ 200 ) determined by iBeatles fitting. The mapping was conducted over the sample area of 19.25 × 8.80 mm2 and the value in each data point is based on a spectrum obtained by applying a 10 × 10 pixel binning. (b) Transmission spectra selected from the data points in (a), denoted by arrows and circles. (c) Fitting transmission spectra calculated by Bragg-edge modeling, and (d) distribution of the crystallite orientation P ( α h ( λ ) ) for (200) grains as a function of wavelength extracted from the modeling results in (c).
Jimaging 03 00065 g009
Table 1. Nominal chemical composition of Inconel 718 powder in weight percent (wt. %) [36].
ElementNiFeCrMoNbCuAlTiC
wt. %Balance18.518.53.05.00.150.51.00.05
Table 2. The (111) and (200) interplanar spacings (in Å) of pure Ni, Ni39Cr11, and Inconel 718 powder samples derived by neutron diffraction and transmission results. The transmission results were analyzed by iBeatles and Bragg-edge modeling fitting. The values in parentheses represent the fitting error.
PlaneTechniquePure NiNi39Cr11Inconel 718
111Diffraction2.03376
(0.00003)
2.04896
(0.00004)
2.07573
(0.00008)
iBeatles2.03683
(0.00062)
2.05091
(0.00069)
2.07839
(0.00450)
Bragg-edge modeling2.03258
(0.00003)
2.05009
(0.00003)
2.07629
(0.00002)
200Diffraction1.761392
(0.00004)
1.77440
(0.00003)
1.79766
(0.00006)
iBeatles1.76392
(0.00420)
1.77497
(0.00082)
1.79474
(0.00057)
Bragg-edge modeling1.76180
(0.00007)
1.77441
(0.00006)
1.79719
(0.00005)
Table 3. The (111) and (200) interplanar spacings (in Å) of pure Ni powder sample at room temperature, 573, and 873 K obtained by iBeatles and Bragg-edge modeling fittings. The values in parentheses represent the fitting error.
PlaneTechniqueRoom573 K873 K
111iBeatles2.03701
(0.00067)
2.04188
(0.00060)
2.05736
(0.00100)
Bragg-edge modeling2.03569
(0.00001)
2.04354
(0.00002)
2.05406
(0.00002)
200iBeatles1.76368
(0.00185)
1.77218
(0.00535)
1.78153
(0.00126)
Bragg-edge modeling1.76311
(0.00003)
1.77098
(0.00005)
1.77916
(0.00005)

