
Comparison of Small Unmanned Aerial Vehicles Performance Using Image Processing

Abstract
:1. Introduction
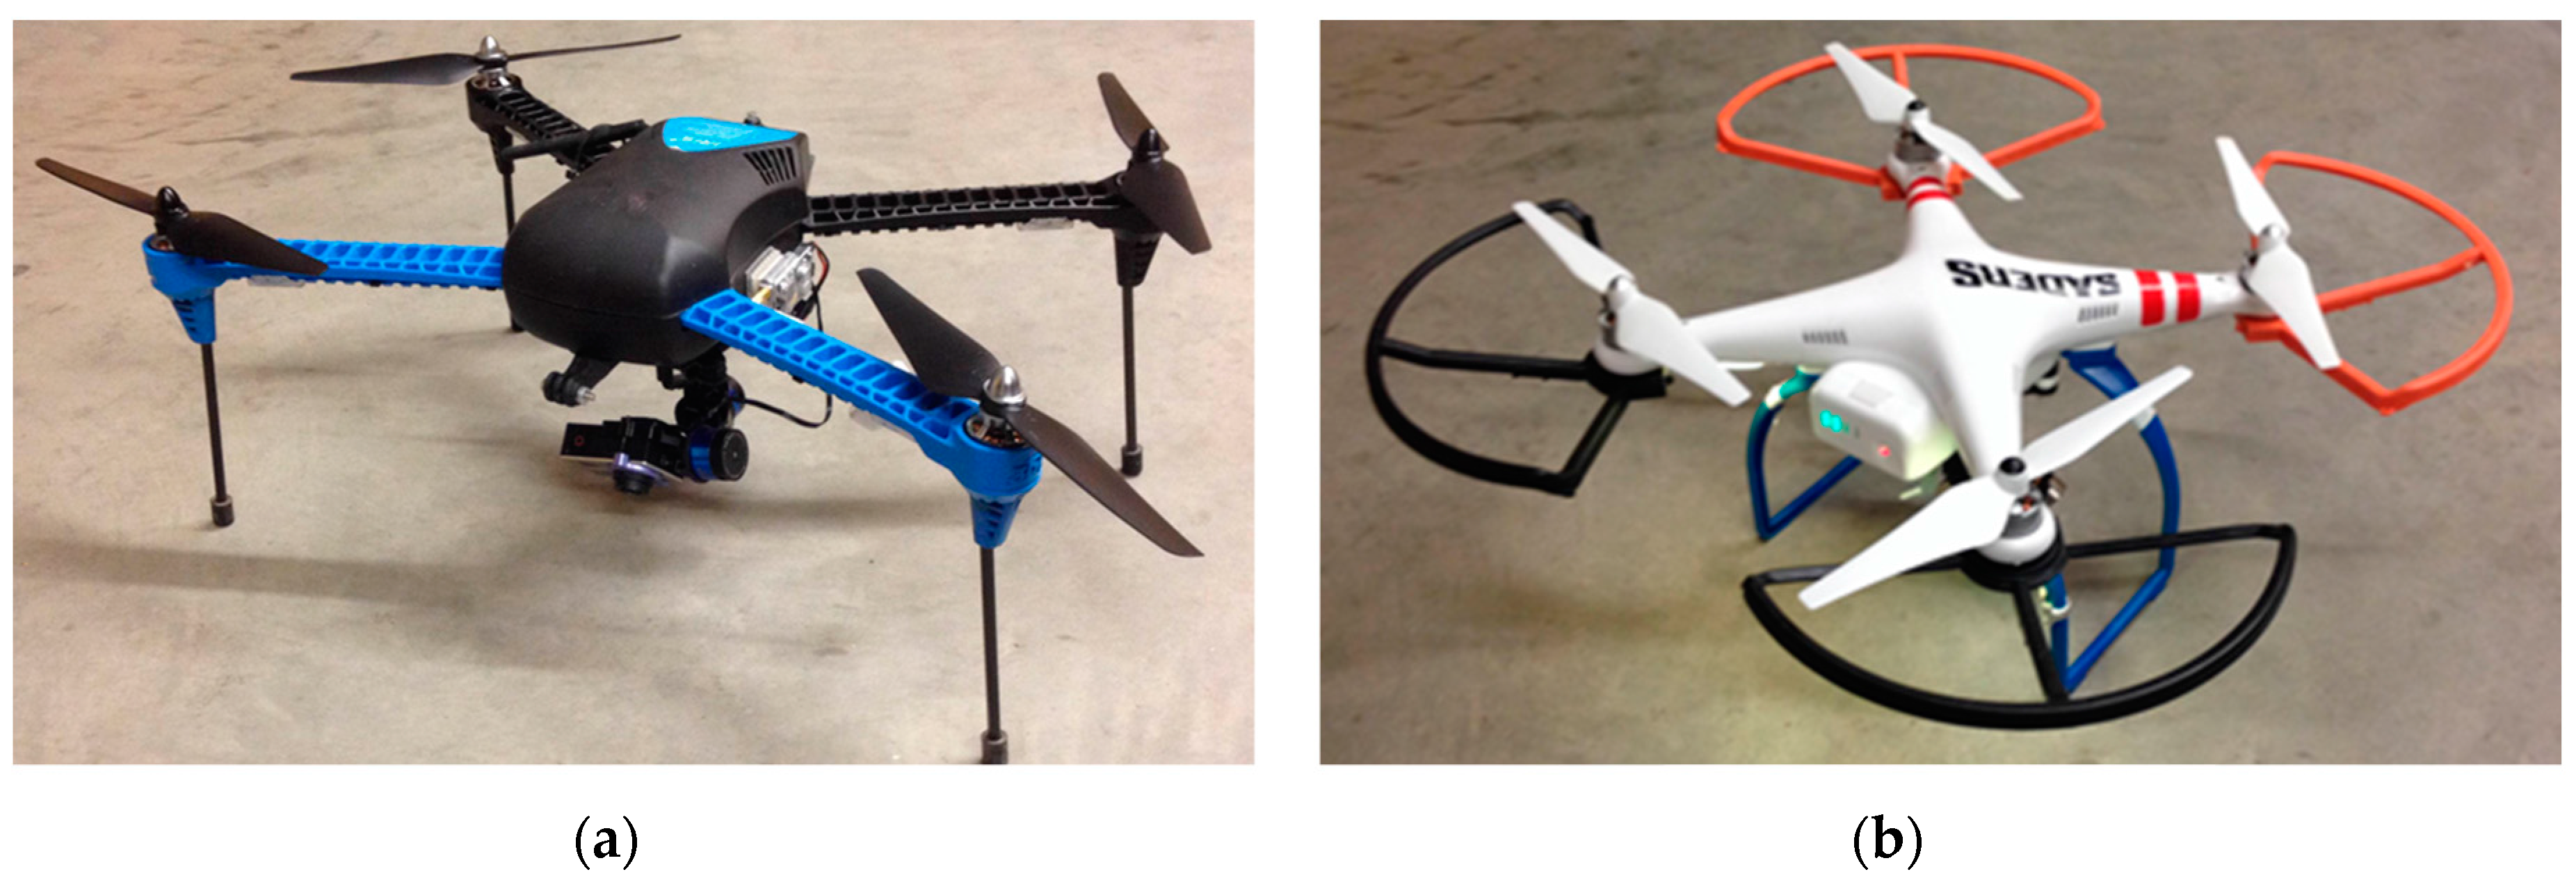
- To compare the flight performance of two off-the-shelf sUAVs: 3DR Iris+ and DJI Phantom.
- To develop image processing algorithms to evaluate the performance of the two sUAVs.
2. Materials and Methods
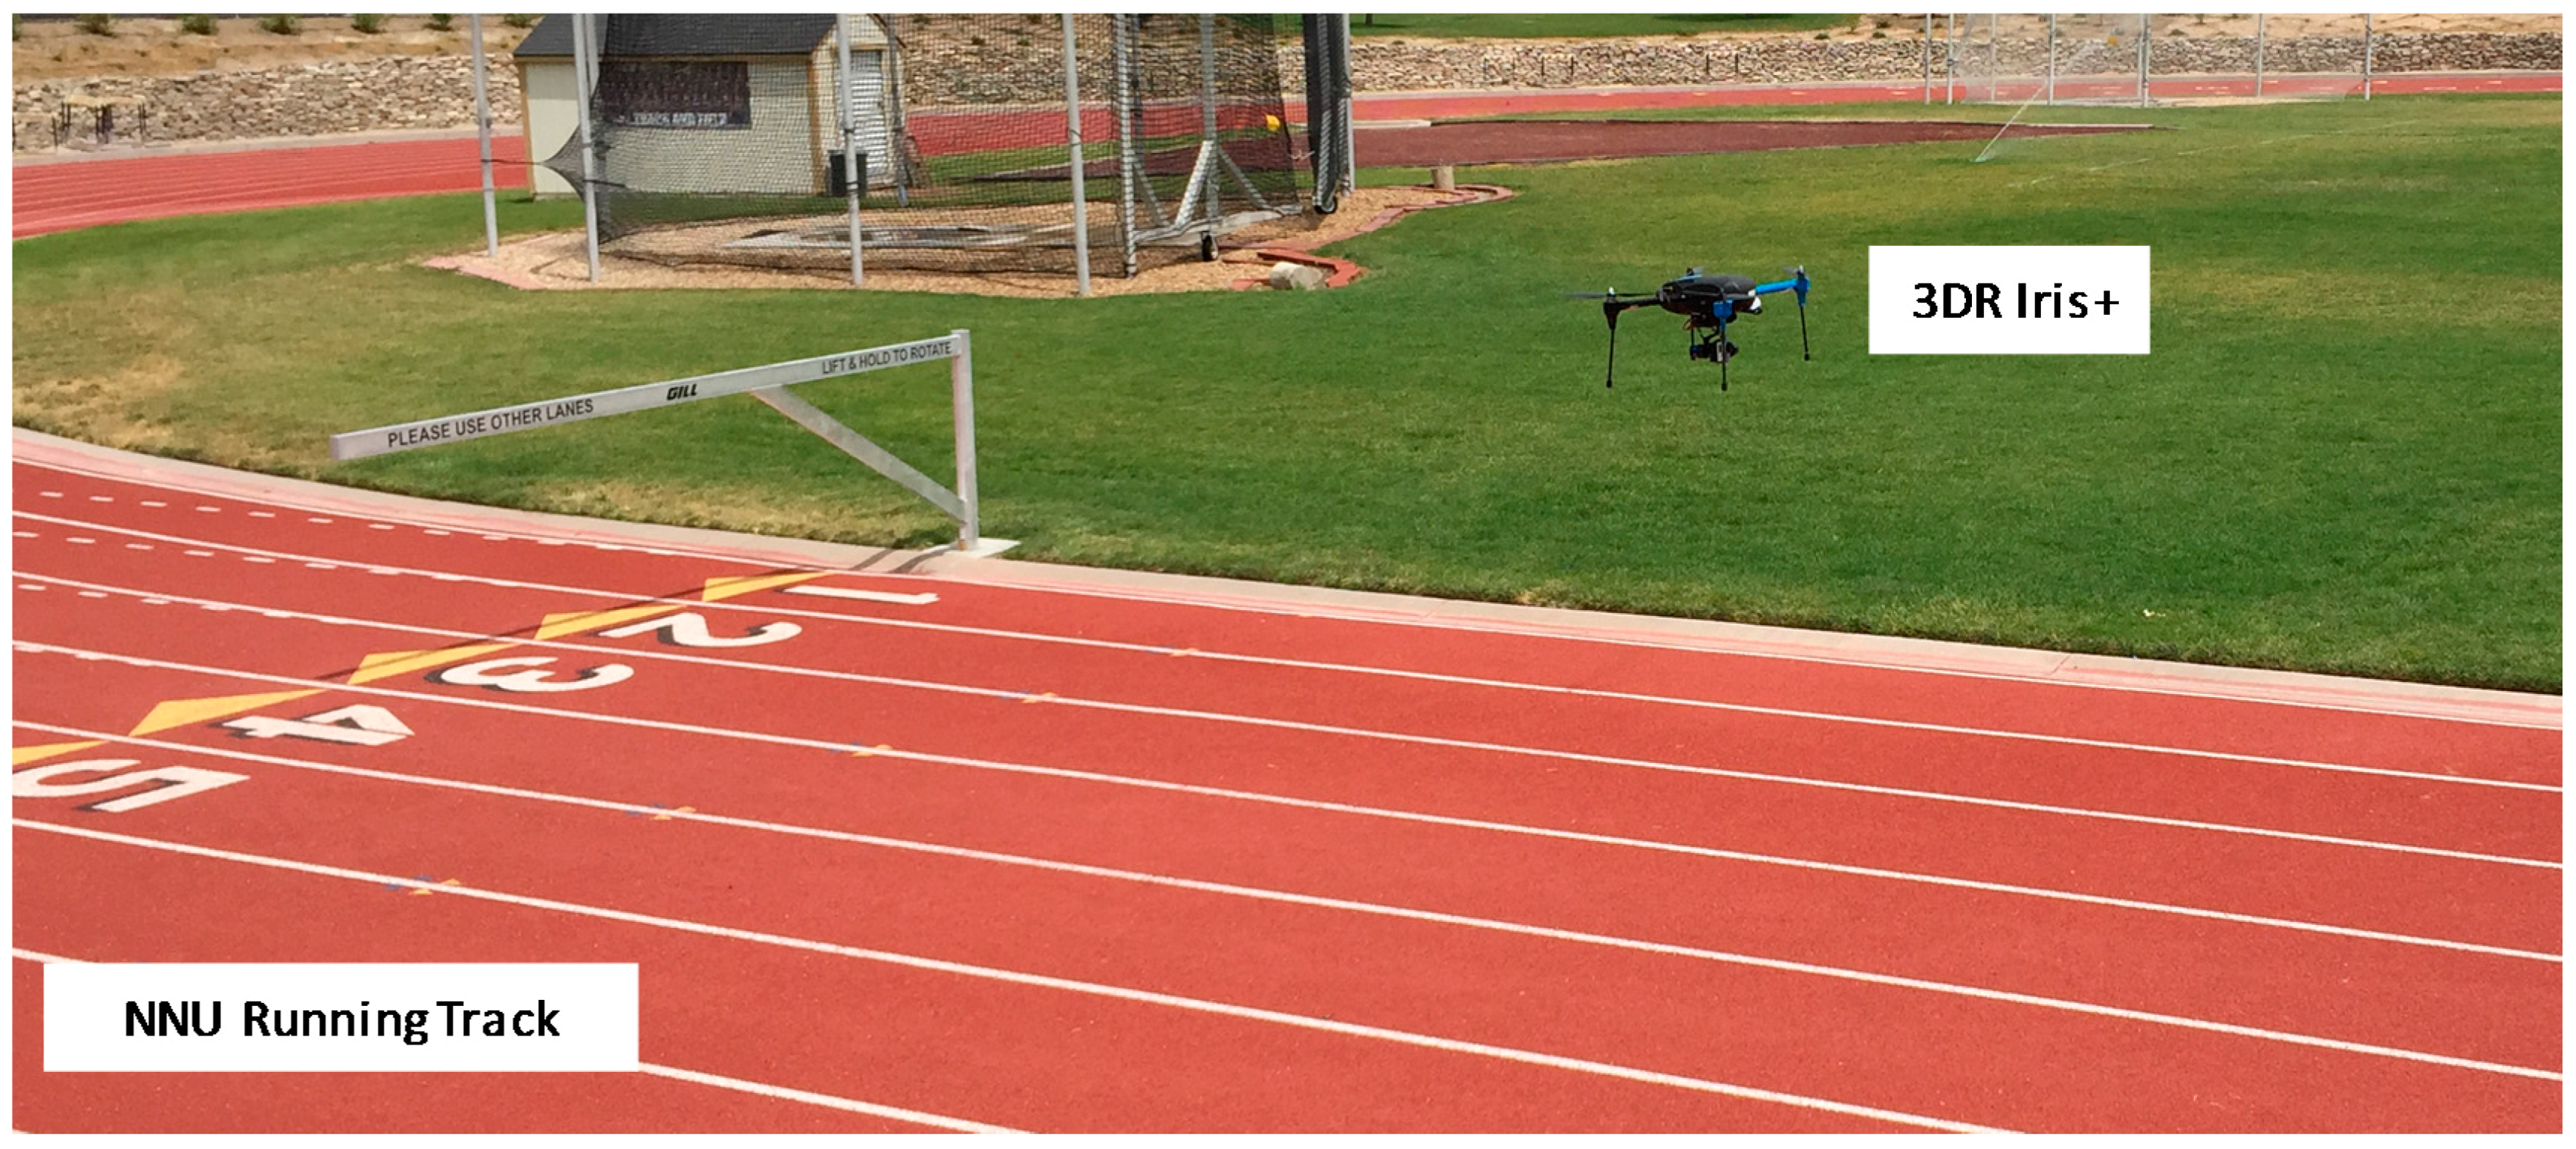
2.1. Small Unmanned Aerial Vehicles
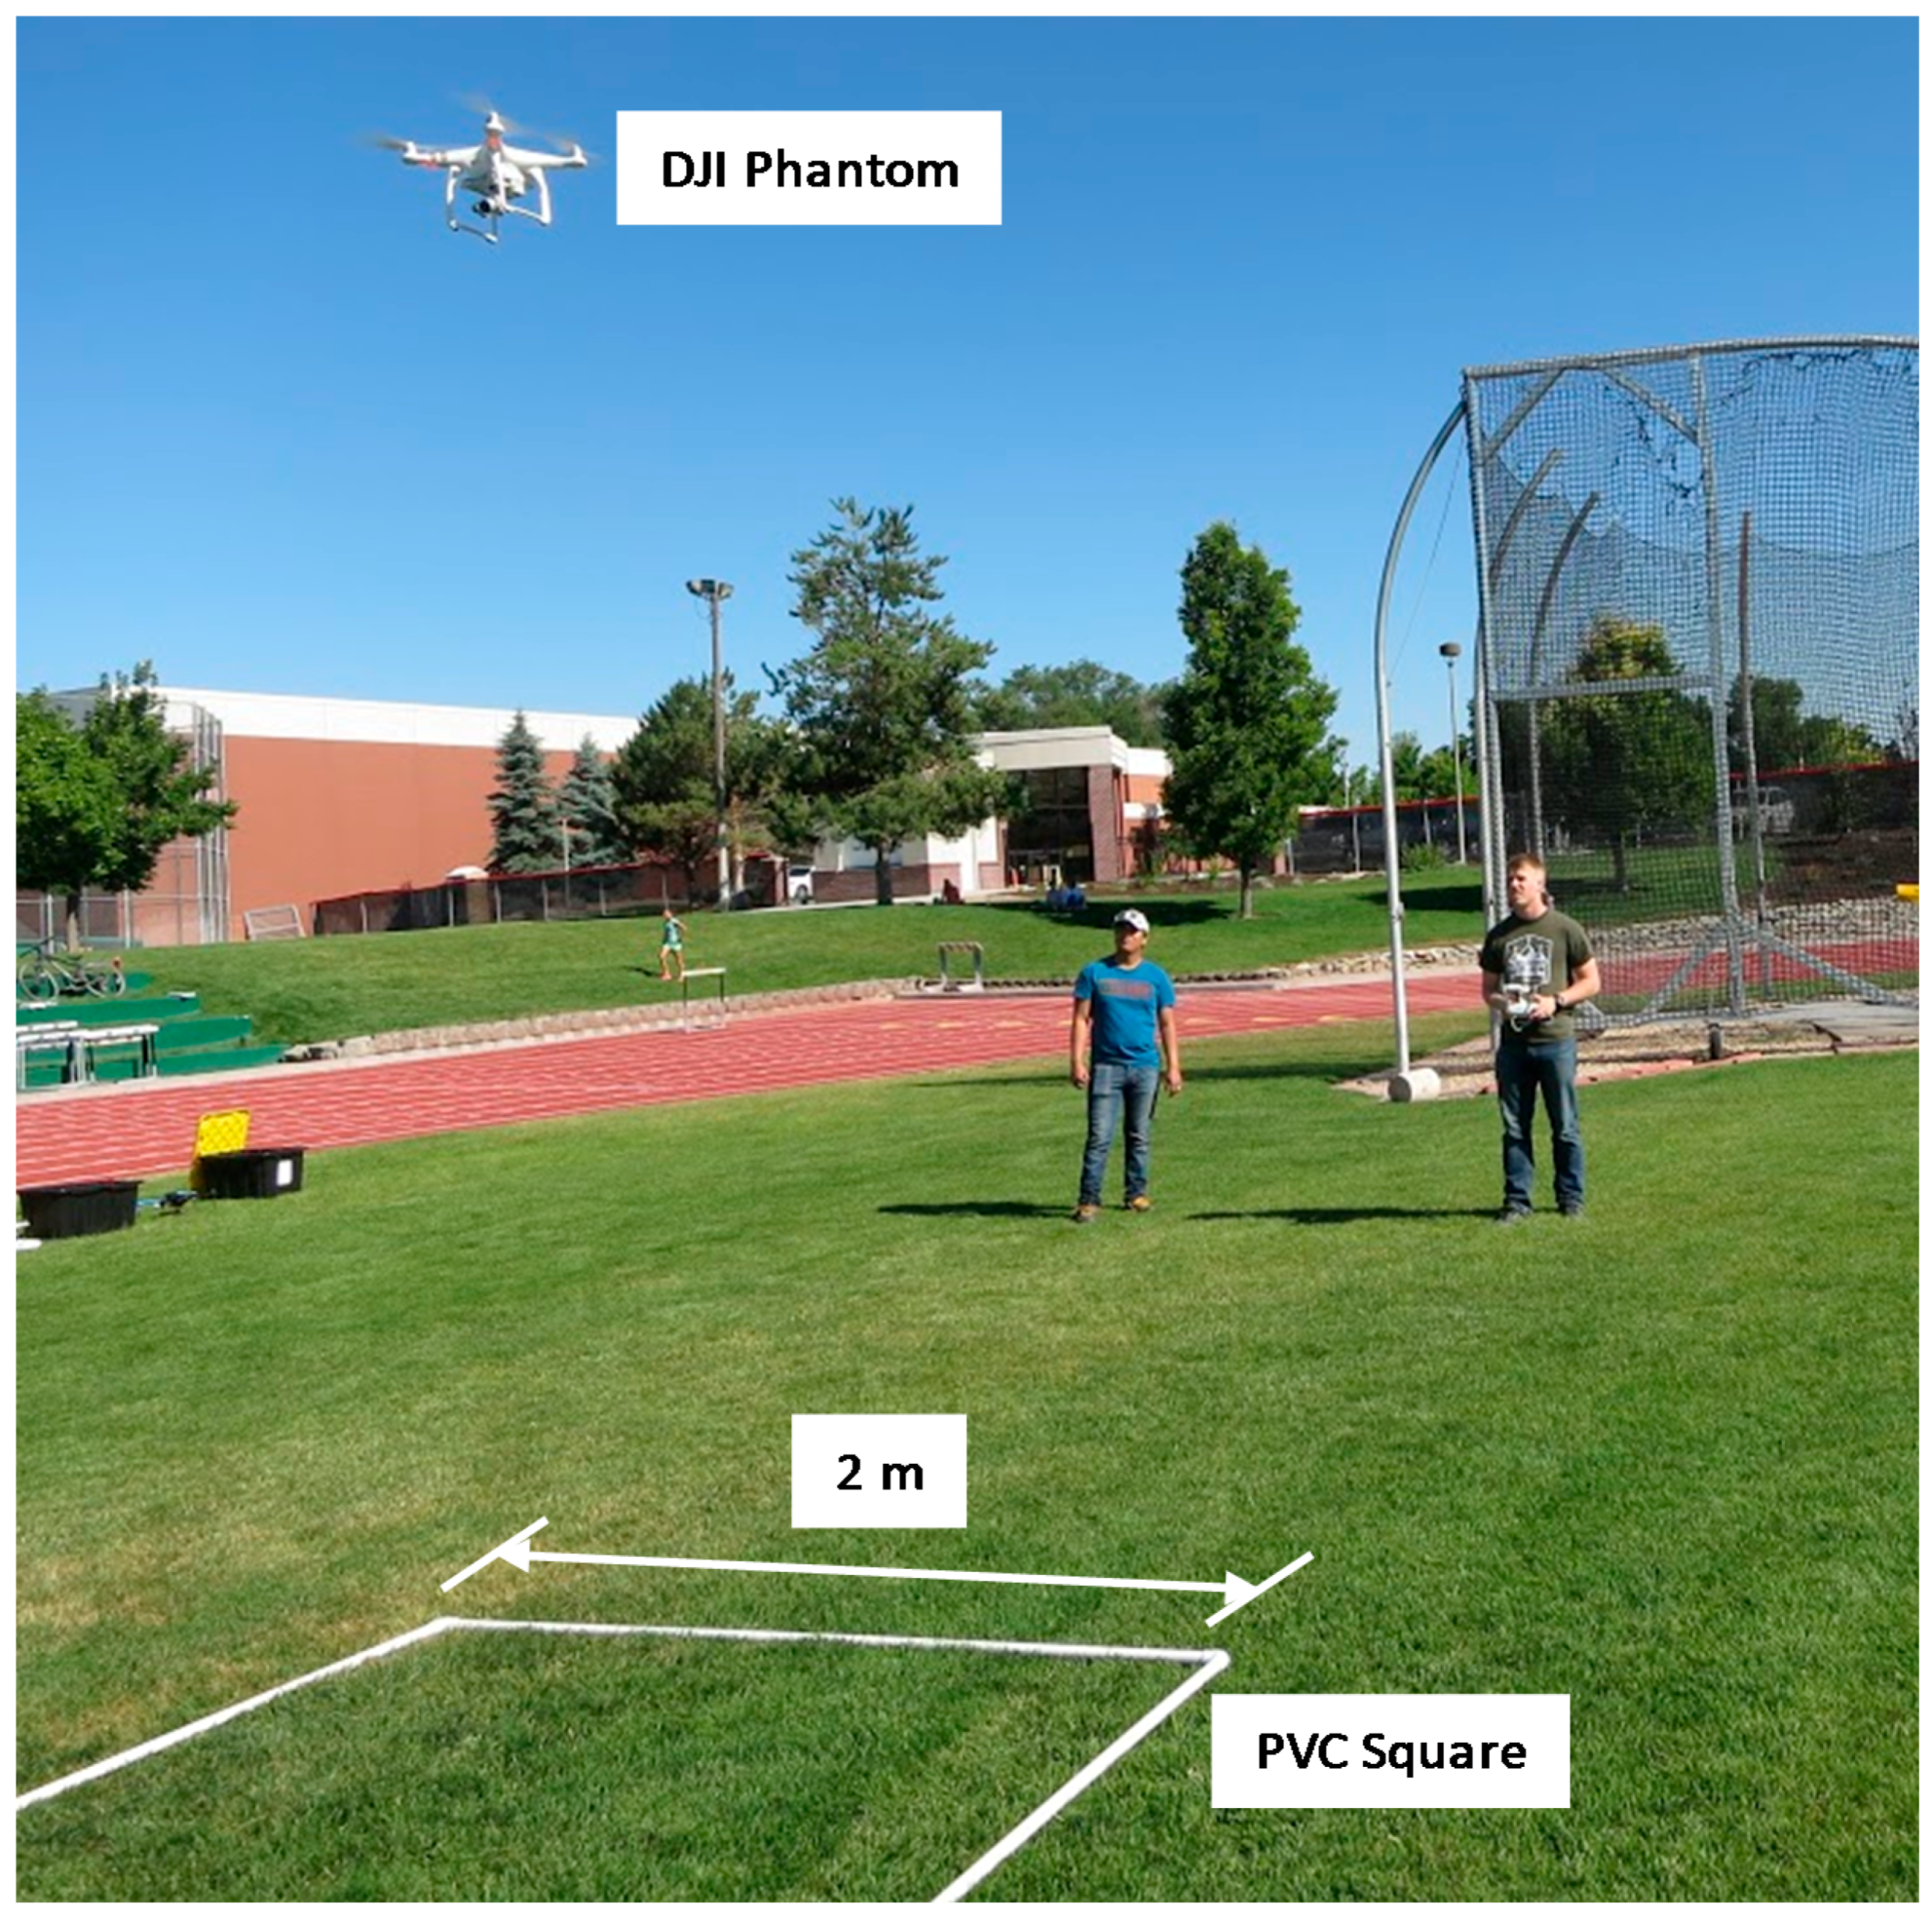
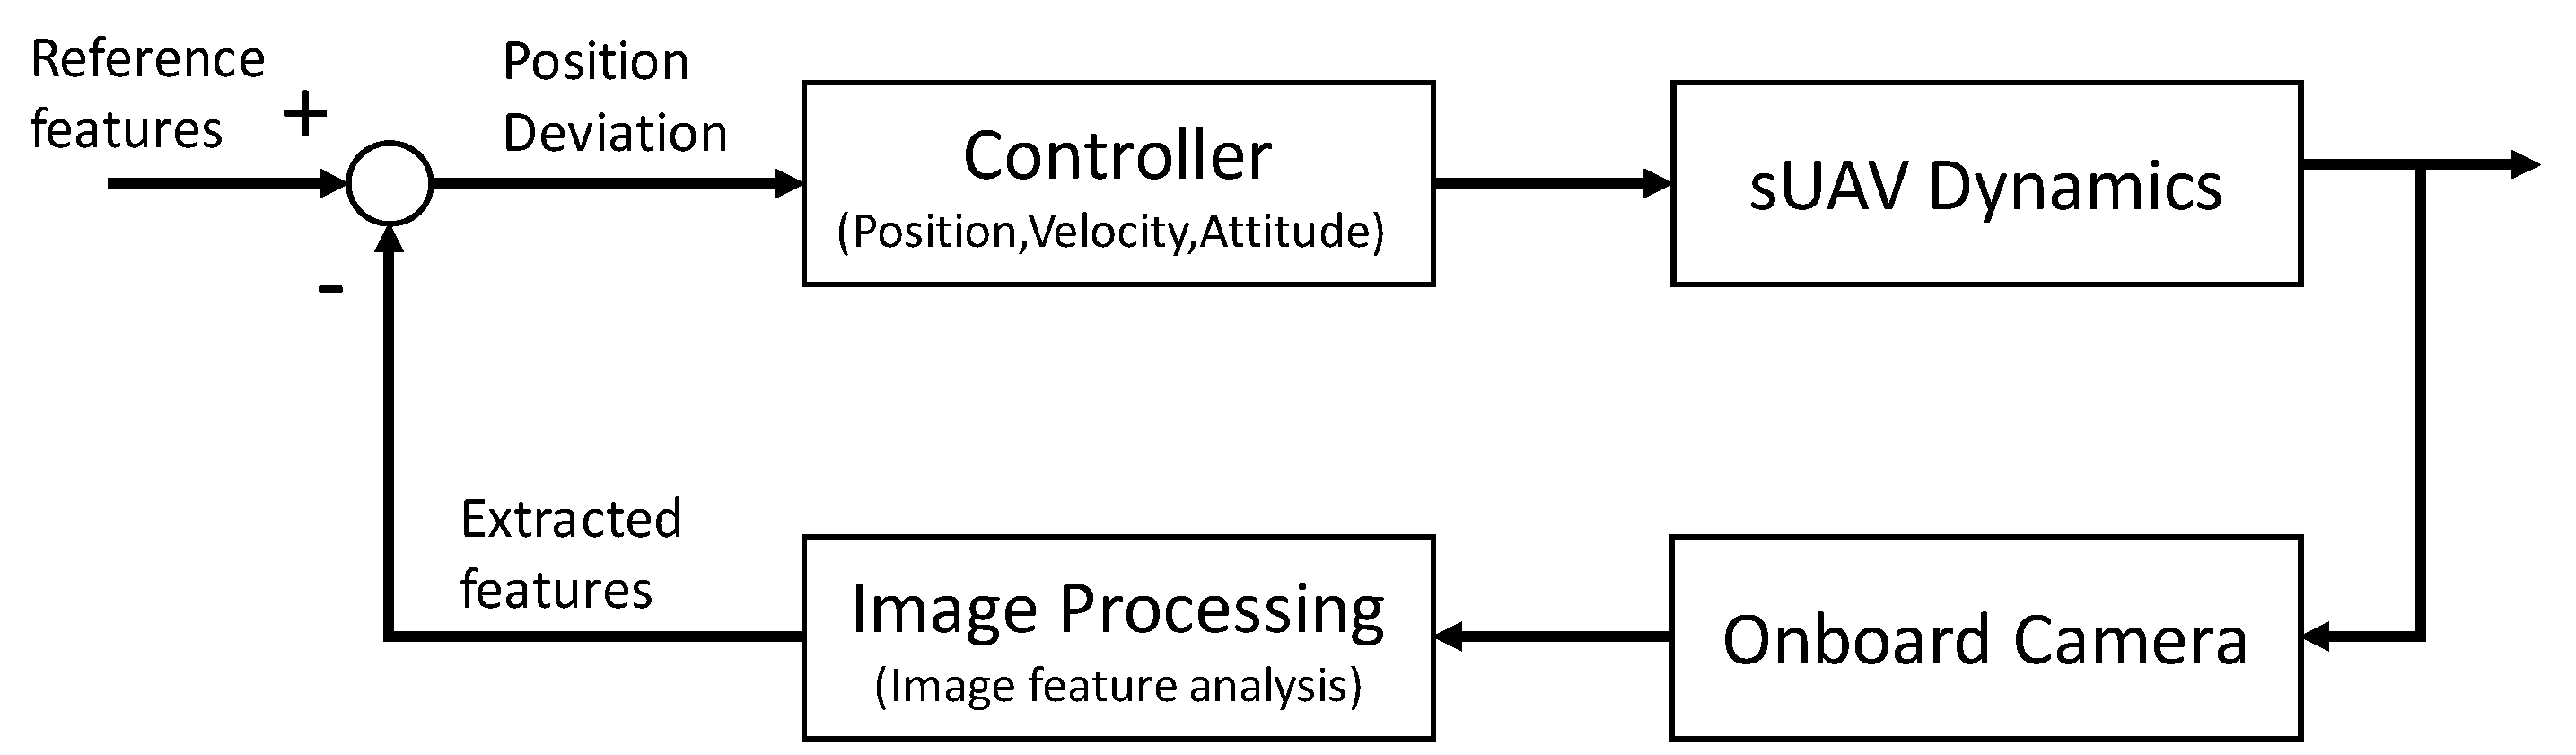
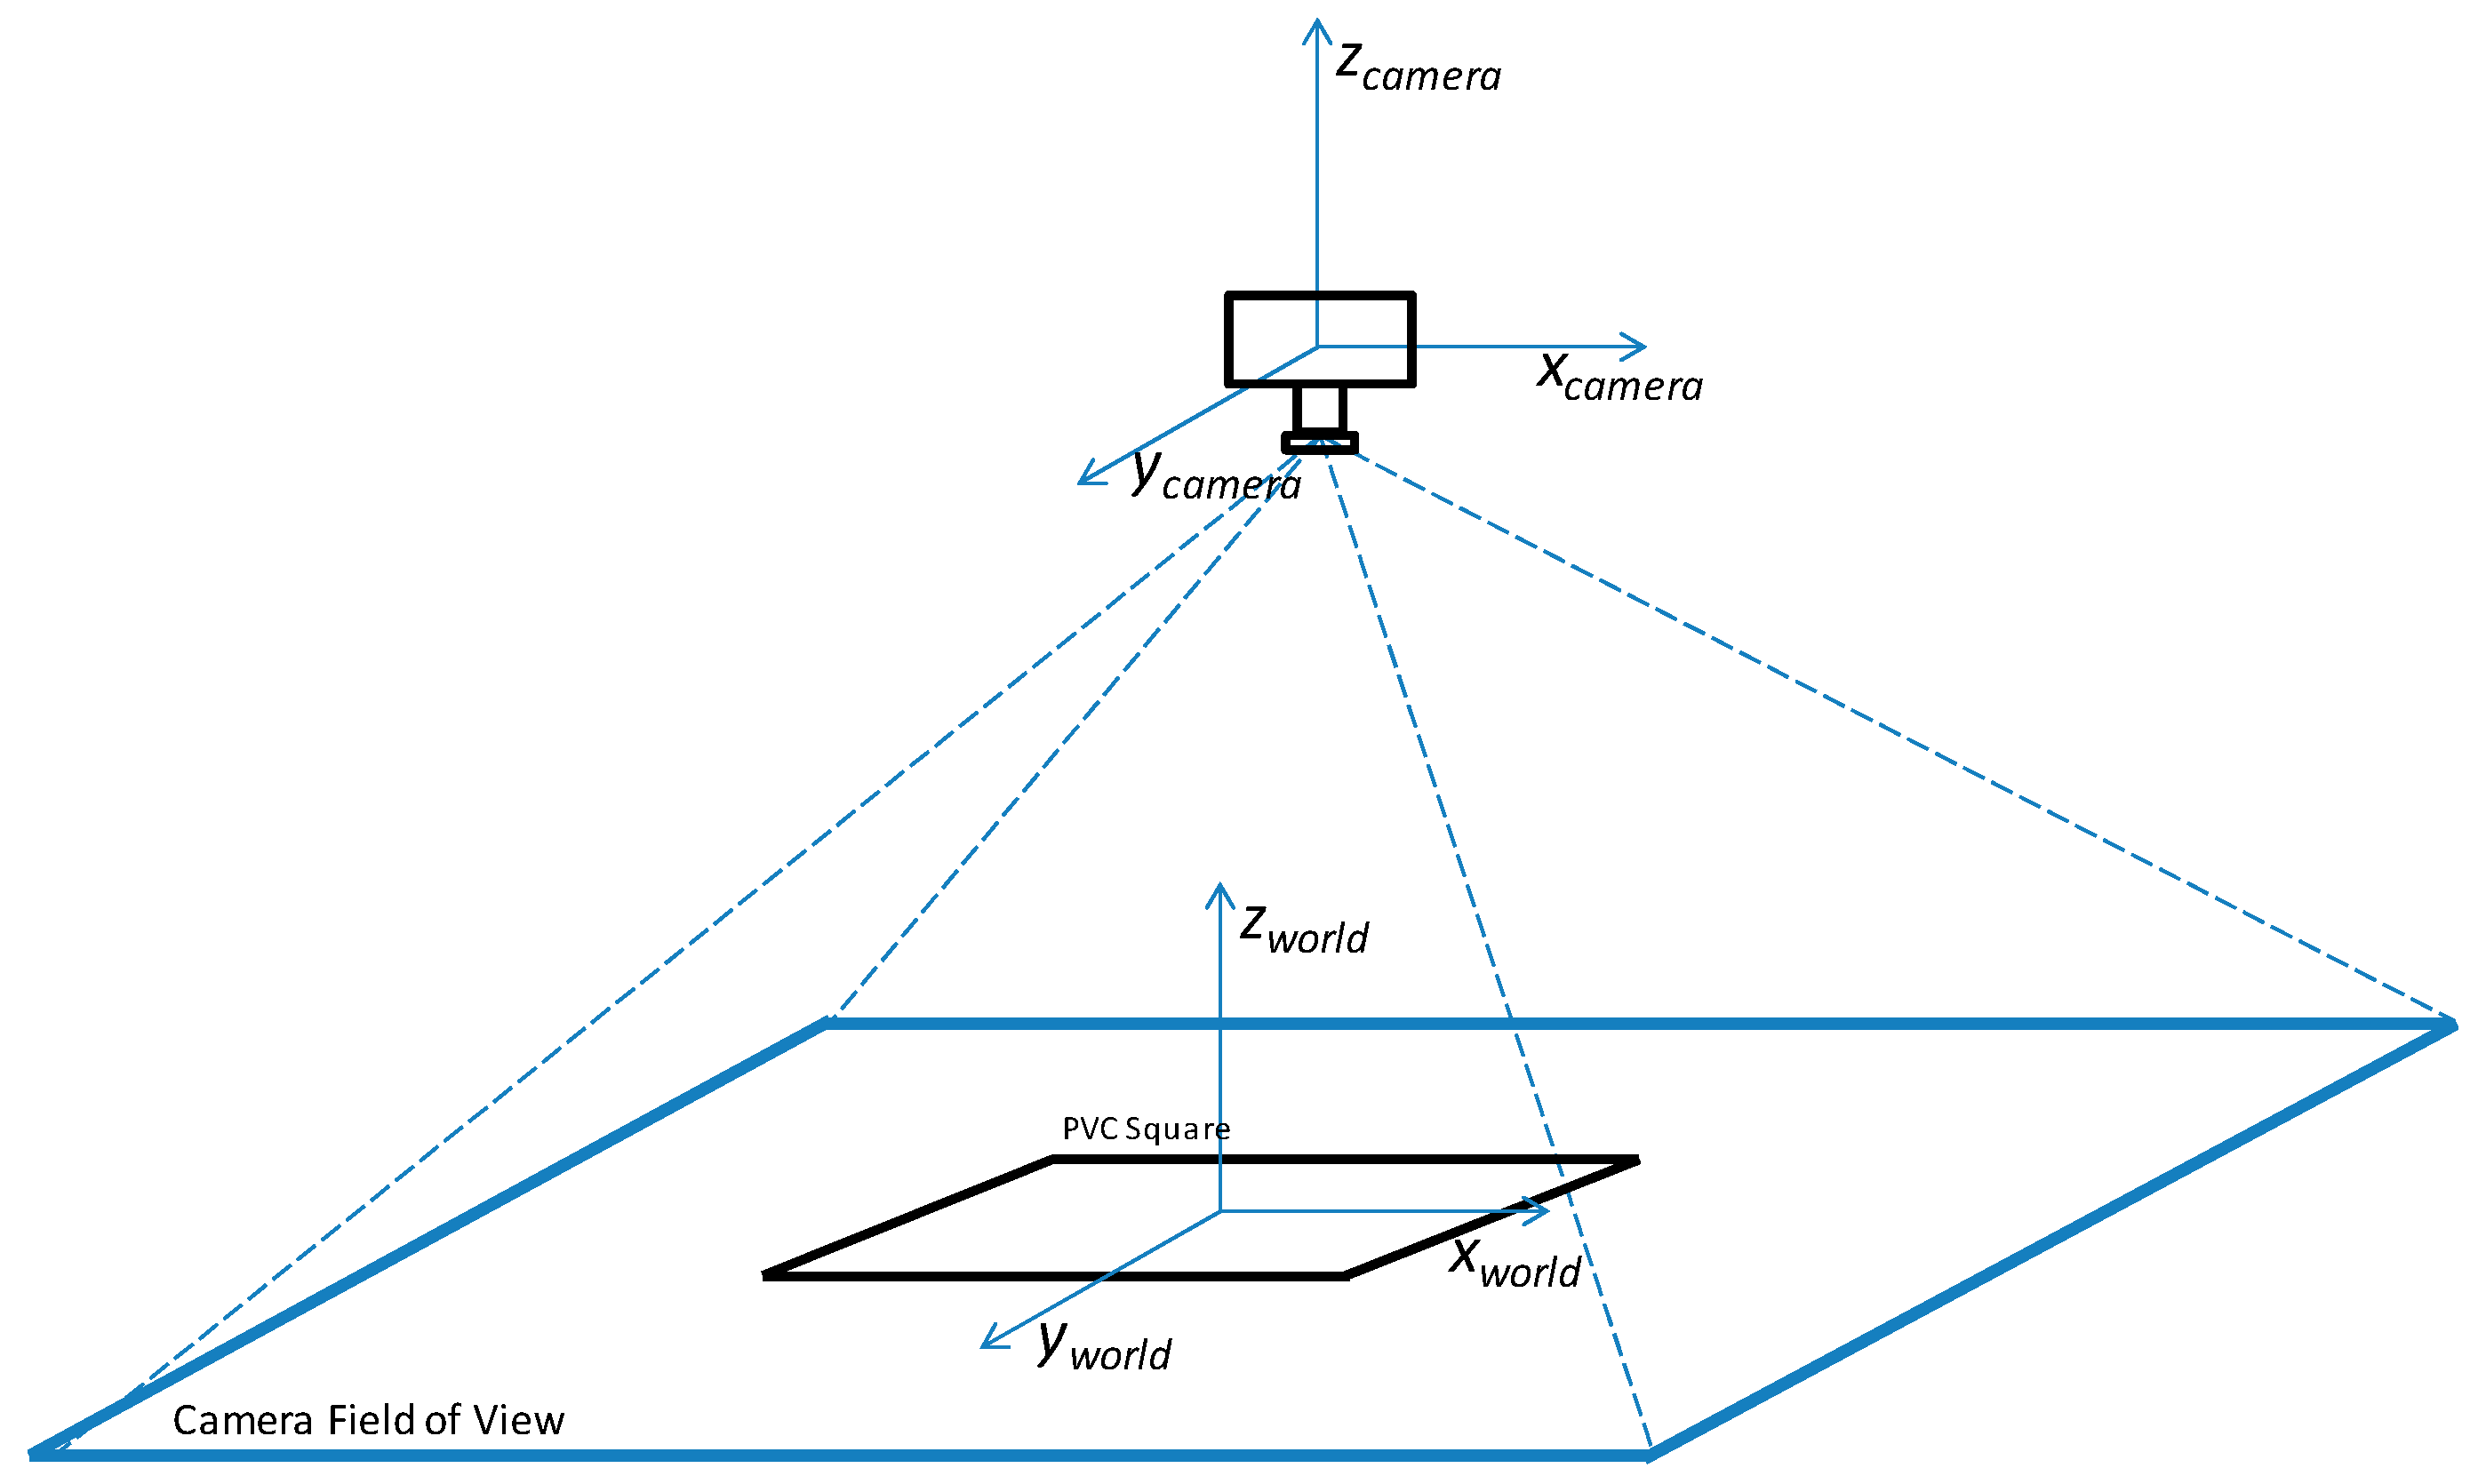
2.2. Image Acquisition for Stability Evaluation
2.3. Performance Evaluation Tests
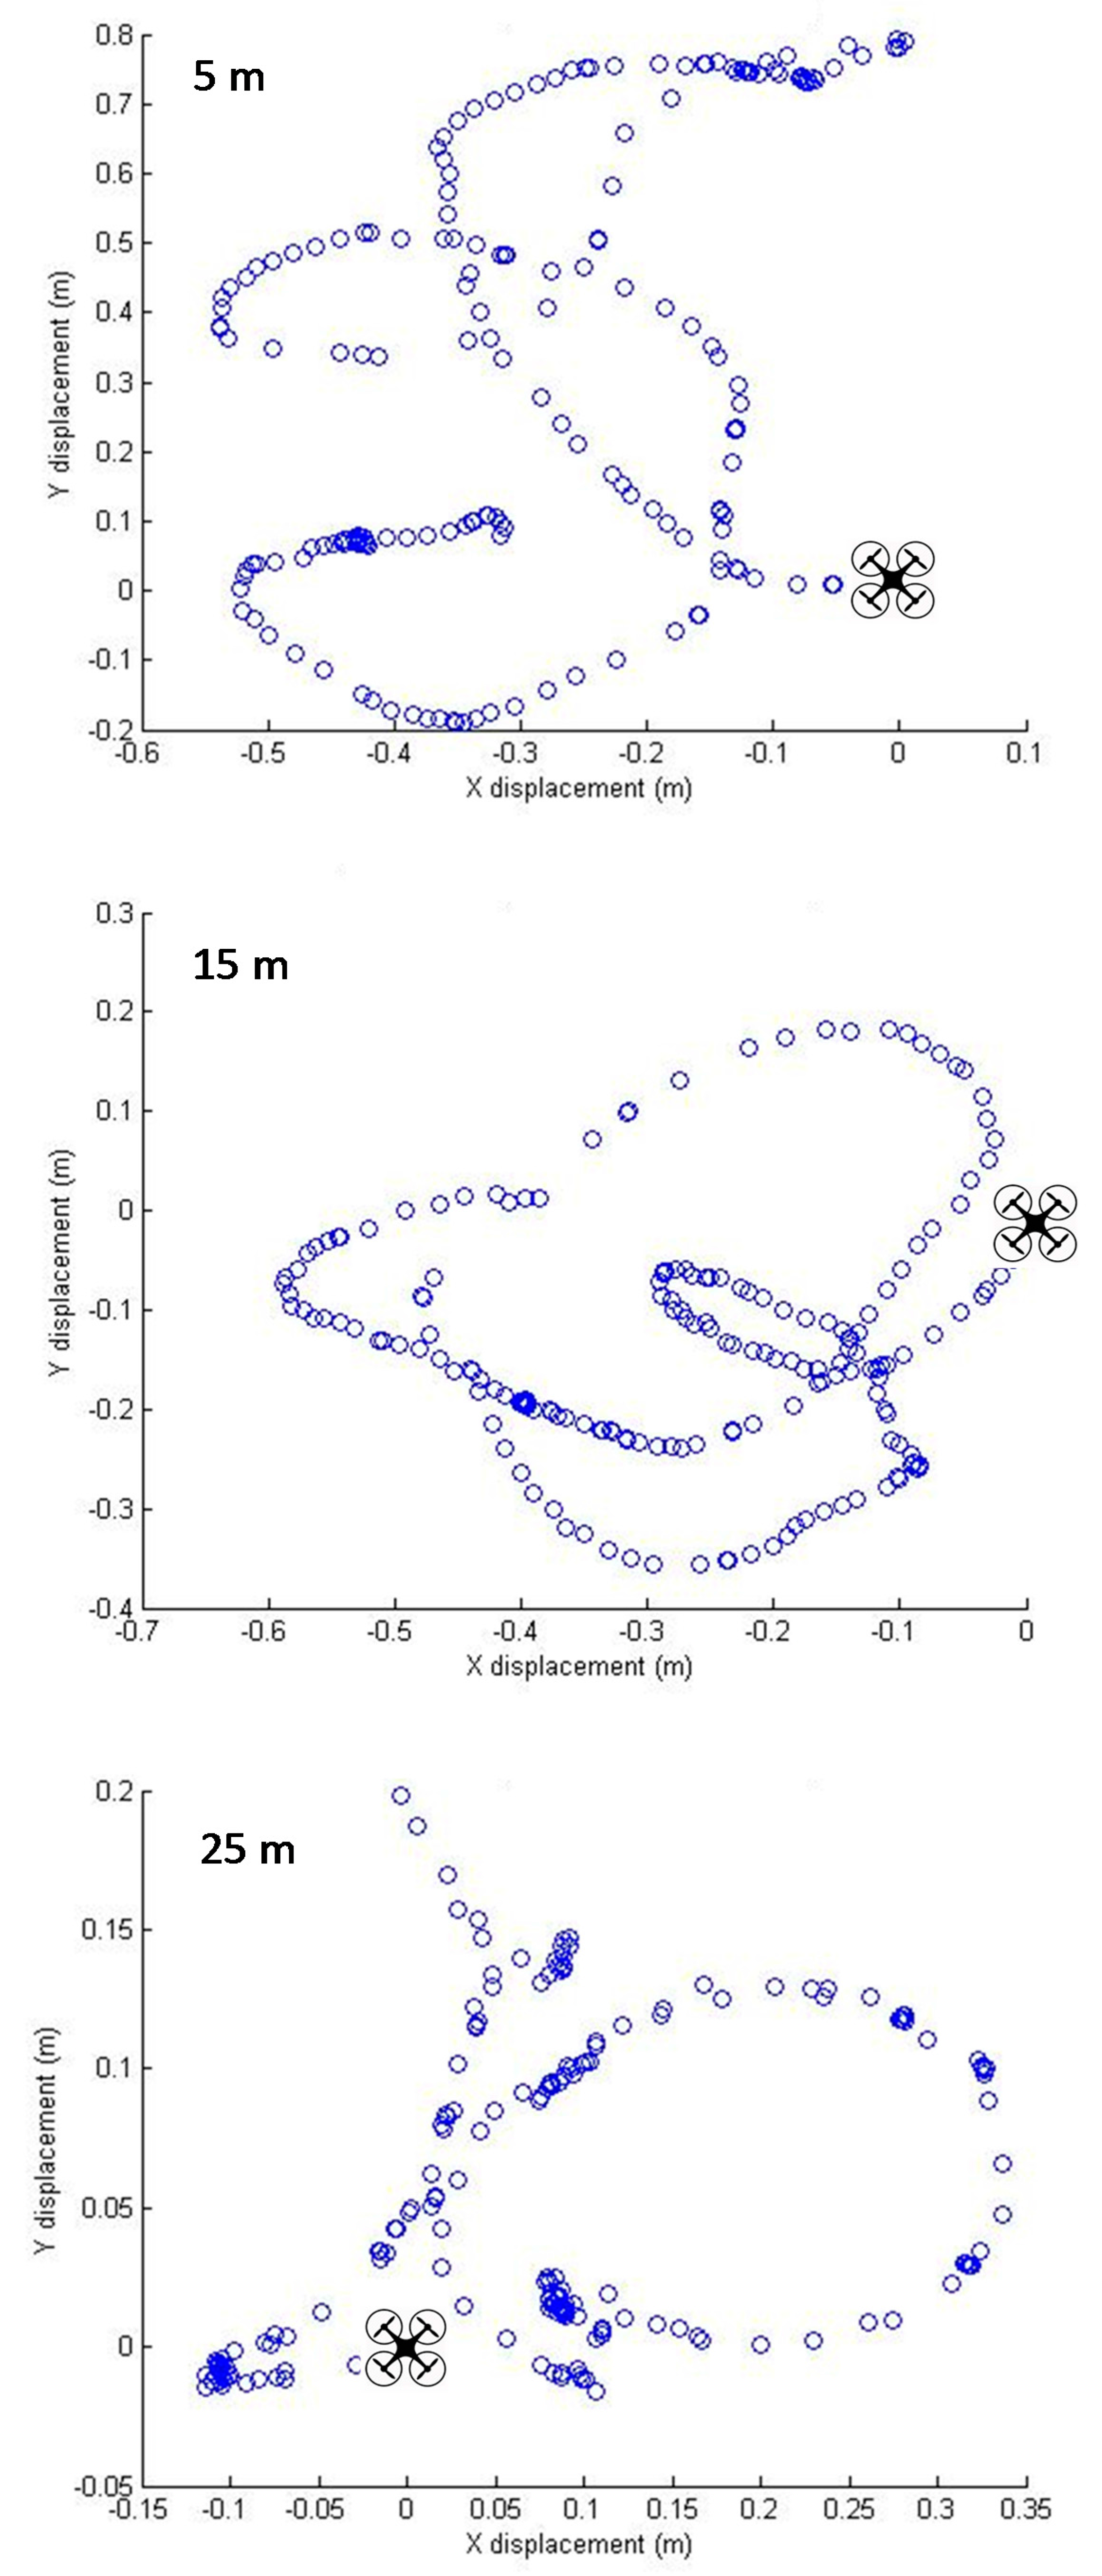
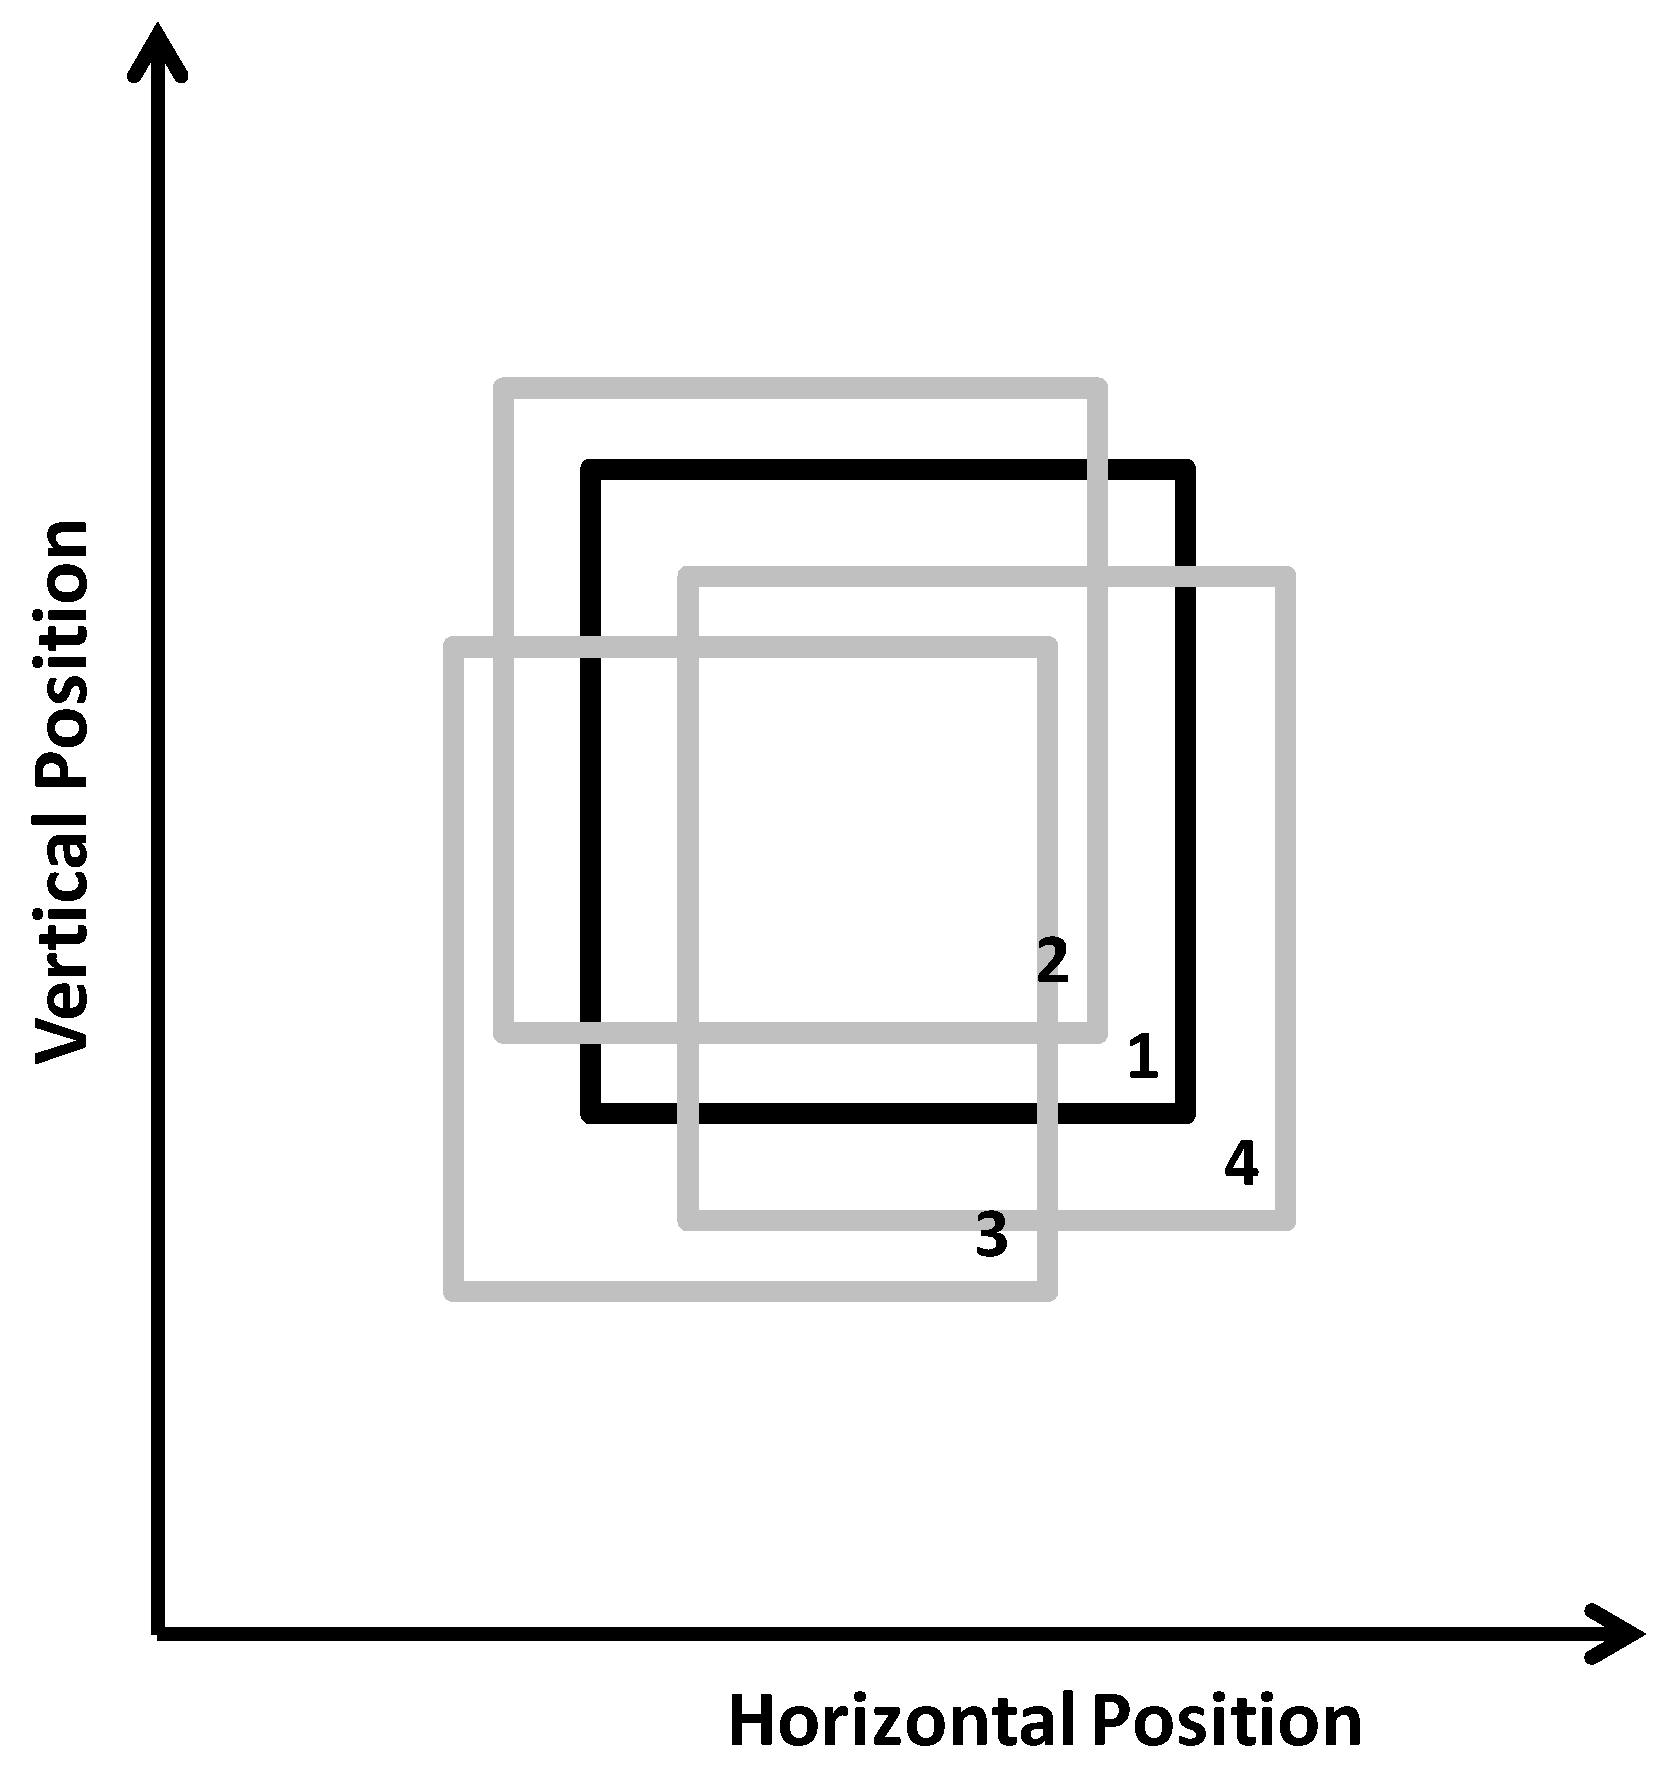
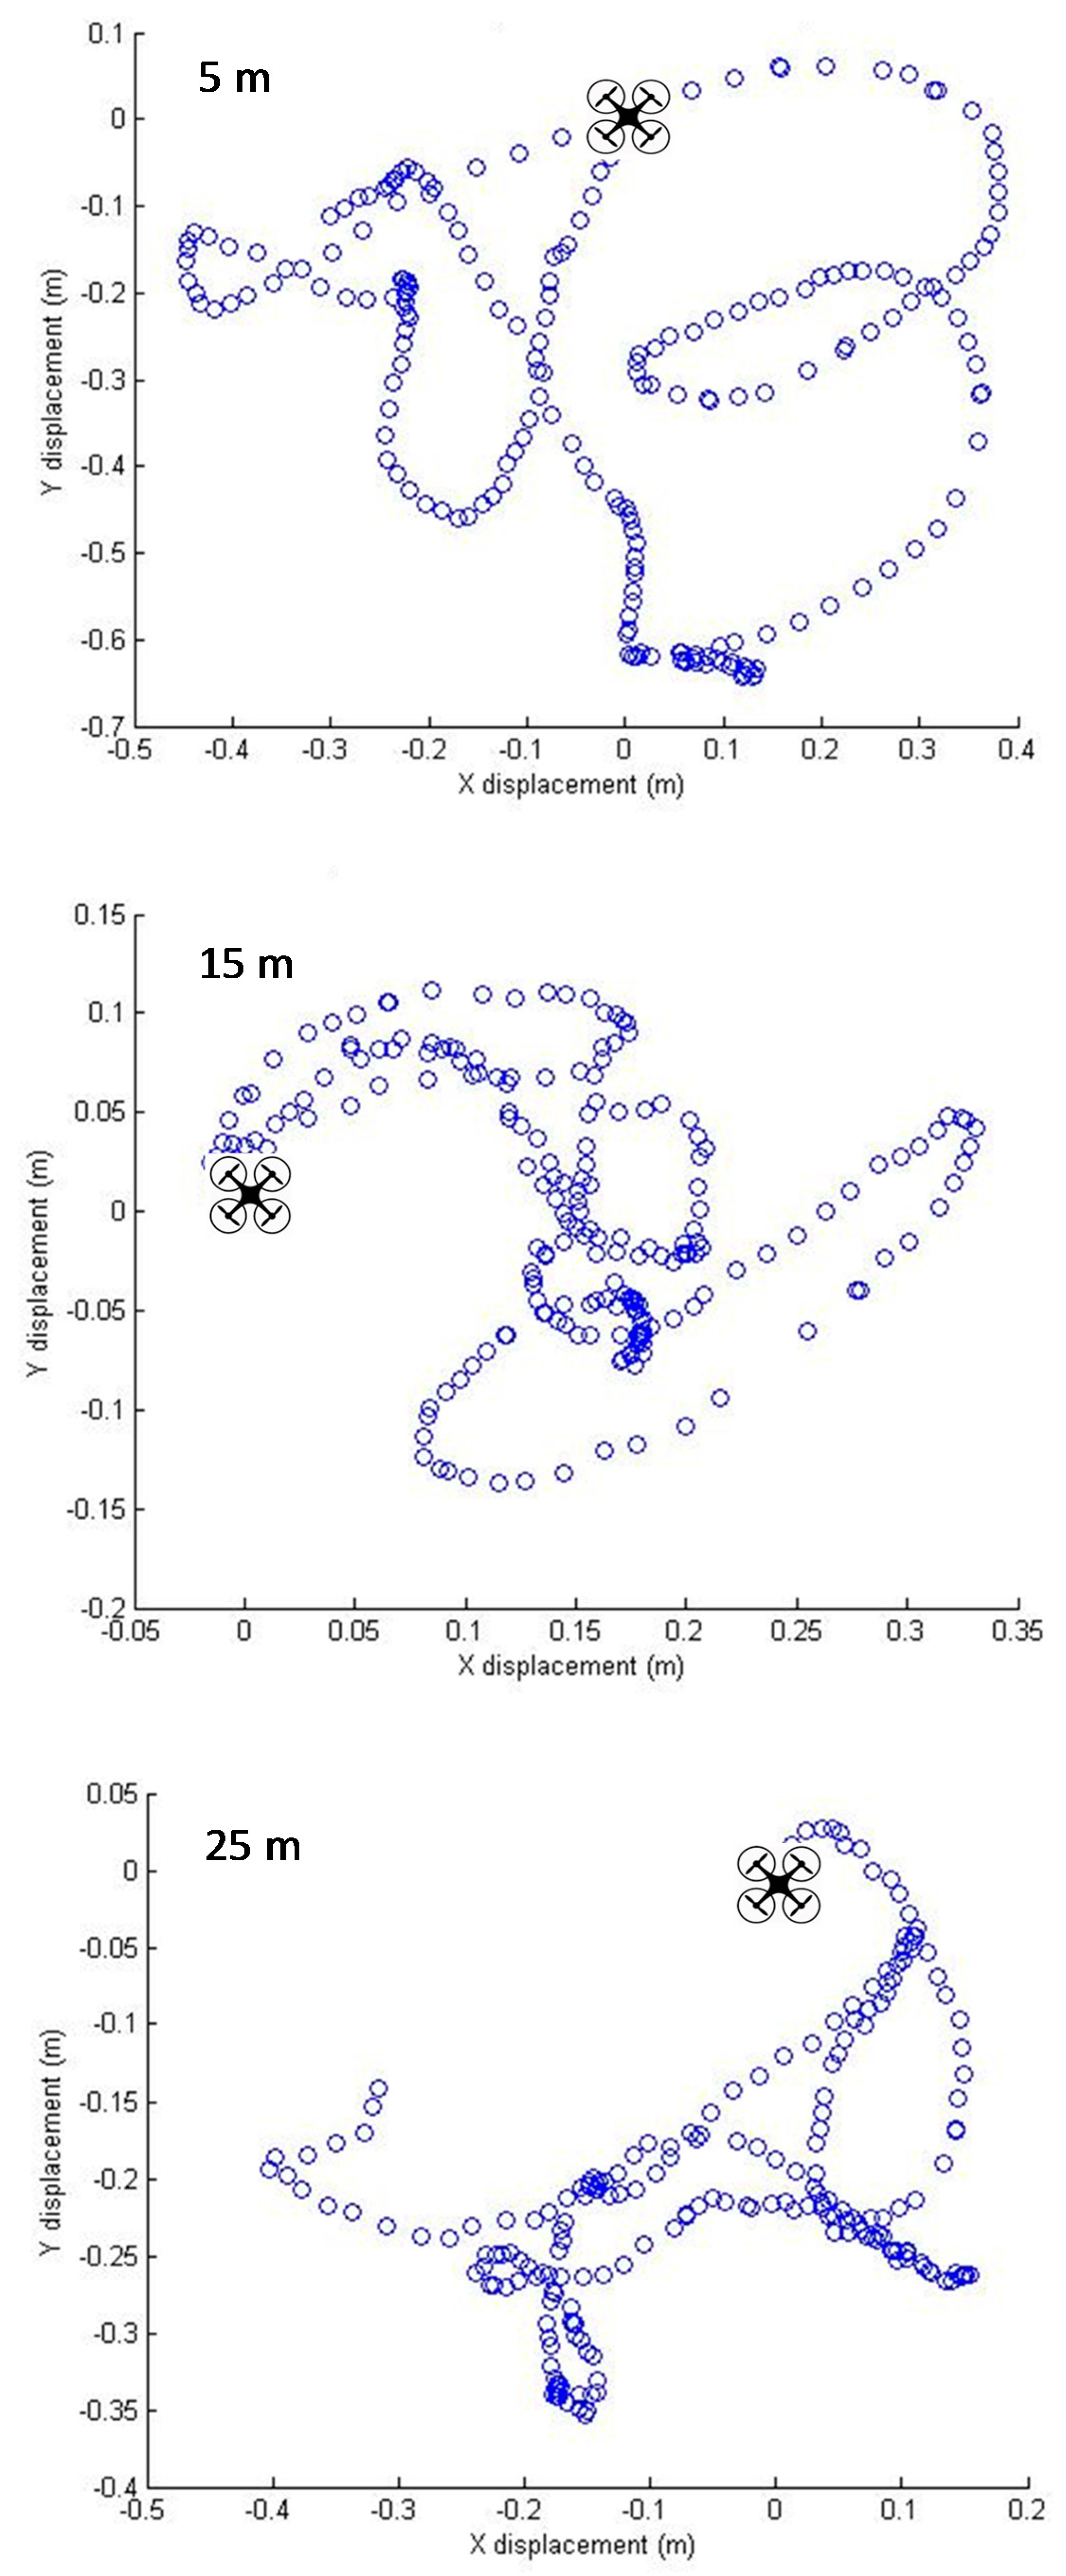
2.3.1. Hovering Test
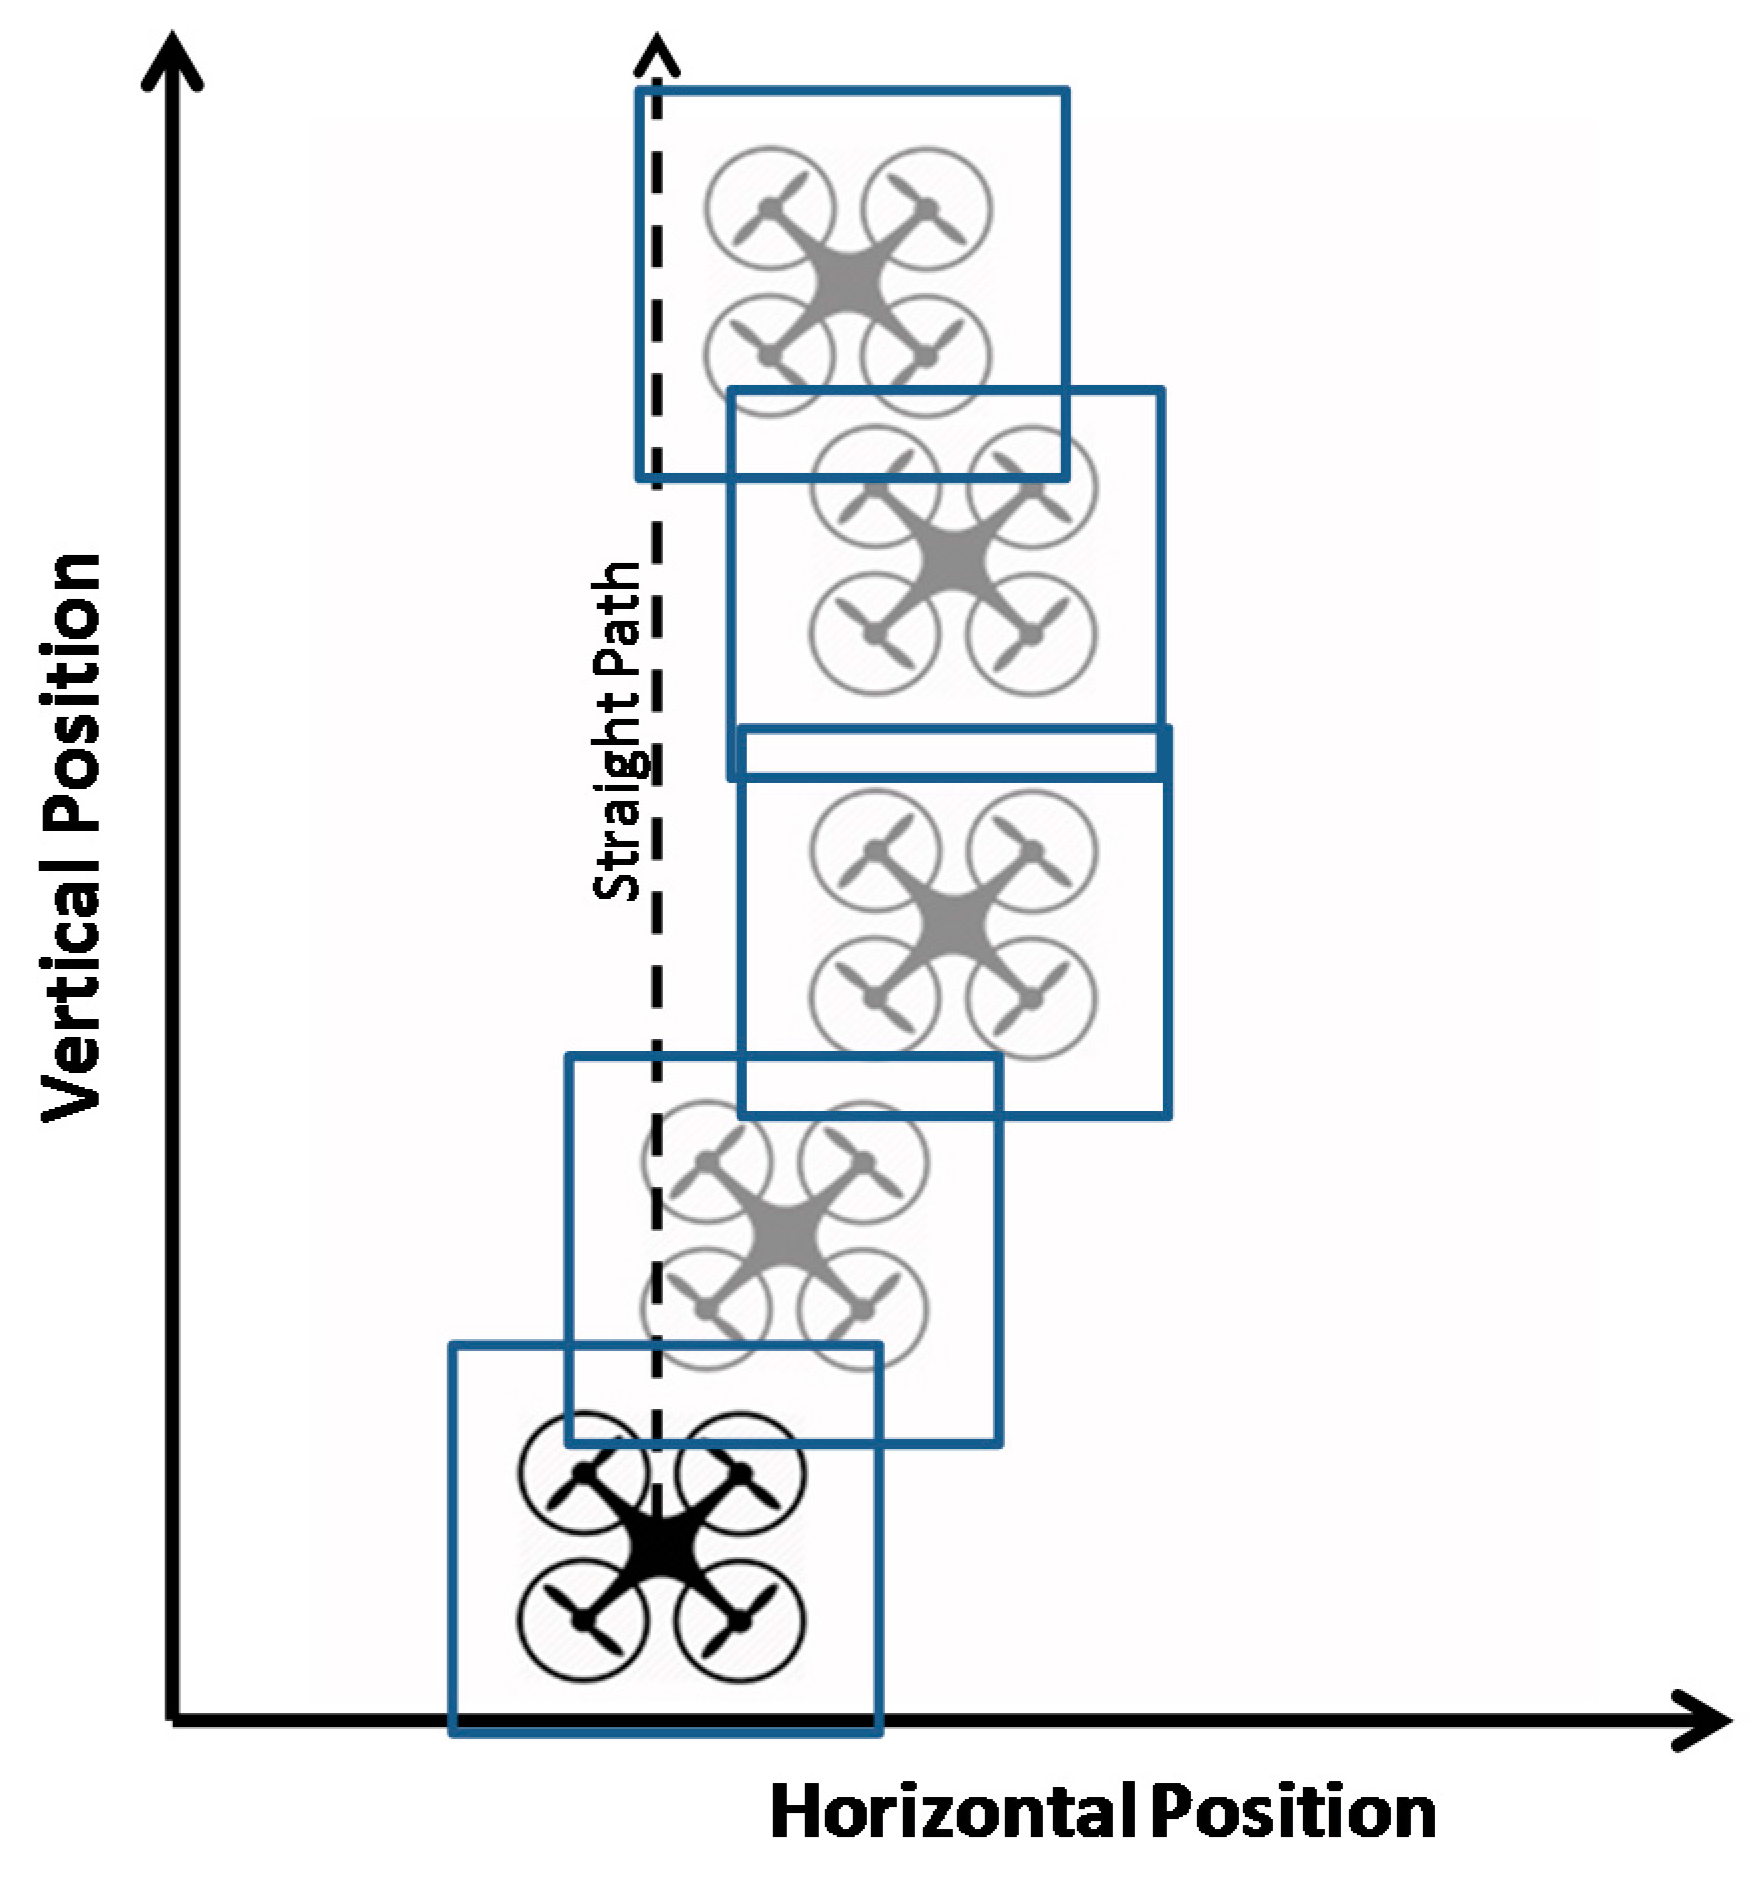
2.3.2. Rectilinear Motion Test
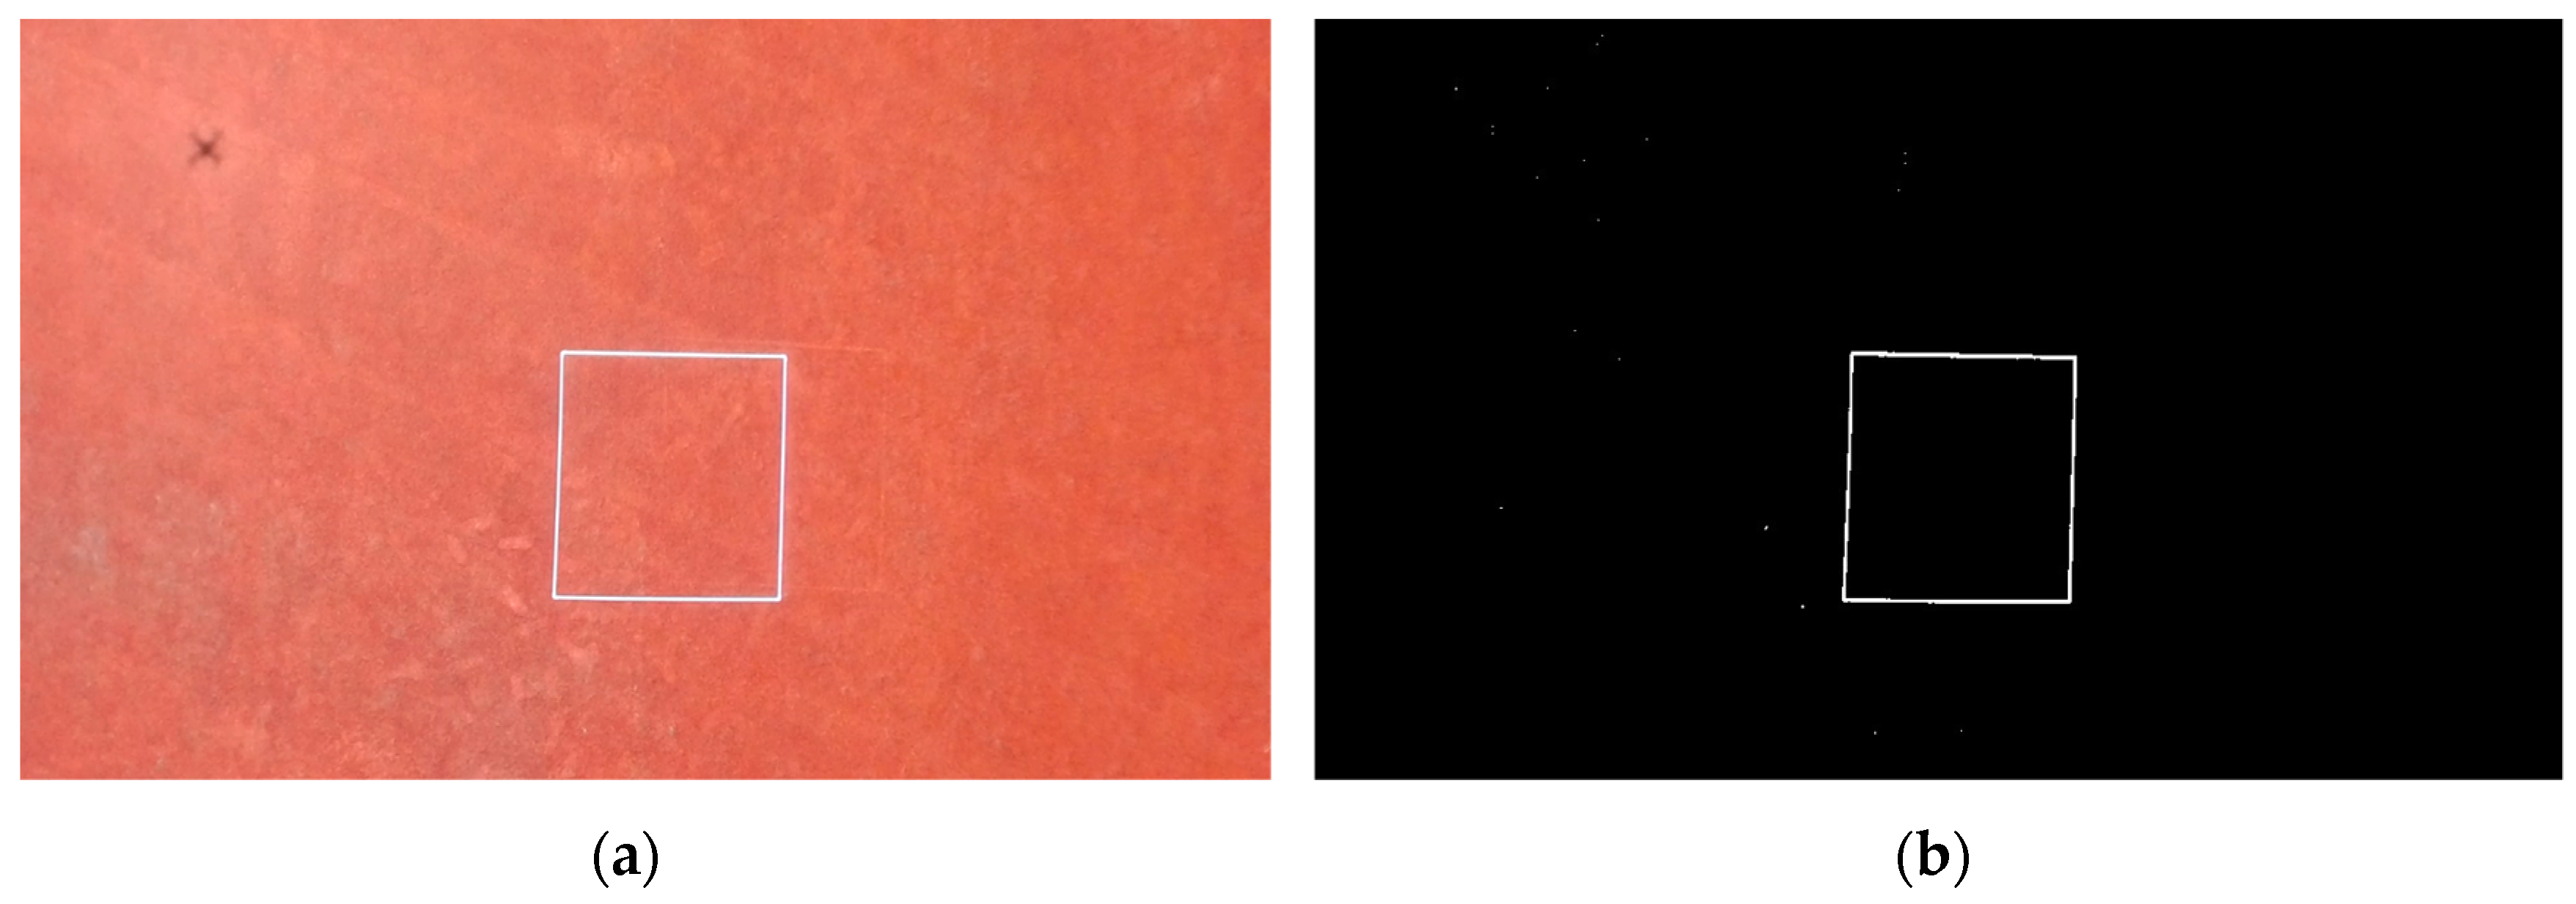
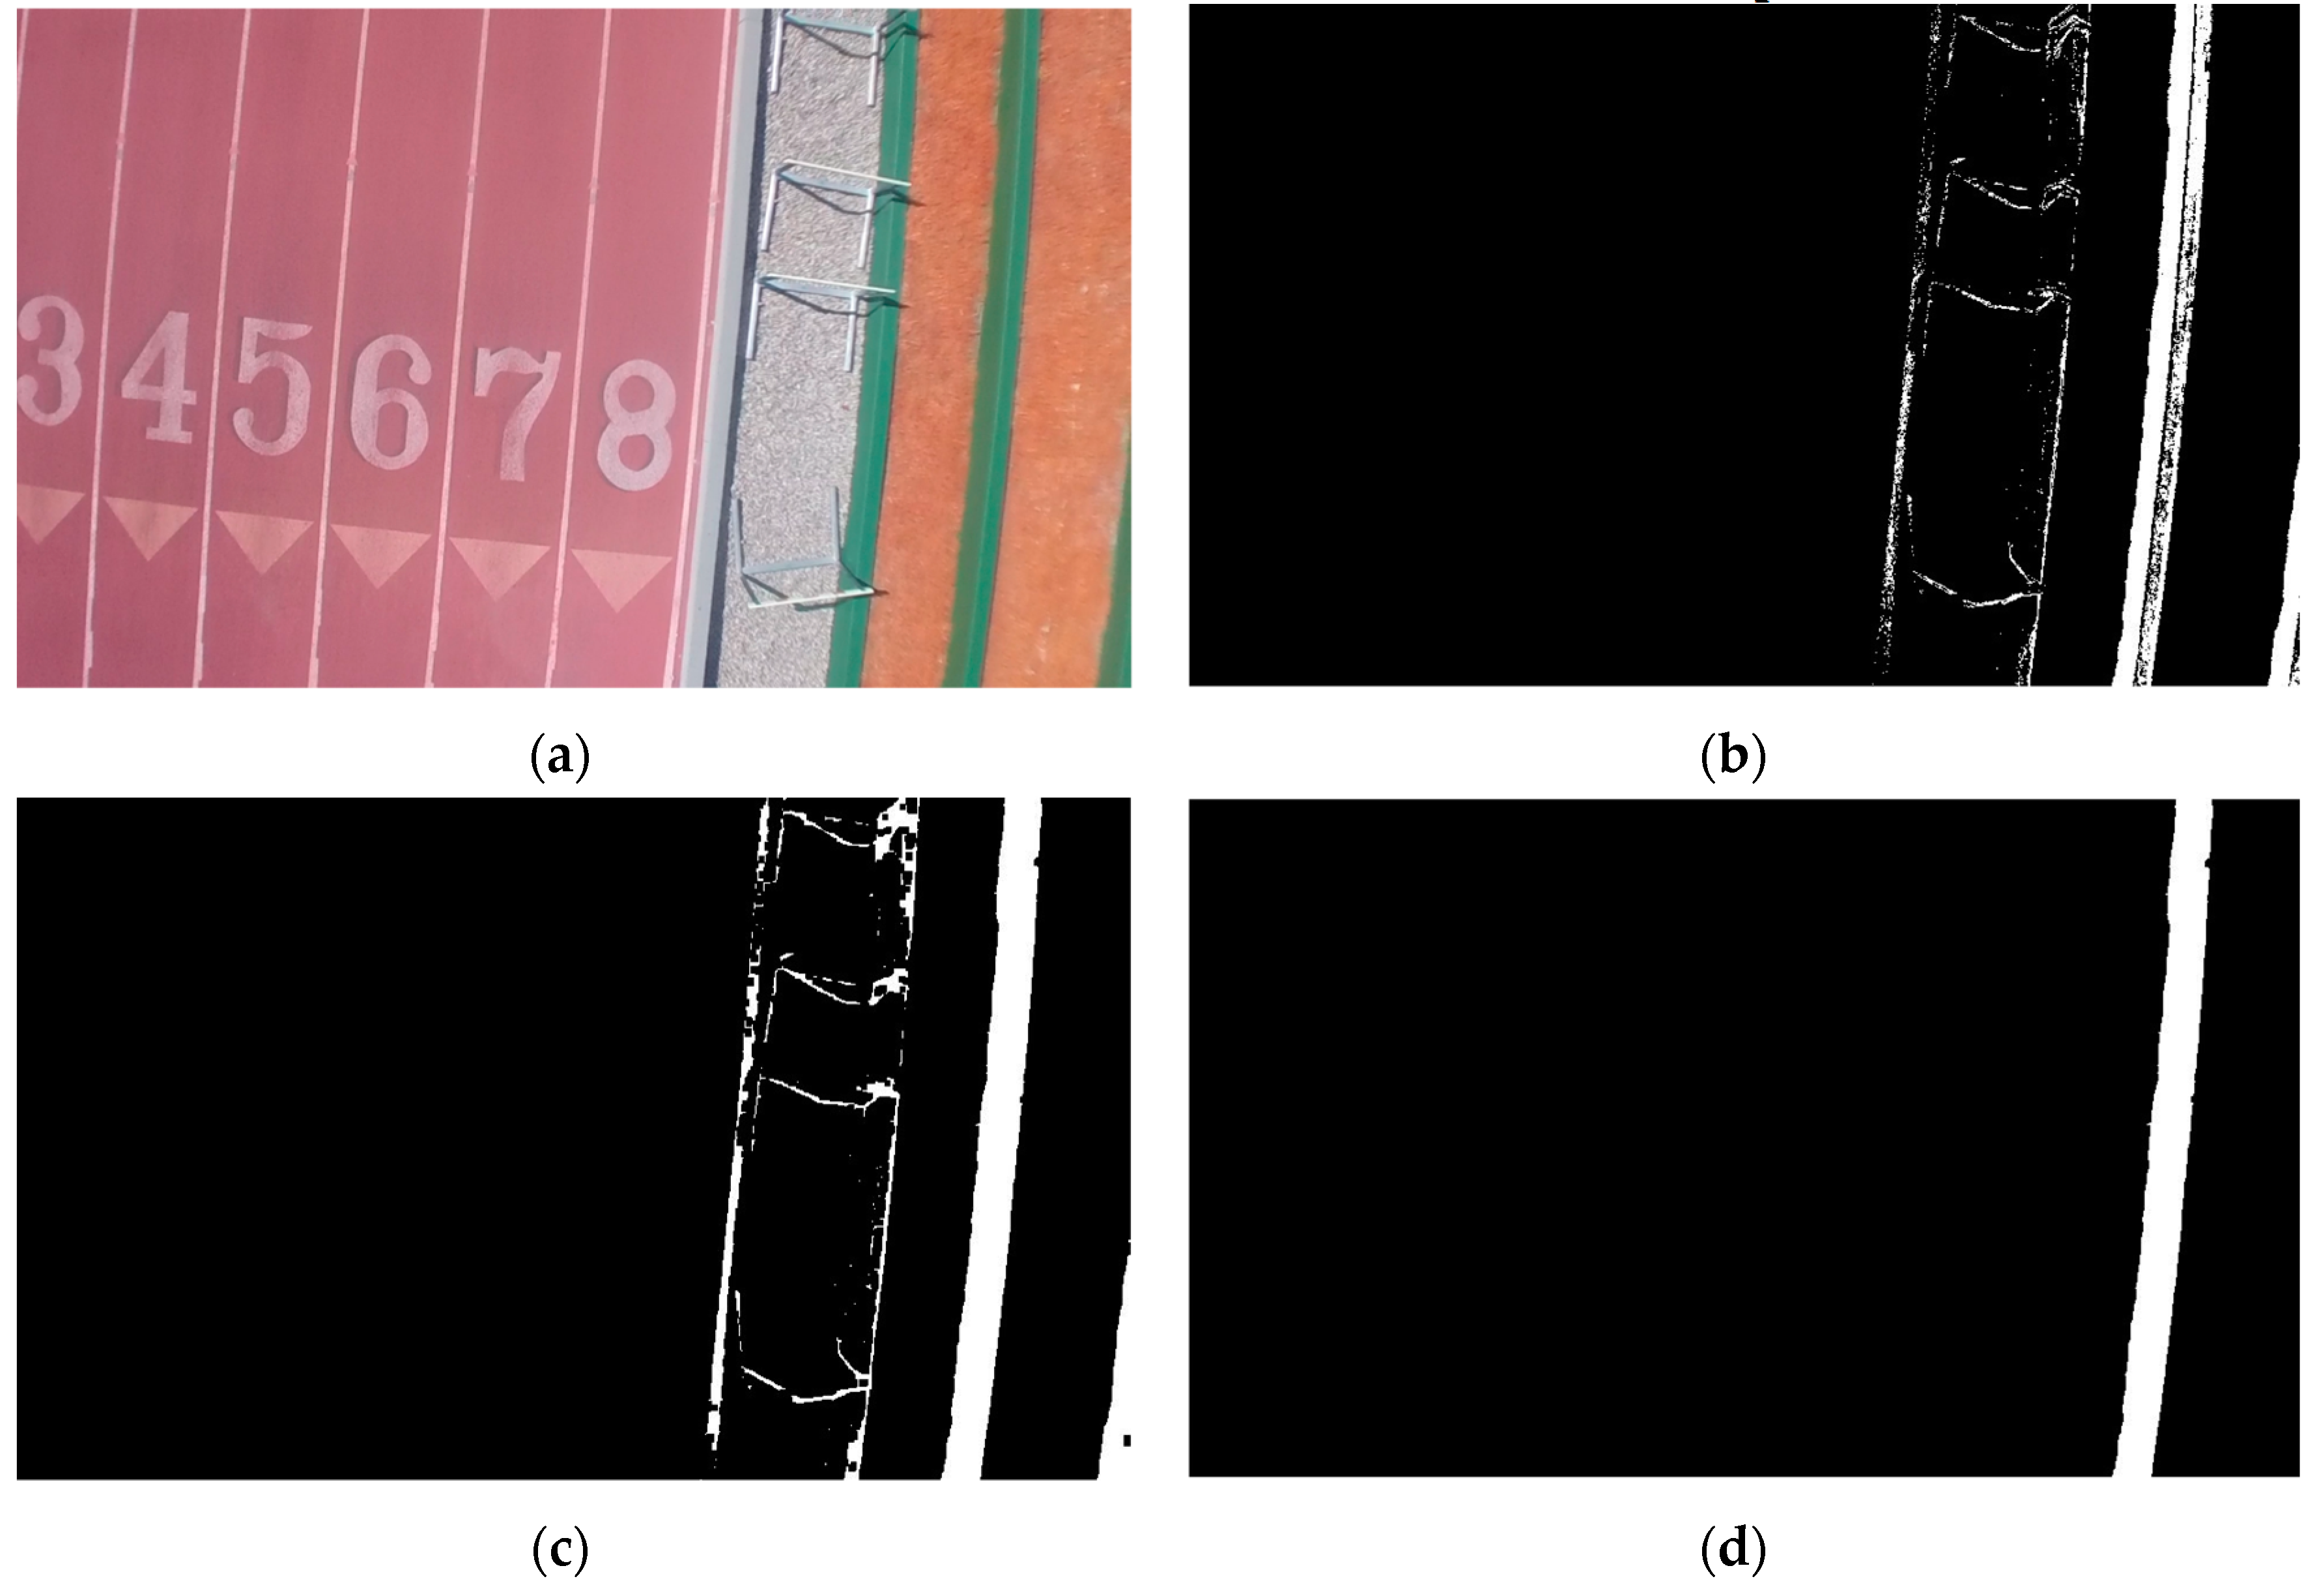
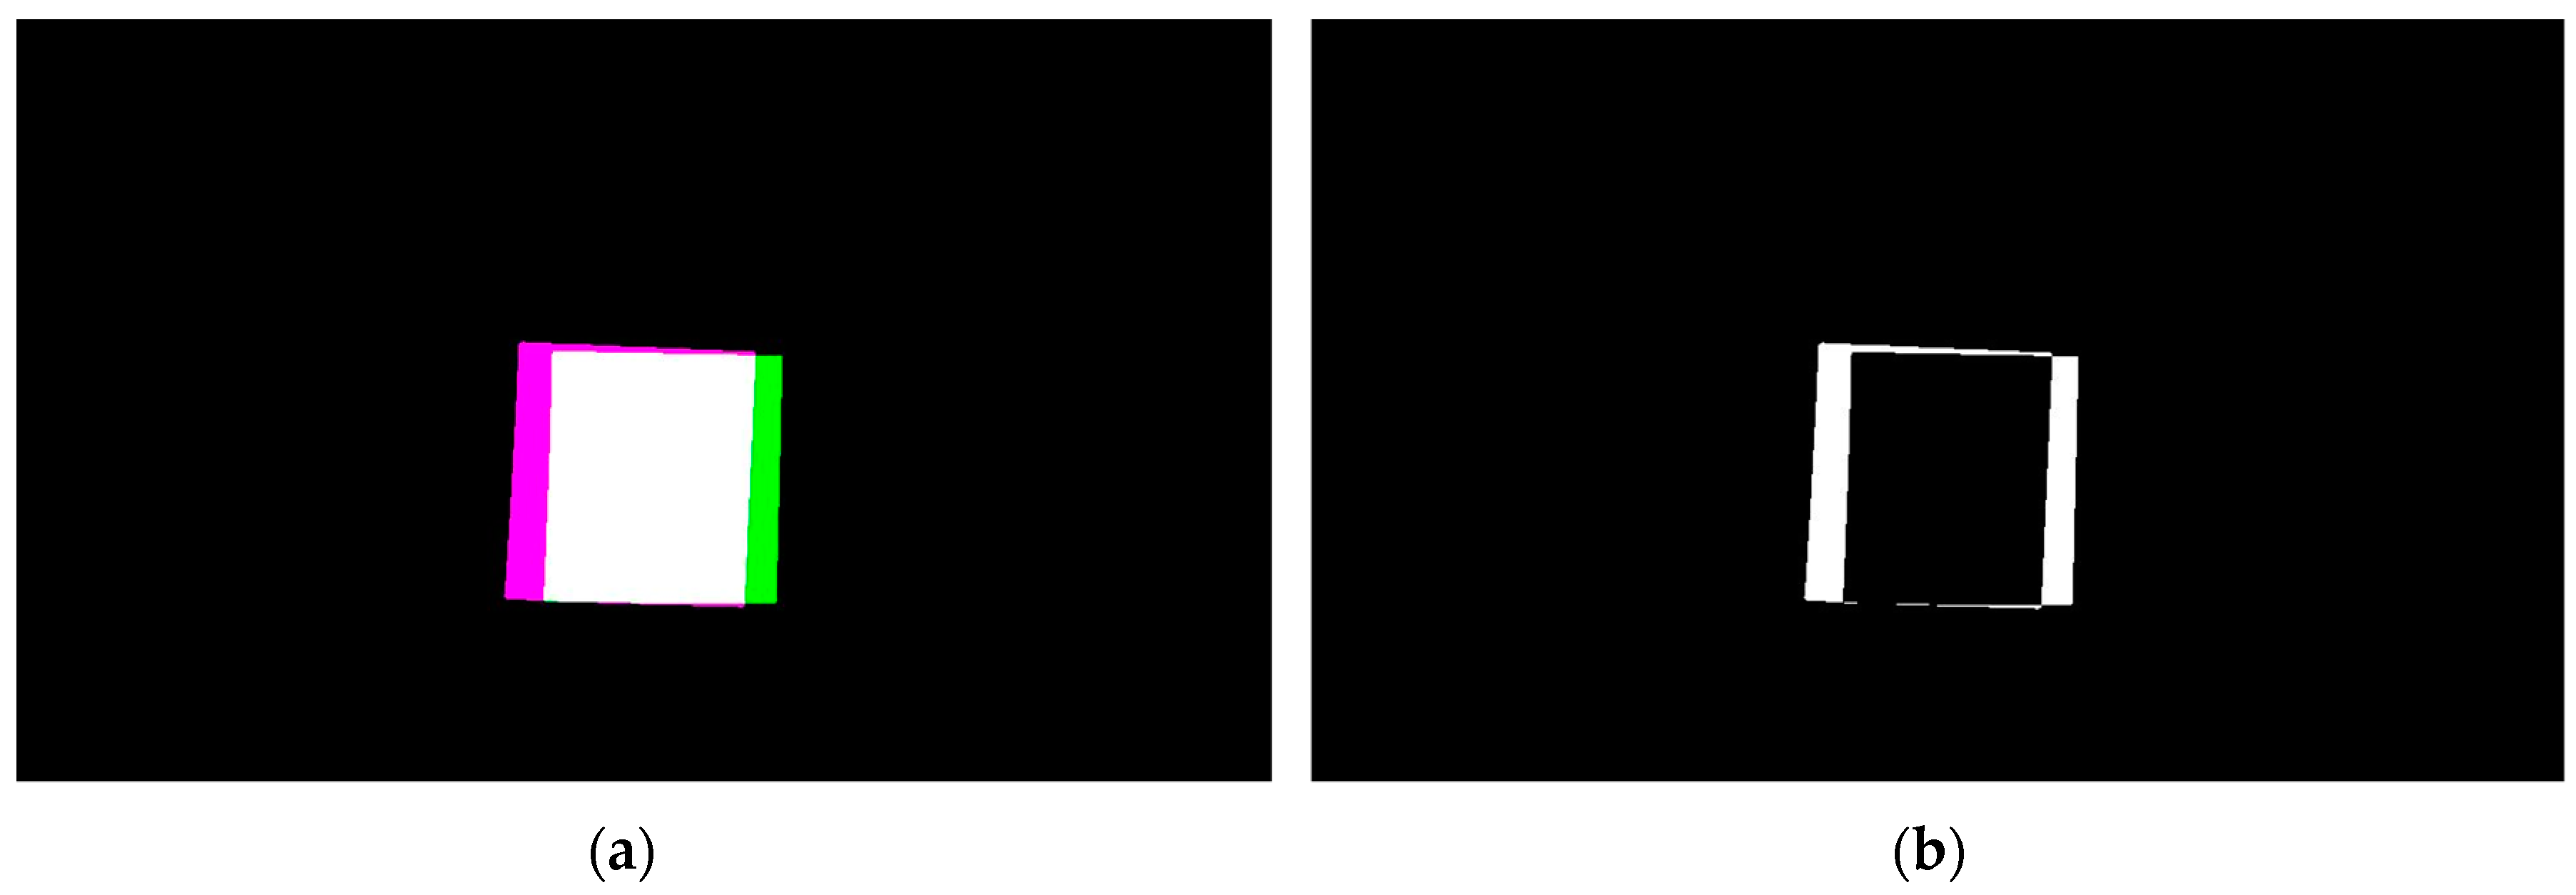
2.4. Image Processing for Performance Evaluation
2.4.1. Hovering Test
2.4.2. Rectilinear Motion Test
3. Results and Discussion
3.1. Hovering Test
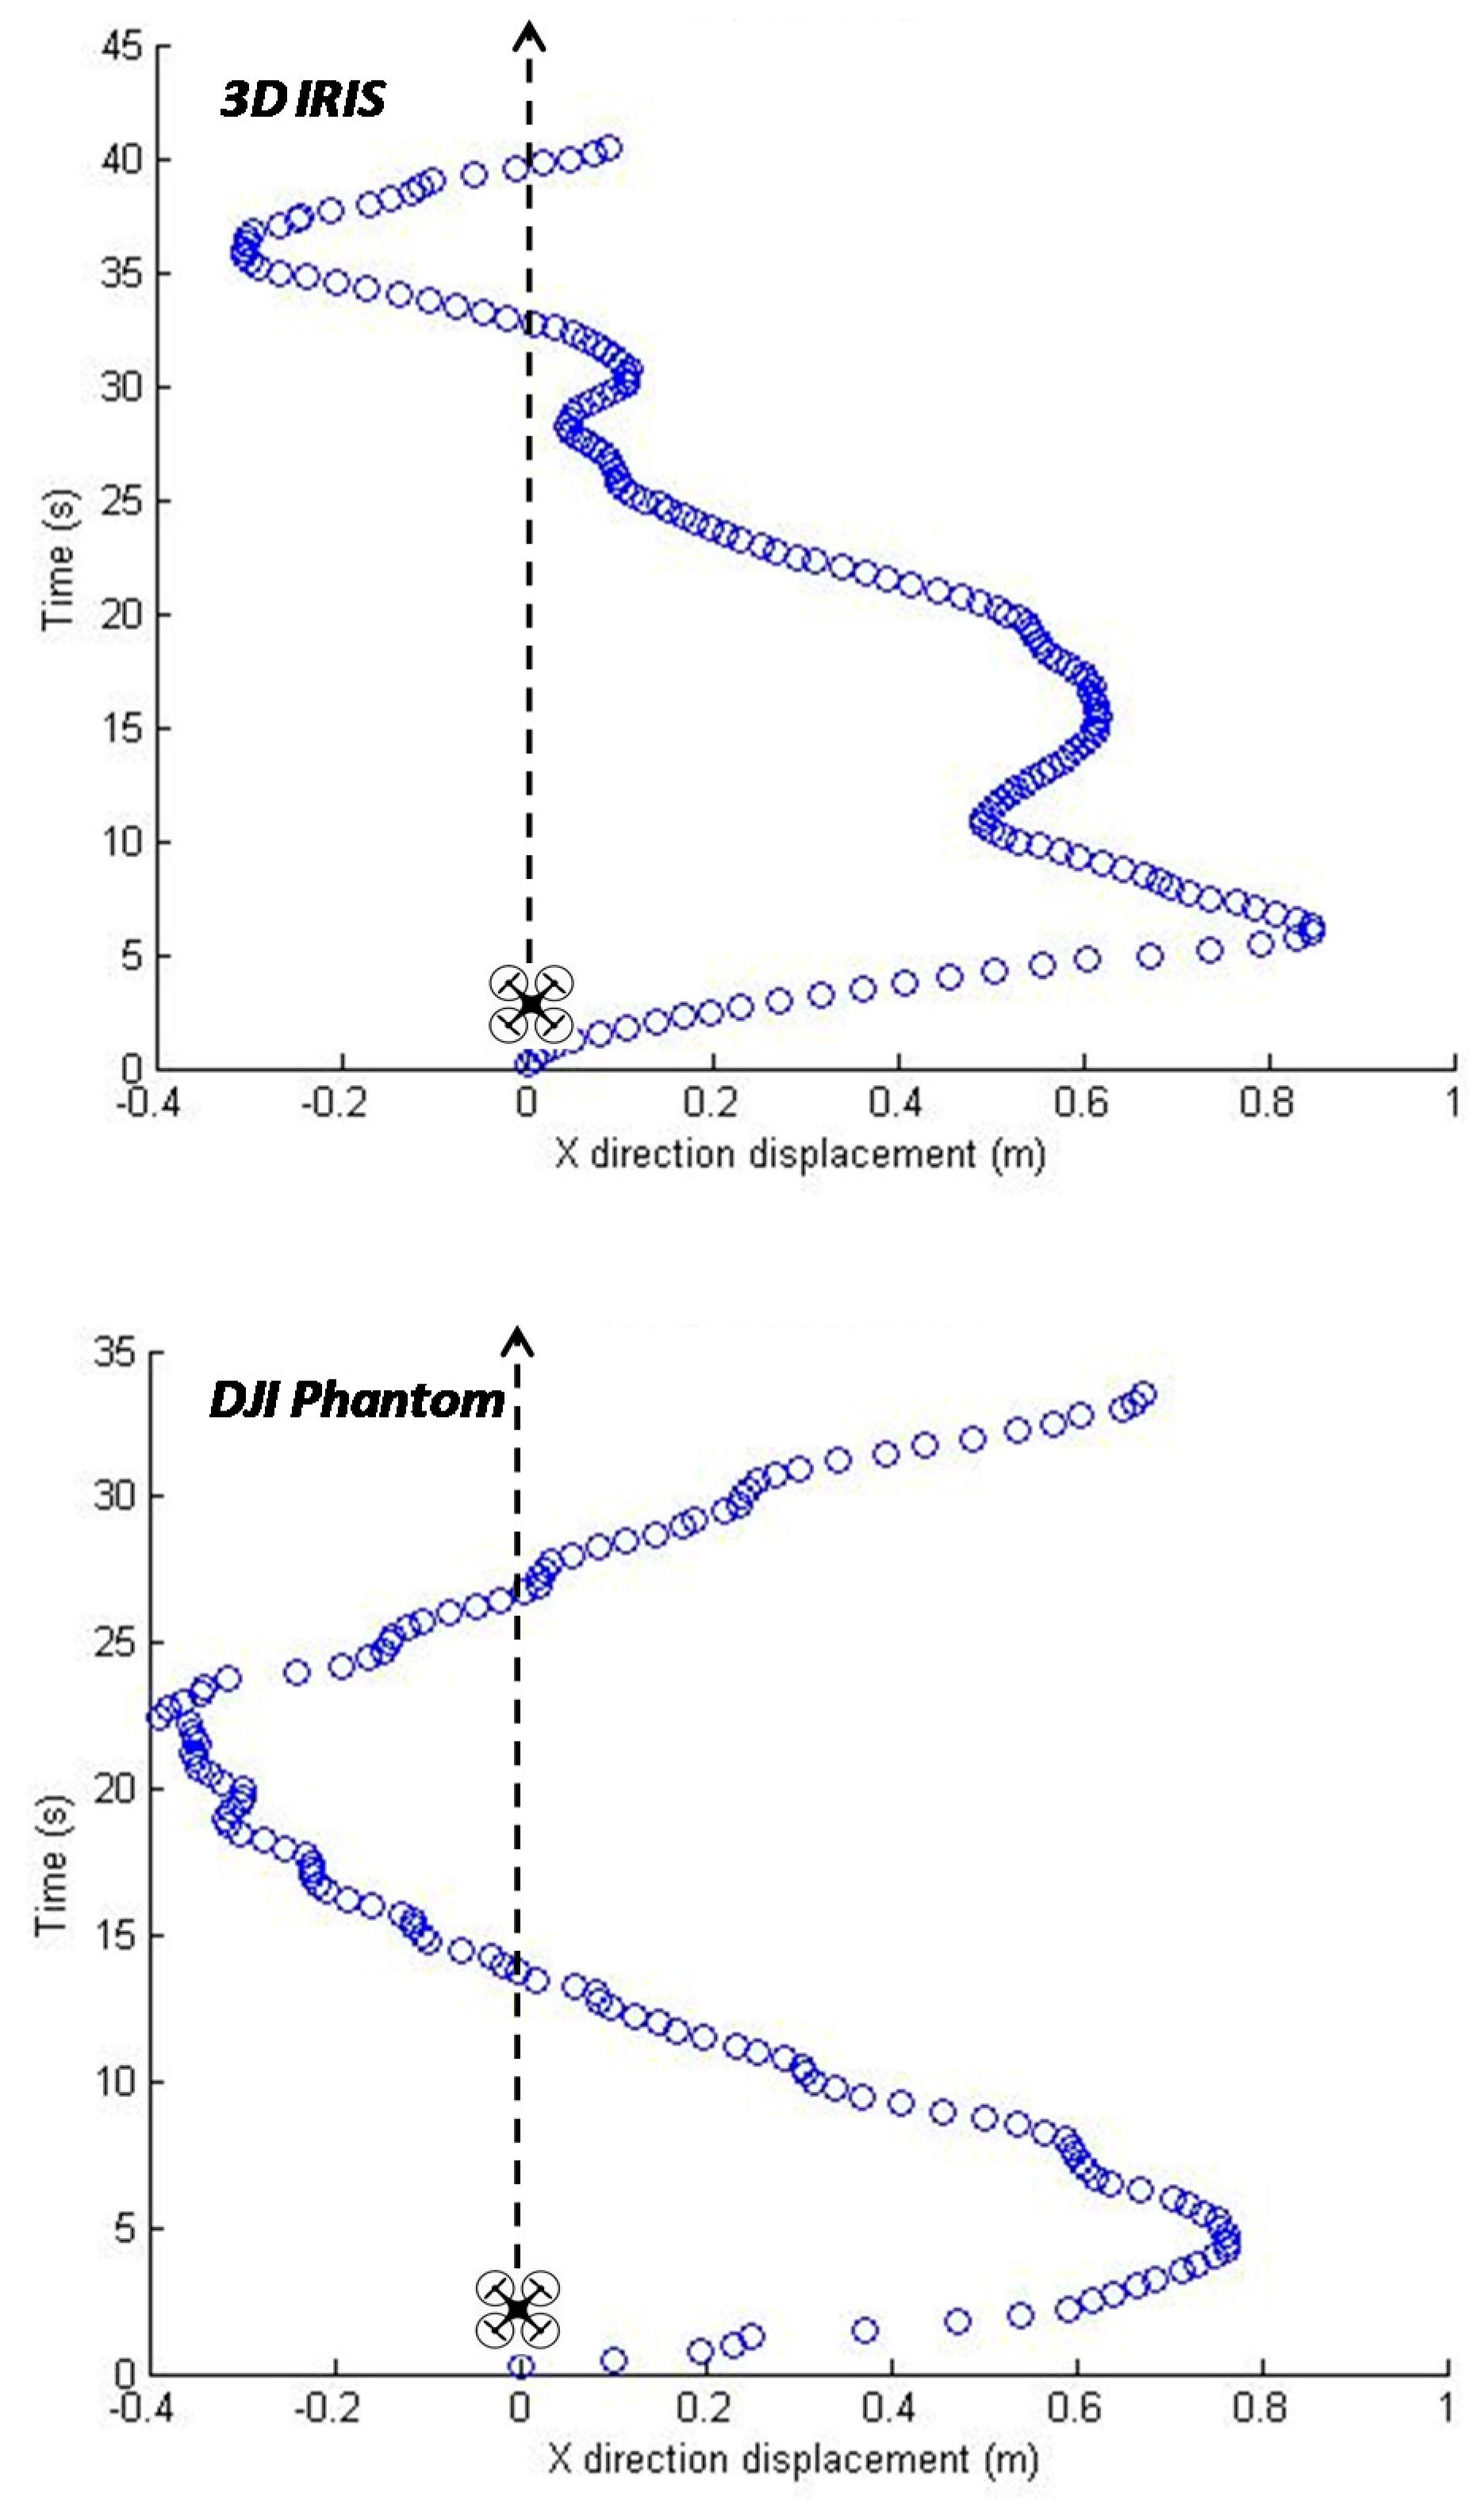
3.2. Rectilinear Motion Test
4. Conclusions
Acknowledgments
Author Contributions
Conflicts of Interest
Abbreviations
| DIY | Do it yourself |
| GIS | Geographical Information System |
| GPS | Global Positioning System |
| NGB | Near-infrared, Green, Blue |
| NNU | Northwest Nazarene University |
| PVC | Polyvinyl Chloride |
| RMS | Root Mean Square |
| RGB | Red, Green, Blue |
| sUAV | Small Unmanned Aerial Vehicle |
| UAV | Unmanned Aerial Vehicle |
| VI | Vegetation Index |
References
- Federal Aviation Administration. Summary of Small Unmanned Aircraft Rule. 2016. Available online: https://www.faa.gov/uas/media/Part_107_Summary.pdf (accessed on 6 January 2017). [Google Scholar]
- Robert, P.C. Precision agriculture: A challenge for crop nutrition management. Plant Soil 2002, 247, 143–149. [Google Scholar] [CrossRef]
- Lee, W.S.; Alchanatis, V.; Yang, C.; Hirafuji, M.; Moshou, D.; Li, C. Sensing technologies for precision specialty crop production. Comput. Electron. Agric. 2010, 74, 2–33. [Google Scholar] [CrossRef]
- Koch, B.; Khosla, R. The role of precision agriculture in cropping systems. J. Crop Prod. 2003, 9, 361–381. [Google Scholar] [CrossRef]
- Seelan, S.K.; Laguette, S.; Casady, G.M.; Seielstad, G.A. Remote sensing applications for precision agriculture: A learning community approach. Remote Sens. Environ. 2003, 88, 157–169. [Google Scholar] [CrossRef]
- Sugiura, R.; Noguchi, N.; Ishii, K. Remote-sensing technology for vegetation monitoring using an unmanned helicopter. Biosyst. Eng. 2005, 90, 369–379. [Google Scholar] [CrossRef]
- Albergel, C.; De Rosnay, P.; Gruhier, C.; Munoz-Sabater, J.; Hasenauer, S.; Isaken, L.; Kerr, Y.; Wagner, W. Evaluation of remotely sensed and modelled soil moisture products using global ground-based in situ observations. Remote Sens. Environ. 2012, 118, 215–226. [Google Scholar] [CrossRef]
- Lan, Y.; Thomson, S.J.; Huang, Y.; Hoffmann, W.C.; Zhang, H. Current status and future directions of precision aerial application for site-specific crop management in the USA. Comput. Electron. Agric. 2010, 74, 34–38. [Google Scholar] [CrossRef]
- Garcia-Ruiz, F.; Sankaran, S.; Maja, J.M.; Lee, W.S.; Rasmussen, J.; Ehsani, R. Comparison of two aerial imaging platforms for identification of Huanglongbing-infected citrus trees. Comput. Electron. Agric. 2013, 91, 106–115. [Google Scholar] [CrossRef]
- Pajares, G. Overview and current status of remote sensing applications based on Unmanned Aerial Vehicles (UAVs). Photogramm. Eng. Remote Sens. 2015, 81, 281–329. [Google Scholar] [CrossRef]
- Thomasson, J.A.; Valasek, J. Small UAS in agricultural remote-sensing research at Texas A&M. ASABE Resour. Mag. 2016, 23, 19–21. [Google Scholar]
- Bulanon, D.M.; Lonai, J.; Skovgard, H.; Fallahi, E. Evaluation of different irrigation methods for an apple orchard using an aerial imaging system. ISPRS Int. J. Geo-Inf. 2016, 5, 79. [Google Scholar] [CrossRef]
- Chao, H.Y.; Cao, Y.C.; Chen, Y.Q. Autopilots for small unmanned aerial vehicles: A survey. Int. J. Control Autom. Syst. 2010, 8, 36–44. [Google Scholar] [CrossRef]
- Ettinger, S.; Nechyba, M.; Ifju, P.; Waszak, M. Vision-guided flight stability and control for microair vehicles. Adv. Robot. 2003, 17, 617–640. [Google Scholar] [CrossRef]
- Carnie, R.; Walker, R.; Corke, P. Image Processing Algorithms for UAV “Sense and Avoid”. In Proceedings of the 2006 IEEE International Conference on Robotics and Automation, Orlando, FL, USA, 15–19 May 2006; pp. 2828–2853.
- Classification of the Unmanned Aerial Systems. Available online: https://www.e-education.psu.edu/geog892/node/5 (accessed on 29 June 2016).
- Federal Aviation Administration. Available online: https://registermyuas.faa.gov (accessed on 29 June 2016).
- 3D Robotics (3DR). Available online: https://store.3dr.com/products/IRIS+ (accessed on 29 June 2016).
- Da-Jiang Innovations (DJI). Available online: http://www.dji.com/product/phantom-2 (accessed on 29 June 2016).
- Cetinkunt, S. Mechatronics with Experiments, 2nd ed.; Wiley & Sons Ltd.: West Sussex, UK, 2015. [Google Scholar]
- Pajares, G.; García-Santillán, I.; Campos, Y.; Montalvo, M.; Guerrero, J.M.; Emmi, L.; Romeo, J.; Guijarro, M.; Gonzalez-de-Santos, P. Machine-vision systems selection for agricultural vehicles: A guide. J. Imaging 2016, 2, 34. [Google Scholar] [CrossRef]
- Stadler, W. Analytical Robotics and Mechatronics; McGraw-Hill: New York, NY, USA, 1995. [Google Scholar]
- Xiang, H.; Tian, L. Development of a low-cost agricultural remote sensing system based on an autonomous unmanned aerial vehicle (UAV). Biosyst. Eng. 2011, 108, 174–190. [Google Scholar] [CrossRef]
- Gonzalez, R.C.; Woods, R.E. Digital Image Processing, 3rd ed.; Pearson: New York, NY, USA, 2007. [Google Scholar]
- Hunt, E.R., Jr.; Hively, W.D.; Fujikawa, S.J.; Linden, D.S.; Daughtry, C.S.T.; McCarty, G.W. Acquisition of NIR-Green-Blue digital photographs from unmanned aircraft for crop monitoring. Remote Sens. 2010, 2, 290–305. [Google Scholar] [CrossRef]


| Features | IRIS+ | Phantom 2 |
|---|---|---|
| Motors | 4 | 4 |
| Max Payload | 400 g | 300 g |
| Flight Time | 16–22 min | 14–25 min |
| Max Flight Speed | 22.7 m/s | 15 m/s |
| Motor to Motor Dimensions | 550 mm | 350 mm |
| Flight Controller | Pixhawk | NASA-MV2 |
| Software (Ground Station) | Mission Planner | DJI Ground Station |
| Flight Modes | Manual | Manual |
| Hover | Hover | |
| Auto | Auto | |
| Battery | 5100 mAh | 5200 mAh |
| Gimbal | Tarot Go-Pro Gimbal | DJI Go-Pro Gimbal |
© 2017 by the authors; licensee MDPI, Basel, Switzerland. This article is an open access article distributed under the terms and conditions of the Creative Commons Attribution (CC-BY) license (http://creativecommons.org/licenses/by/4.0/).
Share and Cite
Cano, E.; Horton, R.; Liljegren, C.; Bulanon, D.M. Comparison of Small Unmanned Aerial Vehicles Performance Using Image Processing. J. Imaging 2017, 3, 4. https://doi.org/10.3390/jimaging3010004
Cano E, Horton R, Liljegren C, Bulanon DM. Comparison of Small Unmanned Aerial Vehicles Performance Using Image Processing. Journal of Imaging. 2017; 3(1):4. https://doi.org/10.3390/jimaging3010004
Chicago/Turabian StyleCano, Esteban, Ryan Horton, Chase Liljegren, and Duke M. Bulanon. 2017. "Comparison of Small Unmanned Aerial Vehicles Performance Using Image Processing" Journal of Imaging 3, no. 1: 4. https://doi.org/10.3390/jimaging3010004
APA StyleCano, E., Horton, R., Liljegren, C., & Bulanon, D. M. (2017). Comparison of Small Unmanned Aerial Vehicles Performance Using Image Processing. Journal of Imaging, 3(1), 4. https://doi.org/10.3390/jimaging3010004