
Detection and Characterization of Defects in Isotropic and Anisotropic Structures Using Lockin Thermography


Abstract
:1. Introduction
2. Principle of Lockin Thermography
3. Experimental
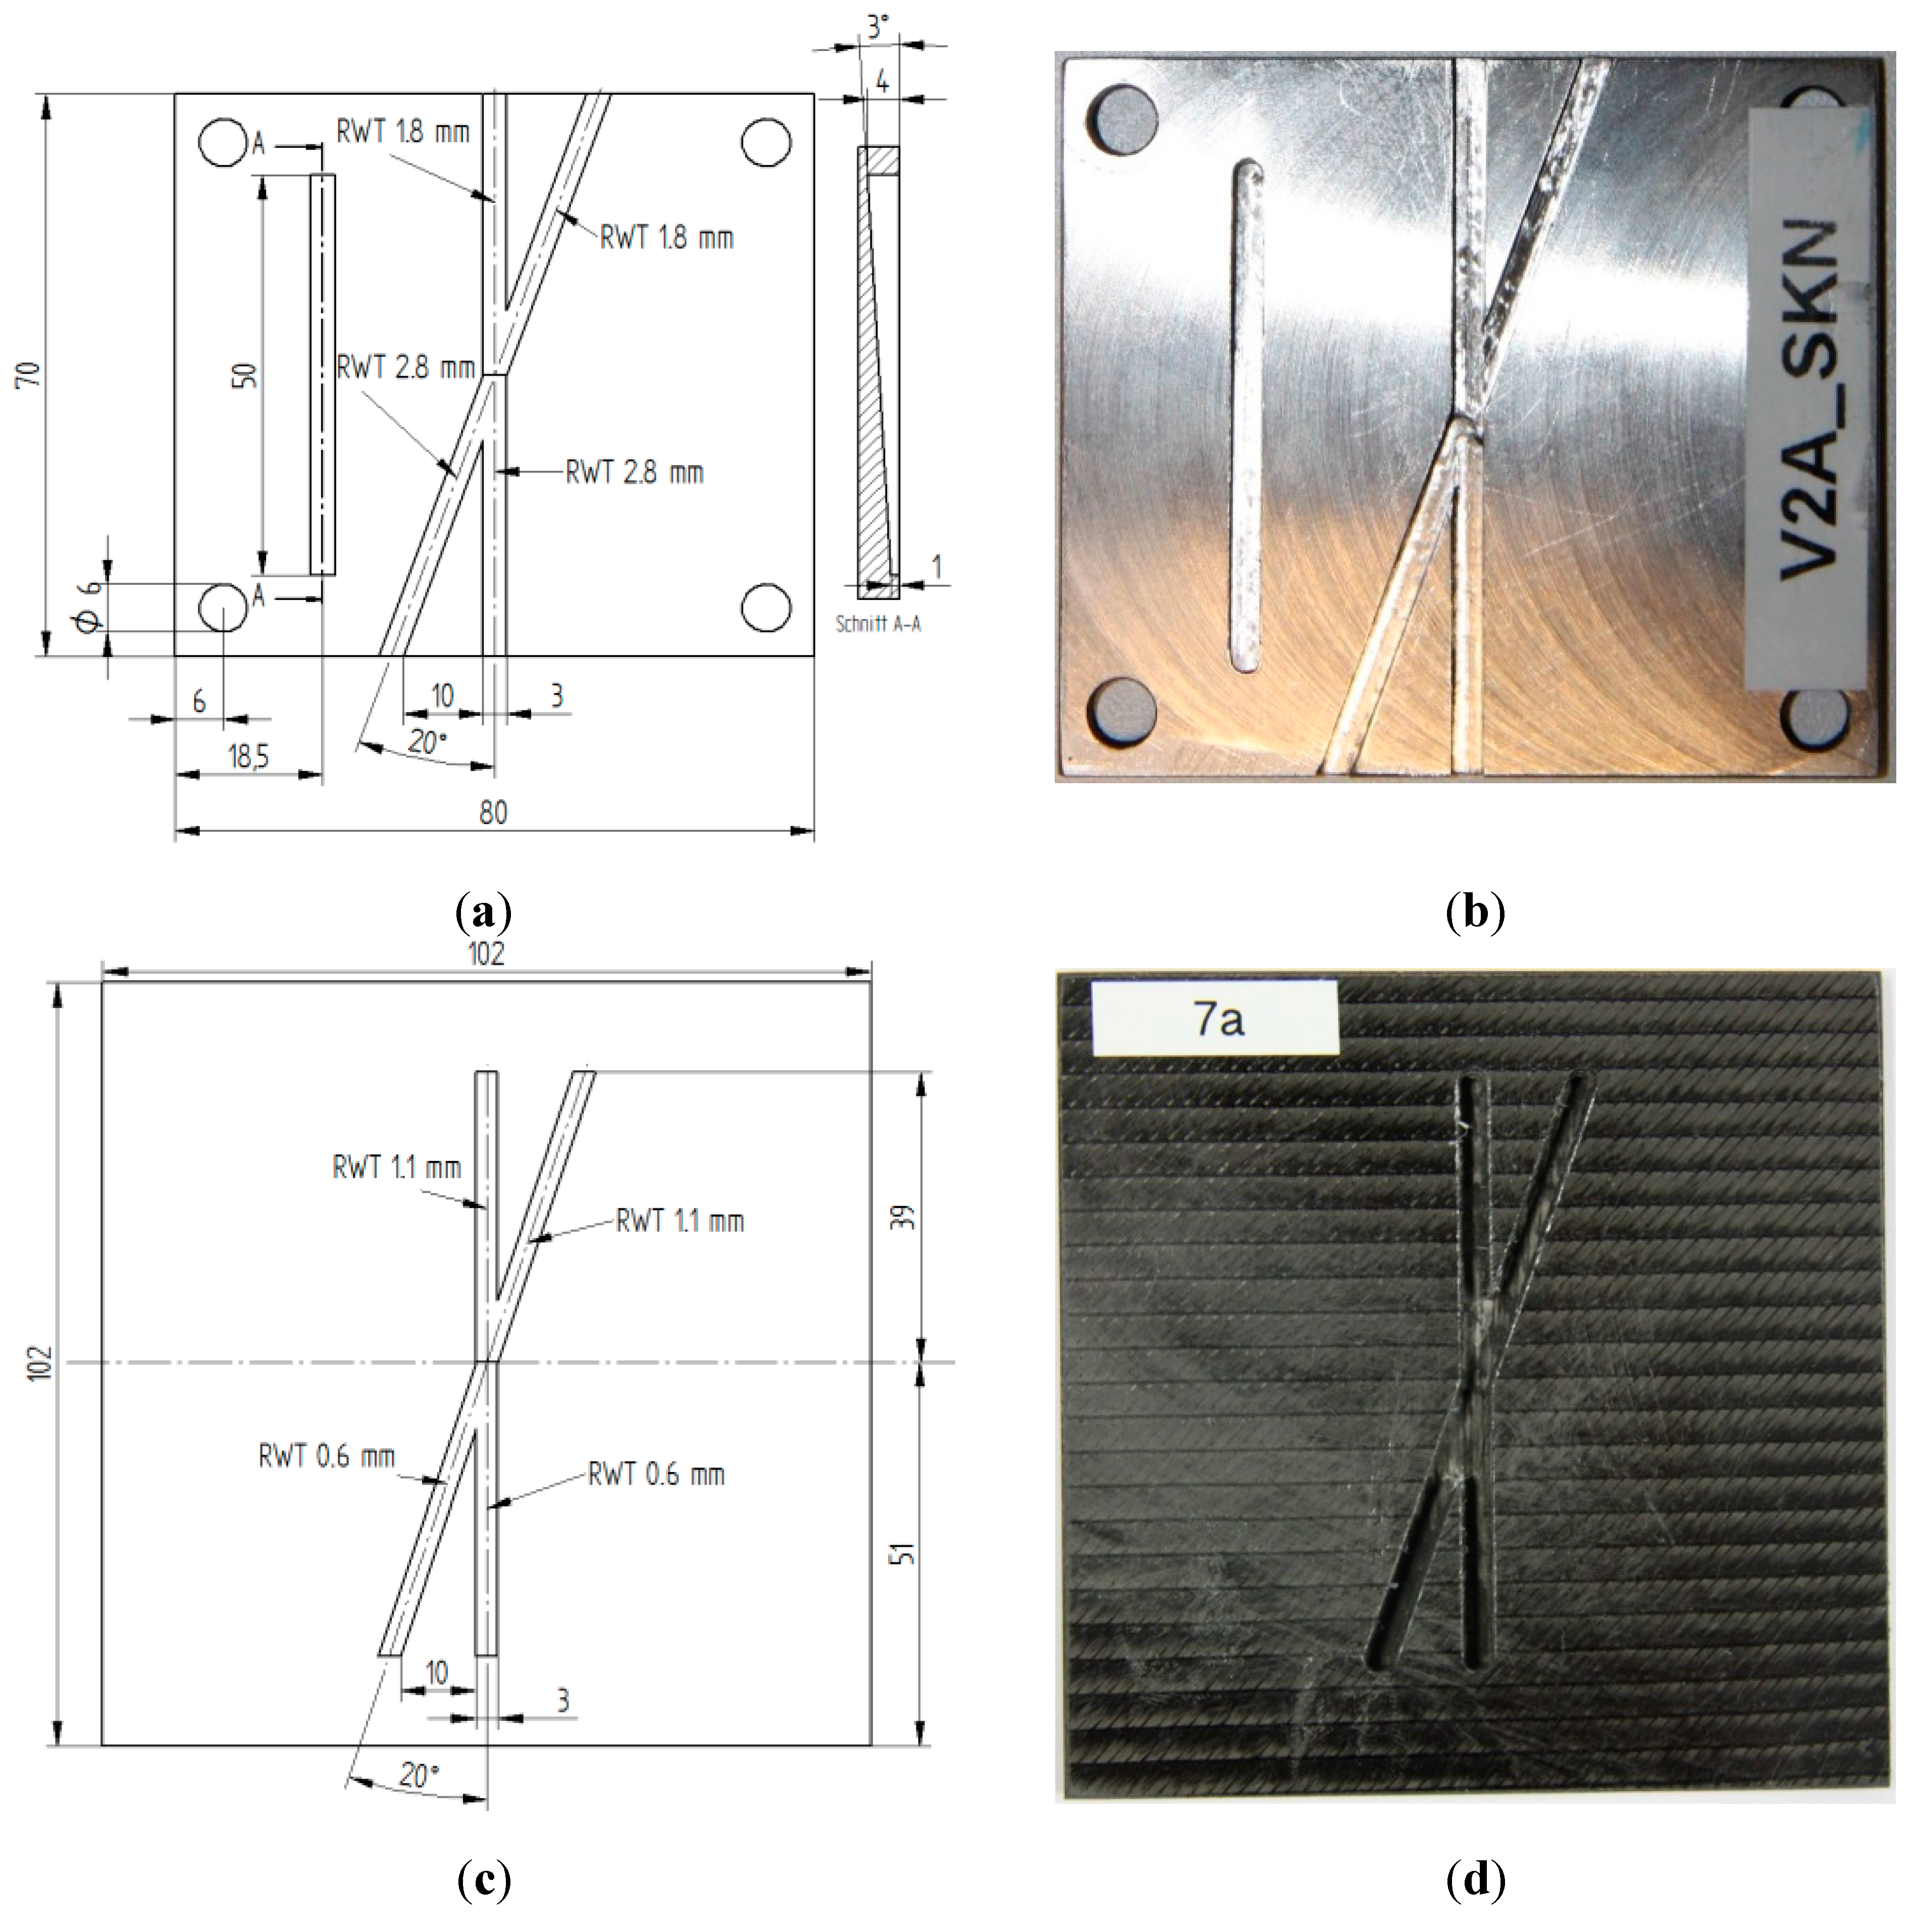
3.1. Test Specimens

| Test Samples | V2A Steel (1.4301, X5CrNi18-10) | Steel 1.4034 X46Cr13 | CFRP Quasiisotropic | |
|---|---|---|---|---|
| No. 2.1 Notch | No. 1.1 FBH | No. 1.2 FBH, No. 2.2 Notch | ||
| Thermal diffusivity in cm2/s (values in brackets are from literature) | 0.038 ± 0.002 (0.038) * | 0.066 ± 0.004 (0.071) ** | Perpendicular to the surface: 0.0025 ± 0.0003 | |
| Parallel to the surface: 0.0068 ± 0.0003 | ||||
| Thermal diffusion length (perpendicular to the surface for CFRP) in mm | 0.01 Hz | 11.0 | 14.5 | 2.82 |
| 0.02 Hz | 7.8 | 10.2 | 2.00 | |
| 0.05 Hz | 4.9 | 6.5 | 1.26 | |
| 0.10 Hz | 3.5 | 4.6 | 0.89 | |
| 0.20 Hz | 2.5 | 3.2 | 0.63 | |
| 0.50 Hz | 1.56 | 2.05 | 0.40 | |
| 1.00 Hz | 1.1 | 1.45 | 0.28 | |
3.1.1. Test Specimens with Flat Bottom Holes

3.1.2. Test Specimens with Crossed Notches
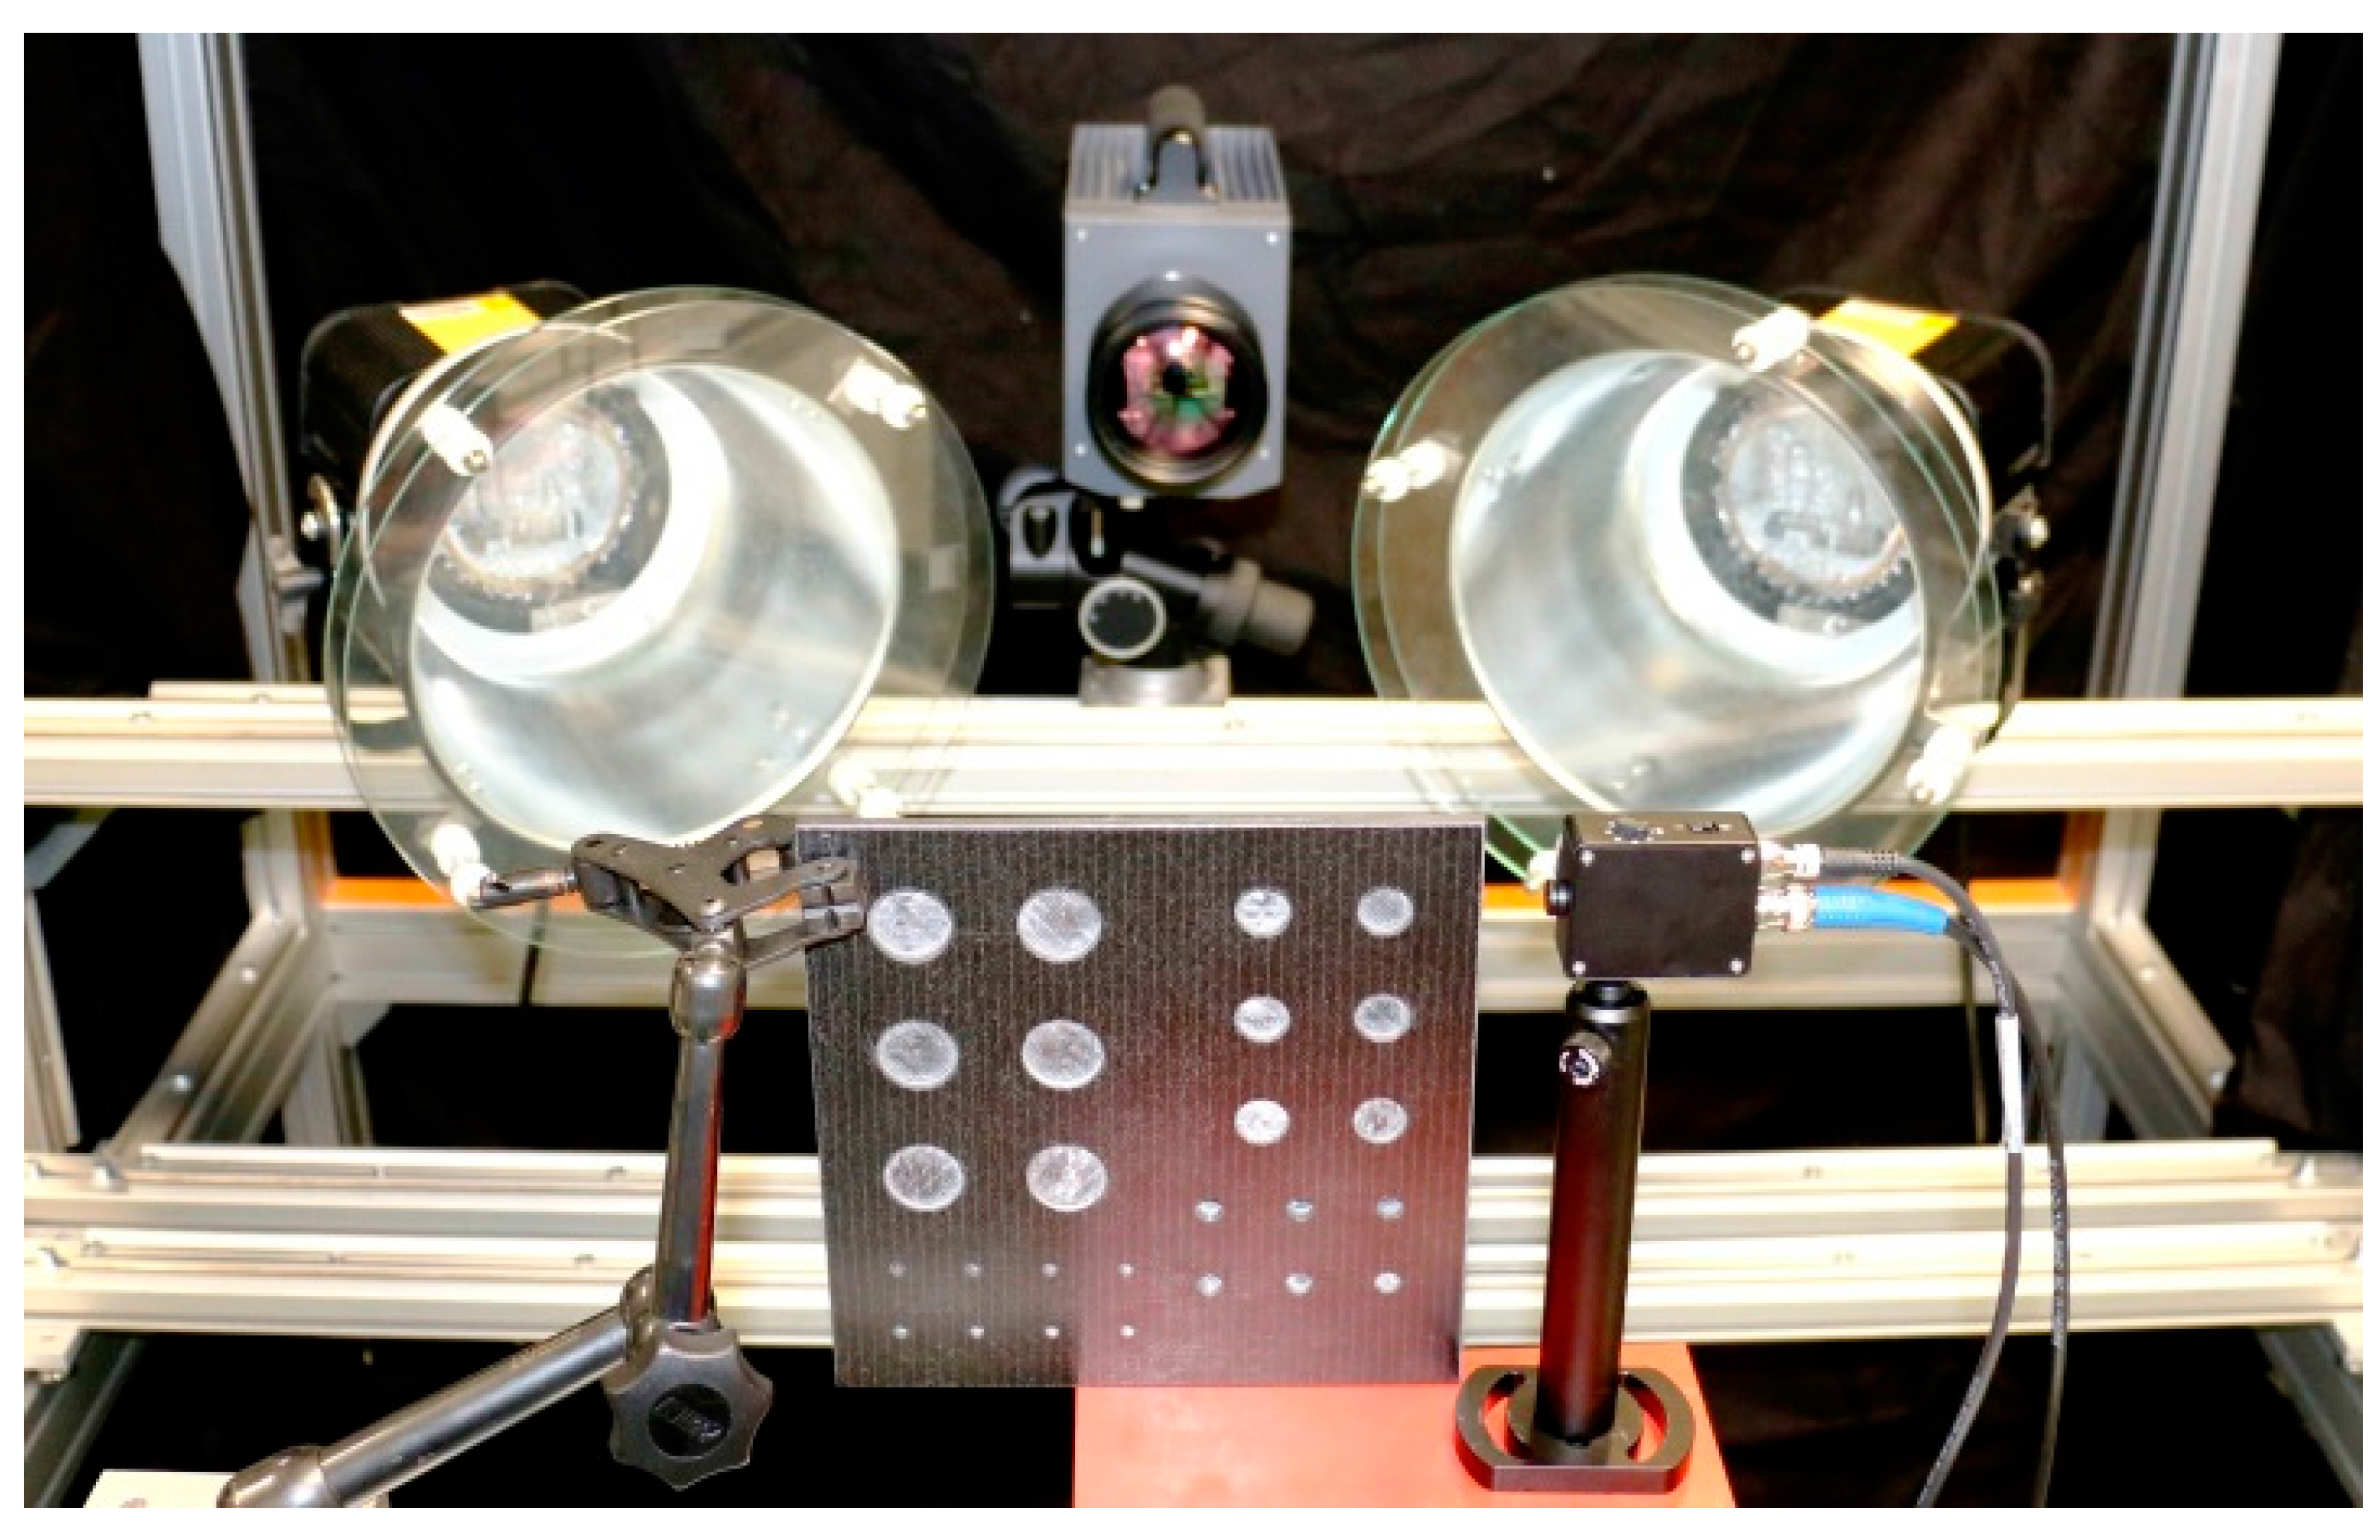
3.2. Experimental Set-up for Lockin Excitation
| Steel No. 1.1, 2.1 | CFRP No. 1.2, 2.2 | |
|---|---|---|
| Lockin frequencies in Hz | 0.1, 0.2, 0.5, 1 | 0.01, 0.02, 0.05, 0.1 |
| Recorded periods | 100 | 30 to 40 |
| Periods used for calculation | last 80 | last 20 |
| Phase lag of first period for calculation | 0° of thermal signal | 0° of thermal signal |
| sampling rate (frame rate) | 20 frames per period | 20 frames per period |
4. Results
4.1. Test Specimens with Flat Bottom Holes
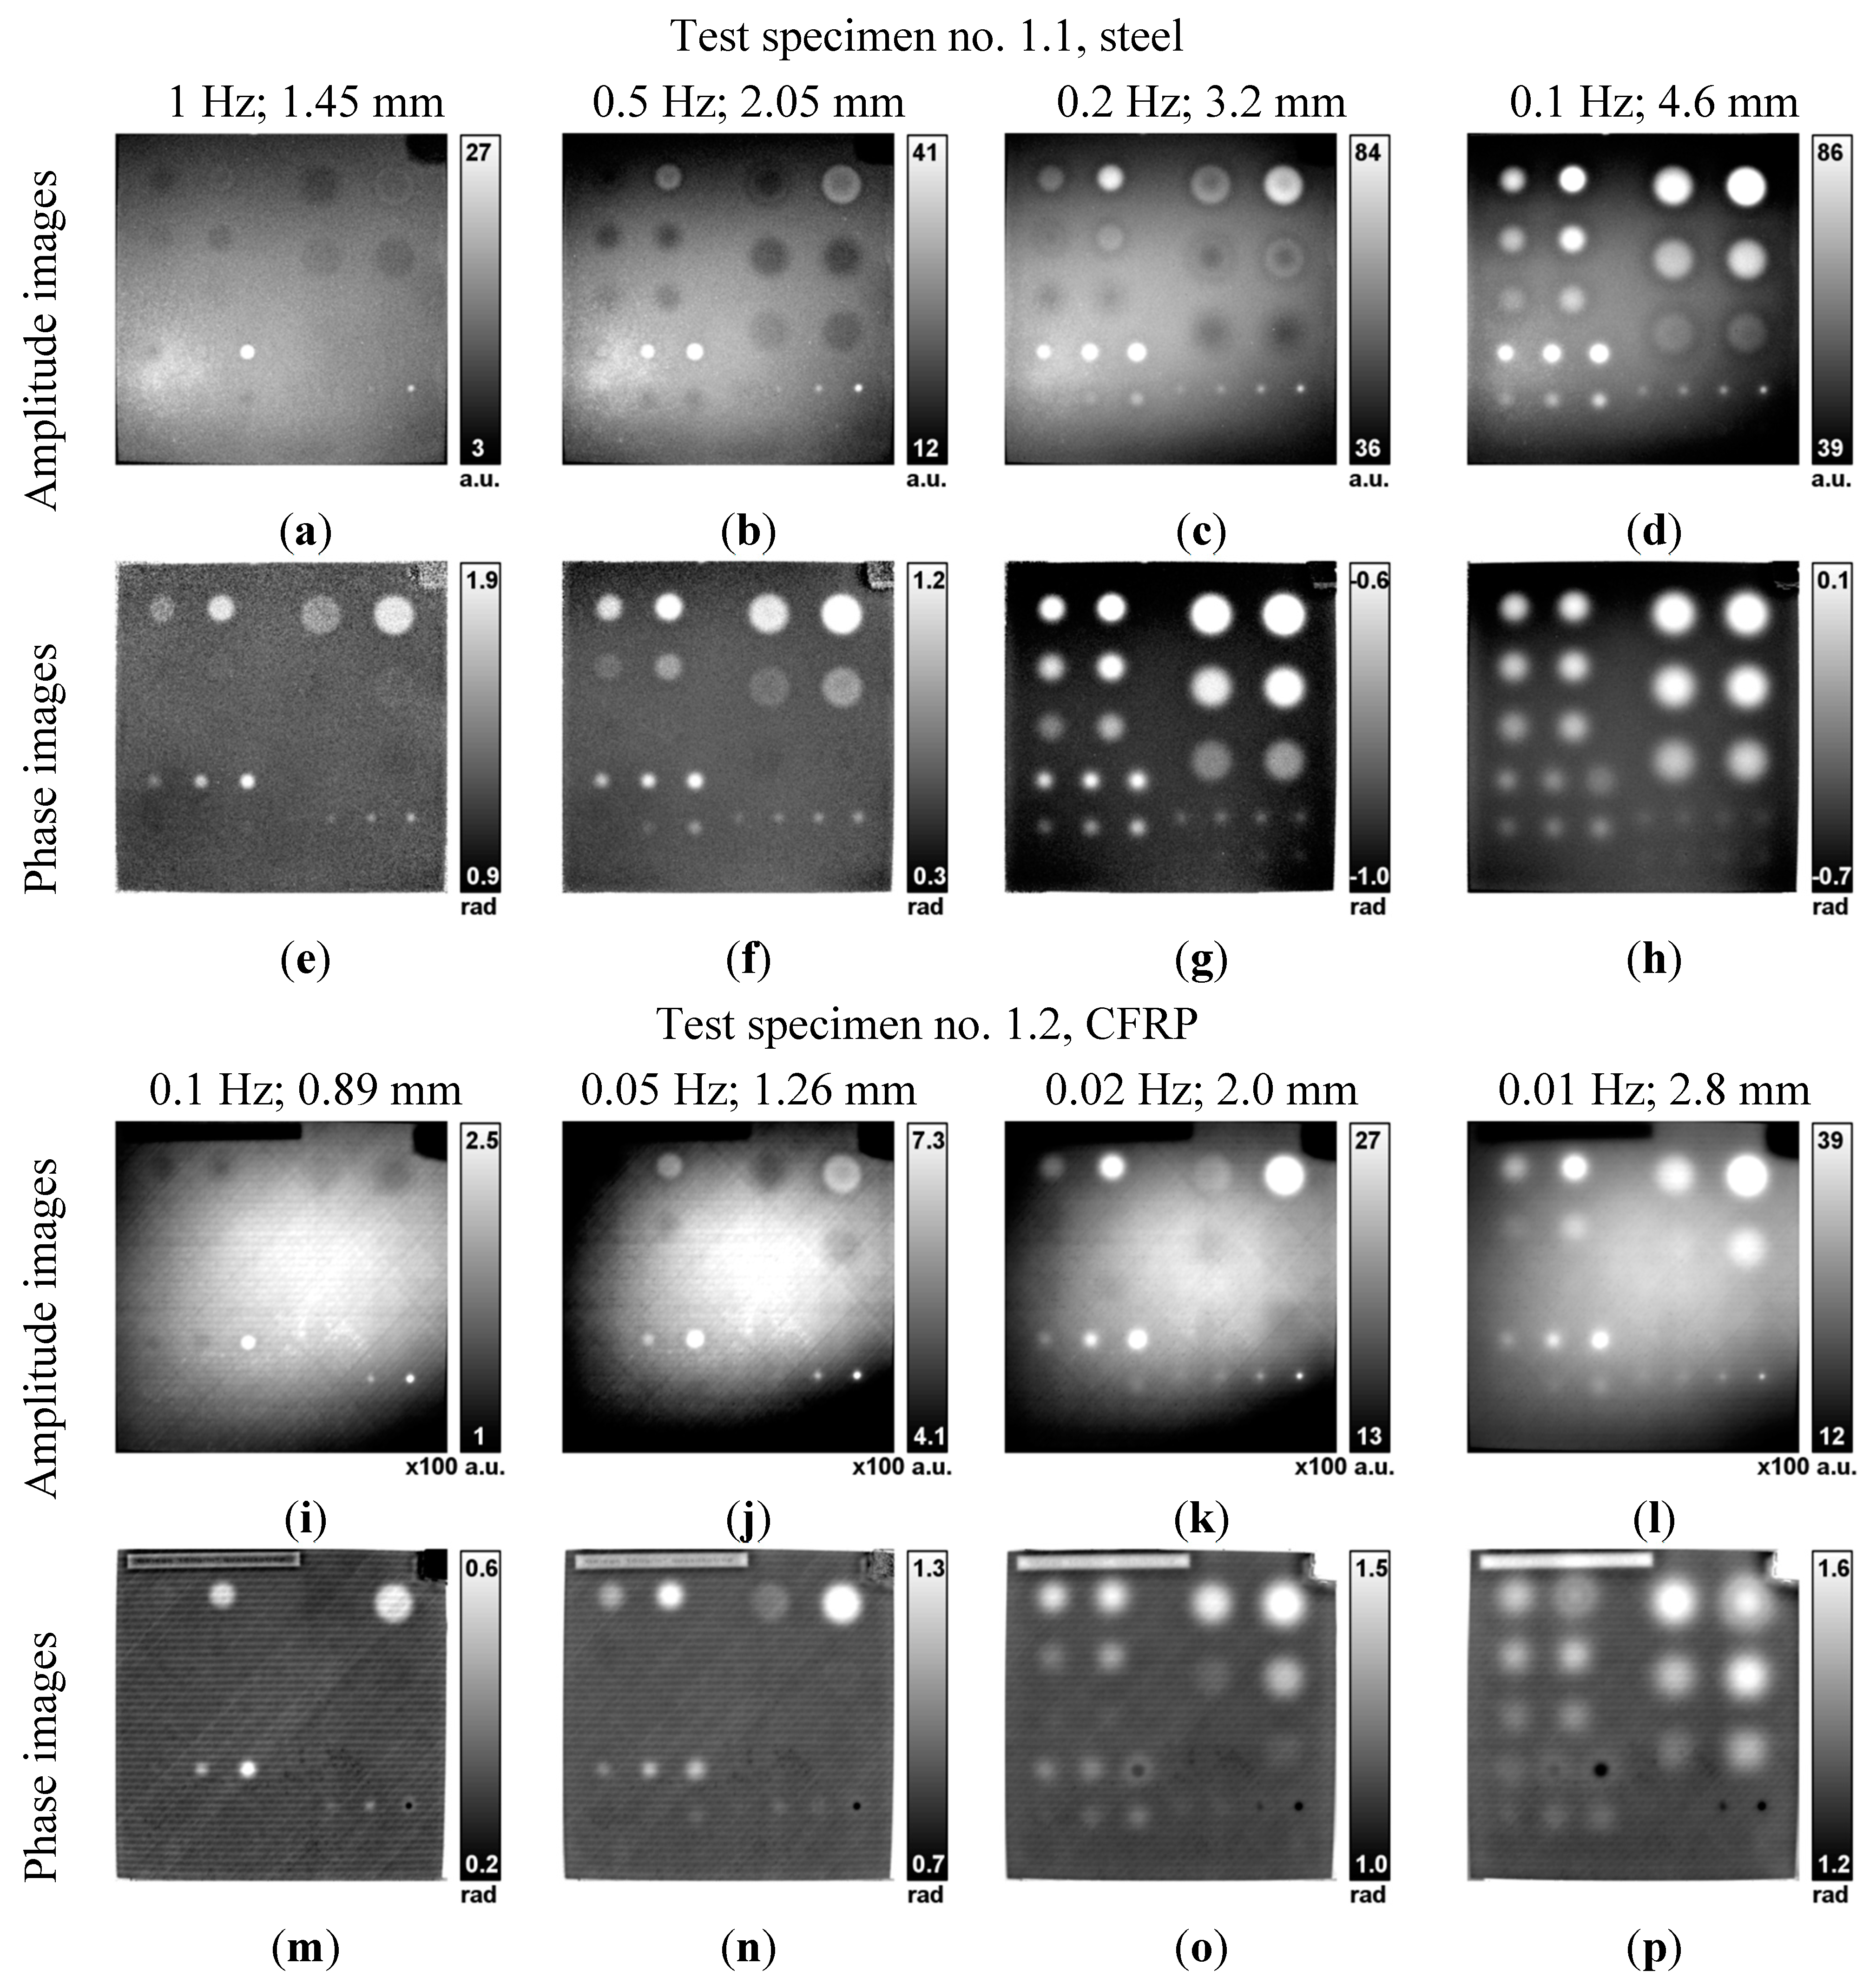
4.1.1. Comparison of Amplitude and Phase Images
- In all amplitude images, an inhomogeneous background due to inhomogeneous heating can be observed.
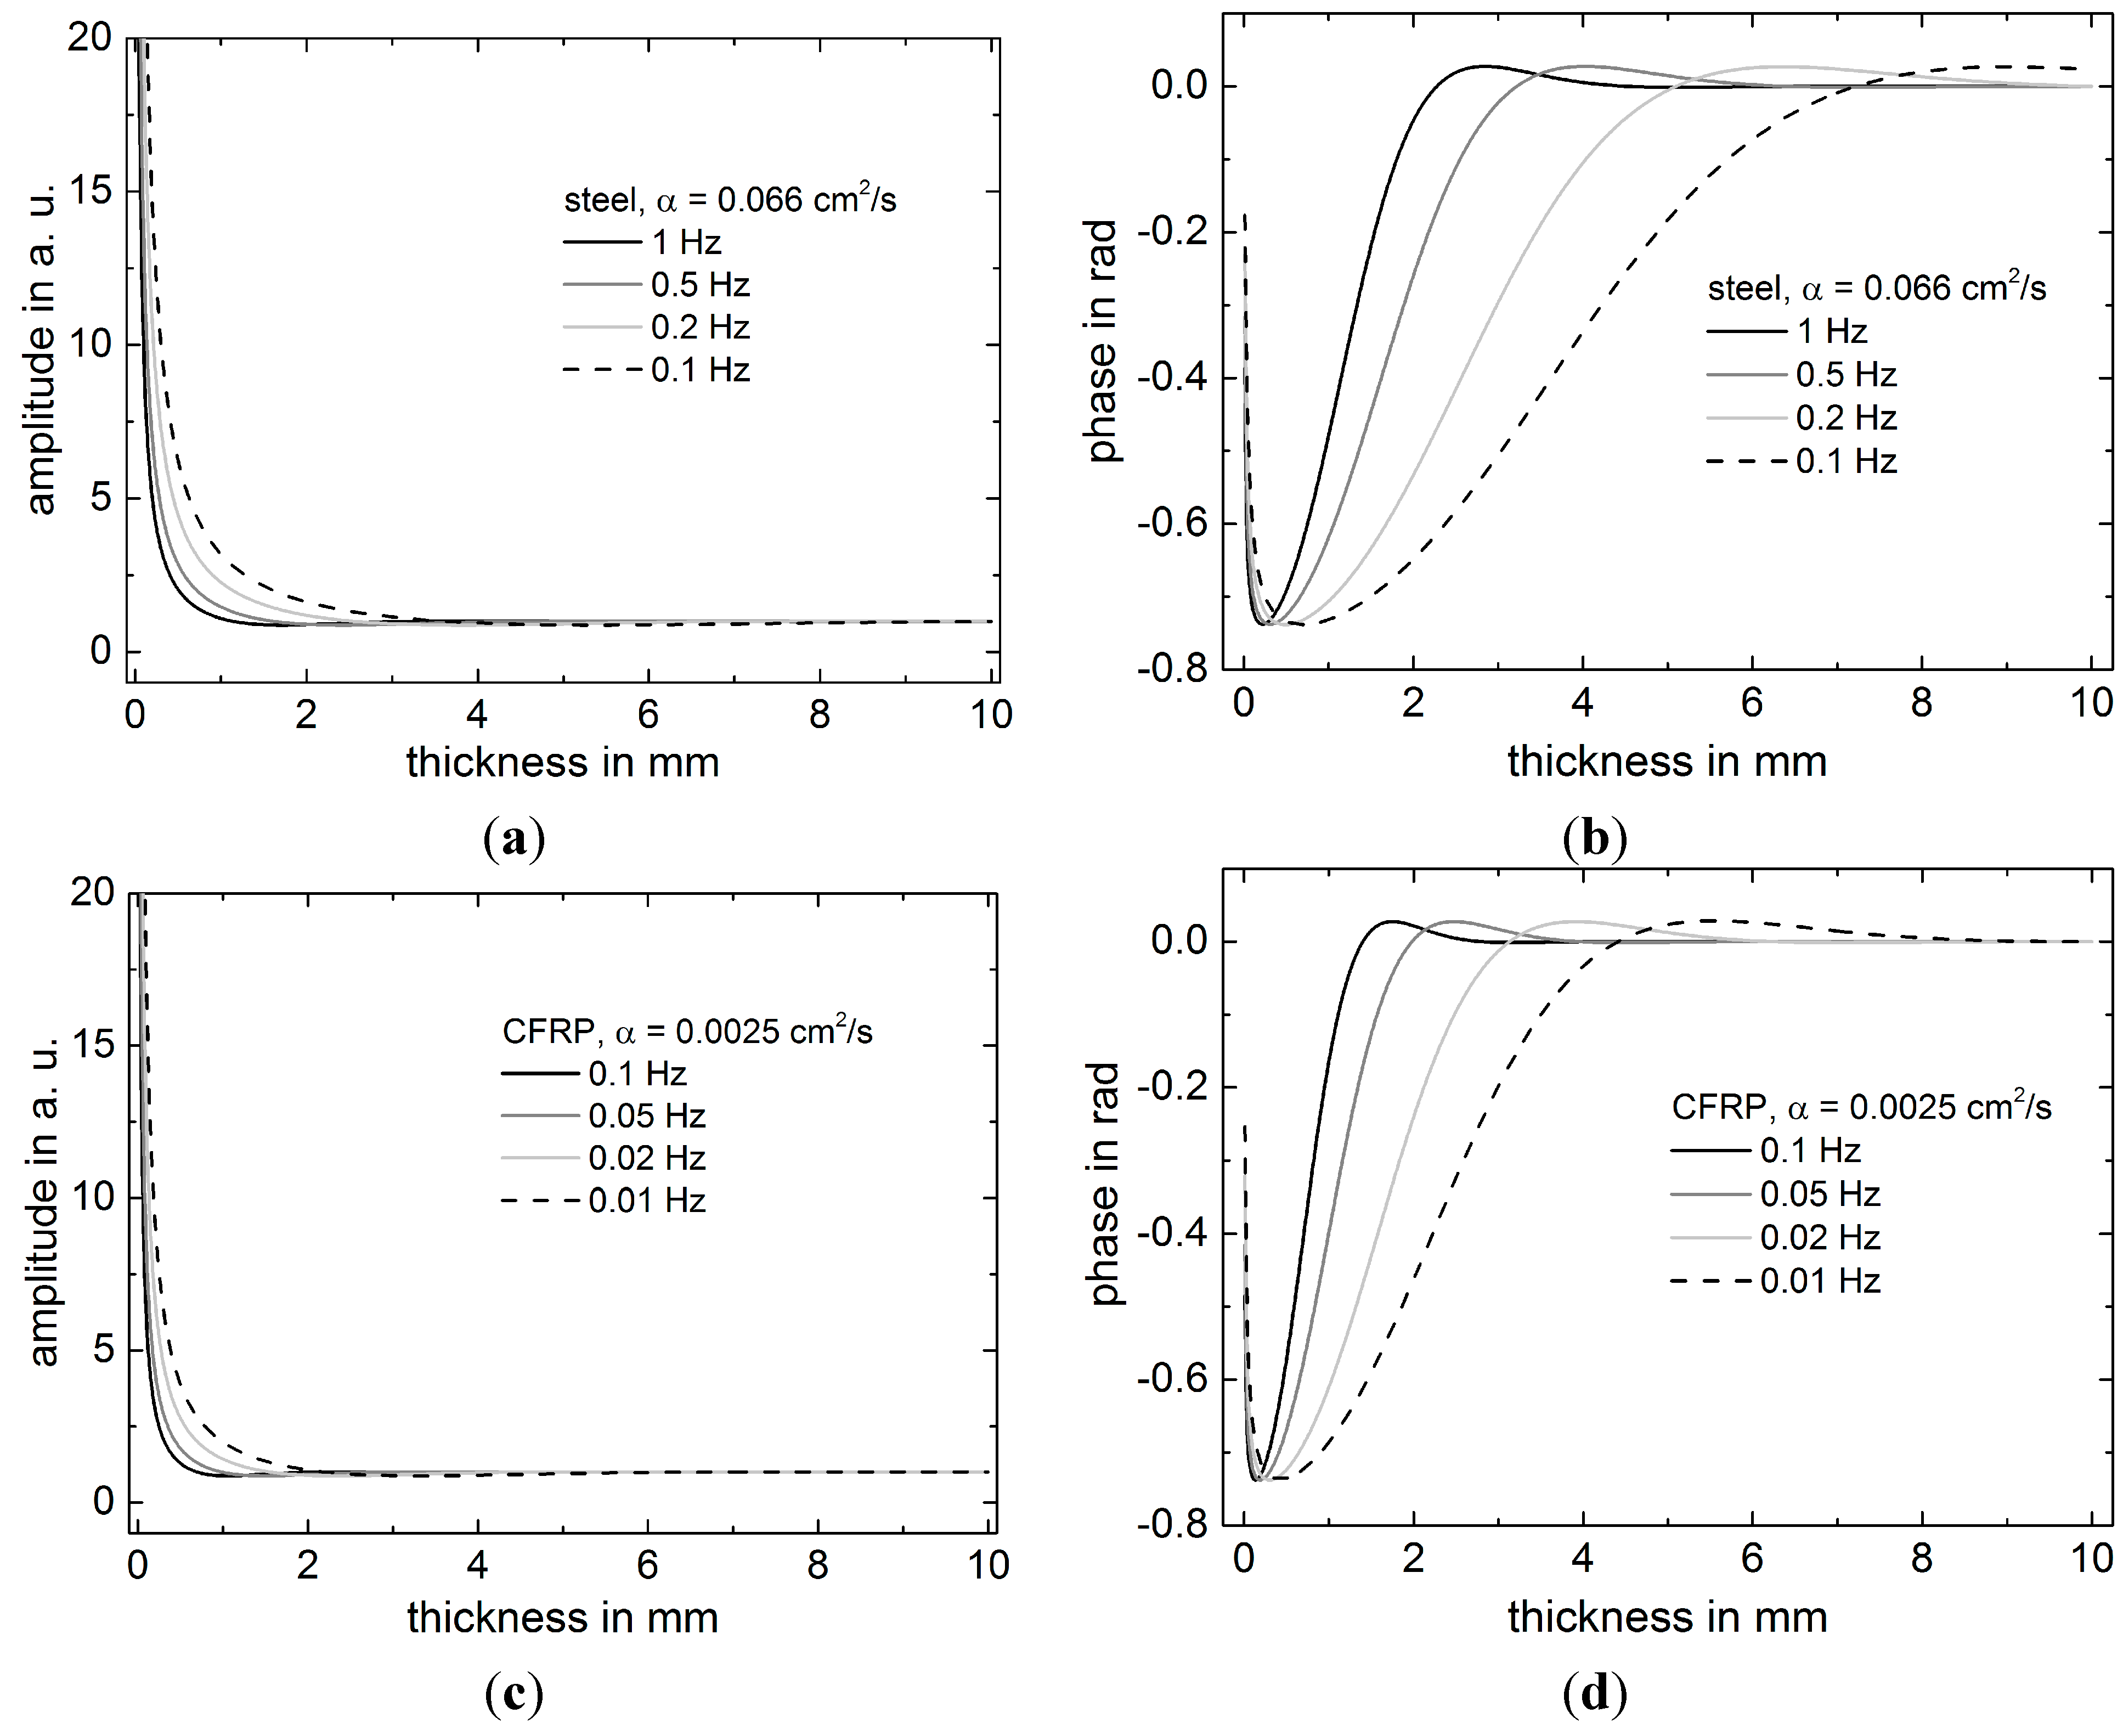
- For higher frequencies, the deeper holes appear with smaller (darker) amplitude values than the background. With decreasing frequency, the contrast switches and the holes appear with larger (brighter) values than the background. This can be explained by the minima in the amplitude values shown in Figure 1a,c.
- Comparing images of CFRP and steel, especially the smaller holes appear more blurred in the amplitude images of CFRP.
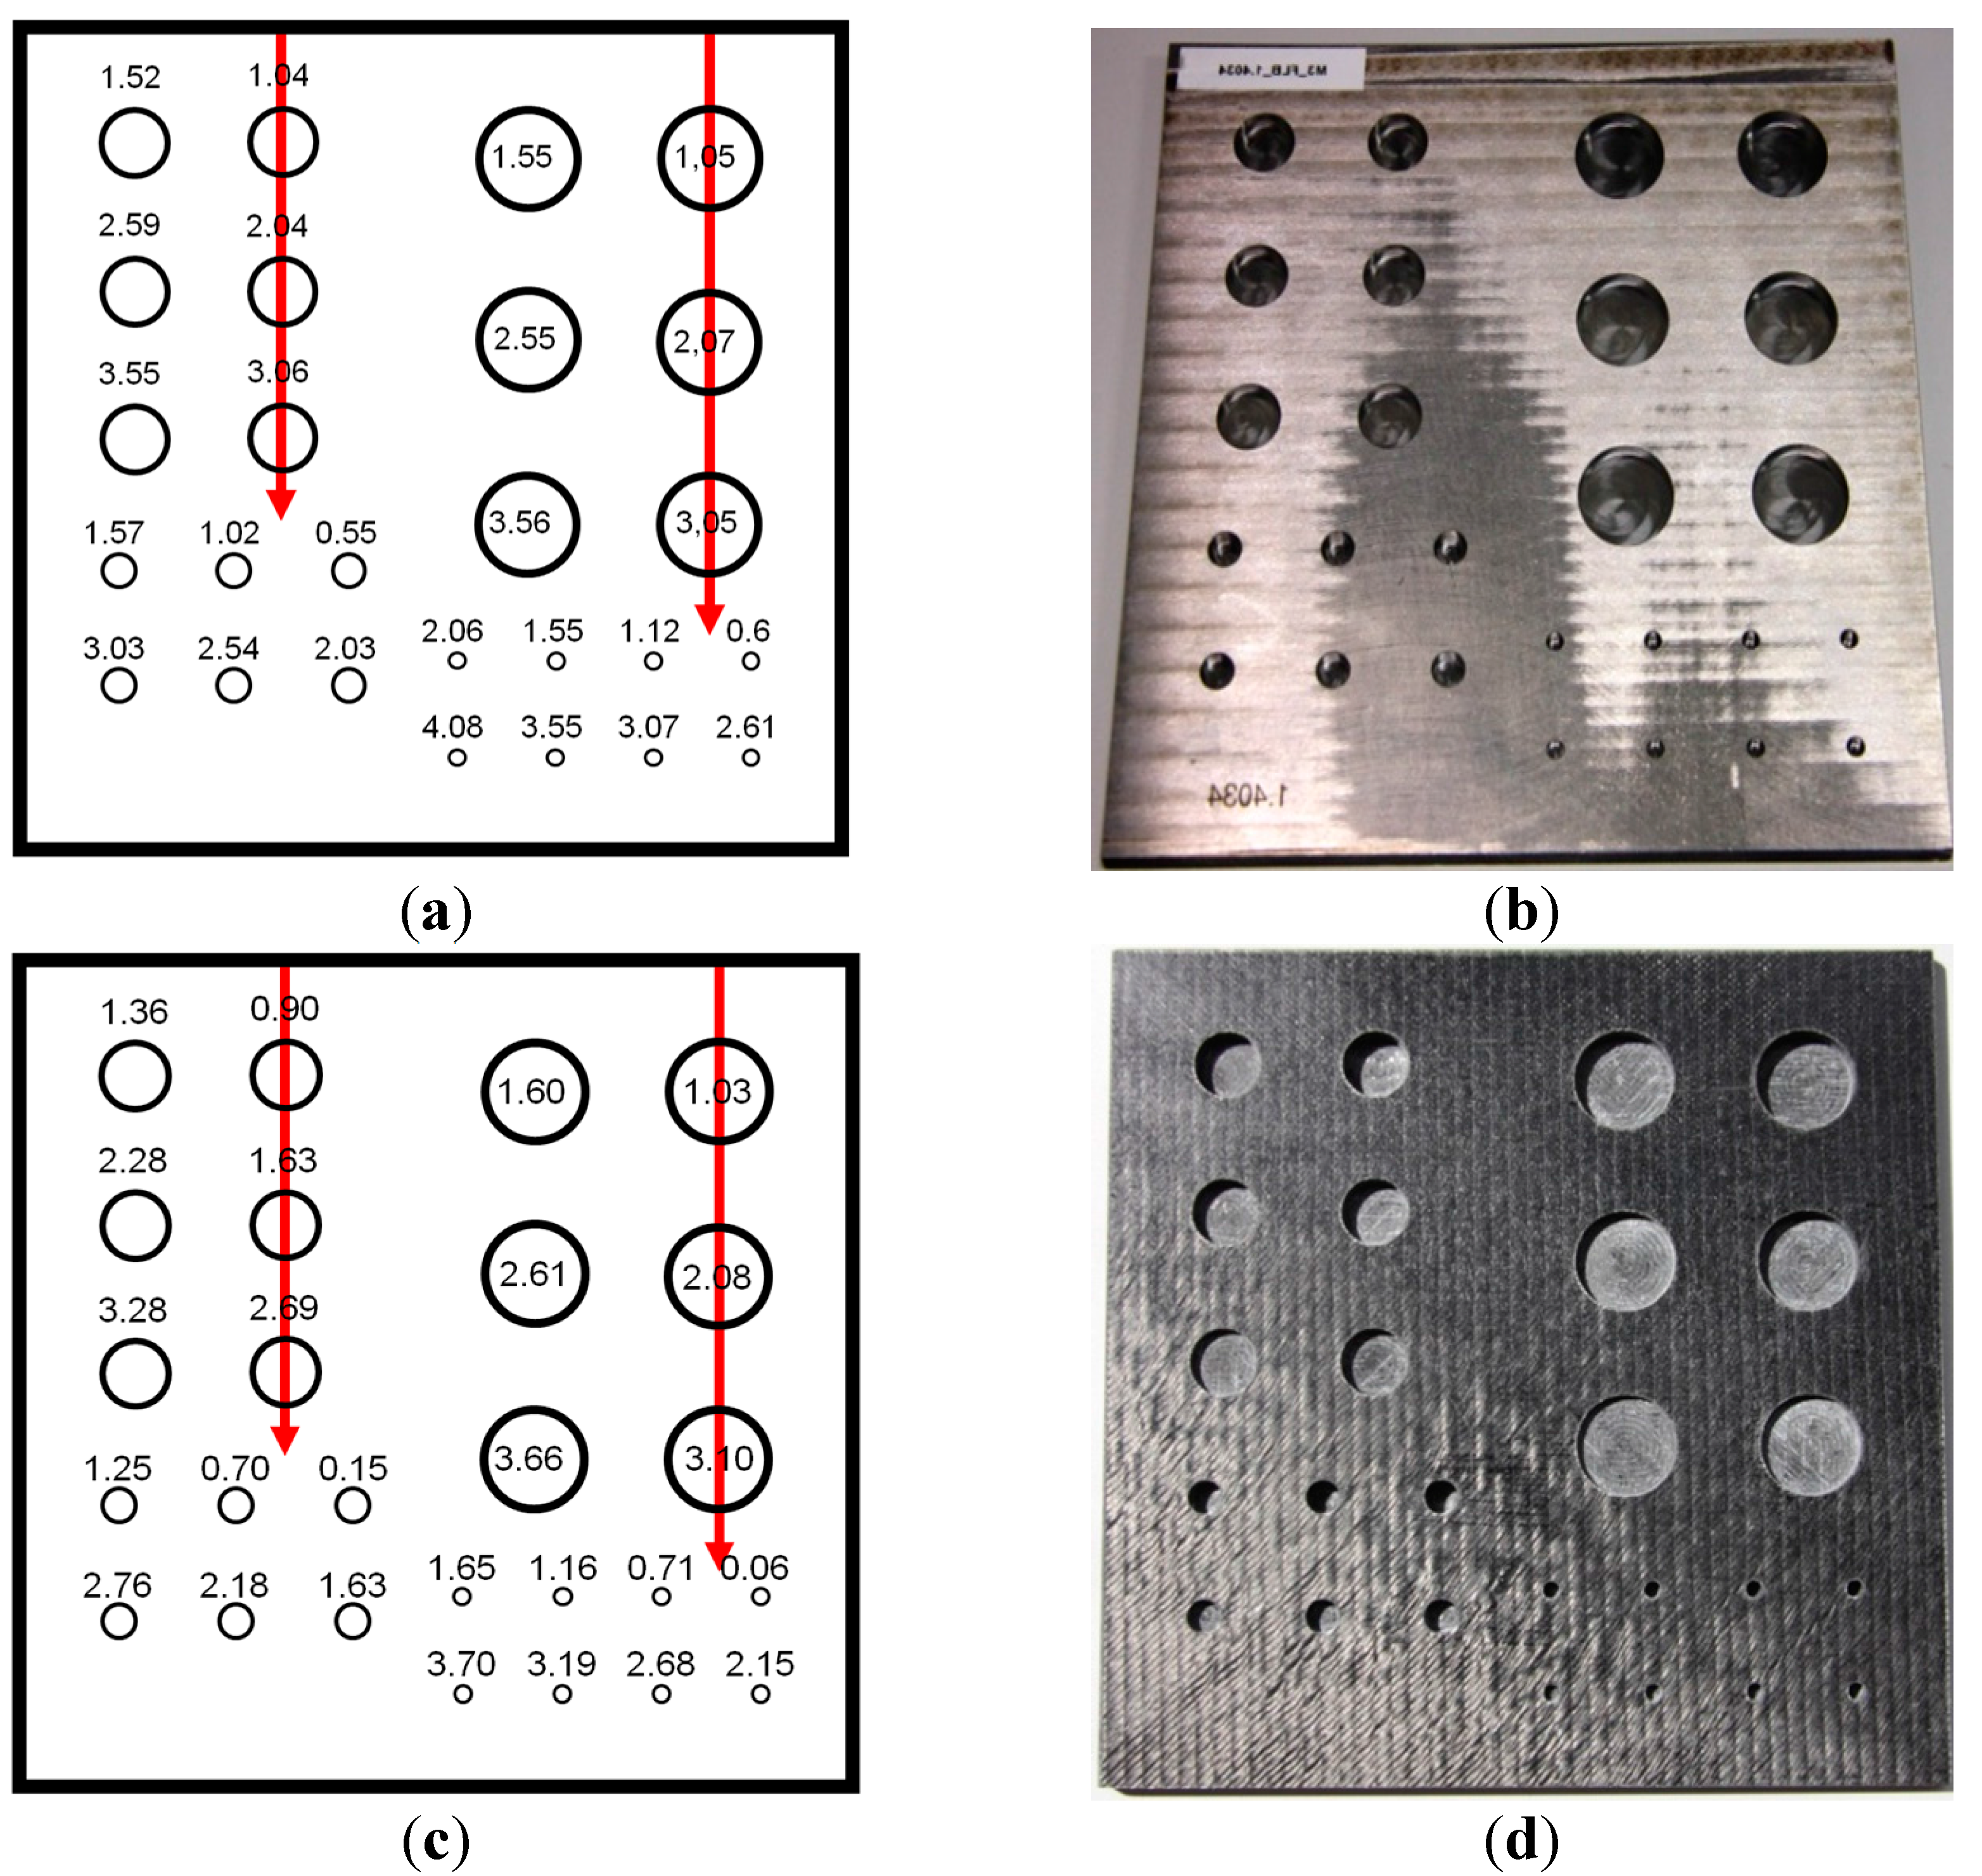
- In steel, all larger holes with diameters of 24, 16, and 8 mm are detected. For the holes with a diameter of 4 mm, only the upper row is detected, thus up to a RWT of 2.1 mm.
- In CFRP, less holes are detected: Only five of the 24 mm (up to a RWT of 3.1 mm), four of the 16 mm (up to a RWT of 2.3 mm), five of the 8 mm (up to a RWT of 2.2 mm) and again only the upper row of the 4 mm holes (up to a RWT of 1.65 mm) are detected.
- In all phase images, the background appears homogenous.
- While the FBHs appear relatively sharp in the steel specimen, they are more blurred in the CFRP specimen.
- In the steel specimen, almost all FBHs can be detected; only the 4 mm hole with the thickest RWT cannot be seen in the phase image at 0.2 Hz.
- In the CFRP specimen, only four of the 4 mm holes are detected.
- In the CFRP specimen, two of the 8 mm holes (RWT of 0.15 and 0.7 mm) and two of the 4 mm holes (RWT of 0.06 and 0.71 mm) show a phase contrast inversion when going to lower frequencies, crossing the blind frequency.
- As expected, the phase images show a homogeneous background while the amplitude images show an inhomogeneous background, caused by the inhomogeneous heating and cooling at the edges and corners.
- In the phase images, deeper holes are detected than in the amplitude images.
- For the same frequency and the same hole in CFRP, the signatures appear in most cases more blurred in the phase images than in the amplitude images.
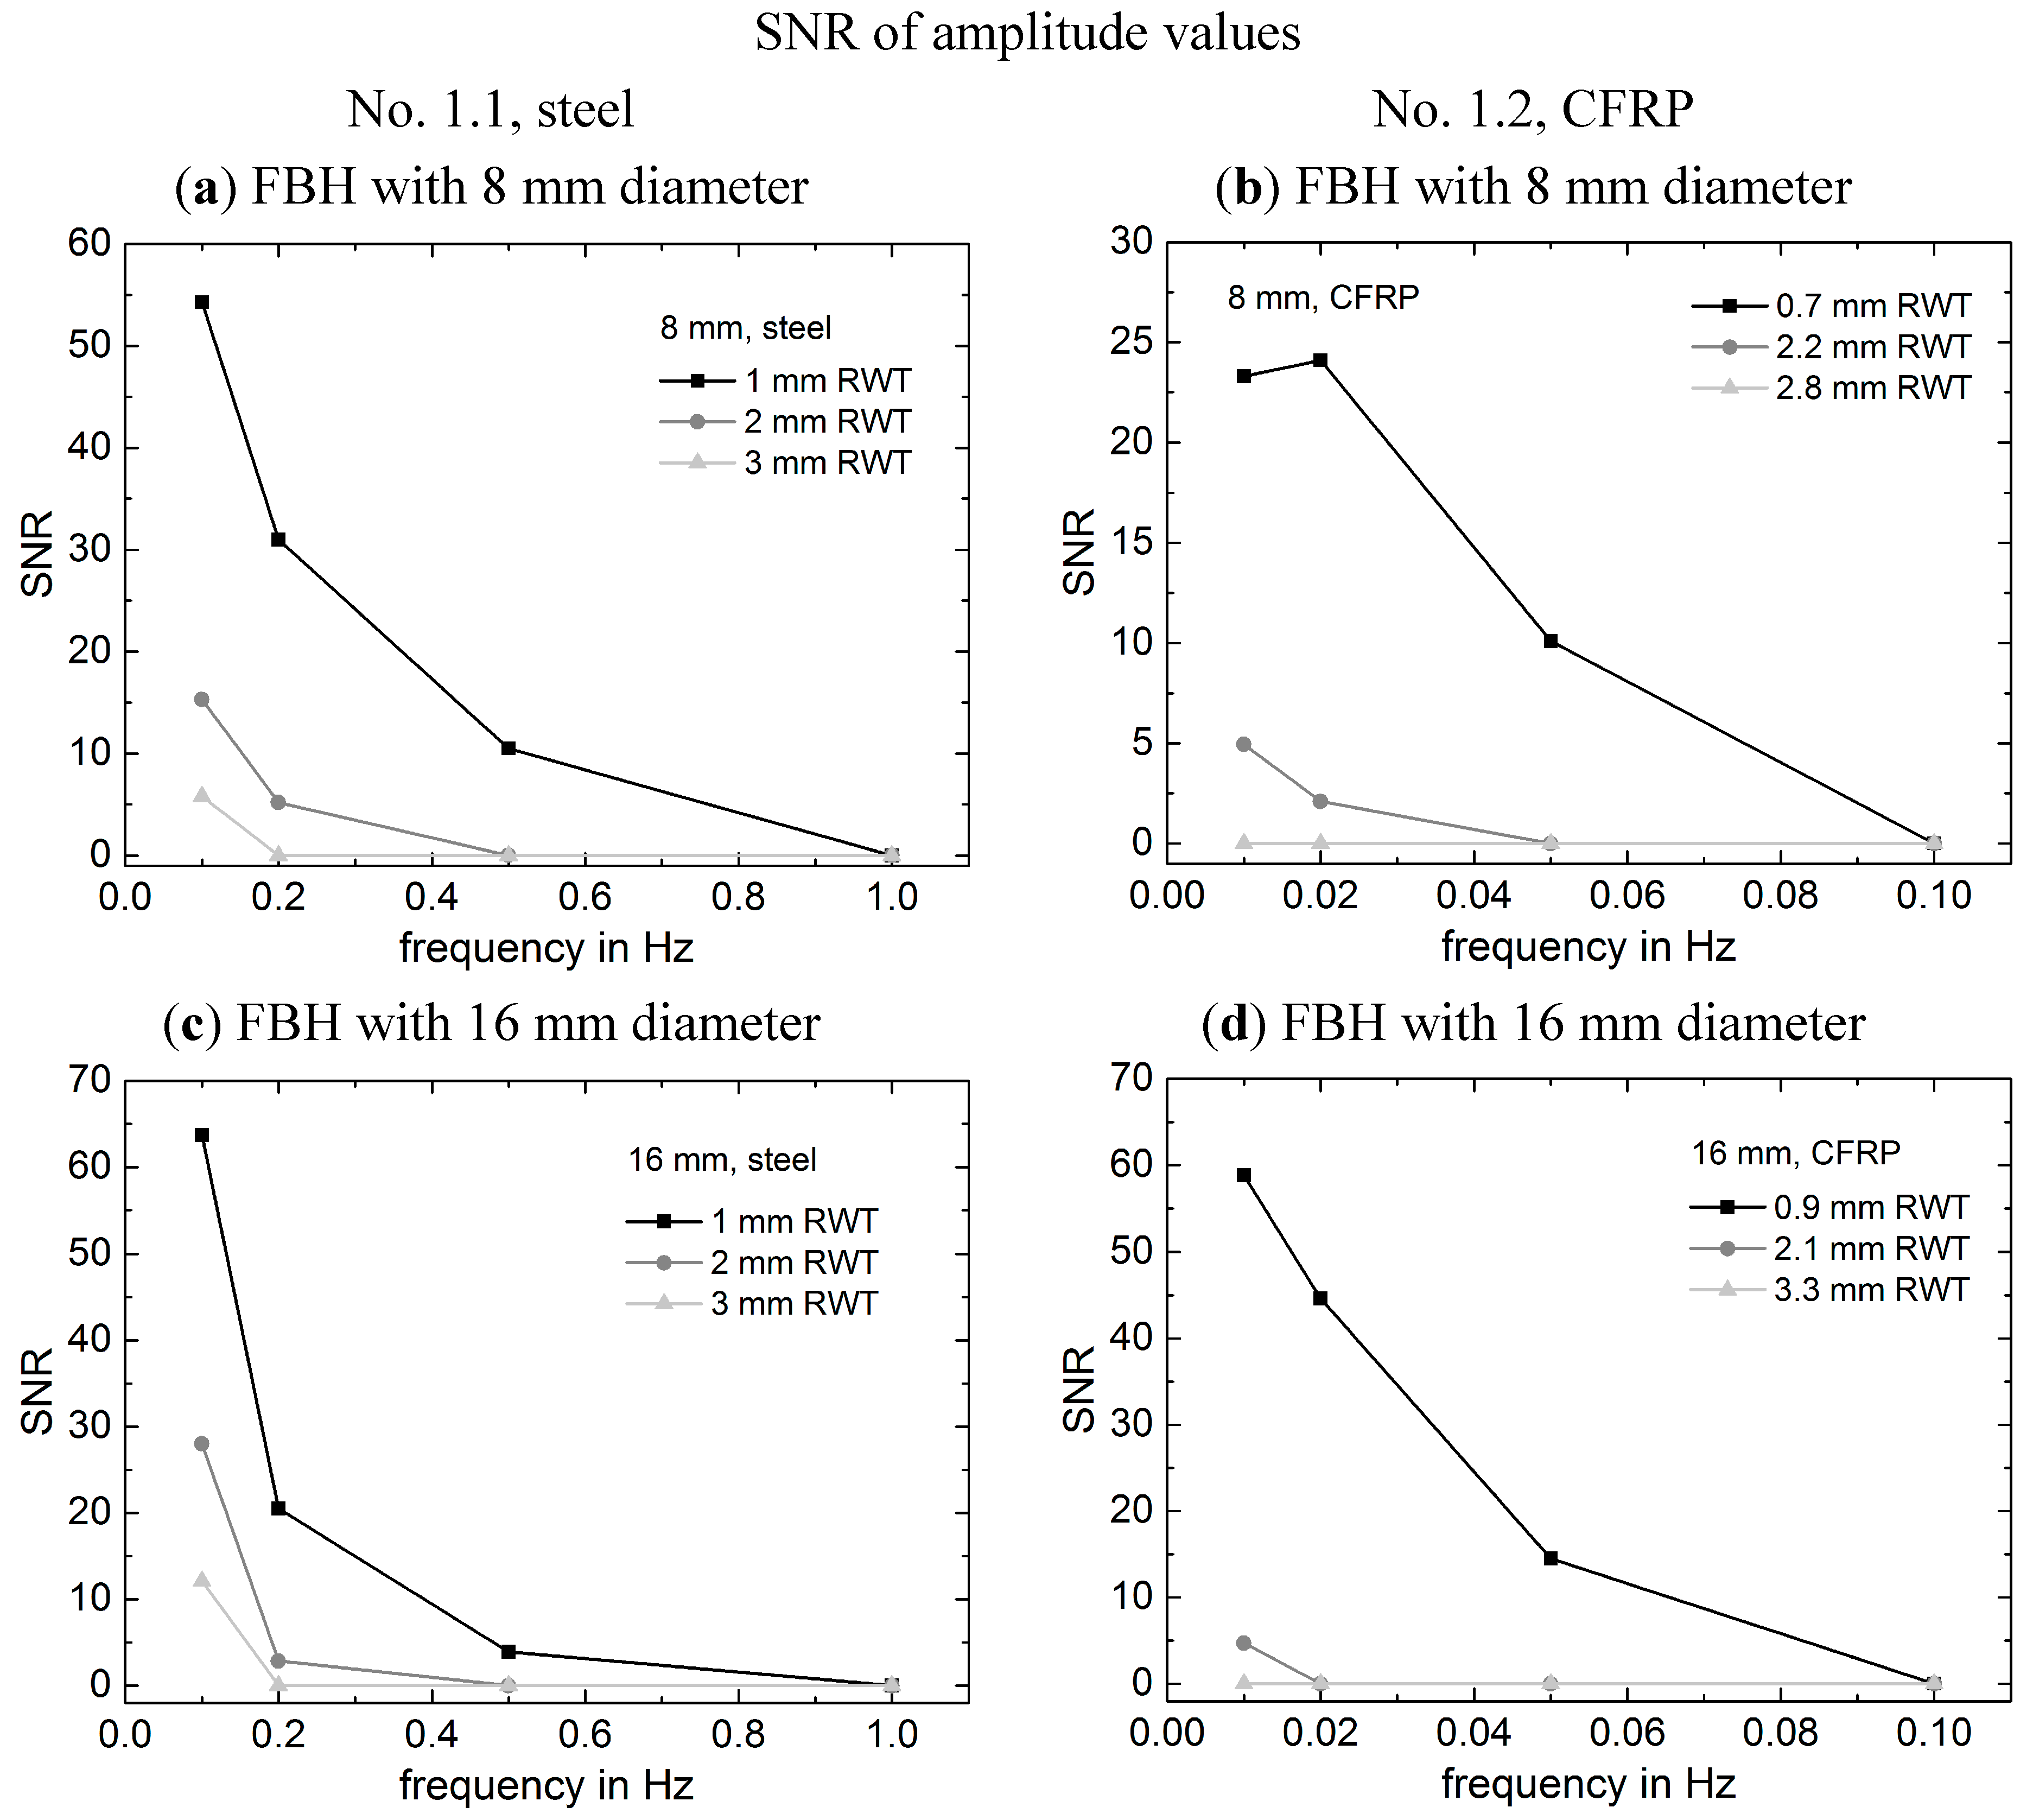
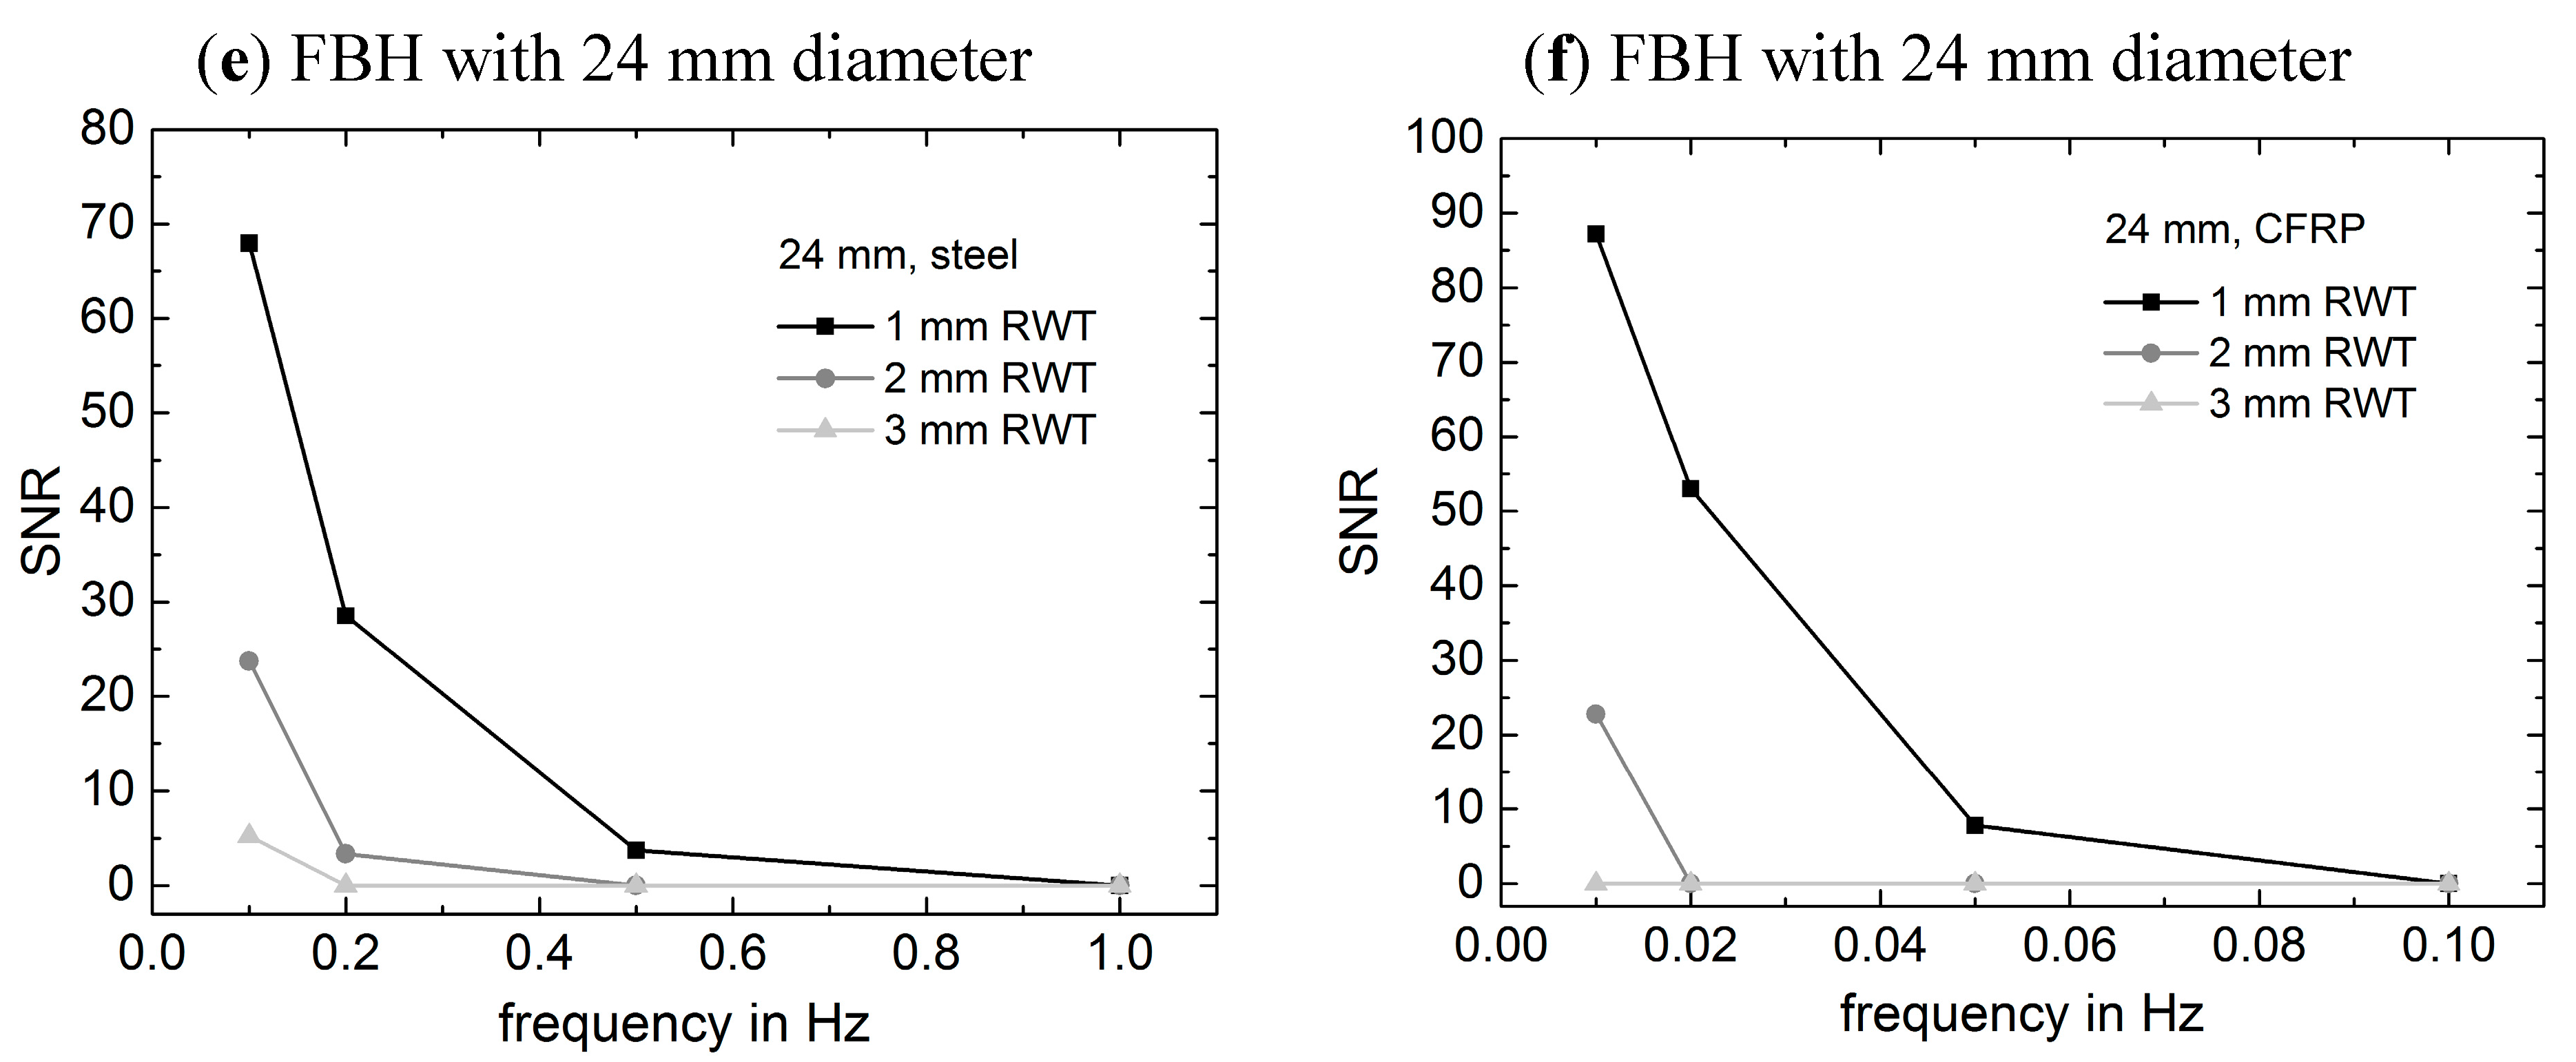
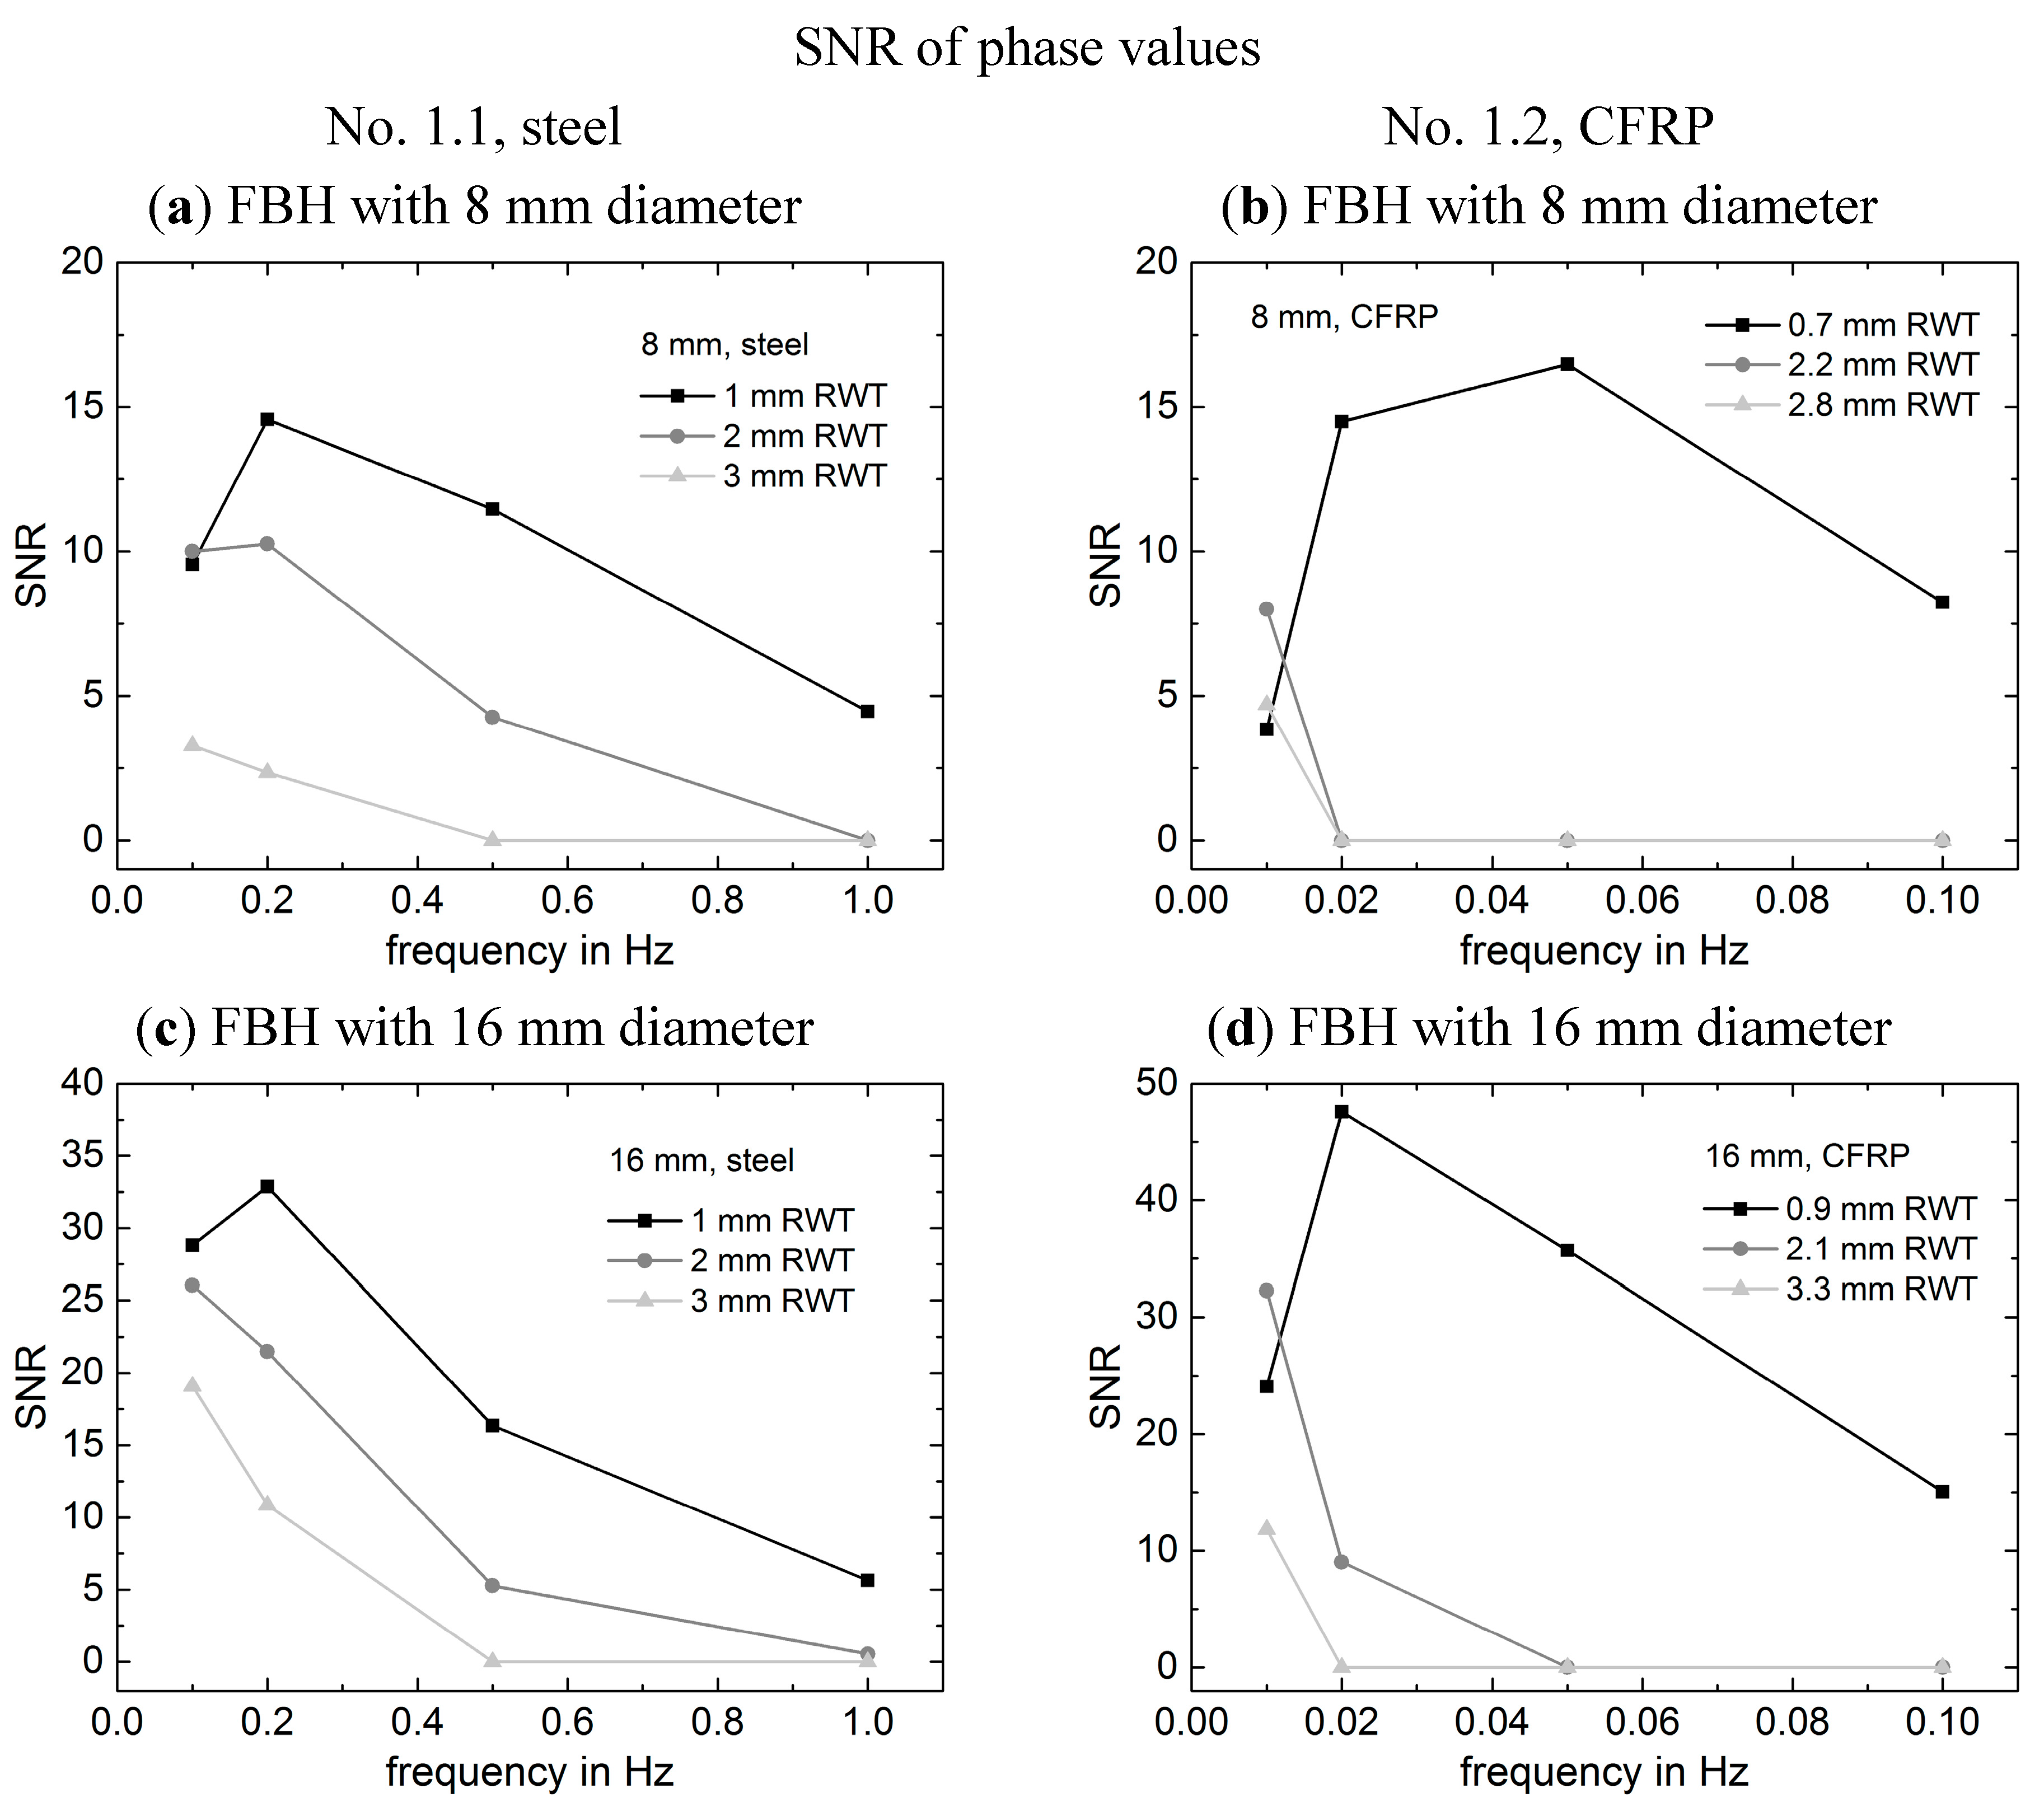
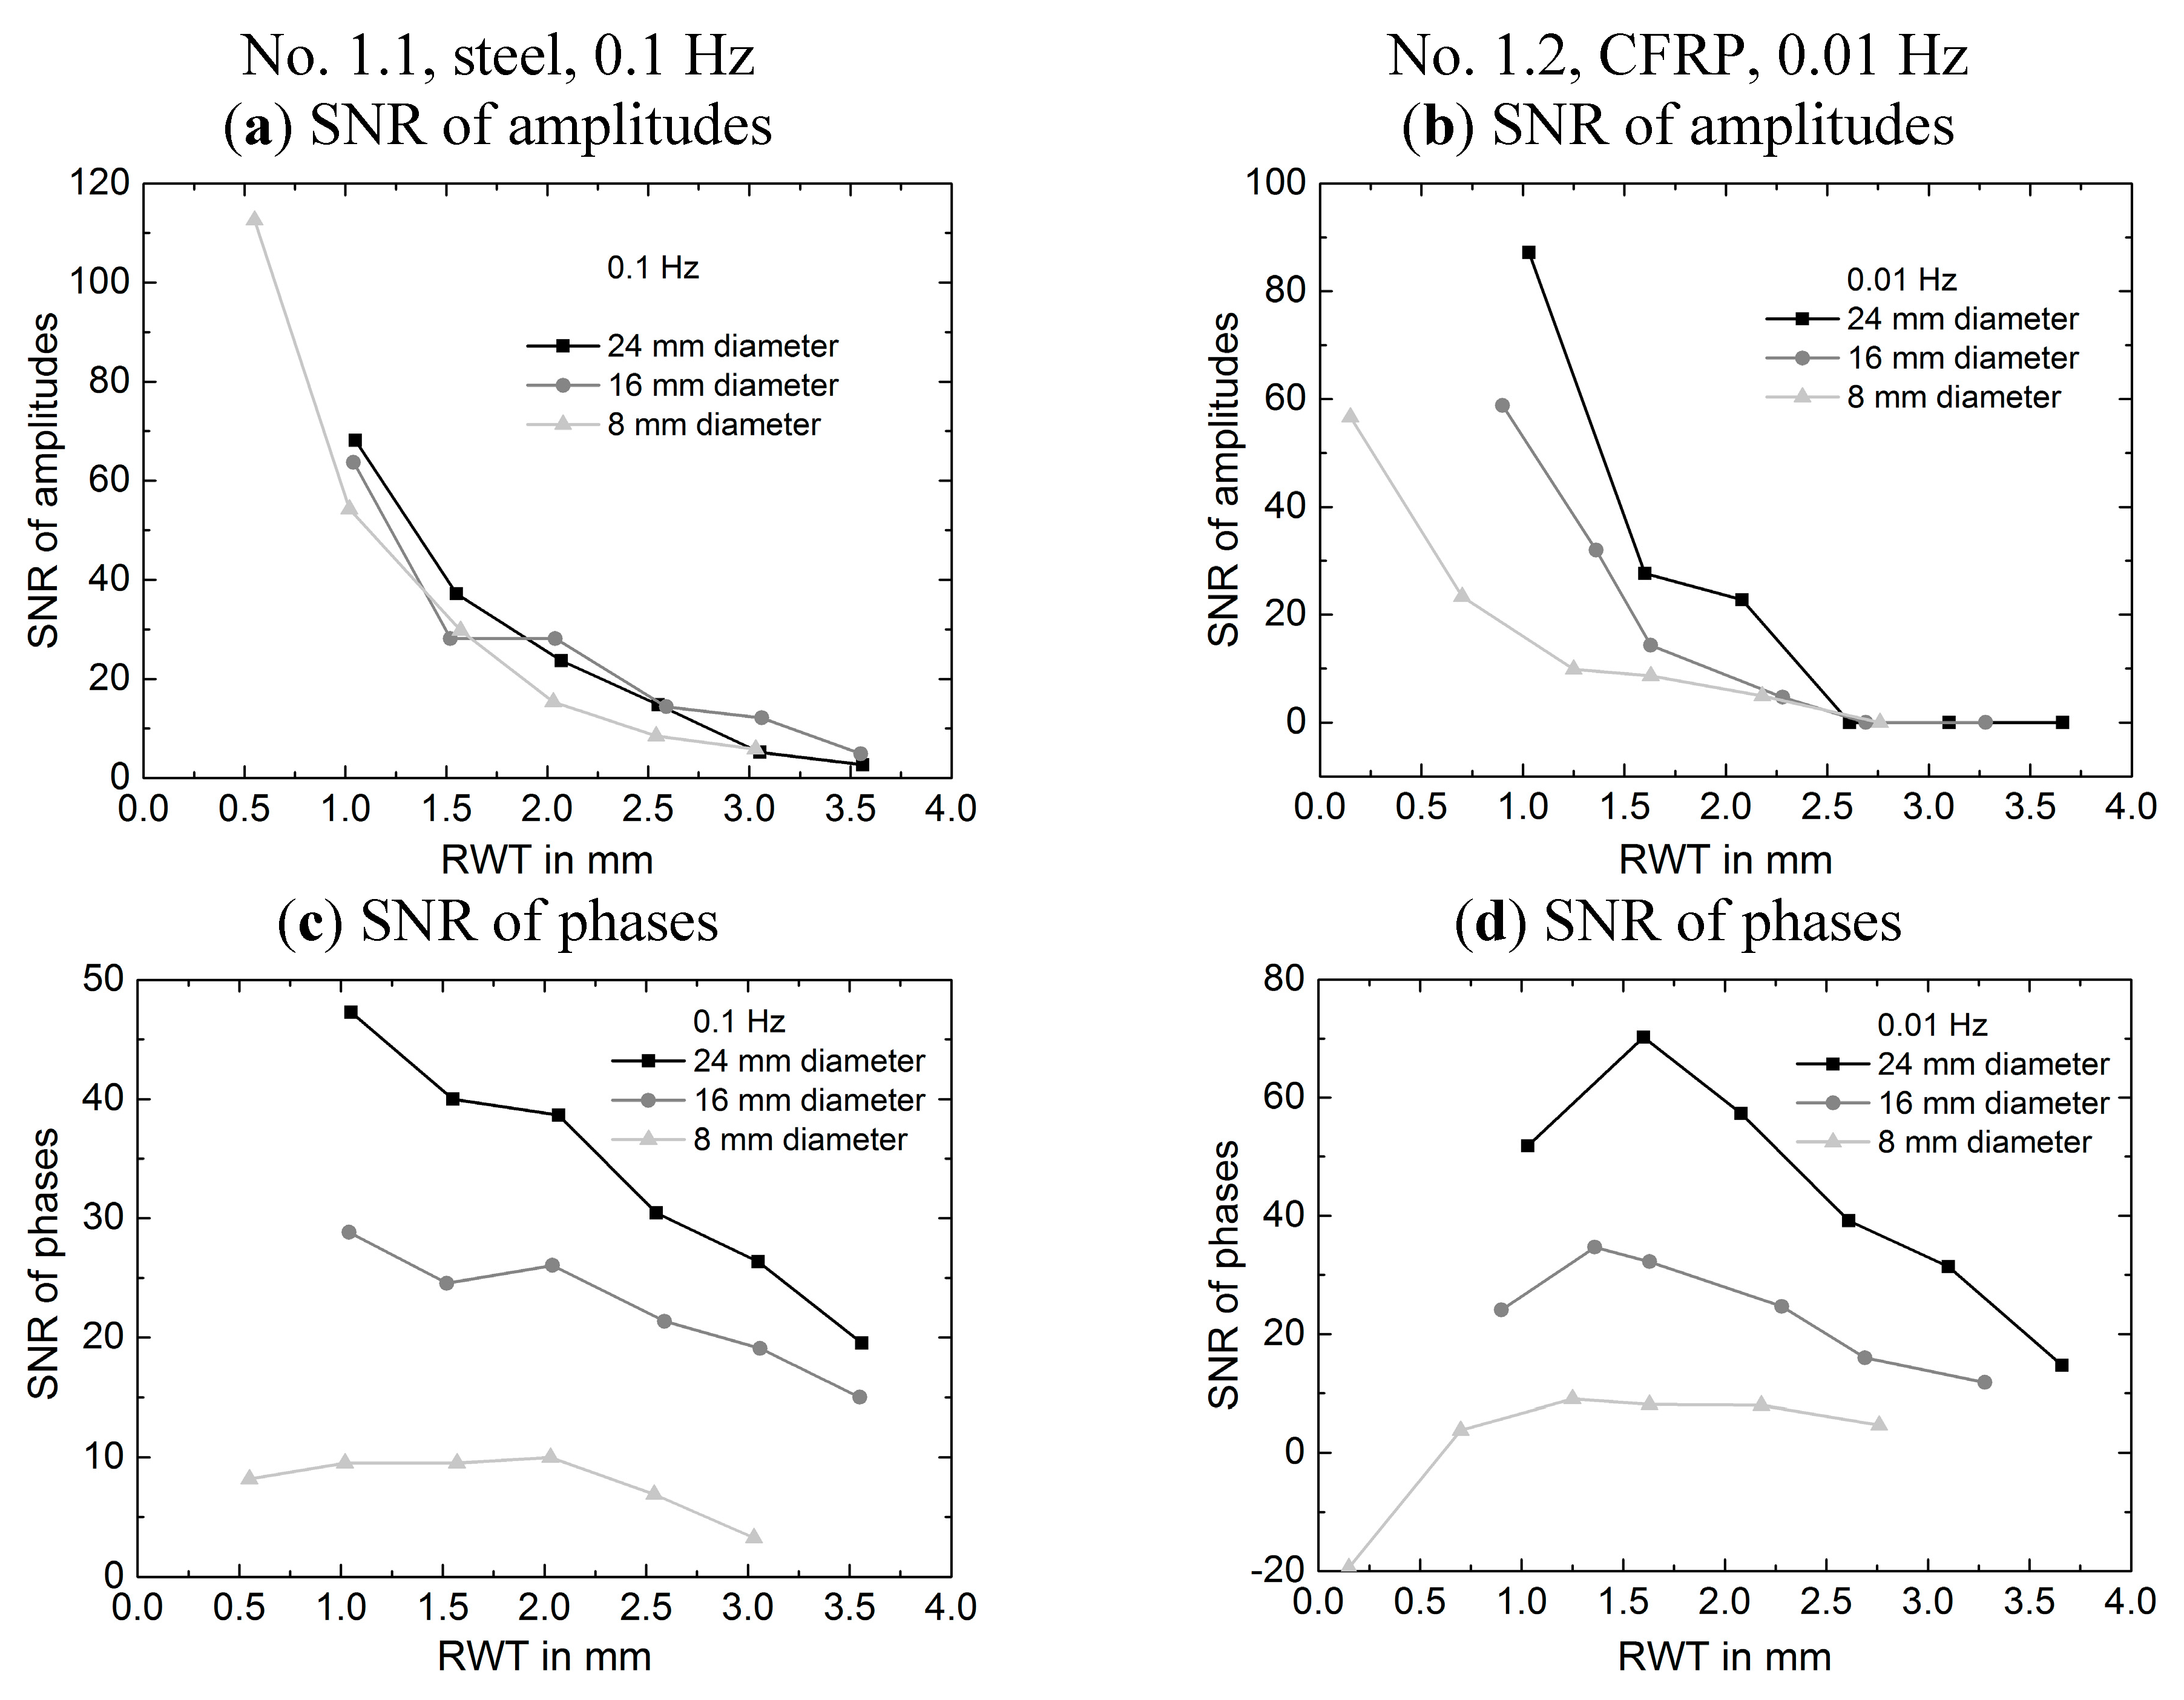
4.1.2. Analysis of Signal-to-Noise Ratio


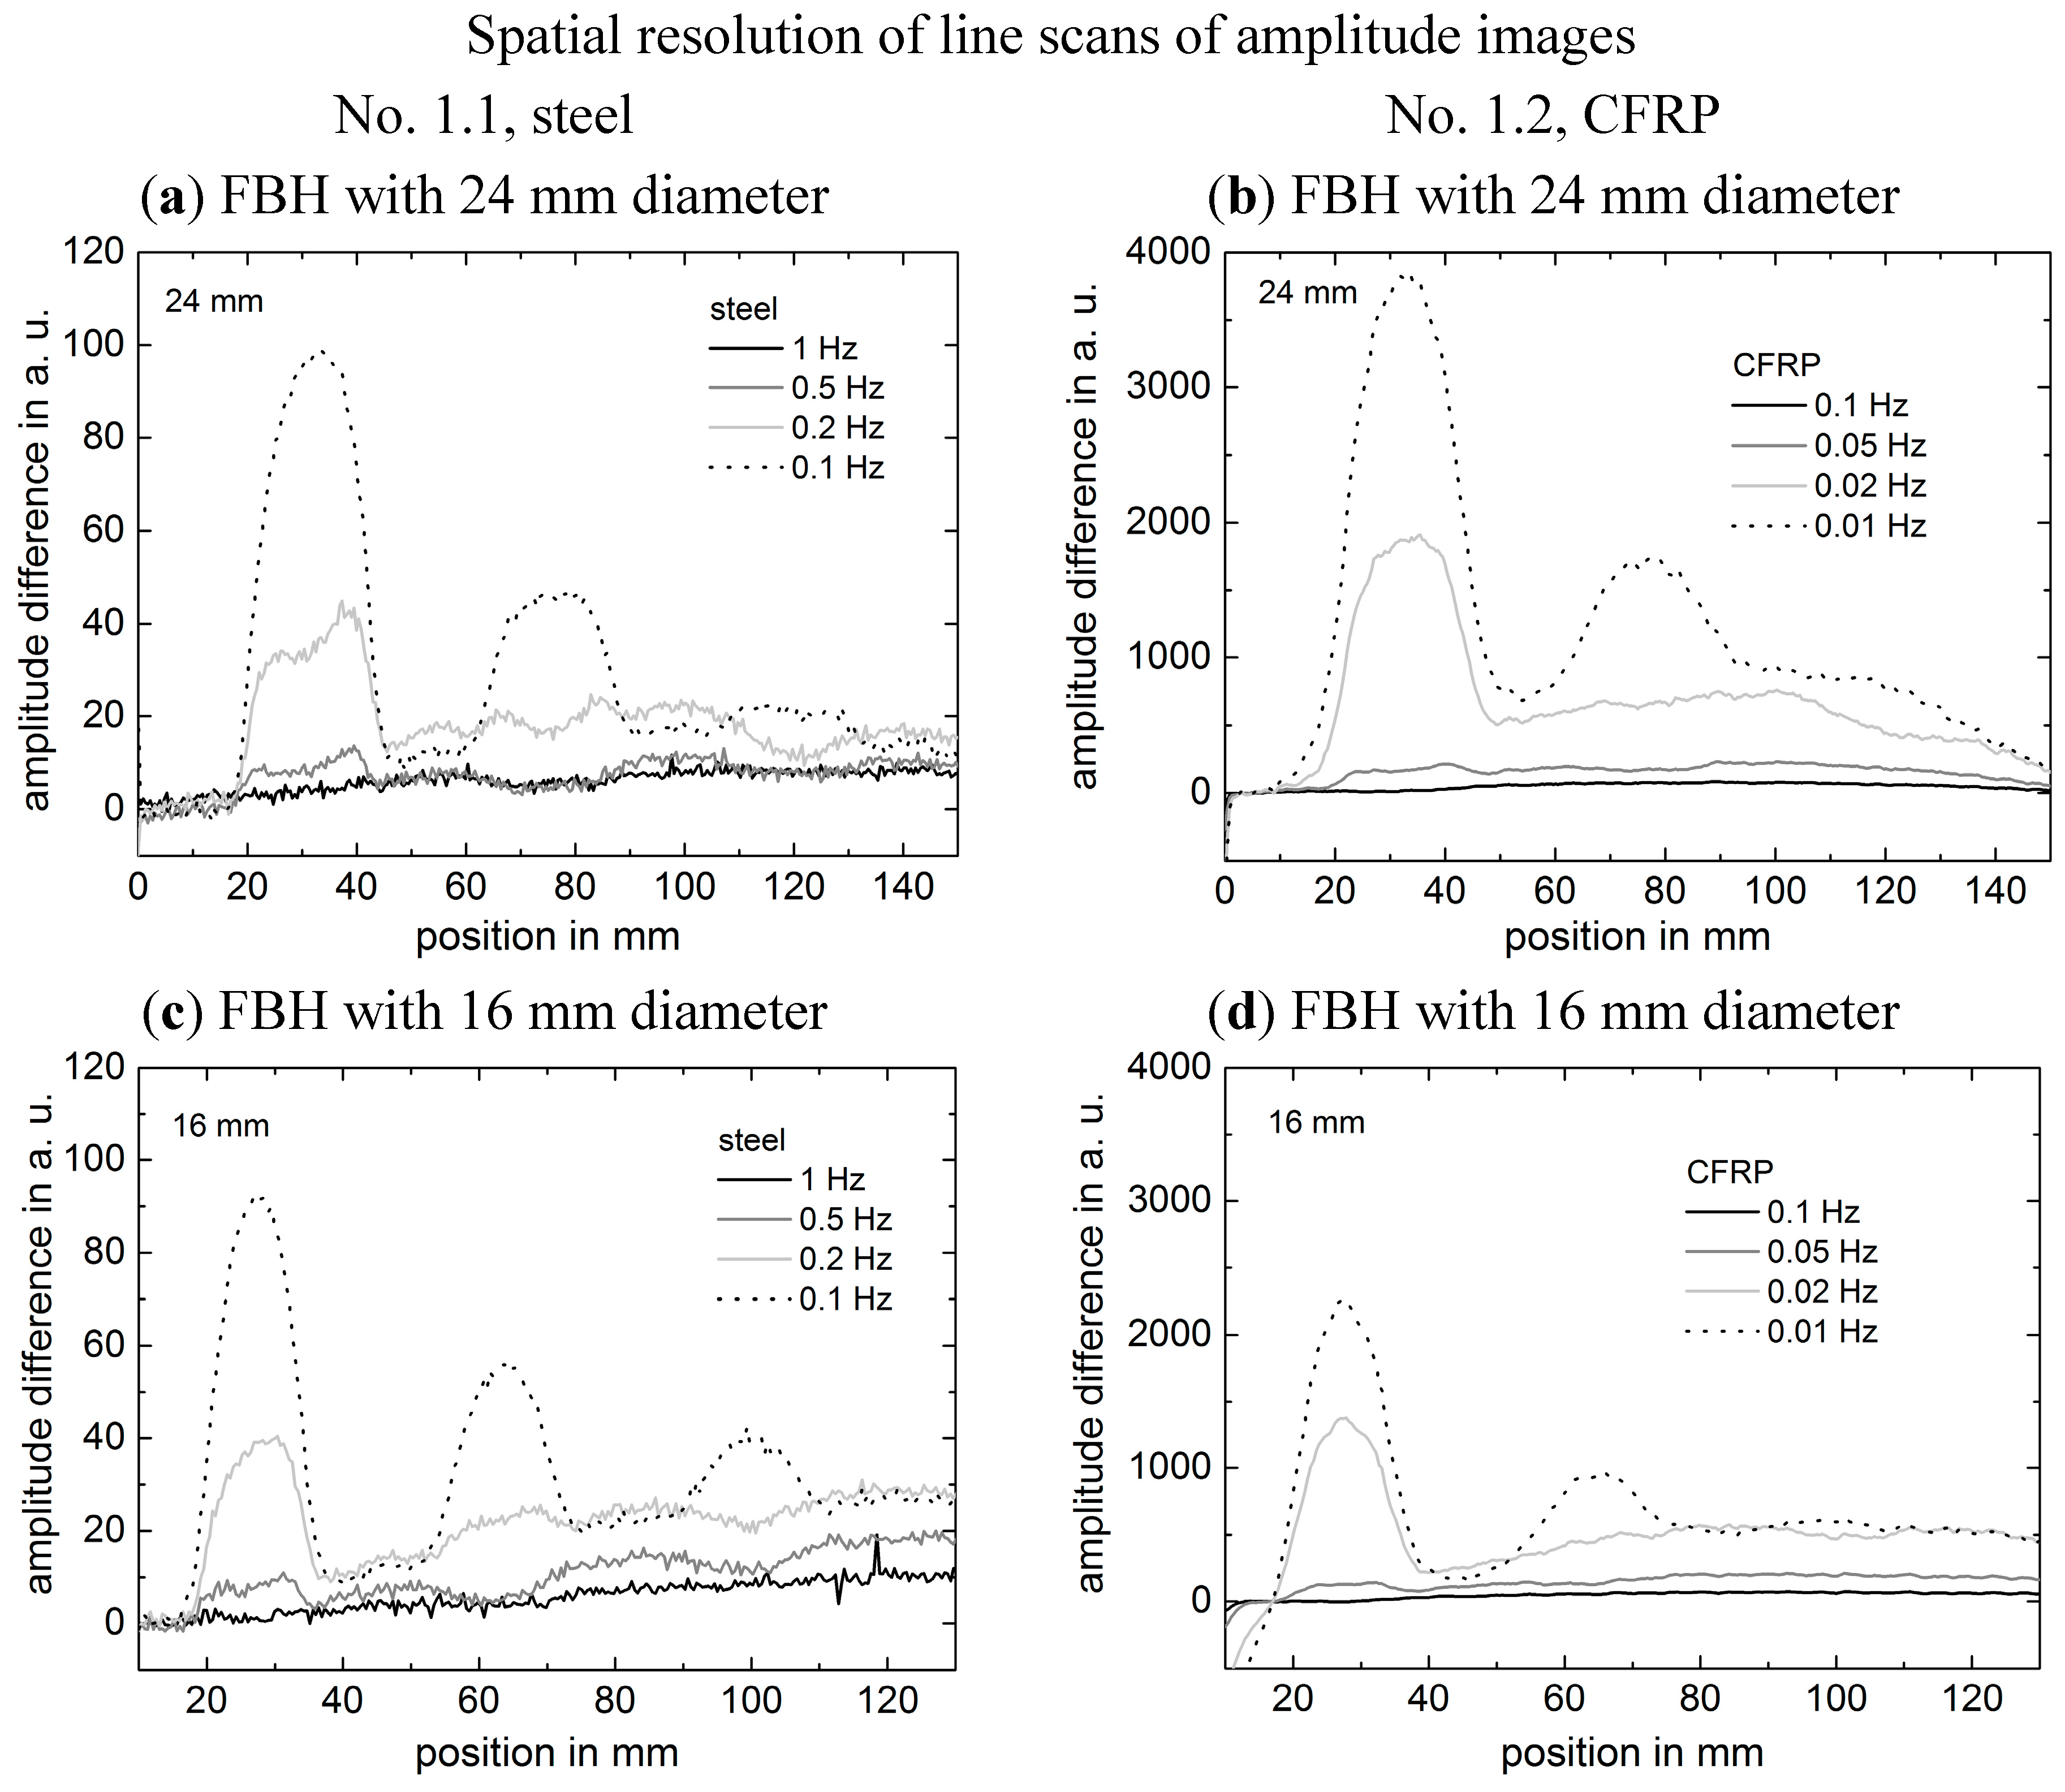
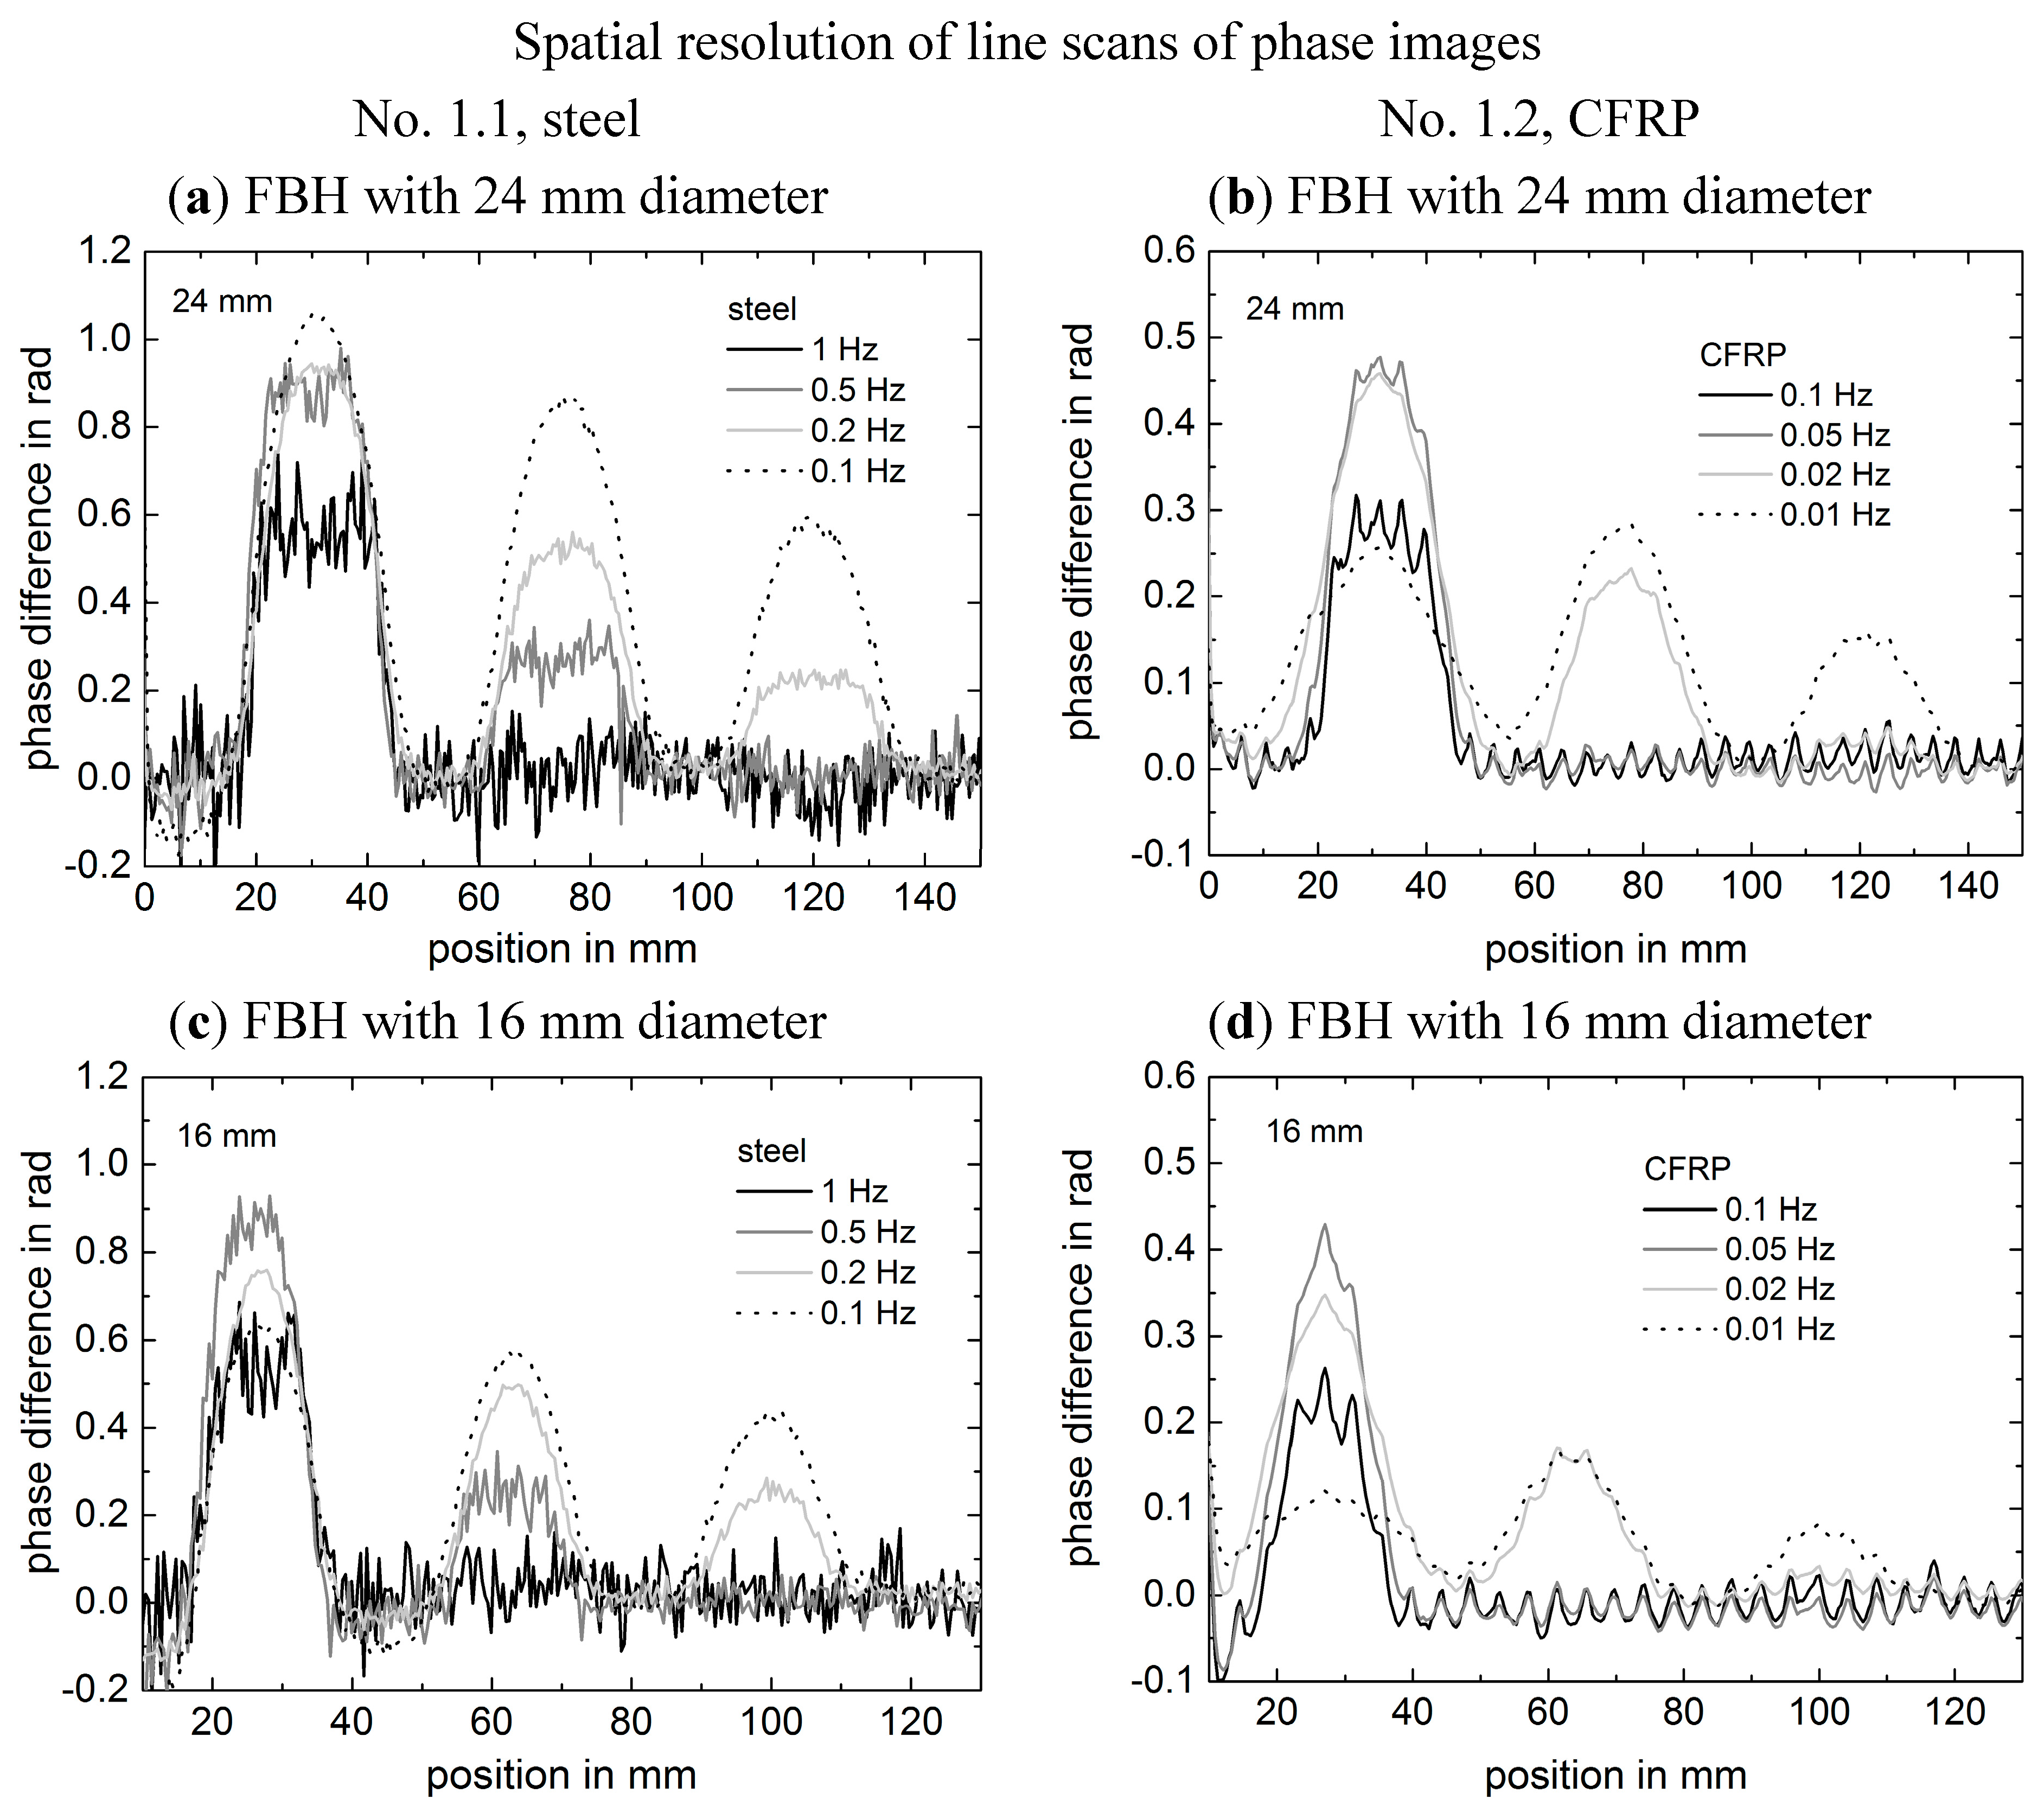
4.1.3. Analysis of Spatial Resolution
- Test specimen no. 1.1 (steel):
- ○
- Amplitude lines:
- ▪
- Due to the exponential decay of the amplitude differences with increasing RWT, only the shallowest hole is analyzed. The FWHM of the hole profiles show nearly no broadening with decreasing frequency for the 24 mm hole and a slight broadening for the 16 mm hole.
- ▪
- With decreasing frequency, a rounding of the more or less flat profile top of the shallowest hole for both diameters is observed.
- ○
- Phase lines:
- ▪
- Only a slight increase of the FWHM of the hole profiles occurs with decreasing frequency and with increasing RWT. This effect is slightly larger for the holes with a diameter of 16 mm.
- ▪
- Down to a frequency of 0.2 Hz, a plateau along the profile top above the FBHs is recognizable. These plateaus are most pronounced when the thermal diffusion length is smaller or equal to the RWT of the FBH.
- ○
- Comparison of amplitude and phase lines:
- ▪
- There is a clear difference in the background signal of the lines, which is larger and inhomogeneous in the amplitude line and is caused by the inhomogeneous heating.
- ▪
- For the detectable holes, there is no significant difference in the width of the profiles for the amplitudes and phases.
- Test specimen no. 1.2 (CFRP):
- ○
- Amplitude lines:
- ▪
- As for the amplitude lines of the steel sample, only the shallowest holes are analyzed. For both diameters, a slight increase of the peak width is observed with decreasing frequency. The width is also slightly larger than for holes with the same diameters in the steel sample.
- ○
- Phase lines:
- ▪
- First of all, for the higher frequencies (0.1 and 0.05 Hz), the structure of the fiber bundles is resolved.
- ▪
- Compared to the steel specimen, the FWHM of the FBHs is increased, which again more is pronounced for the FBHs with a diameter of 16 mm.
- ▪
- Only for the highest frequency of 0.1 Hz, a slight plateau can be observed in the profile of the shallowest FBH with a diameter of 24 mm.
- ○
- Comparison of amplitude and phase lines:
- ▪
- Only the amplitude lines show an inhomogeneous background.
- ▪
- The fiber bundles are only resolved in the phase images for the two higher excitation frequencies.
- ▪
- For the two lower frequencies, the phase profiles are significantly broader than the amplitude profiles.
4.2. Test Specimens with Crossed Notches
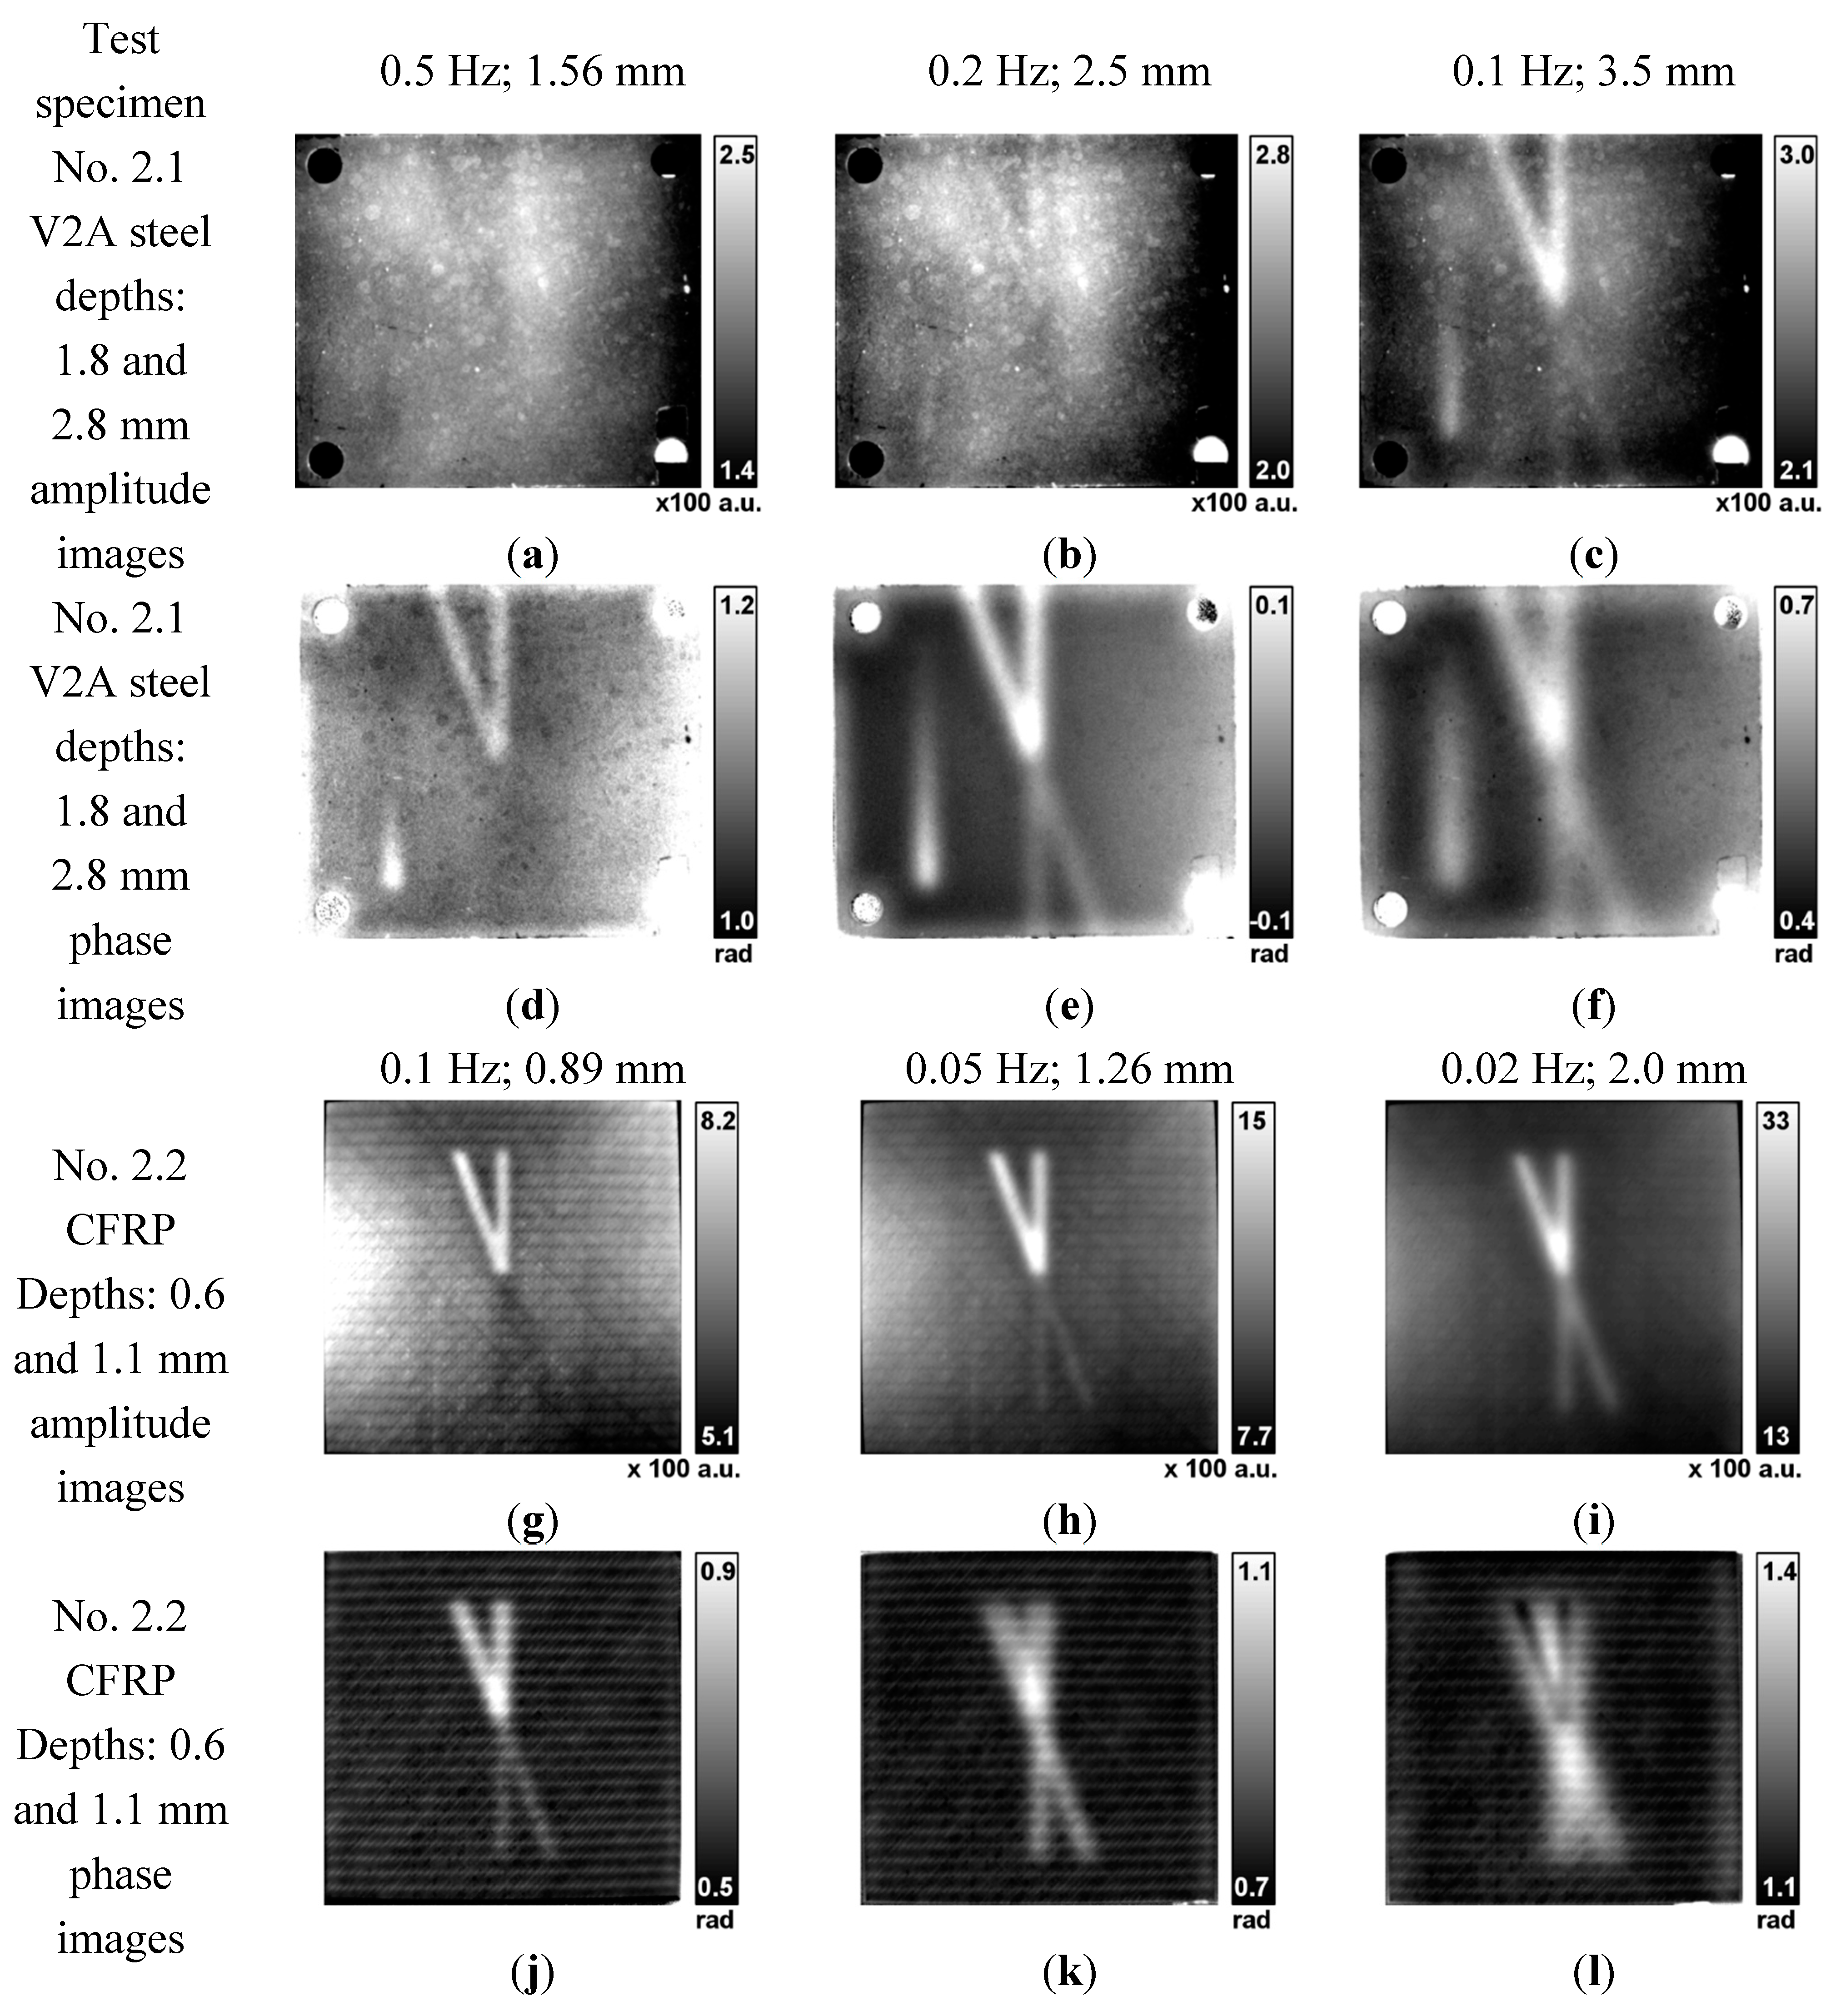
4.2.1. Comparison of Amplitude and Phase Images of the Steel Sample no. 2.1

- Amplitude images:
- ○
- Only at the lowest excitation frequency of 0.1 Hz with a diffusion length of 3.5 mm, the shallow notch (RWT 1.8 mm) is detected clearly. At higher frequencies, only a very weak structure with amplitudes lower (0.5 Hz) and higher (0.2 Hz) than the background is visible. The deep notches (RWT 2.8 mm) are only detected with a very weak amplitude at the lowest frequency of 0.1 Hz.
- Phase images:
- ○
- At high frequencies, first the shallow notches are visible, while the deeper notches become clearer at lower frequencies. This is caused by the thermal diffusion lengths, which increase with decreasing frequency.
- Comparison of amplitude and phase images:
- ○
- In the amplitude images, the notches become apparent at frequencies belonging to a diffusion length that is considerably larger than the RWT. In the phase images, the notches appear already at a diffusion length smaller than the RWT.
- ○
- A comparison of the images at 0.1 Hz shows a higher lateral spatial resolution of the crossed notches in the amplitude image. A similar or even better resolution in the phase images is only obtained, if these have been recorded at higher frequencies (0.5 Hz).
4.2.2. Comparison of Amplitude and Phase Images of the CFRP Samples No. 2.2
- Amplitude images:
- ○
- Already at the highest excitation frequency all notches are detected, albeit with different signs of the contrast: the shallow notches are appearing with a larger, the deeper notches with a slightly smaller amplitude than the background. With decreasing frequency, all notches appear with higher amplitude than the background.
- ○
- The structures only appear slightly blurred at lower frequencies and larger RWT.
- ○
- The diffusion lengths corresponding to the excitation frequencies at which the notches become visible more or less coincide with the RWT.
- Phase images:
- ○
- The deeper notches are already detected at a diffusion length that is smaller than the RWT.
- ○
- At the lowest frequency, the shallow notches show a phase contrast inversion.
- ○
- With decreasing frequency, a considerable blurring of the signature of the notches is observable.
- Comparison of amplitude and phase images:
- ○
- In the amplitude images, the notches become observable at frequencies that belong to diffusion length coinciding with the RWT. In the phase images, the notches already appear at diffusion lengths smaller than the RWT.
- ○
- The comparison of all images shows a higher lateral spatial resolution of the crossed notches in the amplitude images.
5. Discussion
5.1. Detectability of Defects
5.2. SNR of Defects
- by the curve shapes in Figure 1 for the deeper and larger FBH,
- by the less number of periods recorded for the CFRP test specimens, and
- by the higher lateral diffusivity compared to the diffusivity in depth direction in CFRP.
5.3. Spatial Resolution
- Since the thermal diffusion length µ is increasing with decreasing frequency, the lateral thermal diffusion length is increasing as well, leading to a lateral broadening of the signal.
- Due to the higher information depth in phase images than in amplitude images, the lateral information length is larger as well. Therefore, phase images have a smaller lateral resolution than amplitude images at a given excitation frequency.
- Since the thermal diffusivity in CFRP is larger laterally than in the depth direction, the lateral thermal diffusion length is also larger than the (perpendicular) diffusion length and the magnitude of these effects is enhanced.
6. Summary and Conclusions
- In both amplitude and phase images, the signatures of defects become broader with decreasing frequency. This effect is much larger for the phase images. Therefore, the lateral spatial resolution is always better for the amplitude images and increases with the excitation frequency.
- This effect is stronger for materials with anisotropic thermal diffusivity, if the diffusivity is higher in the plane parallel to the surface than perpendicular to it, like in CFRP.
- The SNR in the phase images decreases with decreasing diameter of the defects for similar RWT and excitation frequency.
- The limit of RWT of the detected holes is less than twice as large for the phase images as for the amplitude images.
- The inhomogeneous temperature distribution due to inhomogeneous heating and faster cooling at the corners lead to a reduced detectability and SNR in the colder regions compared to the center region.
- Decreasing SNRs in the phase images for FBHs with larger diameter at lower excitation frequencies are related to the blind frequency.
Acknowledgments
Author Contributions
Conflicts of Interest
References
- Maierhofer, C.; Myrach, P.; Röllig, M.; Steinfurth, H. Validation of active thermography techniques for the characterization of CFRP structures. In Proceedings of the 11th European Conference on Non-Destructive Testing (ECNDT), Prague, Czech Republic, 6–10 October 2014.
- Montanini, R. Quantitative determination of subsurface defects in a reference specimen made of Plexiglas by means of lock-in and pulse phase infrared thermography. Infrared Phys. Technol. 2010, 53, 363–371. [Google Scholar] [CrossRef]
- Chatterjee, K.; Tuli, S.; Pickering, S.G.; Almond, D.P. Matched excitation energy comparison of the pulse and lock-in thermography NDE techniques. NDT E Int. 2011, 44, 655–667. [Google Scholar] [CrossRef] [Green Version]
- Röllig, M.; Steinfurth, H.; Ziegler, M. Untersuchung von Hochleistungs-LEDs für den Einsatz in der zerstörungsfreien Prüfung mittels Thermografie. In Proceedings of the 2013 Thermografie-Kolloquium, Stuttgart, Germany, 26–27 September 2013.
- Vavilov, V.P.; Almond, D.P.; Busse, G.; Grinzato, E.; Krapez, J.-C.; Maldague, X.; Marinetti, S.; Peng, W.; Shirayev, V.; Wu, D. Infrared thermographic detection and characterisation of impact damage in carbon fiber composites: Results of the round robin test. In Proceedings of the 1998 QIRT, Lodz, Poland, 7–10 September 1998.
- Almond, D.P.; Ball, R.J.; Dillenz, A.; Busse, G.; Krapez, J.-C.; Galmiche, F.; Maldague, X. Round Robin comparison II of the capabilities of various thermographic techniques in the detection of defects in carbon fibre composites. In Proceedings of the 2000 QIRT, Reims, France, 18–21 July 2000.
- Ibarra-Castanedo, C.; Piau, J.-M.; Guilbert, S.; Avdelidis, N.P.; Genest, M.; Bendada, A.; Maldague, X.P.V. Comparative study of active thermography techniques for the non-destructive evaluation of honeycomb structures. Res. Nondestr. Eval. 2009, 20, 1–31. [Google Scholar] [CrossRef]
- Dillenz, A.; Wu, D.; Breitrück, K.; Busse, G. Lock-in thermography for depth resolved defect characterisation. In Proceedings of the 2000 WCNDT, Rome, Italy, 15–21 October 2000.
- Giorleo, G.; Meola, C.; Squillace, A. Analysis of Defective Carbon-Epoxy by Means of Lock-in Thermography. Res. Nondestr. Eval. 2000, 12, 241–250. [Google Scholar] [CrossRef]
- Zoecke, C.; Langmeier, A.; Arnold, W. Size retrieval of defects in composite material with lockin thermography. J. Phys. Conf. Ser. 2010, 214, 012093. [Google Scholar] [CrossRef]
- Patel, P.M.; Almond, D.P. Thermal wave testing of plasma-sprayed coatings and a comparison of the effects of coating microstructure on the propagation of thermal and ultrasonic waves. J. Mater. Sci. 1985, 20, 955–966. [Google Scholar] [CrossRef]
- Wu, D.; Busse, G. Lock-in thermography for non-destructive evaluation of materials. Rev. Gen. Therm. 1998, 37, 693–703. [Google Scholar] [CrossRef]
- Spießberger, C.; Dillenz, A.; Zweschper, T. Active Thermography for quantitative NDT of CFRP components. In Proceedings of the 2nd International Symposium on 2010 NDT in Aerospace, Hamburg, Germany, 22–24 November 2010.
- Meola, C.; Calomagno, G.M.; Giorleo, L. Geometrical Limitations to Detection of Defects in Composites by Means of Infrared Thermography. J. Nondestr. Eval. 2004, 23, 125–132. [Google Scholar] [CrossRef]
- Wallbrink, C.; Wade, S.A.; Jones, R. The effect of size on the quantitative estimation of defect depth in steel structures using lock-in thermography. J. Appl. Phys. 2007, 101, 104907. [Google Scholar] [CrossRef]
- Junyan, L.; Yang, L.; Fei, W.; Yang, W. Study on Probability of Detection (POD) determination using lock-in thermography for nondestructive inspection (NDI) of CFRP composite materials. Infrared Phys. Technol. 2015, 71, 448–456. [Google Scholar] [CrossRef]
- Horowitz, P.; Hill, W. The Art of Electronics; Cambridge University Press: Cambridge, UK, 1984; p. 716. [Google Scholar]
- Wu, D.; Wu, C.Y.; Busse, G. Investigation of resolution in lock-in thermography: Theory and experiment. In Quantitative Infrared Thermography, QIRT 1996; Busse, G., Balageas, D., Carlomagno, G.M., Eds.; Edizioni ETS: Pisa, Italy, 1997; pp. 269–274. [Google Scholar]
- Deutsches Institut für Normung e. V. 2006. EN 15042-2:2006. Thickness Measurement of Coatings and Characterization of Surfaces with Surface Waves—Part 2: Guide to the Thickness Measurement of Coatings by Photothermic Method, Beuth Verlag: Berlin, Germany, 2006.
- Deutsches Institut für Normung e. V. 2014. prEN 16714-1:2014. Non-Destructive Testing—Thermographic Testing—Part 1: General Principles; prEN 16714-2:2014; Non-Destructive Testing—Thermographic Testing—Part 2: Equipment; prEN 16714-3:2014; Non-Destructive Testing—Thermographic Testing—Part 3: Terms and Definitions, Beuth Verlag: Berlin, Germany, 2014.
- Deutsches Institut für Normung e. V. 2010. DIN 54192:2010. Non-Destructive Testing—Active Thermography, Beuth Verlag: Berlin, Germany, 2010.
- Carslaw, H.S.; Jaeger, J.C. Conduction of Heat in Solids; Oxford University Press: Oxford, UK, 1959. [Google Scholar]
- Almond, D.P.; Patel, P.M. Photothermal Scince and Techniques; Chapmann and Hall: London, UK, 1996. [Google Scholar]
- Bennet, C.A.; Patty, R.R. Thermal wave interferometry: A potential application of the photoacoustic effect. Appl. Opt. 1982, 21, 49–54. [Google Scholar] [CrossRef] [PubMed]
- Patel, P.M.; Almond, D.P.; Reiter, H. Thermal-wave detection and characterisation of sub-surface defects. Appl. Phys. B 1987, 43, 9–15. [Google Scholar] [CrossRef]
- Chatterjee, K.; Tuli, S. Prediction of blind frequency in lock-in thermography using electro-thermal model based numerical simulation. J. Appl. Phys. 2013, 114, 174905. [Google Scholar] [CrossRef]
- Parker, W.J.; Jenkins, R.J.; Butler, C.P.; Abbott, G.L. Flash method of determining thermal diffusivity, heat capacity and thermal conductivity. J. Appl. Phys. 1961, 32, 1679–1684. [Google Scholar] [CrossRef]
- Maierhofer, C.; Myrach, P.; Reischel, M.; Steinfurth, H.; Röllig, M.; Kunert, M. Characterizing damage in CFRP structures using flash thermography in reflection and transmission configurations. Compos. Eng. 2014, 57, 35–46. [Google Scholar] [CrossRef]
© 2015 by the authors; licensee MDPI, Basel, Switzerland. This article is an open access article distributed under the terms and conditions of the Creative Commons Attribution license (http://creativecommons.org/licenses/by/4.0/).
Share and Cite
Maierhofer, C.; Myrach, P.; Krankenhagen, R.; Röllig, M.; Steinfurth, H. Detection and Characterization of Defects in Isotropic and Anisotropic Structures Using Lockin Thermography. J. Imaging 2015, 1, 220-248. https://doi.org/10.3390/jimaging1010220
Maierhofer C, Myrach P, Krankenhagen R, Röllig M, Steinfurth H. Detection and Characterization of Defects in Isotropic and Anisotropic Structures Using Lockin Thermography. Journal of Imaging. 2015; 1(1):220-248. https://doi.org/10.3390/jimaging1010220
Chicago/Turabian StyleMaierhofer, Christiane, Philipp Myrach, Rainer Krankenhagen, Mathias Röllig, and Henrik Steinfurth. 2015. "Detection and Characterization of Defects in Isotropic and Anisotropic Structures Using Lockin Thermography" Journal of Imaging 1, no. 1: 220-248. https://doi.org/10.3390/jimaging1010220